Article

Indirect Health Effects of COVID-19: Unhealthy Lifestyle Behaviors during the Lockdown in the United Arab Emirates

1
Department of Clinical Nutrition and Dietetics, Research Institute of Medical & Health Sciences (RIMHS), College of Health Sciences, University of Sharjah, Sharjah 27272, United Arab Emirates
2
Health Promotion Department, Supreme Council for Family Affairs, Sharjah 27272, United Arab Emirates
3
Clinical Nutrition Department, Al Qassimi Hospital-Ministry of Health and Prevention, Sharjah 27272, United Arab Emirates
4
Department of Nutrition and Food Sciences, American University of Beirut, Beirut 1107, Lebanon
*
Author to whom correspondence should be addressed.
Int. J. Environ. Res. Public Health 2021, 18(4), 1964; https://doi.org/10.3390/ijerph18041964
Submission received: 16 January 2021 / Revised: 1 February 2021 / Accepted: 11 February 2021 / Published: 18 February 2021
(This article belongs to the Section Global Health)

Abstract

:
Background: Lockdown measures were implemented in many countries to limit the spread of the COVID-19 pandemic. However, such restrictions could precipitate unintended negative consequences on lifestyle behaviors. The main objective of this study was to investigate the prevalence and determinants of unhealthy behavior changes during the COVID-19 lockdown among residents of the United Arab Emirates (UAE). Methods: A cross-sectional web-based survey of adults residing in the UAE was carried out during lockdown (n = 2060). Using a multi-component questionnaire, the collected data included questions regarding the following lifestyle changes: Increased dietary intake, increased weight, decreased physical activity, decreased sleep, and increased smoking. An unhealthy lifestyle change score was calculated based on the number of unhealthy lifestyle changes each participant reported. In addition, sociodemographic and living conditions information was collected. Descriptive statistics as well as simple and multiple linear regression analyses were used to examine the prevalence and determinants of the unhealthy lifestyle changes considered in this study. Results: Among the unhealthy lifestyle changes examined, increased food intake was the most common (31.8%), followed by decreased physical activity (30%), increased weight (29.4%), decreased sleep (20.8%), and increased smoking (21%). In addition to identifying the correlates of each of the aforementioned lifestyle changes, the results of the multiple regression linear analyses revealed the following correlates for the overall unhealthy lifestyle change score: females (β = 0.32, CI: 0.22; 0.42), living in an apartment (β = 0.12, CI: 0.003; 0.23) and being overweight/obese (β = 0.24, CI: 0.15; 0.32) had higher scores, while older adults (>40 years) had lower scores (β = −0.23, CI: −0.34; −0.12). Conclusions: The COVID-19 lockdown has resulted in a high prevalence of unhealthy lifestyle behaviors and practices among UAE residents. The findings of this study provided the evidence base for officials to design interventions targeting high-risk groups and aiming to improve healthy lifestyle factors among residents during the pandemic.

1. Introduction

Late in 2019, a new coronavirus called severe acute respiratory syndrome coronavirus 2 (SARS-CoV-2) or coronavirus disease (COVID-19) emerged.It is a highly contagious viral disease, which appeared first in Wuhan, China [1], and then rapidly spread within China and worldwide. This leads the World Health Organization (WHO) on 11 March 2020, to acknowledge COVID-19 as a global pandemic [2]. As of 26 June 2020, there are close to 10 million confirmed cases in 215 countries [3] and the first detected case in the United Arab Emirates (UAE) was on 19 January 2020 [4] with 46,973 confirmed cases as of 26 June 2020 [5].
So far there is no radical treatment for the COVID-19 infection, and the only way to battle this pandemic is by increasing awareness and prevention through the implementation of isolation measures and enhancement of the function of the immune system [6,7]. To combat the COVID-19, many countries have applied preventive measures such as disinfection procedures and partial or complete lockdown to slow the spread of the virus. UAE health authorities are implementing extensive preventative measures to protect public health in line with the World Health Organization’s rules and regulations. On 22 March 2020, the UAE authorities applied both strict infection control and partial lockdown [8], which forced many people to stay at home (study and work from home). Nevertheless, such action may exert a sudden and drastic change in the lifestyle of the population. The lockdown has been postulated to influence lifestyle habits by increasing staying home, excessively storing food, disruption of one’s routine and heightened anxiety hearing the evolving news of the virus and its spread [9]. Such a situation may lead to a change in dietary habits, physical activity, and sleep patterns, in addition to psychological impact [9,10,11,12].
In fact, this new situation may limit access of individuals to daily shopping and affect their choices for a healthy balanced diet with subsequent dependence on highly processed, ready-to-eat cereals and junk foods, which are high in salt, sugar, and fats. Such dietary habits will increase the risk factors of chronic diseases like obesity, heart disease, stroke, type 2 diabetes, some cancers, and chronic kidney disease [13]. Moreover, restricted movement due to lockdown may force many people to stay home and to limit their physical activities [10] and results in more sedentary behavior, which is associated with an increased risk of chronic disease [14]. Noteworthy is the fact that gyms and recreational areas were also included in the lockdown closures and hence were not available for individuals to exercise and carry out leisure physical activity. Furthermore, it has been reported that the lockdown measures could be associated with distressing experience and boredom because the situation is taking the world into uncharted waters. Such circumstances could be triggered by a loss of usual routine and reduced social and physical contact with others [15]. Studies have shown that sleep is crucial for emotional and mental wellbeing and helps to confront stress and anxiety [11]. However, sleep patterns of individuals during pandemic containment could be disturbed.
In the UAE, reports prior to the COVID-19 pandemic, raised alarming concerns regarding a high prevalence of lifestyle related diseases and their risk factor in the country. For instance, 77% of all deaths in the UAE was attributed to cardiovascular disease (CVD), cancer, diabetes, and chronic respiratory disease and the probability of dying prematurely from one of these diseases was estimated at 17% [16]. Among the most common risk factors for these diseases in the UAE were high body mass index, high systolic blood pressure, high fasting plasma glucose, and high total cholesterol [17]. Therefore, it became critical to examine the effect of lockdown on lifestyle habits to develop evidence-based preventions programs aiming to alleviate the heavy burden of unhealthy lifestyle and its consequences on the health of the population in the UAE. Hence, the main objective of this study was to investigate the prevalence and determinants of unhealthy behavior changes during the COVID-19 lockdown among UAE residents, including dietary intake, weight status, physical activity, sleep, and smoking. A secondary objective was to examine the perceptions of healthy practices as well as mental health during the COVID-19 lockdown among study participants.

2. Materials and Methods

2.1. Study Design and Participants

A cross-sectional web-based online survey was carried out between the 5–18 May 2020 to investigate the health and dietary practices of adults residing in the UAE during the COVID-19 lockdown in the country. The questionnaire link was distributed to 13,500 adults via emails and mobile messages. The list of email addresses and phone numbers was obtained from the database of the Supreme Council for Family Affairs, Health promotion Department, Sharjah and their network in the various Emirates of the UAE. Adults, males and females, aged 18 years and older and residing in the UAE were eligible to complete the questionnaire. Participants ought to be conversant in English or Arabic language. The online survey consisted of a link to an internet-based questionnaire on Google forms with closed-ended questions in English and Arabic. Before starting filling out the online survey, participants were presented with an information form which described the purpose of the study, procedure, time needed to complete the questionnaire as well as the voluntary nature of participation. The informed consent was obtained electronically. It was written in simple and understandable terms on the first page of the questionnaire. Before enrollment, the participant should click ‘Agree’ on the consent form, then he/she can proceed to completing the questionnaire. Otherwise, if the subject did not agree on the consent form, he/she will not be able to proceed and will automatically exit the online link. Ethical approval was obtained from the Research and Ethics Committee at the University of Sharjah (REC-20-05-05-01). The anonymity of the participants was guaranteed during the data collection process.

2.2. Questionnaire Used in Data Collection

In order to compile the list of questions to be included in the survey, a triangulated approach was used. First, a thorough review of the literature was conducted in order to identify the main themes that are important in the context of a lockdown. Second, a group of experts, including a nutritionist, a public health worker, and a community activist deliberated on the context specificity of the themes and formulated the questions to be included within each theme. The experts reviewed the questionnaire to ensure its content as well as the face validity. Lastly, the developed questionnaire (originally written in English) was translated into Arabic and then back-translated into English. An expert who is bilingual and whose native language is Arabic translated into and from Arabic. It was then back-translated into English by a bilingual expert panel whose native language is English. Both versions of the questionnaire were pilot-tested for clarity and simplicity and logical flow of the questions. The pilot testing of the questionnaire was undertaken with a convenient sample of adults including UAE nationals as well as adults from other nationalities residing in the UAE. Some questions were removed because of redundancy and some were reworded for clarity.
The final version of the questionnaire consisted of 30 questions grouped into four main sections: (1) Sociodemographic characteristics, (2) Dietary habits, (3) Lifestyle practices, and (4) Healthy practices during the COVID-19. The first part included questions related to the socio-demographic profile of the participants (age, gender, marital status, educational level, region, type of residence, no of children, etc.) and the weight (kg) and height (cm) of the participants. Both weight and height were self-reported by the participants. The body mass index (BMI) was calculated by dividing the weight (in kg) by the height (in m2). Participants were then classified into four categories, underweight (<18.5 kg/m2), normal (18.5–24.9 kg/m2), overweight (25.0–29.9 kg/m2), and obese (≥30.0 kg/m2) (WHO, 2004). The second part of the questionnaire included questions related to dietary habits. The focus was on the quantity and quality of the diet, such as the amount of food consumed during lockdown (decrease, same or increased), the type of foods that were mostly consumed during the lockdown, and which foods’ intake increased during the lockdown. The section addressing the lifestyle included questions related to weight changes (decreased, same, increased), physical activity (decreased, same, increased); smoking (decreased, same, increased) and the number of hours of sleep per day (decreased, same, increased). With regards to the healthy practices during COVID-19, participants were asked if they wore masks and gloves when going out, the frequency of grocery shopping, and if they disinfected and sterilized the food items purchased. The questionnaire required approximately 10 min to complete. The questionnaire was included in this manuscript as Supplementary Materials.

2.3. Statistical Analysis

Data analysis was conducted using IBM SPSS (IBM Corp. Released 2017. IBM SPSS Statistics for Windows, Version 25.0. Armonk, NY: IBM Corp.). Descriptive statistics were presented as frequency and percentage. The main outcomes were unhealthy dietary and lifestyle changes described as decreased physical activity (vs. same or increased), decreased sleep (vs. same or increased), increased smoking (vs. same or increased and non-smokers), increased weight (vs. same or decreased) and increased food intake (vs. same or decreased). An unhealthy dietary and lifestyle changes score was generated whereby participants will receive 0 to 5 points based on the number of unhealthy dietary and lifestyle changes they presented. Each main outcome counted as 1 point towards the overall score. The total score was additive, with each outcome having equal weight to the score. As such, a higher score indicated a higher adoption of unhealthy lifestyle during the lockdown. Simple and multiple logistic regressions were conducted to describe the associations between each of the aforementioned outcomes (decreased physical activity, decreased sleep, increased smoking, increased weight and increased food intake), and sociodemographic characteristics of the study population. Simple and multiple linear regression analysis were used for the association between the unhealthy dietary and lifestyle changes score and sociodemographic characteristics. In the adjusted models, variables with a significant p-value (<0.05) at the univariate level were entered in the model. Results of the logistic and linear regression models were expressed, respectively, as Odds Ratios (OR) and β coefficient with 95% Confidence Intervals (CI). p-values less than 0.05 were considered statistically significant.

3. Results

Out of 13,500 sent links, 2135 responses were received. Of those, 2060 were returned with complete answers, resulting in a response rate of 15.8%. Table 1 described the sociodemographic characteristics of the study population. Three-quarters (75.1%) were females, 31.7% were between 18 and 30 years old, 38.4% were between 31 and 40 years old, and 29.9% were older than 40 years. Over half of the study population (63.8%) were married and the majority had a university degree (76%). One in two participants was an Emirati (50.7%), the rest of the sample was distributed as follows: Arabs (33.4%), Asians (12.4%), Western (2.4%), and other nationalities (1.1%). The most commonplace of residence was Sharjah (68%) followed by Dubai (11.8%), Ajman (8.8%), Abu Dhabi (5.8%), Ras Al Khaima (RAK) (2.6%), Umm Al Quwain (UAQ) (1.6%) and Fujairah (1.4%). The distribution of the study sample across the various emirates was illustrated on the map of the UAE in Appendix A. Almost two-thirds (60.7%) reported living in a house with a garden or yard. One in four (25.5%) were not working at the time of completing the questionnaire and 54.8% were working from home. Among the study participants, 38.4% had no children, 30% had one or two children and 31.7% had three or more. In terms of BMI status, 64.7% of the study population were either overweight or obese (≥BMI of 25 kg/m2) (Table 1).
The description of the lifestyle behaviors as well as the overall unhealthy lifestyle score is presented in Table 2. For all the lifestyle characteristics considered, almost 50% of the study population did not change behavior (physical activity (53.5%); food intake (51.5%), weight status (47.5%), smoking (40%), and sleep (53.9%)). As for the overall unhealthy lifestyle score, 30% of participants had a score of 0, indicating no unhealthy change in any of the behaviors. 62.1% had 1 or 2 unhealthy behaviors and 9% had 3 or more unhealthy behaviors.
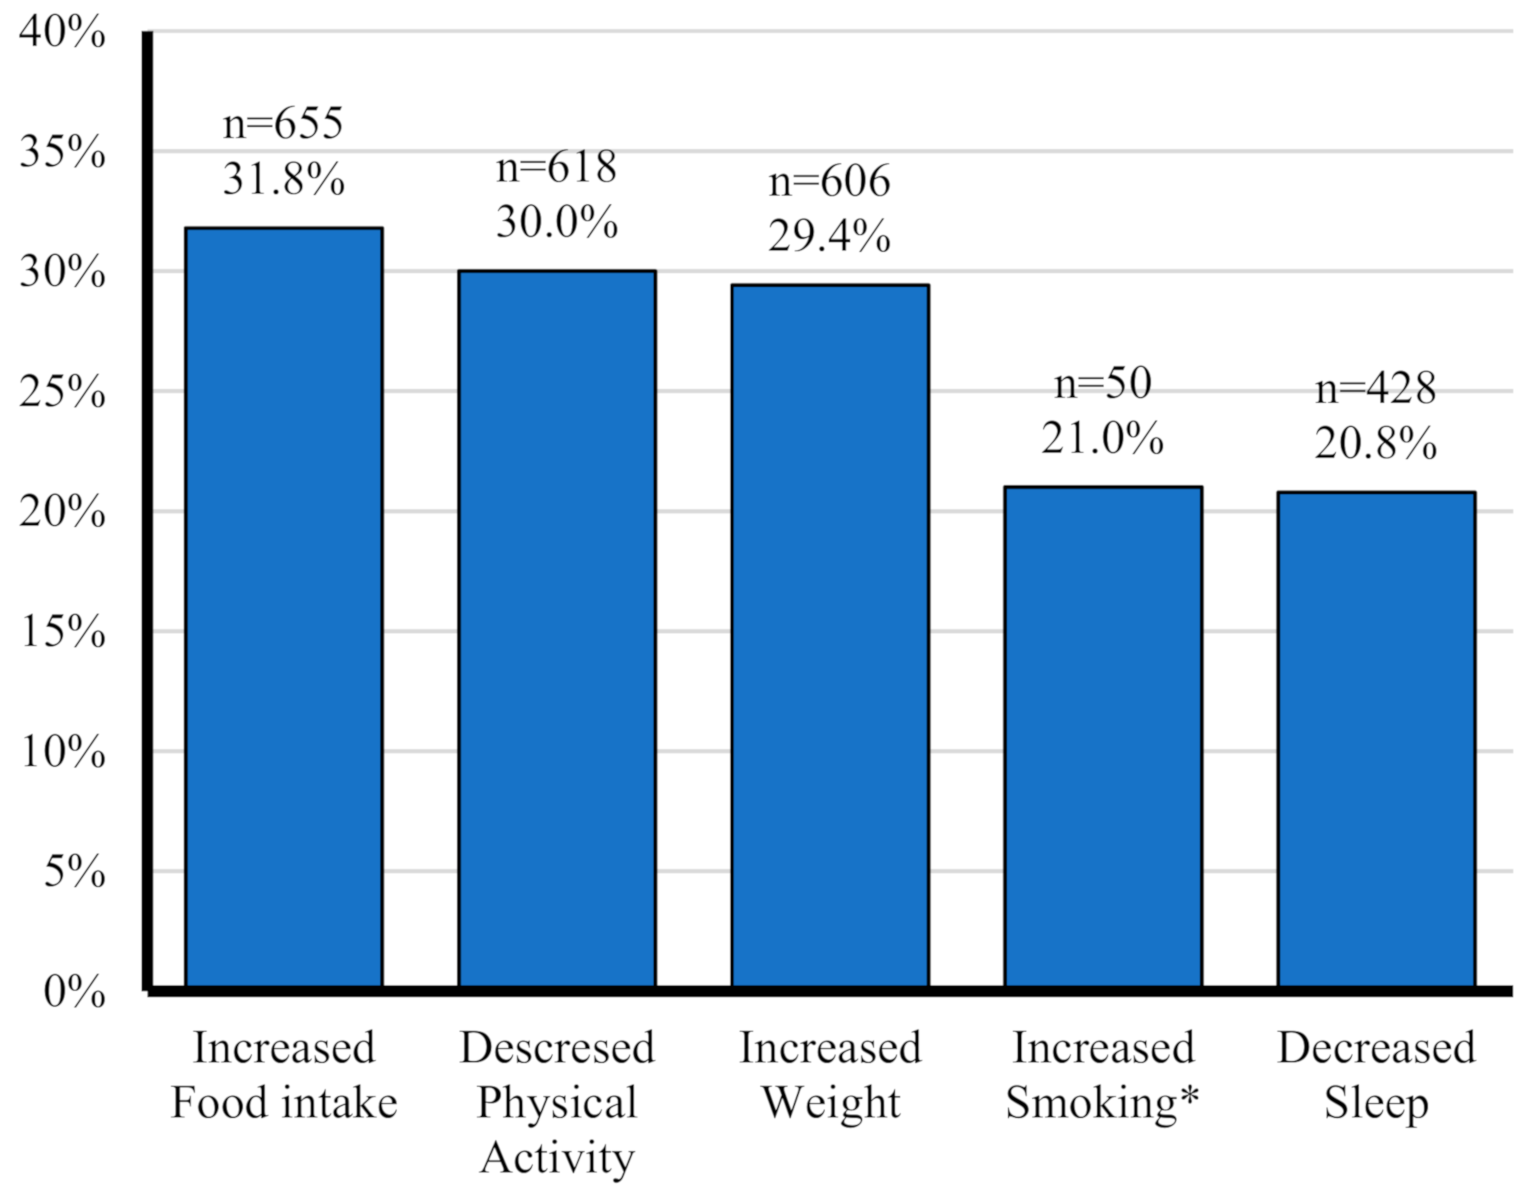
The prevalence of each of the five unhealthy behaviors considered in this study is illustrated in Figure 1. Increased food intake was the most common, reported by 31.8%, followed by decreased physical activity (30%), and increased weight (29.4%). Decreased sleep and increased smoking were reported by 20.8% and 21%, respectively.
The associations of each of these unhealthy lifestyle changes with sociodemographic characteristic, as examined by simple and multiple logistic regression are summarized in Appendix B. Regarding increased food intakes, female sex, being Non-Emirati Arabic (vs. Emirati), having 1–2 children (vs. none), and being overweight or obese were risk factors for increased food intake (females: OR: 1.87, CI: 1.47–2.39; being an Arab: OR: 1.35, CI: 1.02–1.79; having 1–2 children: OR: 1.33, CI: 1.05–1.68; Being overweight or obese: OR: 1.47, CI: 1.19–1.82). On the other hand, being older than 40 years (vs. 18–30 years old) was associated with a lower odd of increasing food intake (OR: 0.57, CI: 0.43–0.86). As for increased weight, the following characteristics were associated with higher odds: females (OR: 1.89, CI: 1.47–2.41), Non-Emirati Arabic (OR: 1.62, CI: 1.22–2.17), Western (OR: 2.06, CI: 1.08–3.93), Asian nationalities (OR: 1.70, CI: 1.15–2.50), living in an apartment or house with no garden or yard (OR: 1.51, CI: 1.15–1.98), and being overweight or obese (OR: 2.25, CI: 1.79–2.83). Decreased physical activity was significantly associated with age, nationality, working from home and BMI: older adults aged more than 40 years (O: 1.61, CI: 1.25–2.08), working from home (OR: 0.7, CI: 0.55–0.89) and overweight or obese (adj OR: 1.38, CI: 1.13–1.72). As for increased smoking behavior, females and older adults (>40 years old vs. 18–30 years old) were less likely to increase their smoking behavior during the lockdown (for females ORs 0.27, CI 0.15–0.49; for older adults: OR: 0.25, CI: 0.11–0.57). In terms of sleeping behavior, females were more likely to experience decreased sleep compared to males, whereas older adults (>40 years old vs. 18–30 years old) were less likely to experience decreased sleep during the lockdown. (Appendix A).
The association of the unhealthy lifestyle and dietary behaviors score with sociodemographic variables are shown in Table 3. The results of the multiple regression analyses showed that females were more likely to have a higher score (Coef. 0.32, CI: 0.22; 0.42) as well as those living in an apartment or a house with no garden or yard (vs. in a house with a garden or yard) (Coef. 0.12, CI: 0.003; 0.23) and those whose BMI ≥ 25 kg/m2 (Coef. 0.24, CI: 0.15; 0.32). On the other hand, older adults (>40 years old) were more likely to have a lower score compared to 18 to 30 years old adults (Coef. −0.23, CI: −0.34; −0.12). (Table 3). The reference categories which were used for the various sociodemographic variables in these analyses are indicated in Table 3.
Perception, health, and dietary practices and perceived mental health status related to COVID-19 among the study population were described in Table 4. When asked about their agreement on “Quarantine is a good way to protect my family and to stop the spread of infectious disease outbreaks”, 98.4% of the participants agreed. When going out, 83% reported using both gloves and masks, 14.7% used masks only, 1.3% gloves only, and 1.1% haven’t used any. With regards to dietary practices, a vast majority (90.8%) reported home-cooked food as one of the most consumed food items during the COVID-19 pandemic. The next most reported items were fruits and vegetables (60.2%, each), herbal tea (37%), nuts (34.3%), and sweets (32.6%). As for the type of food the participants consumed more during the COVID-19 pandemic, 84.4% chose cooked food while 21.3% chose salty snacks, 7.1% sweet sacks and only 5.7% chose nothing. The proportion of going grocery shopping increased by 4% of the study population, remained the same for 22.1, and decreased for 22.9% while 51% reported no definite number of times of going grocery shopping. Almost half (48%) of the participants reported ordering food or groceries for delivery and 79.4% sterilize food items when delivered. The most common ways reported to disinfect purchased fruits and vegetables were water only (43.8%), water and vinegar (21.9%) and water, vinegar, and salt (9.8%) whereas 1.8% reported not disinfecting purchased fruits and vegetables. The participants were asked if they felt angrier and stressed during lockdown, 41.8% reported that they felt angrier and 67.2% were more stressed during lockdown. When asked what they did to relieve stress, the majority reported they prayed (33%) or watched movies/listened to music/social media (27%) to relieve their stress. While the rest either ate more (10.5%), some exercised (10.2%), or meditated (10.1%) to relieve stress.

4. Discussion

The findings of this study showed that the most prevalent unhealthy change in behavior among participants was increased food intake (32%). The confinement to one’s home and the interruption of the work-related routine could lead to irregular eating patterns and frequent snacking, both of which are associated with increased food intake and consequently a more positive caloric balance [18]. Such an increase in food intake could also be driven by fear and anxiety. During the quarantine, continuously hearing or listening about the pandemic spread and its associated mortality can be stressful [19]. In fact, in this study more half of the participants reported anger and heightened levels of stress during the lockdown. For many people, the response to stress, distress, and emotional disturbance is not to avoid food but possibly to increase the consumption of energy-dense foods [20]. It has been proposed that this emotionally-induced eating comes as a result of interference of eating by emotions, a by-product of emotions, and a consequence of regulatory processes (i.e., emotions may regulate eating, and eating may regulate emotions) [21]. Of concern is the finding of this study that salty and sweet snacks (chips, crackers, cupcakes, cookies) were reported among the foods in which intake has increased most during lockdown. These foods are usually calorie-dense and also high in salt, sugar, saturated fats [22,23]. In addition, the higher consumption of these foods could displace more nutritious options in the diet such as fruits and vegetables. During the COVID-19 pandemic, optimal nutrition intake is paramount given its significant effects on the immune system. In fact, adequate dietary nutrient intakes are postulated to directly affect immunity through gene expression, cell activation, and signaling molecule modifications. In addition, many nutrients are implicated in the proper functioning of the gut microbiota and its composition and hence indirectly modulating the immune response [24]. Therefore, promoting the adoption and maintenance of a healthy and well-balanced diet seems to be a prerequisite for a strong and well-functioning immune system that could withstand the assault of infections, including that of the Coronavirus.
In this study, one in three participants reported lower physical activity levels during lockdown. This significant prevalence of lower physical activity was also reported by a cross-sectional survey among Lebanese adults, whereby 41% reported no physical activity or exercise during lockdown [25]. In fact, staying home for a prolonged period of time may lead to more prevalent sedentary behavior such as excessive sitting/reclining, increased screen time activities (video games, TV watching, use of mobile devices) [26]. The negative consequences of the decrease in physical activity observed during COVID-19 affect both the physical and mental health. On one hand, lower physical activity levels lead to lower energy expenditure, a higher risk of overweight, obesity, and hence worsening of chronic health conditions [27]. In addition, lower levels of exercise have been shown to lower the immune competency and regulation and increase the risk of developing systemic inflammation [28]. Furthermore, accumulating evidence indicated that regular physical activity is beneficial for mental health as it reduces anxiety, depression, and negative mood, and improves self-esteem and improves the overall quality of life [29]. These negative effects of lower physical activity on health, including a higher risk of chronic diseases, lower immunity, and compromised mental health, were in fact implicated in more severe symptoms and worse outcome for COVID-19 [27,30,31]. Therefore, it is recommended to continue to maintain a healthy level of physical activity in a safe home environment using simple and easily implementable exercises such as walking in the house, lifting and carrying objects such groceries, alternating leg lunges, climbing the stairs, stand-to-sit and sit-to-stand using a chair and from the floor, and sit-ups and pushups. In addition, recently there has been an abundance of eHealth and exercise videos, which focuses on encouraging and delivering physical activity through the Internet, mobile technologies, and television [32].
The third most common unhealthy lifestyle behavior among study participants, after the increase in food intake and decreased physical activity was ‘increased weight’. It is, in fact, conceivable that these three unhealthy behaviors are interconnected, whereby the higher intake of food coupled to lower levels of physical activity would lead to a positive energy balance, a weight gain, and higher risk of overweight and obesity. Increasing evidence indicated that obesity is strongly associated with severe symptoms and death from COVID-19 [33,34,35]. For instance, the risk for invasive mechanical ventilation in patients with COVID-19 infection admitted to the Intensive Treatment Unit increased by seven-fold for those with BMI > 35 compared with BMI < 25 kg/m2 [33]. In their review of the potential mechanisms by which obesity affects the disease outcome, Sattar et al., suggested that obesity and ectopic fat may lower the cardio-respiratory fitness, increase the cardiovascular susceptibility to immune driven vascular and thrombotic effects, impaired metabolic response, dysregulate the immune response and increase viral exposure, through more viral shedding and viral load in the breath [36]. The higher risk of overweight and obesity during COVID-19 observed in this study is rather alarming when considered in the context of the UAE. Recent population-wide data (before the pandemic) showed that over 65% of adults residing in the UAE were already either overweight or obese, with 57% having central obesity [37]. This high prevalence of obesity is accompanied by a heavy burden of Non-communicable diseases (NCDs) in the country, where the four main NCDs accounted for 77% of all deaths in UAE and 17% of premature deaths (30–70 years) in the year 2019 [17]. Therefore, public health intervention tackling the prevention and management of obesity in the country is needed, now more than ever, in order to not only prevent chronic diseases but also limit the adverse reactions to viral pandemics. Decreased sleep and increased smoking were also among the unhealthy lifestyle changes which were reported in this study. Similar to these findings, previous studies showed that, among individuals who were self-isolated during the COVID-19 outbreak, a worsening of sleep duration and quality was observed [38]. Furthermore, a survey of lifestyle habits conducted in Poland showed that over 45% of smokers experienced a rise in smoking frequency during the quarantine [39]. Both decreased sleep and increased smoking can potentially increase vulnerability to infection by the coronavirus and worsen the clinical symptoms of COVID-19. Sleep is an important modulator of the immune response, whereby shorter duration of sleep was associated with a weaker immunity and an increased susceptibility to infection [40]. Suggested mechanisms for this association included impaired mitogenic proliferation of lymphocytes, decreased HLA-DR expression, the upregulation of CD14+, and variations in CD4+ and CD8+ T lymphocytes [40]. As for smoking, a review of its association with immunity indicated significant impacts of smoking on both innate and adaptive immunity by either exacerbation of pathogenic immune responses or attenuation of defensive immunity [41].
The unhealthy lifestyle changes described in this study call for evidence-based interventions to limit the undesirable effect of lockdown on the health of adults in the UAE, especially among population groups that exhibit a higher likelihood to adopt these unhealthy changes. To that effect, the findings of this study showed that females compared to males were more likely to report increased dietary intake, increased weight, lower physical activity, and decreased sleep. The vulnerability of women to such changes in their lifestyle could be explained by the fact that women, in general, are more susceptible to emotional exhaustion, stress, and their negative health implications [42]. In this study, participants living in an apartment with no yard or garden were more likely to report all of the unhealthy lifestyle changes, except for decreased sleep. This finding underscores the role of built environment in affecting the lifestyle of individuals. A growing body of evidence supports built environment as a health promoter of individuals and communities by influencing risk factors, such as dietary choice and physical activity [43]. In addition to gender and living conditions, weight status was shown to affect the odds of adopting unhealthy behaviors, whereby in this study, having a BMI ≥ 25 kg/m2 were more likely to report higher dietary intake, increase in weight, lower physical activity and increased smoking. It has been suggested that during quarantine, patients suffering from obesity may experience higher levels of stress which in turn makes them more vulnerable to over-eating and sedentary lifestyle, thus predisposing them to further weight gain [20]. These findings suggest that obese subjects must be carefully informed about the risk of an unhealthy lifestyle during the quarantine due to the increasing risk of disease associated with obesity. In addition, it is important for overweight and obese subjects to carefully monitor their health and to receive strong psychological support to reduce their stress and anxiety levels.
In this study, among the factors that were associated with lower odds of adopting unhealthy lifestyle changes was older age (>40 years). While older adults were at a higher risk of complications and severity of the coronavirus infection [44,45,46], it appeared that younger individuals seemed to be more vulnerable to the effect of confinement and exhibited an overall higher frequency of unhealthy changes in their lifestyles. It is possible that younger adults are less prepared to cope with the lockdown and its consequences as well as stress, anxiety, and fear.
The findings of this study ought to be considered in view of a few limitations. First, the online nature of the survey limits the ability to objectively verify the data. As such all the changes in the lifestyle are based on self-reports and could have been subject to self-selection and reporting bias. Of concern, is the self-reported nature of weight, height and consequently BMI. It has been suggested that anthropometric measures are subject to systematic reporting biases causing discrepancies between self-reported and measured height and weight [47]. However, given the lockdown situation in the UAE, face-to-face data collection was not possible. Furthermore, a recent study suggested that BMI derived from self-reported weight and height could serve as a potentially valid measure among adult across different socio-demographic groups [48]. Second, the low response rate in this survey could have resulted in a non-response bias and hence limited the generalizability of the findings. Such low response rate of the online survey has been previously reported. A study comparing the response rates between paper and online surveys in a general population health survey showed that the paper mode has significantly higher response as compared to web-based format (OR: 2.04; 95%CI: 1.61–2.59) [49]. Previous literature suggested that the degree of survey fatigue in a society, the social cohesion, and the public attitudes towards the survey industry are among the factors that could lead to low response rate [50]. In the context of this study, survey fatigue could have been a main factor contributing to the relatively low response rate, especially that many research initiatives were launched simultaneously to survey individuals during lockdown in the UAE. However, in the case of this study, the advantages of this method (speed, cost, no physical contact) outweighed its disadvantages and potential biases. Third, in this study, females were more likely to participate in the study (75%) as compared to males (25%). A couple of reasons could have led to this difference. First, during the lockdown, a few jobs, with majority of males, were exempted from compliance with the confinement measures, such as the army, police forces, food service personnel and medical staff. Therefore, females were more likely to observe the lockdown and hence participate to the objectives of this research. Second, male sex has been repeatedly cited as a key factor associated with non-response [51,52], with women presenting higher participation rates in health-related surveys. For instance, the health examination survey participation rates across seven European countries as well as those stemming from the National Health and Nutrition Survey (NHANES) in the USA showed higher prevalence of women as compared to men [53,54]. Fourth, it is important to note that the questionnaire that was used in this study was not validated in the UAE population. That said, for the research question of this study in particular, and given the exceptional and unusual circumstances of the COVID 19 pandemic, there existed no previously validated questionnaire which could serve to examine the lifestyle changes during lockdown in the UAE. A few measures, however, were undertaken in order to improve the validity (content and face validity) and parallel form reliability of the questionnaire including (1) a thorough review by experts in the field of lifestyle and public health, (2) conducting a pilot test assessment on a convenient sample of UAE nationals and adults of diverse nationalities residing in the UAE and (3) translation and back translation by bilingual experts. Lastly, the cross-sectional nature of the study design does not allow inference of causality. Therefore, future research aiming to inform policy and decision makers ought to use more sophisticated designs and analyses such as the Decision Tee, among others.

5. Conclusions

Since the outbreak of the COVID-19 pandemic, restrictive measures of confinement and lockdown were imposed in many countries around the world, including the UAE. Although efficient in limiting the spread of the virus, such measures could have detrimental consequences on the lifestyle and wellbeing of individuals. Among potential unhealthy lifestyle changes that could propagate during lockdown are increased dietary intake, increased weight, decreased physical activity, increased smoking, and decreased sleep. The findings of this study highlighted that over half of adults residing in the UAE had one or two of the aforementioned unhealthy lifestyle changes during the lockdown with 9% reporting more than 3. The female gender, living in an apartment and being overweight or obese were more likely to report unhealthy lifestyle changes. In addition, almost half of the study population were angry and felt more stressed during the lockdown. Such findings are important to consider in a country such as UAE, given its high burden of diseases related to unhealthy lifestyle, namely the NCDs. Residents in the UAE should be encouraged to improve their lifestyle to lessen the risk both in the current and subsequent waves of COVID-19. Concerted efforts are needed to develop interventions aiming to alleviate the impact of lockdown on diet and lifestyle. Promoting a healthy diet, regular at-home exercises, avoiding smoking, and working on mental health are key factors to be considered to improve in boosting the immune system. Using the e-platforms for the design and delivery of these interventions to help people adopt sustainable changes could constitute an opportunity for which future studies are needed to determine feasibility and efficacy. Future research is needed to confirm the findings of this study and examine the role of socioeconomic status on changes in lifestyle habits. In addition, follow up studies would be important to shed light on long term impact of the COVID -19 lockdown on lifestyle and health related behaviors of individuals.

Supplementary Materials

The following are available online at https://www.mdpi.com/1660-4601/18/4/1964/s1.

Author Contributions

H.R., M.A.K. and F.N. led the conceptualization of the study. H.R., M.A.K., E.R.S. designed the web-survey. M.A.K., H.H., M.A.H. and E.R.S. supervised data collection and prepared the data for analysis. H.H., N.A., R.H. conducted the statistical analysis and tabulation of the data. H.H., H.R., N.A. prepared the first draft of the manuscript. F.N. led the critical review of data analysis, interpretation as well as the write up of the final draft of the manuscript. All authors have read and agreed to the published version of the manuscript.

Funding

No funding is applicable.

Institutional Review Board Statement

The Research and Ethics Committee at the University of Sharjah (REC-20-05-05-01) approved the study protocol. Written informed consent was obtained from participants before enrollment in the study.

Informed Consent Statement

Informed consent was obtained from all subjects involved in the study.

Data Availability Statement

The datasets used and/or analyzed during the current study are available from the corresponding author on reasonable request.

Acknowledgments

We would like to thank the staff in the Health Promotion Department in the Supreme Council for Family Affairs-Sharjah for facilitating and coordinating data collection. Moreover, our greatest gratitude goes to all participants for their time in completing the survey.

Conflicts of Interest

The authors declare no conflict of interest.

Appendix A

Figure A1. Illustration representing the distribution of the study sample across the map of the UAE.
Ijerph 18 01964 g0a1

Appendix B

Table A1. Simple and multiple logistic regressions describing the association between increased food intake and sociodemographic characteristics in the study population (n = 2060).
Increased Food Intake (n = 655)
Model 1Model 2
Crude OR95% CIp-ValueAdj OR95% CIp-Value
Sex (ref: males)
Female1.68(1.34; 2.11)<0.0011.87(1.47; 2.39)<0.001
Age (ref 18–30)
31–400.95(0.76; 1.18)0.630.86(0.67; 1.09)0.215
>400.68(0.53; 0.86)0.0020.57(0.43; 0.76)<0.001
Marital status (ref: Single)
Married0.95(0.78; 1.17)0.635
Ever married1.07(0.69; 1.66)0.75
Education (ref: up to high school)
University1.13(0.91; 1.41)0.265
Nationality (ref: Emirati)
Arabic1.24(1.01; 1.53)0.0371.35(1.02; 1.79)0.036
Western1.37(0.76; 2.49)0.2951.5(0.78; 2.87)0.224
Asian1.16(0.86; 1.55)0.3311.3(0.89; 1.91)0.172
Other0.89(0.34; 2.29)0.8060.83(0.31; 2.23)0.716
Type of living (ref: house with a garden or yard)
An apartment/house with no garden or yard1.22(1.01; 1.48)0.0381.16(0.88; 1.52)0.288
Working Status (ref: Not working)
Working from home0.9(0.72; 1.13)0.799
Working0.93(0.71; 1.23)0.381
Number of Children (ref: 0)
1–21.28(1.02; 1.6)0.0331.33(1.05; 1.68)0.02
≥31.03(0.83; 1.3)0.7691.25(0.95; 1.64)0.116
BMI (kg/m2) (ref: <25)
≥251.26(1.04; 1.54)0.021.47(1.19; 1.82)<0.001
Abbreviations: BMI: Body Mass Index, Coef.: Coefficient, adj coef: adjusted coefficient, CI: Confidence interval. Model 1: Crude associations; Model 2: Adjusted for sex, age, nationality, type of living, number of children, and BMI.
Table A2. Simple and multiple logistic regressions describing the association between increased weight and sociodemographic characteristics in the study population (n = 2060).
Increased Weight (n = 606)
Model 1Model 2
Crude OR95% CIp-ValueAdj OR95% CIp-Value
Sex (ref: males)
Female1.41(1.13; 1.78)0.0031.89(1.47; 2.41)<0.001
Age (ref 18–30)
31–400.76(0.61; 0.95)0.0150.69(0.53; 0.89)0.004
>400.66(0.52; 0.85)0.0010.55(0.41; 0.73)<0.001
Marital status (ref: Single)
Married0.91(0.74; 1.12)0.361
Ever married1.02(0.66; 1.59)0.924
Education (ref: up to high school)
University0.87(0.7; 1.09)0.227
Nationality (ref: Emirati)
Arabic1.92(1.56; 2.38)<0.0011.62(1.22; 2.17)0.001
Western2.13(1.18; 3.86)0.0122.06(1.08; 3.93)0.029
Asian1.83(1.36; 2.45)<0.0011.7(1.15; 2.5)0.007
Other1.92(0.8; 4.64)0.1451.48(0.6; 3.69)0.396
Type of living (ref: house with a garden or yard)
An apartment/house with no garden or yard1.94(1.6; 2.35)<0.0011.51(1.15; 1.98)0.003
Working Status (ref: Not working)
Working from home0.83(0.67; 1.04)0.595
Working0.89(0.67; 1.18)0.133
Number of Children (ref: 0)
1–21.14(0.91; 1.43)0.2481.12(0.88; 1.43)0.349
≥30.75(0.6; 0.95)0.0170.95(0.71; 1.26)0.708
BMI (kg/m2) (ref: <25)
≥251.77(1.43; 2.18)<0.0012.25(1.79; 2.83)<0.001
Abbreviations: BMI: Body Mass Index, Coef.: Coefficient, adj coef: adjusted coefficient, CI: Confidence interval. Model 1: Crude associations; Model 2: Adjusted for sex, age, nationality, type of living, number of children and BMI.
Table A3. Simple and multiple logistic regressions describing the association between decreased physical activity and sociodemographic characteristics in the study population (n = 2060).
Decreased Physical Activity
Model 1Model 2
Crude OR95% CIp-ValueAdj OR95% CIp-Value
Sex (ref: males)
Female1.25(1; 1.56)0.051.12(0.88; 1.43)0.354
Age (ref 18–30)
31–401.13(0.9; 1.42)0.2971.24(0.98; 1.59)0.081
>401.34(1.05; 1.7)0.0181.61(1.25; 2.08)<0.001
Marital status (ref: Single)
Married1.01(0.82; 1.24)0.921
Ever married0.84(0.53; 1.33)0.448
Education (ref: up to high school)
University0.76(0.62; 0.95)0.0140.84(0.67; 1.05)0.125
Nationality (ref: Emirati)
Arabic0.61(0.49; 0.76)<0.0010.7(0.53; 0.93)0.015
Western0.62(0.32; 1.2)0.1560.73(0.36; 1.46)0.367
Asian0.76(0.56; 1.03)0.0740.79(0.54; 1.15)0.213
Other0.72(0.28; 1.84)0.4880.74(0.28; 1.96)0.545
Type of living (ref: House with a garden or yard)
An apartment/house with no garden or yard1.50(1.22; 1.81)<0.0011.25(0.94; 1.66)0.121
Working Status (ref: Not working)
Working from home0.72(0.58; 0.9)0.0010.7(0.55; 0.89)0.003
Working1.1(0.84; 1.44)0.4961.06(0.8; 1.42)0.673
Number of Children (ref: 0)
1–20.85(0.68; 1.08)0.184
≥31.08(0.86; 1.35)0.517
BMI (kg/m2) (ref: <25)
>or = 251.32(1.08; 1.61)0.0061.38(1.13; 1.72)0.002
Abbreviations: BMI: Body Mass Index, Coef.: Coefficient, adj coef: adjusted coefficient, CI: Confidence interval. Model 1: Crude associations; Model 2: Adjusted for sex, age, education, nationality, type of living, working status and BMI.
Table A4. Simple and multiple logistic regressions describing the association between decreased sleep and sociodemographic characteristics in the study population (n = 2060).
Decreased Sleep
Model 1Model 2
Crude OR95% CIp-ValueAdj OR95% CIp-Value
Sex (ref: males)
Female1.69(1.29; 2.21)<0.0011.61(1.22; 2.12)<0.001
Age (ref 18–30)
31–400.8(0.63; 1.03)0.0810.85(0.66; 1.1)0.108
>400.66(0.5; 0.86)0.0030.71(0.54; 0.94)0.003
Marital status (ref: Single)
Married0.89(0.71; 1.12)0.309
Ever married0.81(0.48; 1.37)0.439
Education (ref: up to high school)
University0.92(0.72; 1.17)0.495
Nationality (ref: Emirati)
Arabic0.89(0.71; 1.13)0.3530.99(0.77; 1.26)0.913
Western0.58(0.26; 1.32)0.1940.68(0.3; 1.55)0.415
Asian0.69(0.48; 0.99)0.0420.74(0.51; 1.07)0.205
Other1.63(0.66; 4.05)0.291.56(0.62; 3.92)0.395
Type of living (ref: House with a garden or yard)
An apartment/house with no garden or yard0.95(0.76; 1.18)0.508
Working Status (ref: Not working)
Working from home1.16(0.9; 1.5)0.248
Working0.87(0.63; 1.22)0.423
Number of Children (ref: 0)
1–21.05(0.81; 1.36)0.733
≥31.14(0.89; 1.48)0.298
BMI (kg/m2) (ref: <25)
>or = 251.22(0.97; 1.53)0.083
Abbreviations: BMI: Body Mass Index, Coef.: Coefficient, adj coef: adjusted coefficient, CI: Confidence interval. Model 1: Crude associations; Model 2: Adjusted for sex, age and nationality.
Table A5. Simple and multiple logistic regressions describing the association between increased smoking and sociodemographic characteristics in the study population (n = 2060).
Increased Smoking
Model 1Model 2
Crude OR95% CIp-ValueAdj OR95% CIp-Value
Sex (ref: males)
Female0.25(0.14; 0.44)<0.0010.27(0.15; 0.49)<0.001
Age (ref 18–30)
31–400.78(0.42; 1.46)0.4380.6(0.31; 1.15)0.126
>400.45(0.2; 0.99)0.0460.25(0.11; 0.57)0.001
Marital status (ref: Single)
Married0.7(0.39; 1.24)0.222
Ever married0.29(0.04; 2.22)0.236
Education (ref: up to high school)
University1.45(0.7; 3)0.319
Nationality (ref: Emirati)
Arabic4.06(2.07; 7.96)<0.0012.25(0.95; 5.37)0.066
Western5.61(1.53; 20.56)0.0094.15(0.98; 17.56)0.054
Asian0.68(0.15; 3.04)0.6110.33(0.06; 1.69)0.183
Other8.6(1.81; 40.97)0.0075.17(0.99; 26.9)0.051
Type of living (ref: House with a garden or yard)
An apartment/house with no garden or yard2.82(1.57; 5.05)<0.0011.84(0.86; 3.94)0.119
Working Status (ref: Not working)
Working from home0.97(0.47; 2.01)0.938
Working1.92(0.88; 4.180.102
Number of Children (ref: 0)
1–21.81(0.98; 3.36)0.058
≥30.47(0.19; 1.12)0.089
BMI (kg/m2) (ref: <25)
>or = 251.97(1; 3.86)0.051.9(0.93; 3.88)0.077
Abbreviations: BMI: Body Mass Index, Coef.: Coefficient, adj coef: adjusted coefficient, CI: Confidence interval. Model 1: Crude associations; Model 2: Adjusted for sex, age, nationality, type of living and BMI. Numbers in bold are statistically significant (p-value < 0.05).

References

  1. Zhou, F.; Yu, T.; Du, R.; Fan, G.; Liu, Y.; Liu, Z. Clinical course and risk factors for mortality of adult inpatients with COVID-19 in Wuhan, China: A retrospective cohort study. Lancet 2020, 395, 1054–1062. [Google Scholar] [CrossRef]
  2. Ghebreyesus, T.A. WHO Director-General’s Opening Remarks at the Media Briefing on COVID-19-11 March 2020; World Health Organization: Geneva, Switzerland, 2020. [Google Scholar]
  3. Read, J.M.; Bridgen, J.R.; Cummings, D.A.; Ho, A.; Jewell, C.P. Novel coronavirus 2019-nCoV: Early estimation of epidemiological parameters and epidemic predictions. MedRxiv 2020, 1–22. [Google Scholar] [CrossRef] [Green Version]
  4. The National Newspaper. Coronavirus: UAE Records First Case—The National. 2020. Available online: https://www.thenational.ae/uae/health/coronavirus-uae-records-first-case-1.971253 (accessed on 10 June 2020).
  5. Worldometer. United Arab Emirates Coronavirus: 44,145 Cases and 300 Death. 2020. Available online: https://www.worldometers.info/coronavirus/country/united-arab-emirates (accessed on 15 June 2020).
  6. Edward-Elmhurst Health. How to Boost Your Immune System During COVID-19. 2020. Available online: https://www.eehealth.org/blog/2020/05/how-to-boost-your-immune-system-during-covid-19 (accessed on 11 July 2020).
  7. CDC. Center for Disease Control and Prevention, Quarantine and Isolation Quarantine CDC. 2017. Available online: https://www.cdc.gov/quarantine/index.html (accessed on 16 September 2020).
  8. Forbes. Dubai Enters 24-Hour Lockdown as Travel Restrictions Extended in UAE. 2020. Available online: https://www.forbes.com/sites/jamesasquith/2020/04/05/dubai-enters-24-hour-lockdown-as-travel-restrictions-extended-in-uae/#7e1b9a8d4f31 (accessed on 7 December 2020).
  9. Di Renzo, L.; Gualtieri, P.; Pivari, F.; Soldati, L.; Attinà, A.; Cinelli, G. Eating habits and lifestyle changes during COVID-19 lockdown: An Italian survey. J. Transl. Med. 2020, 18, 1–15. [Google Scholar] [CrossRef]
  10. The Independent. Coronavirus: Adult Physical Activity Falls by a Quarter Since Lockdown. The Independent. 2020. Available online: https://www.independent.co.uk/life-style/health-and-families/coronavirus-lockdown-physical-activity-reduced-exercise-weight-a9505411.html (accessed on 15 December 2020).
  11. Sleep Foundation. Sleep Guidelines and Help During the COVID-19 Pandemic. 2020. Available online: htps://www.sleepfoundation.org/sleep-guidelines-covid-19-isolation (accessed on 10 October 2020).
  12. Brooks, S.K.; Webster, R.K.; Smith, L.E.; Woodland, L.; Wessely, S.; Greenberg, N. El impacto psicológico de la cuarentena y cómo reducirla: Revisión rápida de las pruebas. Lancet 2020, 395, 912–920. [Google Scholar] [CrossRef] [Green Version]
  13. Australian Dietary Guidelines, Fat, Salt, Sugars and Alcohol. Eat for Health. 2015. Available online: https://www.eatforhealth.gov.au/food-essentials/fat-salt-sugars-and-alcohol (accessed on 2 February 2020).
  14. Katzmarzyk, P.; Lear, S. Physical activity for obese individuals: A systematic review of effects on chronic disease risk factors. Obes. Rev. 2012, 13, 95–105. [Google Scholar] [CrossRef]
  15. Hawryluck, L.; Gold, W.L.; Robinson, S.; Pogorski, S.; Galea, S.; Styra, R. SARS control and psychological effects of quarantine, Toronto, Canada. Emerg. Infect. Dis. 2004, 10, 1206. [Google Scholar] [CrossRef]
  16. World Health Organization. WHO. Noncommunicable Diseases Country Profiles. World Health Organization. 2018. Available online: http://www.who.int/nmh/publications/ncd-profiles-2018/en (accessed on 25 January 2020).
  17. Fadhil, I.; Belaila, B.B.; Razzak, H.A. National accountability and response for noncommunicable diseases in the United Arab Emirates. Int. J. Noncommun. Dis. 2019, 4, 4. [Google Scholar] [CrossRef]
  18. Scully, M.; Dixon, H.; Wakefield, M. Association between commercial television exposure and fast-food consumption among adults. Public Health Nutr. 2009, 12, 105–110. [Google Scholar] [CrossRef] [Green Version]
  19. Muscogiuri, G.; Barrea, L.; Savastano, S.; Colao, A. Nutritional recommendations for CoVID-19 quarantine. Eur. J. Clin. Nutr. 2020, 74, 850–851. [Google Scholar] [CrossRef]
  20. Mattioli, A.V.; Sciomer, S.; Cocchi, C.; Maffei, S.; Gallina, S. Quarantine during COVID-19 outbreak: Changes in Diet and physical activity increase the risk of cardiovascular disease. Nutr. Metab. Cardiovasc. Dis. 2020, 30, 1409–1417. [Google Scholar] [CrossRef]
  21. Macht, M. How emotions affect eating: A five-way model. Appetite 2008, 50, 1–11. [Google Scholar] [CrossRef]
  22. Frazão, E.; Stewart, H.; Hyman, J.; Carlson, A. Gobbling Up Snacks: Cause or Potential Cure for Childhood, Obesity; Department of Applied Economics, University of Minnesota: Saint Paul, MN, USA, 2012. [Google Scholar]
  23. Johnson, B.J.; Bell, L.K.; Zarnowiecki, D.; Rangan, A.M.; Golley, R.K. Contribution of discretionary foods and drinks to Australian children’s intake of energy, saturated fat, added sugars and salt. Children 2017, 4, 104. [Google Scholar] [CrossRef] [Green Version]
  24. Aslam, M.F.; Majeed, S.; Aslam, S.; Irfan, J. Vitamins: Key role players in boosting up immune response—A mini review. Vitam. Miner. 2017, 6, 153. [Google Scholar]
  25. Haddad, C.; Kheir, M.B.; Zakhour, M.; Haddad, R.; Al Hachach, M.; Sacre, H. Association between eating behavior and quarantine/confinement stressors during the Coronavirus disease 2019 outbreak. J. Eat. Disord. 2020, 8, 1–12. [Google Scholar] [CrossRef]
  26. Chen, P.; Mao, L.; Nassis, G.; Harmer, P.; Ainsworth, B.; Li, F. Coronavirus disease (COVID-19): The need to maintain regular physical activity while taking precautions. J. Sport Health Sci. 2020, 9, 103–104. [Google Scholar] [CrossRef] [PubMed]
  27. Owen, N.; Sparling, P.B.; Healy, G.N.; Dunstan, D.W.; Matthews, C.E. Sedentary behavior: Emerging evidence for a new health risk. Mayo Clin. Proceed. 2010, 85, 1138–1141. [Google Scholar] [CrossRef] [Green Version]
  28. Campbell, J.P.; Turner, J.E. Debunking the myth of exercise-induced immune suppression: Redefining the impact of exercise on immunological health across the lifespan. Front. Immunol. 2018, 9, 648. [Google Scholar] [CrossRef]
  29. Callaghan, P. Exercise: A neglected intervention in mental health care? J. Psychiatr. Ment. Health Nurs. 2004, 11, 476–483. [Google Scholar] [CrossRef] [PubMed]
  30. Lippi, G.; Henry, B.M.; Sanchis-Gomar, F. Physical inactivity and cardiovascular disease at the time of coronavirus disease 2019 (COVID-19). Eur. J. Prev. Cardiol. 2020, 27, 906–908. [Google Scholar] [CrossRef]
  31. Hammami, A.; Harrabi, B.; Mohr, M.; Krustrup, P. Physical activity and coronavirus disease 2019 (COVID-19): Specific recommendations for home-based physical training. Manag. Sport Leis. 2020, 25, 1–6. [Google Scholar]
  32. Tate, D.F.; Lyons, E.J.; Valle, C.G. High-tech tools for exercise motivation: Use and role of technologies such as the internet, mobile applications, social media, and video games. Diabet. Spectr. 2015, 28, 45–54. [Google Scholar] [CrossRef] [Green Version]
  33. Simonnet, A.; Chetboun, M.; Poissy, J.; Raverdy, V.; Noulette, J.; Duhamel, A. High prevalence of obesity in severe acute respiratory syndrome coronavirus-2 (SARS-CoV-2) requiring invasive mechanical ventilation. Obesity 2020, 28, 1195–1199. [Google Scholar] [CrossRef] [PubMed]
  34. Peng, Y.; Meng, K.; Guan, H.; Leng, L.; Zhu, R.; Wang, B. Clinical characteristics and outcomes of 112 cardiovascular disease patients infected by 2019-nCoV. Zhonghua Xin Xue Guan Bing Za Zhi 2020, 48, e004. [Google Scholar]
  35. Lighter, J.; Phillips, M.; Hochman, S.; Sterling, S.; Johnson, D.; Francois, F. Obesity in patients younger than 60 years is a risk factor for Covid-19 hospital admission. Clin. Infect. Dis. 2020, 71, 896–897. [Google Scholar] [CrossRef] [Green Version]
  36. Sattar, N.; McInnes, I.B.; McMurray, J.J. Obesity a risk factor for severe COVID-19 infection: Multiple potential mechanisms. Circulation 2020, 142, 4–6. [Google Scholar] [CrossRef] [PubMed]
  37. Radwan, H.; Ballout, R.A.; Hasan, H.; Lessan, N.; Karavetian, M.; Rizk, R. The epidemiology and economic burden of obesity and related Cardiometabolic disorders in the United Arab Emirates: A systematic review and qualitative synthesis. J. Obes. 2018, 2018, 2185942. [Google Scholar] [CrossRef] [Green Version]
  38. Xiao, H.; Zhang, Y.; Kong, D.; Li, S.; Yang, N. Social capital and sleep quality in individuals who self-isolated for 14 days during the coronavirus disease 2019 (COVID-19) outbreak in January 2020 in China. Med. Sci. Monitor Int. Med. J. Exp. Clin. Res. 2020, 26, e923921-1. [Google Scholar] [CrossRef]
  39. Sidor, A.; Rzymski, P. Dietary Choices and Habits during COVID-19 Lockdown: Experience from Poland. Nutrients 2020, 12, 1657. [Google Scholar] [CrossRef]
  40. Ibarra-Coronado, E.G.; Pantaleón-Martínez, A.M.; Velazquéz-Moctezuma, J.; Prospéro-García, O.; Méndez-Díaz, M.; Pérez-Tapia, M. The bidirectional relationship between sleep and immunity against infections. J. Immunol. Res. 2015, 2015, 678164. [Google Scholar] [CrossRef] [PubMed] [Green Version]
  41. Qiu, F.; Liang, C.-L.; Liu, H.; Zeng, Y.-Q.; Hou, S.; Huang, S. Impacts of cigarette smoking on immune responsiveness: Up and down or upside down? Oncotarget 2017, 8, 268. [Google Scholar] [CrossRef] [Green Version]
  42. Salk, R.H.; Hyde, J.S.; Abramson, L.Y. Gender differences in depression in representative national samples: Meta-analyses of diagnoses and symptoms. Psychol. Bull. 2017, 143, 783. [Google Scholar] [CrossRef]
  43. Tannis, C.; Senerat, A.; Garg, M.; Peters, D.; Rajupet, S.; Garland, E. Improving physical activity among residents of affordable housing: Is active design enough? Int. J. Environ. Res. Public Health 2019, 16, 151. [Google Scholar] [CrossRef] [PubMed] [Green Version]
  44. Zumla, A.; Hui, D.S.; Perlman, S. Middle East respiratory syndrome. Lancet 2015, 386, 995–1007. [Google Scholar] [CrossRef] [Green Version]
  45. Chan-Yeung, M.; Xu, R. SARS: Epidemiology. Respirology 2003, 8, S9–S14. [Google Scholar] [CrossRef] [PubMed]
  46. Garnier-Crussard, A.; Forestier, E.; Gilbert, T.; Krolak-Salmon, P. Novel Coronavirus (COVID-19) Epidemic: What Are the Risks for Older Patients? J. Am. Geriatr. Soc. 2020, 68, 939–940. [Google Scholar] [CrossRef] [Green Version]
  47. Gorber, S.C.; Tremblay, M.; Moher, D.; Gorber, B. A comparison of direct vs. self-report measures for assessing height, weight and body mass index: A systematic review. Obes. Rev. 2007, 8, 307–326. [Google Scholar] [CrossRef]
  48. Hodge, J.M.; Shah, R.; McCullough, M.L.; Gapstur, S.M.; Patel, A.V. Validation of self-reported height and weight in a large, nationwide cohort of US adults. PloS ONE 2020, 15, e0231229. [Google Scholar] [CrossRef] [Green Version]
  49. Guo, Y.; Kopec, J.A.; Cibere, J.; Li, L.C.; Goldsmith, C.H. Population survey features and response rates: A randomized experiment. Am. J. Public Health 2016, 106, 1422–1426. [Google Scholar] [CrossRef]
  50. Fan, W.; Yan, Z. Factors affecting response rates of the web survey: A systematic review. Comput. Human Behav. 2010, 26, 132–139. [Google Scholar] [CrossRef]
  51. Korkeila, K.; Suominen, S.; Ahvenainen, J.; Ojanlatva, A.; Rautava, P.; Helenius, H. Non-response and related factors in a nation-wide health survey. Eur. J. Epidemiol. 2001, 17, 991–999. [Google Scholar] [CrossRef] [PubMed]
  52. Lallukka, T.; Pietiläinen, O.; Jäppinen, S.; Laaksonen, M.; Lahti, J.; Rahkonen, O. Factors associated with health survey response among young employees: A register-based study using online, mailed and telephone interview data collection methods. BMC Public Health 2020, 20, 184. [Google Scholar] [CrossRef] [PubMed]
  53. Mindell, J.S.; Giampaoli, S.; Goesswald, A.; Kamtsiuris, P.; Mann, C.; Männistö, S. Sample selection, recruitment and participation rates in health examination surveys in Europe–Experience from seven national surveys. BMC Med. Res. Methodol. 2015, 15, 1–19. [Google Scholar] [CrossRef] [PubMed] [Green Version]
  54. CDC. National Center for Health Statistics. Response Rate and Population Totals. National Health and Nutrition Examination Survey. Available online: https://wwwn.cdc.gov/nchs/nhanes/ResponseRates.aspx#response-rates (accessed on 17 May 2020).
Figure 1. Prevalence of unhealthy lifestyle behaviors among study participants (n = 2060). * Percentage among smokers (N = 238).
Ijerph 18 01964 g001
Table 1. Sociodemographic characteristics of the study population (n = 2060).
n%
GenderMale51224.9
Female154875.1
Age (years)18–3065431.7
31–4079138.4
>4061529.9
Marital statusSingle63931.0
Married131563.8
Ever married1065.1
EducationUp to high school & technical diploma49424.0
University156676.0
NationalityEmirati104450.7
Arabic68833.4
Western492.4
Asian25612.4
Other221.1
Emirates of residenceSharjah140168.0
Dubai24311.8
Abu Dhabi1195.8
Ras El Khaimah (RAK)542.6
Fujairah291.4
UAQ321.6
Ajman1828.8
Type of livingIn a house with a garden or yard125060.7
In an apartment/a house with no garden or yard81039.3
Working statusNot working52525.5
working from home112954.8
working40619.7
Number of childrenNone79138.4
1–261730.0
≥365231.7
BMI (kg/m2)Normal (<25)72835.3
Overweight and/or obese (>or = 25)133264.7
Abbreviations: BMI: Body Mass Index.
Table 2. Description of dietary and lifestyle behaviors changes during COVID-19 pandemic among the study population (n = 2060).
n%
Physical activityIncrease34016.5
Decrease b61830.0
Same110253.5
Food intakeIncrease b65531.8
Decrease34416.7
Same106151.5
WeightIncrease b60629.4
Decrease47623.1
Same97847.5
Smoking aIncrease b5021.0
Decrease9339.1
Same9539.9
SleepIncrease52225.3
Decrease b42820.8
Same111053.9
Unhealthy lifestyle score (Mean ± SD: 1.14 ± 0.96)059528.9
1–2127962.1
≥31869.0
a percentage among smokers (N = 238) b considered as unhealthy behaviors which were added to determine the score.
Table 3. Simple and multiple linear regressions describing the association between unhealthy lifestyle score and sociodemographic characteristics in the study population (n = 2060).
Unhealthy Lifestyle Score (n = 2060)
Model 1 Model 2
Crude Coef.95% CIp-ValueAdj Coef.95% CIp-Value
Sex (reference: males)
Female0.26(0.16; 0.35)<0.0010.32(0.22; 0.42)<0.001
Age, years (reference: 18–30)
31–40−0.09(−0.19; 0.01)0.070.11(−0.21; −0.01)0.032
> 40−0.19(−0.3; −0.09)<0.0010.23(−0.34; −0.12)<0.011
Marital status (reference: Single)
Married−0.06(−0.15; 0.03)0.213
Ever married−0.07(−0.27; 0.13)0.478
Education (reference: up to high school)
University−0.07(−0.16; 0.03)0.183
Nationality (reference: Emirati)
Arabic0.1(0.003; 0.19)0.0420.08(−0.04; 0.2)0.215
Western0.1(−0.17; 0.38)0.4730.12(−0.16; 0.4)0.395
Asian0.03(−0.1; 0.16)0.6190.03(−0.12; 0.19)0.673
Other0.21(−0.19; 0.62)0.2990.14(−0.27; 0.54)0.507
Type of living (reference: house with a garden or yard)
An apartment/house with no garden or yard0.12(0.04; 0.21)0.0050.12(0.003; 0.23)0.045
Working Status (reference: Not working)
Working from home−0.1(−0.2; −0.01)0.0390.04(−0.14; 0.06)0.436
Working−0.02(−0.15; 0.1)0.7410.09(−0.04; 0.21)0.183
Number of Children (reference: 0)
1–20.08(−0.03; 0.18)0.144
>3−0.02(−0.12; 0.08)0.649
BMI (kg/m2) (reference: <25)
≥250.15(0.06; 0.24)0.0010.24(0.15; 0.32)<0.001
Abbreviations: BMI: Body Mass Index, Coef.: Coefficient, adj coef: adjusted coefficient, CI: Confidence interval. Model 1: Crude associations; Model 2: Adjusted for sex, age, nationality, type of living, working status and BMI. Numbers in bold are statistically significant (p-value < 0.05).
Table 4. Description of, perception, health and dietary practices, and perceived mental health status related to COVID-19 among the study population (n = 2060).
n%
Health practices
Agreement on “Quarantine is a good way to protect my family and to stop the spread of infectious disease outbreaks”Agree202898.4
Disagree321.6
Gloves and Mask use when going outGloves261.3
Mask30314.7
Both170983
None221.1
Dietary practices
Food items consumed the most during COVID-19 pandemicHome cooked food187190.8
Vegetables124060.2
Fruits124060.2
Herbal tea76237.0
Nuts70734.3
Sweets67232.6
Cakes and pastries54826.6
Chips and crackers48523.5
Fried food37918.4
Delivery food1276.2
Fast food924.5
None854.1
Type of food the participants’ consumed more of during COVID-19 pandemicCooked food173984.4
Salty Snacks: chips, popcorn, crackers etc.43921.3
Sweet snacks: Cupcakes, cookies, cakes, etc.1477.1
Nothing/Other1175.7
Number of times went grocery shopping per week during COVID-19 lockdown as compared to before COVID-19 lockdownIncrease834.0
Decrease47122.9
Same45622.1
No definite number of times105051.0
Dietary Ways to disinfect purchased fruits and vegetableswater90243.8
Water + salt1075.2
Water + Vinegar45121.9
Water + Vinegar + salt2019.8
Water + Detergents (Dishwashing liquid)1768.5
Disinfectants for vegetables and fruits1869.0
None371.8
Dietary Ordering food or groceries for deliveryYes98948.0
No107152.0
Dietary Sterilizing food items when deliveredYes163679.4
No42420.6
Perceived mental health status and practices
Feeling angry more during the lockdownYes86041.7
No120058.3
Feeling more stressed during lockdownYes138567.2
No120058.3
Practices to relieve stress during lockdownPray67933.0
Watch movies/music/social media55426.9
Eat more21610.5
Exercise more20910.2
Meditate21010.1
Other (reading, talking to friend, etc.)1296.3
Publisher’s Note: MDPI stays neutral with regard to jurisdictional claims in published maps and institutional affiliations.

