
Discriminative Measurement of Absorbed Dose Rates in Air from Natural and Artificial Radionuclides in Namie Town, Fukushima Prefecture


 , , and
Abstract
1. Introduction
2. Materials and Methods
2.1. Measurement Location and Method of γ-Ray Pulse-Height Distribution
2.2. Analysis of Gamma-Ray Pulse-Height Distribution and Correction of Absorbed Dose Rate in Air
2.3. Estimating the Effective Dose of External Exposure
3. Results and Discussion
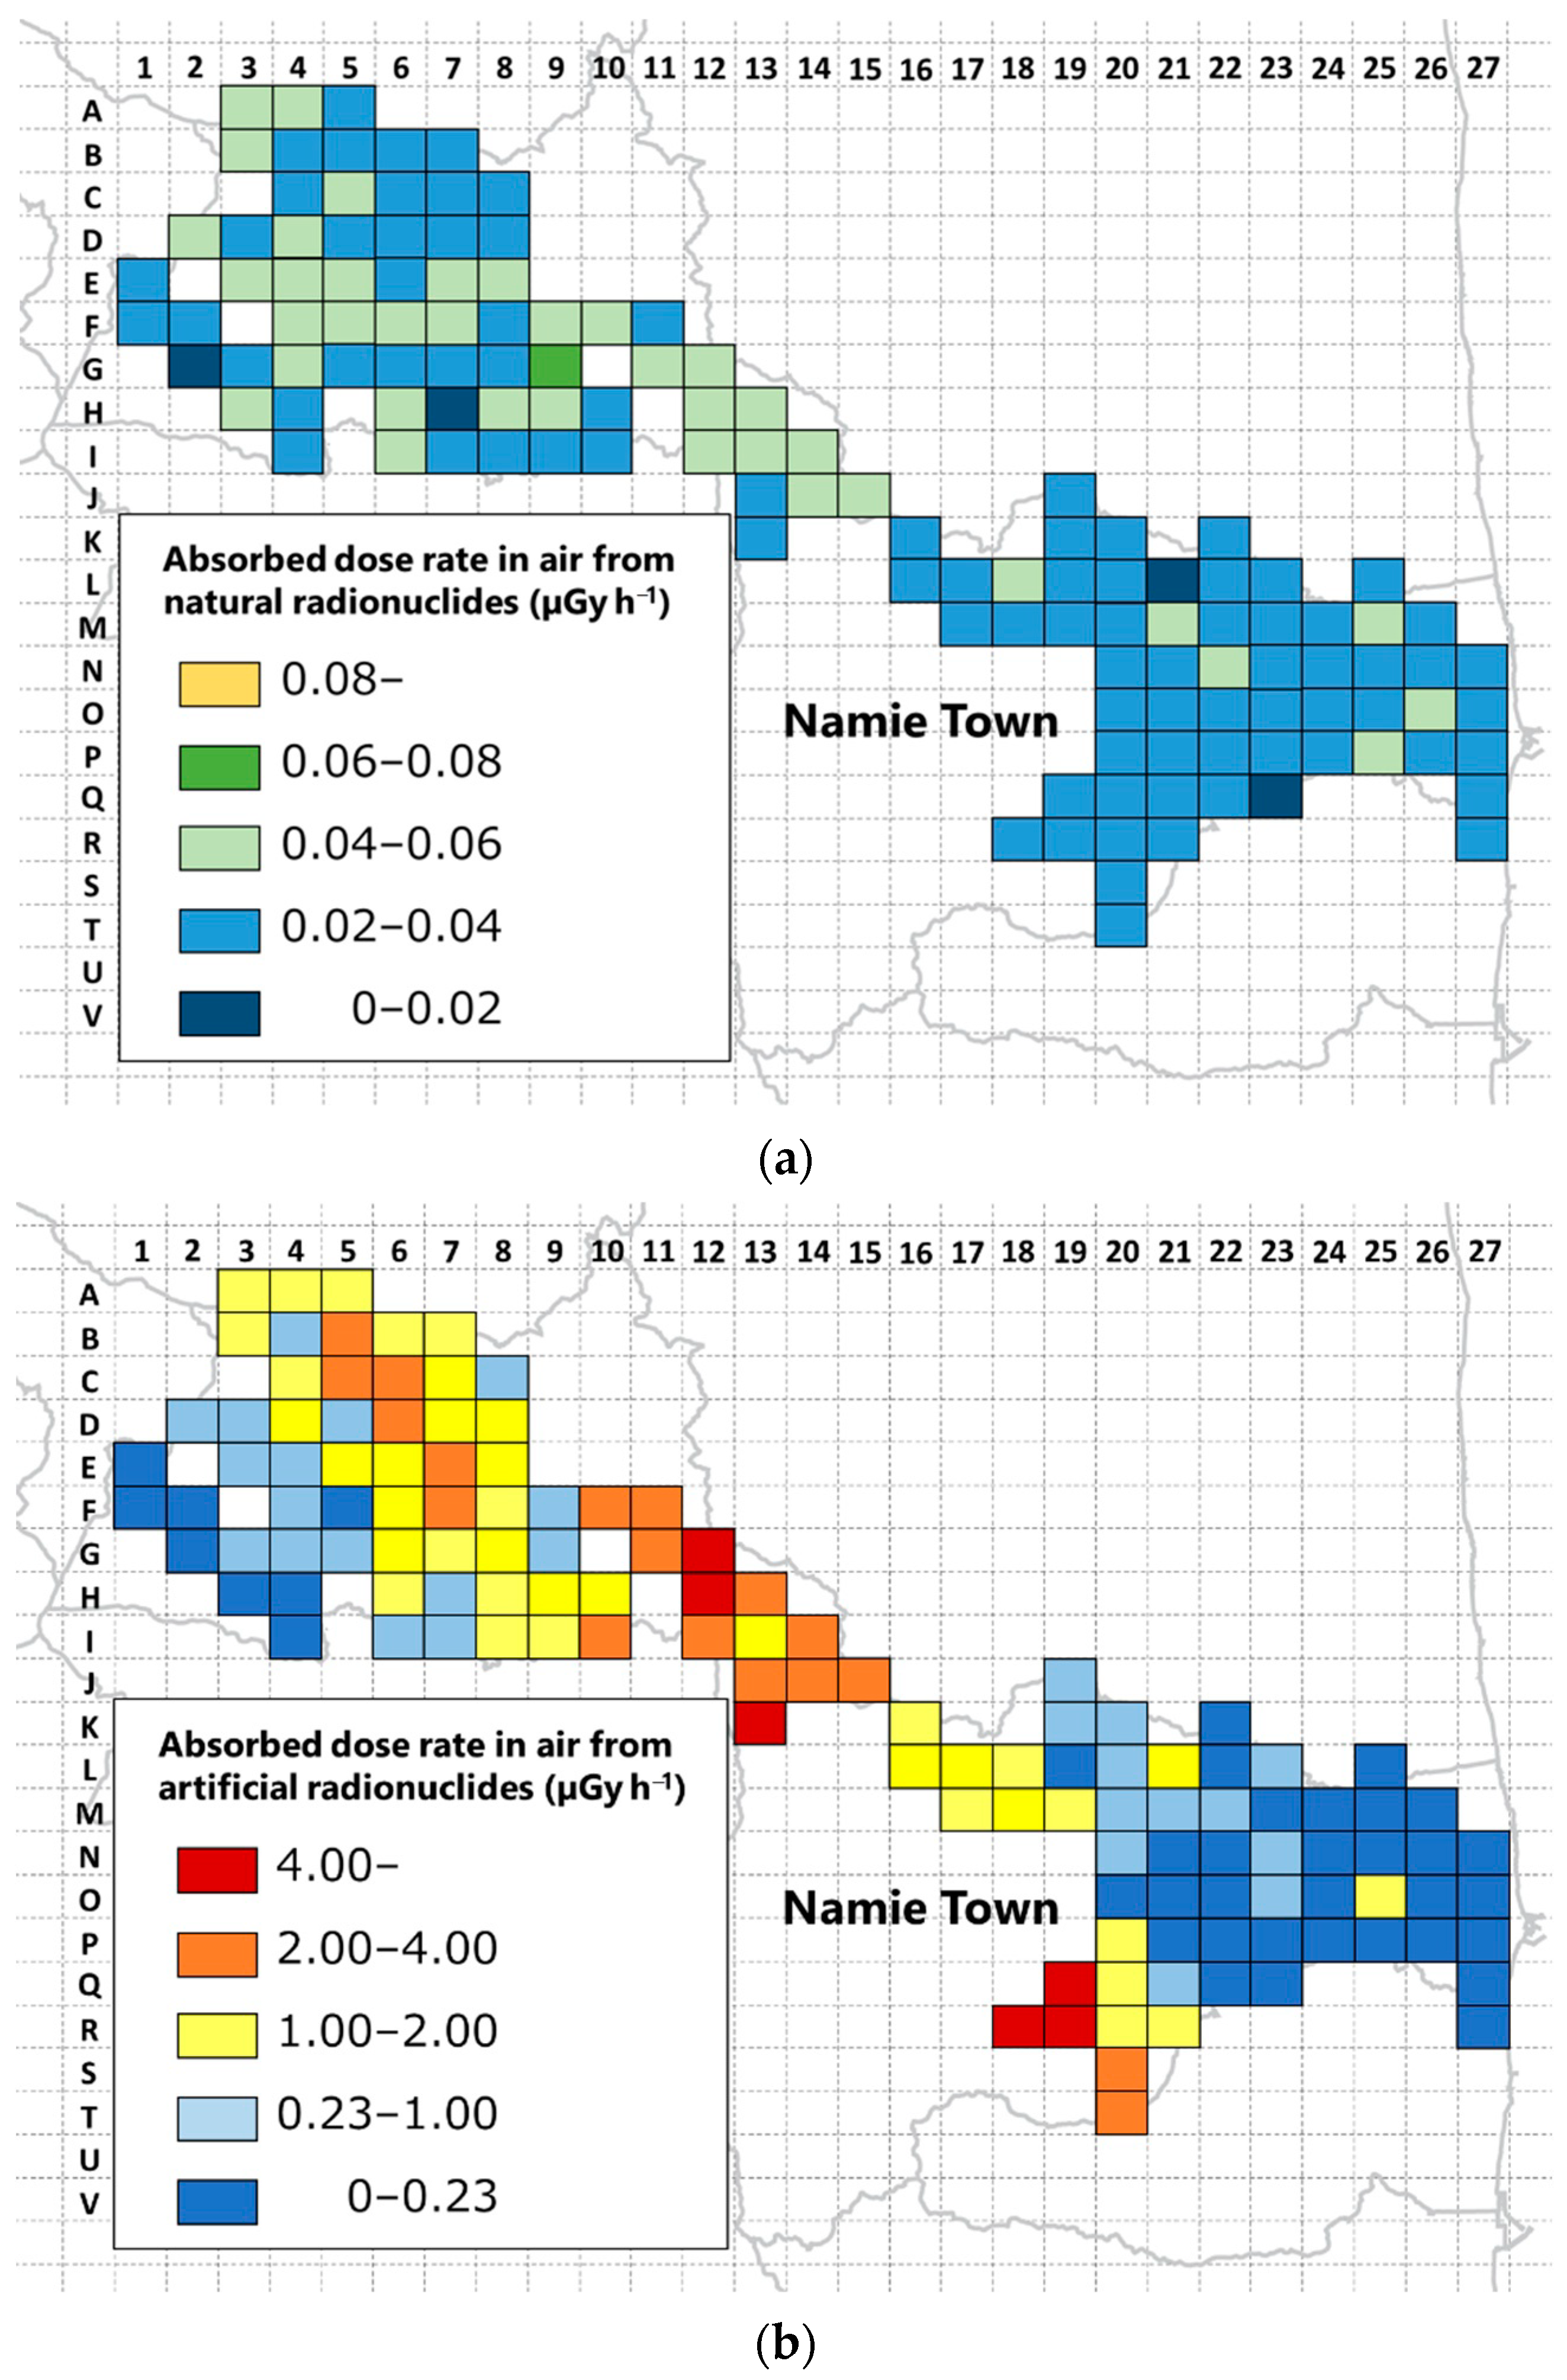
3.1. Absorbed Dose Rate in Air and Dose Rate Map
3.2. Estimating External Exposure Dose
4. Conclusions
- From the measurements of 134Cs and 137Cs concentrations, it was confirmed that Namie Town was radioactively contaminated by artificial radionuclides from the FDNPP accident.
- From the data of the monitoring posts installed in Namie Town, the median (range) of the apparent half-life of artificial radionuclides in the evacuation order cancellation zone decontaminated before April 2016, the evacuation order cancellation zone decontaminated after April 2016, and the difficult-to-return zone, is 6.4 ± 2.0, 2.0 ± 0.6, and 4.2 ± 1.4 y, respectively.
- The median (range) of absorbed dose rates in the air from artificial radionuclides time-corrected as of 1 April 2020, using the apparent half-life are 133 (67–511) and 1306 (892–2081) nGy h−1 in the evacuation order cancellation zone and the difficult-to-return zone, respectively.
- The median annual effective doses of external exposures from natural and artificial radionuclides are 0.19 and 0.40 mSv in the evacuation order cancellation zone and 0.25 and 3.9 mSv in the difficult-to-return zone.
Author Contributions
Funding
Conflicts of Interest
Appendix A

| Mesh Code | Ambient Dose Equivalent Rate (µSv h−1) | Apparent Half-Life (y) | |
|---|---|---|---|
| As of 1 April 2016 | As of 1 April 2020 | ||
| B5 | 4.2 | 2.4 | 4.7 |
| D8 | 2.4 | 1.3 | 4.5 |
| F4 | 1.2 | 0.64 | 4.7 |
| F5 | 0.96 | 0.60 | 5.8 |
| F5 | 4.9 | 0.70 | 1.4 |
| F5 | 2.1 | 0.44 | 1.8 |
| F8 | 3.6 | 2.0 | 4.6 |
| G6 | 2.3 | 1.3 | 5.1 |
| G8 | 1.7 | 0.88 | 4.2 |
| H13 | 5.4 | 3.2 | 5.2 |
| J14 | 6.4 | 3.2 | 4.0 |
| L16 | 1.0 | 0.62 | 5.6 |
| M18 | 3.6 | 2.0 | 4.8 |
| Q19 | 2.2 | 1.2 | 4.7 |
| Q19 | 11.8 | 5.7 | 3.9 |
| Q20 | 4.7 | 0.69 | 1.4 |
| Mesh Code | Ambient Dose Equivalent Rate (µSv h−1) | Apparent Half-Life (y) | |
|---|---|---|---|
| As of 1 April 2016 | As of 1 April 2020 | ||
| L18 | 1.5 | 0.76 | 3.9 |
| L19 | 3.2 | 1.9 | 5.0 |
| L22 | 0.40 | 0.28 | 8.2 |
| M19 | 2.2 | 1.2 | 4.7 |
| M20 | 0.59 | 0.41 | 7.5 |
| M21 | 1.1 | 0.60 | 4.4 |
| M21 | 0.38 | 0.24 | 6.1 |
| M22 | 0.41 | 0.32 | 10.5 |
| M23 | 0.25 | 0.18 | 8.8 |
| M23 | 0.16 | 0.11 | 8.1 |
| N22 | 0.88 | 0.38 | 3.3 |
| N24 | 0.22 | 0.14 | 5.9 |
| N24 | 0.19 | 0.14 | 10.1 |
| N24 | 0.12 | 0.07 | 5.9 |
| N25 | 0.25 | 0.15 | 5.5 |
| N25 | 0.08 | 0.06 | 7.4 |
| N25 | 0.10 | 0.07 | 6.2 |
| N26 | 0.21 | 0.13 | 6.1 |
| N26 | 0.13 | 0.09 | 6.4 |
| N26 | 0.09 | 0.06 | 7.0 |
| O23 | 0.46 | 0.24 | 4.2 |
| O24 | 0.23 | 0.17 | 9.2 |
| P21 | 0.64 | 0.30 | 3.6 |
| P23 | 1.6 | 0.97 | 5.7 |
| P25 | 0.16 | 0.11 | 7.1 |
| Mesh Code | Ambient Dose Equivalent Rate (µSv h−1) | Apparent Half-Life (y) | |
|---|---|---|---|
| As of 1 April 2016 | As of 1 April 2020 | ||
| L19 | 1.2 | 0.36 | 2.3 |
| N21 | 3.2 | 0.39 | 1.3 |
| N22 | 2.5 | 0.26 | 1.2 |
| N23 | 1.0 | 0.25 | 1.9 |
| O20 | 2.1 | 0.47 | 1.8 |
| O20 | 2.7 | 0.55 | 1.7 |
| O21 | 1.2 | 0.26 | 1.8 |
| O21 | 1.7 | 0.36 | 1.8 |
| O21 | 1.2 | 0.34 | 2.3 |
| O22 | 1.3 | 0.19 | 1.4 |
| O22 | 0.58 | 0.27 | 3.6 |
| P24 | 1.6 | 0.28 | 1.6 |
| Q21 | 1.3 | 0.38 | 2.3 |
Appendix B
| Mesh Code | Measuring Date | Absorbed Dose Rate in Air (nGy h−1) | 40K (Bq kg−1) | 232Th (Bq kg−1) | 238U (Bq kg−1) | ||
|---|---|---|---|---|---|---|---|
| Artificial Radionuclides | Artificial Radionuclides as of 1 April 2020 | Natural Radionuclides | |||||
| A3 | 2017/8/23 | 1620 | 1048 | 50 | 419 | 32 | 28 |
| A4 | 2018/9/10 | 1320 | 1017 | 54 | 428 | 39 | 29 |
| A5 | 2018/9/10 | 1600 | 1233 | 28 | 244 | 21 | 13 |
| B3 | 2017/8/23 | 2230 | 1442 | 51 | 477 | 27 | 28 |
| B4 | 2017/8/23 | 1370 | 886 | 26 | 248 | 15 | 14 |
| B5 | 2017/11/1 | 3578 | 2390 | 22 | 273 | 18 | 11 |
| B6 | 2017/8/23 | 2990 | 1934 | 33 | 262 | 22 | 19 |
| B7 | 2017/11/1 | 1760 | 1175 | 22 | 178 | 12 | 14 |
| C4 | 2017/8/23 | 1850 | 1196 | 23 | 139 | 16 | 15 |
| C5 | 2017/8/23 | 3280 | 2121 | 47 | 431 | 22 | 28 |
| C6 | 2017/11/1 | 3020 | 2017 | 37 | 354 | 22 | 19 |
| C7 | 2017/11/3 | 1960 | 1310 | 38 | 286 | 22 | 25 |
| C8 | 2017/11/1 | 1360 | 908 | 28 | 244 | 15 | 17 |
| D2 | 2017/8/24 | 1230 | 796 | 49 | 400 | 28 | 30 |
| D3 | 2017/8/24 | 1240 | 802 | 37 | 382 | 17 | 21 |
| D4 | 2017/11/1 | 2840 | 1897 | 44 | 382 | 23 | 26 |
| D5 | 2017/8/23 | 1520 | 983 | 39 | 363 | 18 | 23 |
| D6 | 2017/11/1 | 3741 | 2498 | 29 | 317 | 22 | 15 |
| D7 | 2017/11/1 | 2160 | 1442 | 32 | 311 | 17 | 17 |
| D8 | 2017/11/1 | 1950 | 1302 | 30 | 288 | 13 | 18 |
| E1 | 2017/8/24 | 239 | 155 | 36 | 314 | 18 | 22 |
| E3 | 2017/8/24 | 811 | 525 | 41 | 351 | 25 | 23 |
| E4 | 2017/8/24 | 954 | 617 | 41 | 367 | 22 | 24 |
| E5 | 2017/8/23 | 2300 | 1487 | 45 | 391 | 22 | 28 |
| E6 | 2017/11/1 | 2670 | 1783 | 35 | 300 | 16 | 23 |
| E7 | 2017/11/1 | 3120 | 2083 | 43 | 407 | 25 | 22 |
| E8 | 2017/11/1 | 2200 | 1469 | 50 | 502 | 27 | 25 |
| F1 | 2017/8/24 | 305 | 197 | 30 | 302 | 16 | 15 |
| F2 | 2017/8/25 | 246 | 159 | 29 | 252 | 17 | 17 |
| F4 | 2017/8/24 | 1200 | 776 | 53 | 419 | 29 | 34 |
| F5 | 2016/9/15 | 140 | 77 | 46 | 400 | 19 | 31 |
| F6 | 2016/9/15 | 1980 | 1095 | 44 | 391 | 20 | 28 |
| F7 | 2017/11/3 | 3010 | 2012 | 48 | 484 | 22 | 27 |
| F8 | 2017/11/3 | 1770 | 1183 | 23 | 213 | 13 | 13 |
| F9 | 2017/11/3 | 1060 | 709 | 48 | 428 | 22 | 30 |
| F10 | 2017/11/3 | 5335 | 3566 | 45 | 545 | 42 | 25 |
| F11 | 2017/11/3 | 5412 | 3618 | 38 | 530 | 37 | 21 |
| G2 | 2017/8/24 | 255 | 165 | 17 | 143 | 10 | 10 |
| G3 | 2017/8/24 | 376 | 243 | 31 | 216 | 19 | 20 |
| G4 | 2017/8/24 | 891 | 576 | 45 | 407 | 22 | 27 |
| G5 | 2017/8/25 | 1230 | 796 | 30 | 263 | 15 | 18 |
| G6 | 2017/8/25 | 2380 | 1541 | 28 | 242 | 17 | 16 |
| G7 | 2017/11/2 | 1930 | 1289 | 36 | 326 | 17 | 22 |
| G8 | 2017/11/2 | 2080 | 1390 | 37 | 323 | 17 | 23 |
| G9 | 2017/11/2 | 913 | 610 | 68 | 628 | 26 | 46 |
| G11 | 2017/11/3 | 3100 | 2072 | 47 | 477 | 27 | 22 |
| G12 | 2018/5/16 | 5890 | 4303 | 40 | 545 | 42 | 22 |
| H3 | 2017/8/24 | 315 | 204 | 45 | 407 | 26 | 24 |
| H4 | 2017/8/24 | 151 | 98 | 36 | 388 | 20 | 17 |
| H6 | 2018/9/10 | 1310 | 1010 | 42 | 339 | 28 | 23 |
| H7 | 2017/8/25 | 1430 | 926 | 15 | 99 | 11 | 9 |
| H8 | 2017/11/2 | 1690 | 1129 | 45 | 437 | 16 | 30 |
| H9 | 2017/11/2 | 2090 | 1396 | 43 | 348 | 22 | 28 |
| H10 | 2017/11/2 | 2360 | 1577 | 32 | 304 | 18 | 16 |
| H12 | 2018/5/16 | 6466 | 4723 | 44 | 659 | 45 | 25 |
| H13 | 2016/9/16 | 5306 | 2935 | 54 | 678 | 45 | 31 |
| I4 | 2017/8/24 | 207 | 134 | 28 | 251 | 15 | 16 |
| I6 | 2018/9/10 | 1130 | 871 | 45 | 323 | 35 | 24 |
| I7 | 2017/8/25 | 1220 | 790 | 37 | 330 | 18 | 23 |
| I8 | 2017/11/2 | 1560 | 1042 | 38 | 348 | 15 | 24 |
| I9 | 2017/11/2 | 1640 | 1096 | 37 | 333 | 15 | 24 |
| I10 | 2017/11/2 | 3190 | 2131 | 34 | 407 | 15 | 15 |
| I12 | 2018/5/16 | 4278 | 3125 | 52 | 582 | 36 | 30 |
| I13 | 2018/9/11 | 2470 | 1904 | 41 | 354 | 31 | 19 |
| I14 | 2018/5/16 | 3788 | 2767 | 52 | 447 | 35 | 30 |
| J13 | 2018/5/16 | 3799 | 2775 | 31 | 336 | 24 | 16 |
| J14 | 2018/5/16 | 4369 | 3192 | 41 | 459 | 28 | 23 |
| J15 | 2018/5/16 | 3898 | 2847 | 42 | 394 | 22 | 24 |
| J19 | 2017/12/22 | 925 | 724 | 23 | 208 | 15 | 12 |
| K13 | 2018/5/16 | 5721 | 4179 | 39 | 502 | 39 | 22 |
| K16 | 2018/9/10 | 1570 | 1210 | 40 | 308 | 33 | 19 |
| K19 | 2017/12/22 | 595 | 466 | 21 | 199 | 13 | 10 |
| K20 | 2017/12/22 | 1120 | 876 | 30 | 311 | 16 | 15 |
| K22 | 2019/11/14 | 179 | 172 | 26 | 205 | 18 | 14 |
| L16 | 2018/5/16 | 2490 | 1819 | 37 | 367 | 20 | 19 |
| L17 | 2018/5/16 | 2090 | 1527 | 40 | 373 | 23 | 21 |
| L18 | 2018/9/11 | 1510 | 1277 | 46 | 382 | 32 | 24 |
| L19 | 2017/12/22 | 231 | 104 | 28 | 290 | 14 | 14 |
| L20 | 2017/12/22 | 1100 | 861 | 24 | 189 | 13 | 15 |
| L21 | 2017/12/22 | 1950 | 1526 | 19 | 109 | 13 | 13 |
| L22 | 2017/12/22 | 147 | 115 | 28 | 258 | 16 | 15 |
| L23 | 2018/12/26 | 285 | 249 | 30 | 265 | 20 | 15 |
| L25 | 2018/12/26 | 89 | 78 | 22 | 169 | 14 | 13 |
| M17 | 2018/5/16 | 1720 | 1256 | 24 | 220 | 16 | 11 |
| M18 | 2018/5/16 | 2120 | 1549 | 33 | 281 | 21 | 18 |
| M19 | 2016/9/16 | 1510 | 1031 | 26 | 181 | 16 | 16 |
| M20 | 2017/12/22 | 1260 | 986 | 27 | 137 | 21 | 18 |
| M21 | 2017/12/22 | 343 | 268 | 44 | 311 | 28 | 27 |
| M22 | 2016/9/16 | 423 | 289 | 23 | 222 | 12 | 13 |
| M23 | 2017/12/23 | 242 | 189 | 35 | 360 | 17 | 18 |
| M24 | 2018/12/26 | 105 | 92 | 32 | 258 | 18 | 20 |
| M25 | 2018/12/26 | 35 | 31 | 51 | 339 | 34 | 32 |
| M26 | 2017/12/23 | 33 | 26 | 39 | 388 | 17 | 23 |
| N20 | 2017/12/22 | 854 | 668 | 24 | 197 | 14 | 14 |
| N21 | 2017/12/22 | 174 | 136 | 32 | 305 | 19 | 15 |
| N22 | 2018/5/16 | 141 | 73 | 47 | 444 | 20 | 29 |
| N23 | 2017/12/22 | 1460 | 654 | 38 | 413 | 15 | 21 |
| N24 | 2016/9/16 | 14 | 9 | 39 | 336 | 20 | 24 |
| N25 | 2016/9/15 | 67 | 46 | 28 | 298 | 12 | 16 |
| N26 | 2018/12/26 | 76 | 67 | 31 | 244 | 16 | 20 |
| N27 | 2017/12/23 | 27 | 21 | 39 | 379 | 18 | 22 |
| O20 | 2017/12/22 | 135 | 60 | 26 | 260 | 15 | 12 |
| O21 | 2017/12/22 | 120 | 94 | 27 | 272 | 15 | 14 |
| O22 | 2017/12/22 | 306 | 137 | 23 | 230 | 12 | 13 |
| O23 | 2017/12/23 | 398 | 312 | 34 | 298 | 19 | 19 |
| O24 | 2017/12/23 | 231 | 181 | 36 | 388 | 18 | 18 |
| O25 | 2017/12/23 | 1690 | 1323 | 34 | 257 | 20 | 22 |
| O26 | 2018/12/26 | 182 | 159 | 44 | 416 | 22 | 25 |
| O27 | 2018/12/26 | 19 | 17 | 32 | 285 | 20 | 17 |
| P20 | 2017/8/26 | 2010 | 1519 | 25 | 184 | 15 | 16 |
| P21 | 2017/12/22 | 100 | 78 | 24 | 242 | 14 | 11 |
| P22 | 2017/12/22 | 53 | 41 | 34 | 357 | 19 | 16 |
| P23 | 2018/12/26 | 149 | 130 | 21 | 224 | 10 | 11 |
| P24 | 2016/9/17 | 563 | 162 | 28 | 236 | 20 | 13 |
| P25 | 2017/12/23 | 39 | 30 | 46 | 407 | 31 | 23 |
| P26 | 2018/12/26 | 76 | 66 | 40 | 360 | 22 | 22 |
| P27 | 2018/12/26 | 20 | 18 | 27 | 254 | 14 | 15 |
| Q19 | 2016/9/17 | 9604 | 5316 | 26 | 1260 | 91 | 13 |
| Q20 | 2018/9/10 | 1480 | 1141 | 30 | 257 | 18 | 16 |
| Q21 | 2017/8/26 | 1620 | 648 | 27 | 260 | 15 | 15 |
| Q22 | 2018/9/11 | 206 | 119 | 28 | 257 | 15 | 15 |
| Q23 | 2018/9/11 | 98 | 83 | 20 | 181 | 14 | 9 |
| Q27 | 2018/12/26 | 61 | 53 | 22 | 225 | 9 | 13 |
| R18 | 2018/9/10 | 5560 | 4285 | 30 | 416 | 44 | 16 |
| R19 | 2016/9/17 | 11861 | 6565 | 39 | 1830 | 161 | 22 |
| R20 | 2017/8/26 | 1650 | 1069 | 30 | 280 | 18 | 15 |
| R21 | 2017/8/26 | 2390 | 1548 | 21 | 202 | 15 | 9 |
| R27 | 2018/12/26 | 101 | 88 | 30 | 266 | 16 | 18 |
| S20 | 2017/8/26 | 5342 | 3460 | 28 | 360 | 30 | 15 |
| T20 | 2017/8/26 | 4269 | 2764 | 21 | 342 | 24 | 11 |
References
- Yaneza, J.; Kuznetsova, M.; Souto-Iglesiasb, A. An analysis of the hydrogen explosion in the Fukushima-Daiichi accident. Int. J. Hydrogen Energy 2015, 40, 8261–8280. [Google Scholar] [CrossRef]
- Tominaga, T.; Hachiya, M.; Tatsuzaki, H.; Akashi, M. The Accident at the Fukushima Daiichi Nuclear Power Plant in 2011. Health Phys. 2014, 106, 630–637. [Google Scholar] [CrossRef]
- United Nations Scientific Committee on the Effects of Atomic Radiation. UNSCEAR 2013 Report Annex A: Levels and Effects of Radiation Exposure Due to the Nuclear Accident after 2011 Great East-Japan Earthquake and Tsunami; United Nations: New York, NY, USA, 2014. [Google Scholar]
- Prime Minister’s Office of Japan. Evacuation Order. (Tentative Translation). Available online: http://www.kantei.go.jp/jp/kikikanri/jisin/20110311miyagi/20110312siji11.pdf (accessed on 13 December 2020). (In Japanese)
- Fukushima Revitalization Station. Transition of Evacuation Designated Zones. Available online: https://www.pref.fukushima.lg.jp/site/portal-english/en03-08.html (accessed on 13 December 2020).
- Namie Town. About Area Reorganization and Evacuation Order Cancellation. (Tentative Translation). Available online: https://www.town.namie.fukushima.jp/soshiki/2/13457.html (accessed on 13 December 2020). (In Japanese).
- Namie Town. Now in Namie Town. (Tentative Translation). Available online: https://www.town.namie.fukushima.jp/ (accessed on 13 December 2020). (In Japanese).
- Fukushima Revitalization Station. The Situation in Namie Town. (Tentative Translation). Available online: https://www.pref.fukushima.lg.jp/site/portal/26-11.html (accessed on 13 December 2020).
- Takebayashi, Y.; Lyamzina, Y.; Suzuki, Y.; Murakami, M. Risk Perception and Anxiety Regarding Radiation after the 2011 Fukushima Nuclear Power Plant Accident: A Systematic Qualitative Review. Int. J. Environ. Res. Public Health 2017, 14, 1306. [Google Scholar] [CrossRef]
- Kudo, H.; Tokonami, S.; Hosoda, M.; Iwaoka, K.; Kasai, Y. Understanding of Basic Knowledge on Radiation among General Public –Comparison of Residents Participated in the Same Seminar in between Namie Town and Three Cities in Aomori Prefecture–. Jpn. J. Health Phys. 2016, 51, 92–97. [Google Scholar] [CrossRef]
- Saito, K.; Tanihara, I.; Fujiwara, M.; Saito, T.; Simoura, S.; Otsuka, T.; Onda, Y.; Hoshi, M.; Ikeuchi, Y.; Takahashi, F.; et al. Detailed deposition density maps constructed by large-scale soil sampling for gamma-ray emitting radioactive nuclides from the Fukushima Dai-ichi Nuclear Power Plant accident. J. Environ. Radioact. 2015, 139, 308–319. [Google Scholar] [CrossRef]
- Hosoda, M.; Tokonami, S.; Sorimachi, A.; Monzen, S.; Osanai, M.; Yamada, M.; Kashiwakura, I.; Akiba, S. The time variation of dose rate artificially increased by the Fukushima nuclear crisis. Sci. Rep. 2011, 1, 87. [Google Scholar] [CrossRef]
- Andoh, M.; Nakahara, Y.; Tsuda, S.; Yoshida, T.; Takahashi, F.; Mikami, S.; Kinouchi, N.; Sato, T.; Tanigaki, M.; Takemiya, K.; et al. Measurement of air dose rates over a wide area around the Fukushima Dai-ichi Nuclear Power Plant through a series of car-borne surveys. J. Environ. Radioact. 2015, 139, 266–280. [Google Scholar] [CrossRef]
- Akahane, K.; Yonai, S.; Fukuda, S.; Miyahara, N.; Yasuda, H.; Iwaoka, K.; Matsumoto, M.; Fukumura, A.; Akashi, M. NIRS external dose estimation system for Fukushima residents after the Fukushima Dai-ichi NPP accident. Sci. Rep. 2013, 3, 1670. [Google Scholar] [CrossRef]
- Ishikawa, T.; Yasumura, S.; Ozasa, K.; Kobashi, G.; Yasuda, H.; Miyazaki, M.; Akahane, K.; Yonai, S.; Ohtsuru, A.; Sakai, A.; et al. The Fukushima Health Management Survey: Estimation of external doses to residents in Fukushima Prefecture. Sci. Rep. 2015, 5, 12712. [Google Scholar] [CrossRef]
- Tokonami, S.; Hosoda, M.; Akiba, S.; Sorimachi, A.; Kashiwakura, I.; Balonov, M. Thyroid doses for evacuees from the Fukushima nuclear accident. Sci. Rep. 2012, 2, 507. [Google Scholar] [CrossRef]
- Hayano, R.S.; Tsubokura, M.; Miyazaki, M.; Satou, H.; Sato, K.; Masaki, S.; Sakuma, Y. Internal radiocesium contamination of adults and children in Fukushima 7 to 20 months after the Fukushima NPP accident as measured by extensive whole-body-counter surveys. Proc. Jpn. Acad. Ser. B 2013, 89, 157–163. [Google Scholar] [CrossRef]
- Hosoda, M.; Tokonami, S.; Akiba, S.; Kurihara, O.; Sorimachi, A.; Ishikawa, T.; Momose, T.; Nakano, T.; Mariya, Y.; Kashiwakura, I. Estimation of internal exposure of the thyroid to 131I on the basis of 134Cs accumulated in the body among evacuees of the Fukushima Daiichi Nuclear Power Station accident. Environ. Int. 2013, 61, 73–76. [Google Scholar] [CrossRef]
- Kim, E.; Kurihara, O.; Tani, K.; Ohmachi, Y.; Fukutsu, K.; Sakai, K.; Akashi, M. Intake ratio of 131I to 137Cs derived from thyroid and whole-body doses to Fukushima residents. Radiet. Prot. Dosim. 2016, 168, 408–418. [Google Scholar]
- Nuclear Regulation Authority Japan. Monitoring Information of Environmental Radioactivity Level. (Tentative Translation). Available online: http://radioactivity.nsr.go.jp/map/ja/ (accessed on 13 December 2020). (In Japanese)
- Shiroma, Y.; Hosoda, M.; Iwaoka, K.; Hegedűs, M.; Kudo, H.; Tsujiguchi, T.; Yamaguchi, M.; Akata, N.; Kashiwakura, I.; Tokonami, S. Changes of Absorbed Dose Rate in Air by CAR-BORNE Survey in Namie Town, Fukushima Prefecture After the Fukushima Daiichi Nuclear Power Plant Accident. Radiet. Prot. Dosim. 2019, 184, 527–530. [Google Scholar] [CrossRef]
- EMF Japan Co. Product Overview of EMF211 Type Gamma Ray Spectrometer. (Tentative Translation). Available online: https://www.emf-japan.com/emf/img/PDF/emf211-survey.pdf (accessed on 13 January 2021). (In Japanese).
- Radiation Earth Science Laboratory. Introduction of 49x49 Response Matrix for Environment Gamma Ray Analysis. (Tentative Translation). Available online: http://www1.s3.starcat.ne.jp/reslnote/YONQ.pdf (accessed on 14 December 2020). (In Japanese).
- Minato, S. Diagonal elements fitting technique to improve response matrixes for environmental gamma ray spectrum unfolding. Radioisotopes 2001, 50, 463–471. [Google Scholar] [CrossRef]
- International Commission on Radiation Unites and Measurements. ICRU Report 53: Gamma-Ray Spectrometry in the Environment; International Commission on Radiation Unites and Measurements: Stockholm, Sweden, 1994. [Google Scholar]
- Sanada, Y.; Urabe, Y.; Sasaki, M.; Ochi, K.; Torii, T. Evaluation of ecological half-life of dose rate based on airborne radiation monitoring following the Fukushima Dai-ichi nuclear power plant accident. J. Environ. Radioact. 2018, 192, 417–425. [Google Scholar] [CrossRef]
- Kinase, S.; Takahashi, T.; Saito, K. Long-term predictions of ambient dose equivalent rates after the Fukushima Daiichi nuclear power plant accident. J. Nucl. Sci. Technol. 2017, 54, 12. [Google Scholar] [CrossRef]
- Moriuchi, S.; Tsutsumi, M.; Saito, K. Examination on Conversion Factors to Estimate Effective Dose Equivalent from Absorbed Dose in Air for Natural Gamma Radiations. Jpn. J. Health Phys. 1990, 25, 121–128. [Google Scholar] [CrossRef]
- Omori, Y.; Wakamatsu, H.; Sorimachi, A.; Ishikawa, T. Radiation survey on Fukushima Medical University premises about four years after the Fukushima nuclear disaster. Fukushima J. Med. Sci. 2016, 62, 1–17. [Google Scholar] [CrossRef][Green Version]
- Ploykrathok, T.; Ogura, K.; Shimizu, M.; Hosoda, M.; Shiroma, Y.; Kudo, H.; Tamakuma, Y.; Tokonami, S. Estimation of annual effective dose in Namie Town, Fukushima Prefecture due to inhalation of radon and thoron progeny. Radiat. Emer. Med. 2020, 10, 1. [Google Scholar]
- Yoshida, H.; Hosoda, M.; Kanagami, T.; Uegaki, M.; Tashima, H. Reduction factors for wooden houses due to external γ-radiation based on in situ measurements after the Fukushima nuclear accident. Sci. Rep. 2014, 4, 7541. [Google Scholar] [CrossRef]
- Nishizawa, Y.; Yoshida, M.; Sanada, Y.; Torii, T. Distribution of the 134Cs/137Cs ratio around the Fukushima Daiichi nuclear power plant using an unmanned helicopter radiation monitoring system. J. Nucl. Sci. Technol. 2016, 53, 4. [Google Scholar] [CrossRef]
- Ministry of the Environment. Decontamination Information Site—Specified Reconstruction and Regeneration Base [Namie Town]- (Tentative Translation). Available online: http://josen.env.go.jp/kyoten/namie/ (accessed on 13 December 2020). (In Japanese)
- Hayes, J.M.; Johnson, T.E.; Anderson, D.; Nanba, K. Effective Half-life of 134Cs and 137Cs in Fukushima Prefecture When Compared to Theoretical Decay Models. Health Phys. 2020, 118, 60–64. [Google Scholar] [CrossRef]
- Wessel, P.; Smith, W.H.F. Free software helps map and display data. Trans. Am. Geophys. Union 1991, 72, 441–446. [Google Scholar] [CrossRef]
- Furukawa, M.; Shingaki, R. Terrestrial gamma radiation dose rate in Japan estimated before the 2011 Great East Japan Earthquake. Radiat. Emerg. Med. 2012, 1, 11–16. [Google Scholar]
- Geological Survey of Japan. Geology of Namie, Iwaki and Tomioka Areas. (Tentative Translation). Available online: https://www.gsj.jp/data/50KGM/PDF/GSJ_MAP_G050_07046_1994_D.pdf (accessed on 14 December 2020). (In Japanese).
- Omori, Y.; Hosoda, M.; Takahashi, F.; Sanada, T.; Hirao, S.; Ono, K.; Furukawa, M. Japanese population dose from natural radiation. J. Radiol. Prot. 2020, 40, 99–140. [Google Scholar] [CrossRef]
- Hosoda, M.; Tokonami, S.; Furukawa, M. Dose assessment on natural radiation, natural radionuclide, and artificial radionuclide released by the Fukushima nuclear accident. Radiat. Biol. Res. Commun. 2012, 47, 22–45. [Google Scholar]
- Ministry of Economy, Trade and Industry. Standards for Temporary Entry into Difficult-to-Return Zone. (Tentative Translation). Available online: https://www.meti.go.jp/earthquake/nuclear/kinkyu/hinanshiji/pdf/190905_zissikizyun2.pdf (accessed on 13 December 2020). (In Japanese)


| The Estimated Value of the Quantity of Radionuclides Released into the Atmosphere (Bq) | |||||||
|---|---|---|---|---|---|---|---|
| 132Te | 131I | 132I | 133I | 133Xe | 134Cs | 136Cs | 137Cs |
| 2.9 × 10¹⁶ | 1.2 × 10¹⁷ | 2.9 × 10¹⁶ | 9.6 × 10¹⁵ | 7.3 × 10¹⁸ | 9.0 × 10¹⁵ | 1.8 × 10¹⁵ | 8.8 × 10¹⁵ |
| Apparent Half-Life of Radiocesium in the Environment (y) | ||||
|---|---|---|---|---|
| Evacuation Order Cancellation Zone | Difficult-to-Return Zone | Previously Reported Value [34] | Theoretical Value [34] | |
| Decontaminated before April 2016 | Decontaminated on and after April 2016 | |||
| 6.4 | 2.0 | 4.2 | 3.2 | 7.8 |
| Absorbed Dose Rate in air as of 1 April 2020 (nGy h−1) | ||
|---|---|---|
| Evacuation Order Cancellation Zone | Difficult-to-Return Zone | |
| Natural radionuclides | 28 (25–35) | 37 (30–45) |
| Artificial radionuclides | 133 (67–511) | 1306 (892–2081) |
| Total | 161 (995–81) | 1340 (921–2124) |
| Mesh Code | Number of Measurements | Absorbed Dose Rate in Air | ||
|---|---|---|---|---|
| Average ± Standard Deviation (nGy h−1) | Standard Error (nGy h−1) | Coefficient of Variation | ||
| F5 | 4 | 1118 ± 84 | 42 | 8% |
| L22 | 3 | 126 ± 33 | 19 | 26% |
| L23 | 6 | 312 ± 147 | 60 | 47% |
| M22 | 5 | 227 ± 83 | 37 | 37% |
| M24 | 4 | 156 ± 14 | 7 | 9% |
| N23 | 3 | 147 ± 44 | 25 | 30% |
| Median (Range) Annual External Exposure Effective Dose (mSv) | ||
|---|---|---|
| Evacuation Order Cancellation Zone | Difficult-to-Return Zone | |
| Natural radionuclides | 0.19 (0.16–0.23) | 0.25 (0.20–0.29) |
| Artificial radionuclides | 0.40 (0.20–1.5) | 3.9 (2.7–6.2) |
| Total | 0.55 (0.39–1.7) | 4.1 (2.9–6.5) |
Publisher’s Note: MDPI stays neutral with regard to jurisdictional claims in published maps and institutional affiliations. |
© 2021 by the authors. Licensee MDPI, Basel, Switzerland. This article is an open access article distributed under the terms and conditions of the Creative Commons Attribution (CC BY) license (http://creativecommons.org/licenses/by/4.0/).
Share and Cite
Ogura, K.; Hosoda, M.; Tamakuma, Y.; Suzuki, T.; Yamada, R.; Negami, R.; Tsujiguchi, T.; Yamaguchi, M.; Shiroma, Y.; Iwaoka, K.; et al. Discriminative Measurement of Absorbed Dose Rates in Air from Natural and Artificial Radionuclides in Namie Town, Fukushima Prefecture. Int. J. Environ. Res. Public Health 2021, 18, 978. https://doi.org/10.3390/ijerph18030978
Ogura K, Hosoda M, Tamakuma Y, Suzuki T, Yamada R, Negami R, Tsujiguchi T, Yamaguchi M, Shiroma Y, Iwaoka K, et al. Discriminative Measurement of Absorbed Dose Rates in Air from Natural and Artificial Radionuclides in Namie Town, Fukushima Prefecture. International Journal of Environmental Research and Public Health. 2021; 18(3):978. https://doi.org/10.3390/ijerph18030978
Chicago/Turabian StyleOgura, Koya, Masahiro Hosoda, Yuki Tamakuma, Takahito Suzuki, Ryohei Yamada, Ryoju Negami, Takakiyo Tsujiguchi, Masaru Yamaguchi, Yoshitaka Shiroma, Kazuki Iwaoka, and et al. 2021. "Discriminative Measurement of Absorbed Dose Rates in Air from Natural and Artificial Radionuclides in Namie Town, Fukushima Prefecture" International Journal of Environmental Research and Public Health 18, no. 3: 978. https://doi.org/10.3390/ijerph18030978
APA StyleOgura, K., Hosoda, M., Tamakuma, Y., Suzuki, T., Yamada, R., Negami, R., Tsujiguchi, T., Yamaguchi, M., Shiroma, Y., Iwaoka, K., Akata, N., Shimizu, M., Kashiwakura, I., & Tokonami, S. (2021). Discriminative Measurement of Absorbed Dose Rates in Air from Natural and Artificial Radionuclides in Namie Town, Fukushima Prefecture. International Journal of Environmental Research and Public Health, 18(3), 978. https://doi.org/10.3390/ijerph18030978