Article

Mitigation of CyanoHABs Using Phoslock® to Reduce Water Column Phosphorus and Nutrient Release from Sediment

1
School of Oceanography, Shanghai Jiao Tong University, Shanghai 200030, China
2
Center for Coastal & Watershed Studies, Hood College, Frederick, MD 21701, USA
3
Institute of Marine and Environmental Technology, University of Maryland Center for Environmental Science, Baltimore, MD 21202, USA
4
Horn Point Laboratory, University of Maryland Center for Environmental Science, Cambridge, MD 21613, USA
*
Author to whom correspondence should be addressed.
Int. J. Environ. Res. Public Health 2021, 18(24), 13360; https://doi.org/10.3390/ijerph182413360
Submission received: 17 October 2021 / Revised: 13 December 2021 / Accepted: 14 December 2021 / Published: 18 December 2021
(This article belongs to the Special Issue Novel Understanding for the Ecology of Marine HABs)

Abstract

:
Cyanobacterial blooms can be stimulated by excessive phosphorus (P) input, especially when diazotrophs are the dominant species. A series of mesocosm experiments were conducted in a lake dominated by a cyanobacteria bloom to study the effects of Phoslock®, a phosphorus adsorbent. The results showed that the addition of Phoslock® lowered the soluble reactive phosphate (SRP) concentrations in water due to efficient adsorption and mitigated the blooms. Once settled on the sediments, Phoslock® serves as a barrier to reduce P diffusion from sediments into the overlying waters. In short-term (1 day) incubation experiments, Phoslock® diminished or reversed SRP effluxes from bottom sediments. At the same time, the upward movement of the oxic–anoxic interface through the sediment column slightly enhanced NH4+ release and depressed N2 release, suggesting the inhibition of nitrification and denitrification. In a long-term (28 days) experiment, Phoslock® hindered the P release, reduced the cyanobacterial abundance, and alleviated the bloom-driven enhancements in the pH and oxygen. These results suggest that, through suppression of internal nutrient effluxes, Phoslock® can be used as an effective control technology to reduce cyanobacteria blooms common to many freshwater systems.

1. Introduction

Harmful cyanobacterial blooms (CyanoHABs), which cause negative impacts on ecosystems and human health, are increasing in both frequency and magnitude in aquatic systems [1,2]. This increase is closely associated with eutrophication and climate change [3,4]. Excessive nutrients due to changes in land use and human activities have increased the bioavailability of nitrogen (N) and phosphorus (P). With climate change, rising temperature and stronger stratification may create a more suitable environment for cyanobacteria [5]. CyanoHABs, therefore, are expected to become more frequent and severe in the future [6,7]. The prevention, control, and mitigation of CyanoHABs have drawn increased attention in recent years.
Some cyanobacteria species can fix N to satisfy their demands and release fixed N to support the non-N2-fixing species [8,9]. Limited nitrogen availability may favor diazotrophic cyanobacterial species, which would account for high populations in the phytoplankton community [7]. The reduction of point source P inputs through phosphate detergent bans and improved wastewater P removal leads to improved water quality [10,11,12,13]. In addition, such a decrease in P loading and internal P sources via sediment dredging have proven to be viable options to mitigate CyanoHABs in lakes and estuaries [14,15,16]. However, the depuration of stored sediment P is often slow, and that pollution legacy, combined with fresh additions of labile organic and inorganic P, provides a buffer against P depletion. Whereas ecosystems remove N by denitrification, phosphorus removal occurs primarily through burial in sediments [17,18]. In summer conditions, organic matter decomposition and decreased sediment redox conditions result in increased P releases, which support high rates of primary production in the water column, often as cyanobacteria. Low redox conditions, increased algal P deposition, and the elevation of pH by CyanoHAB photosynthesis can promote sediment P release [19,20,21], reinforce eutrophication, and stimulate help to sustain CyanoHAB blooms [22].
Phoslock®, a novel lanthanum (La)-modified bentonite, adsorbs soluble phosphate by forming LaPO4. The compound is insoluble from pH 4 to 10 [23], with higher adsorption capacity at higher temperatures [24]. Changes in anoxic/oxic conditions exert little effect on the LaPO4 stability, minimizing P escape from reducing sediments into the overlying waters [25]. Owing to these properties, Phoslock® can help in the control of algal blooms by reducing the bioavailable P in water [26] and effectively retaining P in sediments [25,27]. Several studies have reported the successful utilization of Phoslock® during algal blooms [25,28], though limited observations of sediment nutrient release are available [29,30,31]. In previous studies, the assessment of Phoslock® application has focused on its performance (direct P adsorption and P removal efficiency in wastewater treatment) [25,27]; the equilibrium and kinetics strength of La-P in response to water column changes (e.g., temperatures, ionic strength, and pHs) [25]; and the reduced P release after capping on the sediment in the field [31]. There is a general consensus that prevention is the preferred management strategy for HABs, but this management strategy is usually difficult to implement. The whole ecosystem responds after the application of Phoslock® remains questionable. In order to provide a sustainable solution for bloom control, we consider both the N and P internal cycles, the induced N:P stoichiometry changes, and the mechanisms regulating phytoplankton biomass and speciation. The long-term impacts on the ecosystem after Phoslock® application are also assessed.
In the present study, Phoslock® was applied in mesocosms to reduce phosphorus concentrations and control cyanobacteria in a freshwater lake subjected to reoccurring cyanobacterial blooms. To assess the performance of Phoslock® as a mitigation strategy, we studied changes of soluble reactive phosphate (SRP) along with chlorophyll a (Chl a) after applying Phoslock®. Further, we estimated how Phoslock® application changed the benthic fluxes of dissolved inorganic nutrients (i.e., soluble reactive phosphorus (SRP), NH4+, NO3, and NO2); denitrification; oxygen consumption (influx of O2); and the efflux of dissolved inorganic carbon (DIC).

2. Materials and Methods

Higgins Mill Pond (38.519 N, −75.964 W), a 152-acre freshwater lake located in Maryland, USA, is located at the headwaters of the Transquaking River, a Chesapeake Bay tributary. The typical water depths are ~1.0–1.5 m. The pond is surrounded by farmland, mostly corn crops and poultry houses, yielding substantial and continuous nutrient loading from fertilizer and poultry litter applications. A confined chicken feeding operation ~0.5 km from the lake and runoff from an upstream chicken processing plant likely led to low N:P of the receiving water, resulting in reoccurring cyanobacterial blooms.

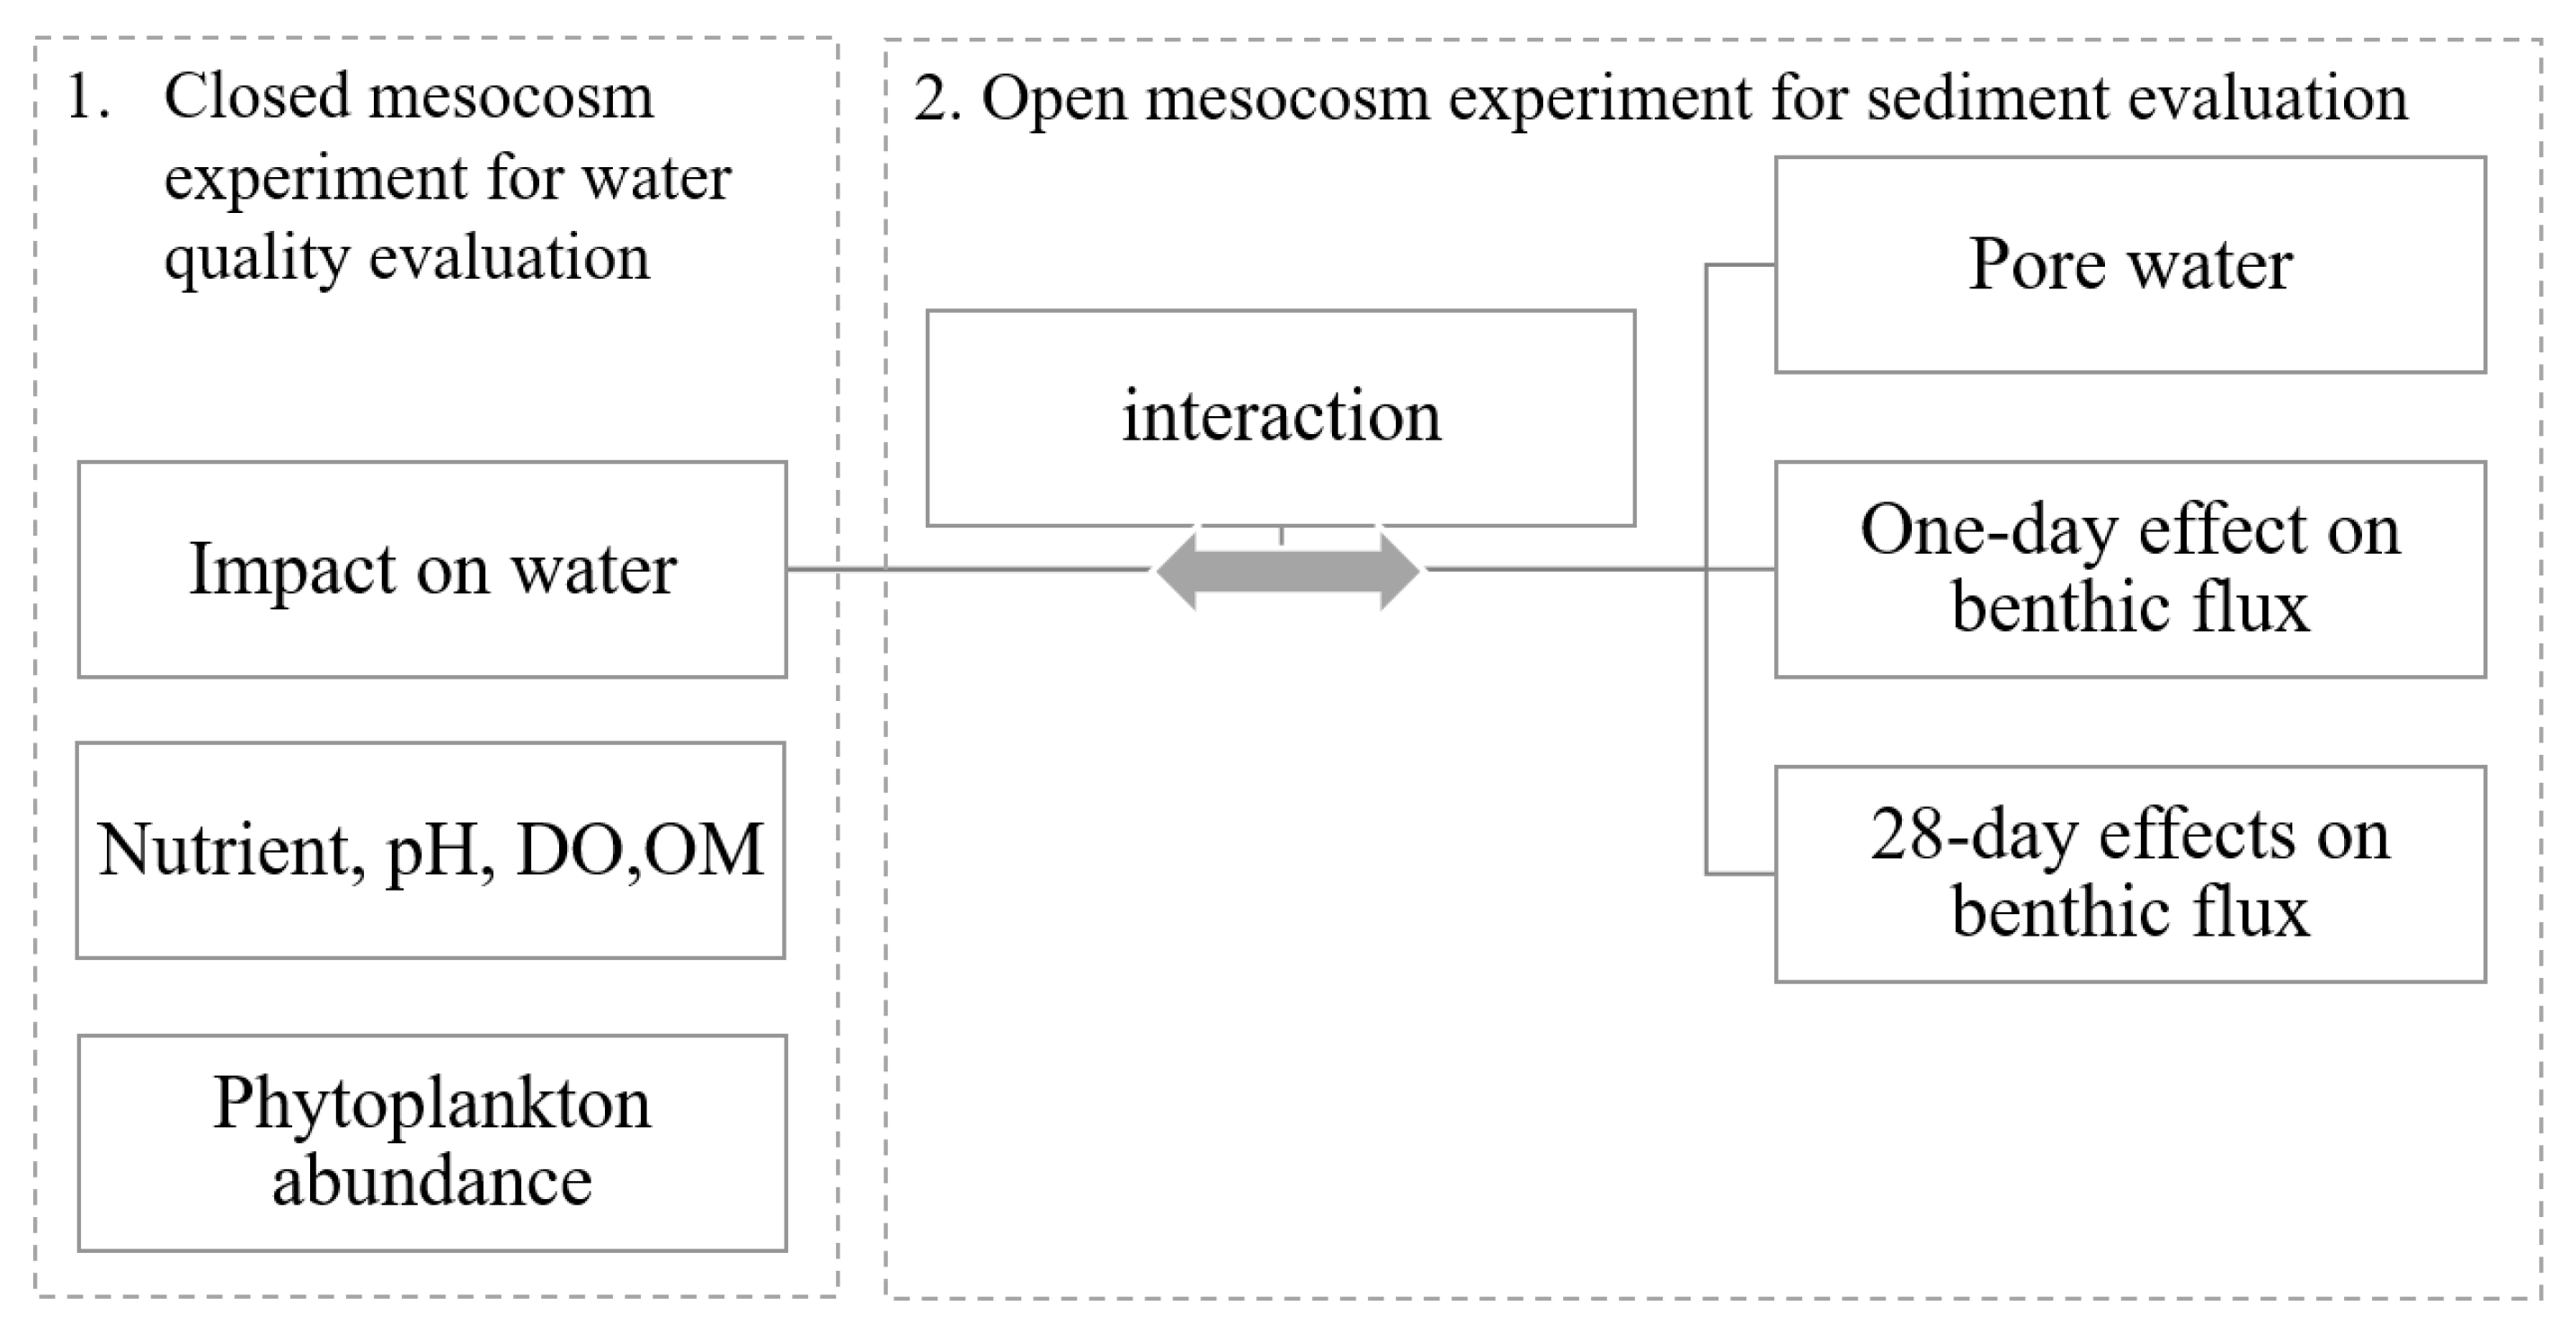
2.1. Experiment Design

Two sets of mesocosm experiments were conducted to evaluate the impacts of Phoslock® (SePRO Corporation, Whitakers, NC, USA) on the CyanoHABs and the P in the water and sediment of Higgins Mill Pond (Figure 1). In the first field experiment, Phoslock® was applied in closed-bottom mesocosms to evaluate the impacts on the water column in July when a cyanobacteria bloom dominated the pond. In the second experiment, Phoslock® was sprayed in open-bottom limnocorral as a capping reagent on the sediment. On the 28th day after Phoslock® application, sediment cores were collected from the treated and untreated sites to compare changes in the sediment–water biogeochemical exchange rates. A one-day Phoslock® treatment experiment was also performed to determine the short-term impacts on benthic chemical fluxes.

2.2. Phoslock® Impacts on the Water Column

To isolate the nutrient input from the sediment, six closed-bottom mesocosms (30.5 cm inner diameter × 61 cm high) were installed in the lake: 3 for Phoslock® treatment and 3 as untreated controls. On 2 July, 3 mesocosms were filled with 40 L of lake water, and then, each was amended with 1 L of fresh water mixed with 60-g Phoslock®. Changes of the Chl a, salinity, temperature, pH, and dissolved oxygen (DO) were measured on day 1, day 3, and day 9 after treatment using a Yellow Springs Instrument (YSI) 6600 Data Logger. On day 9, water samples were filtered through Whatman® glass fiber (GF/F) filters and preserved in acid-washed bottles at −20 °C until nutrient analysis. The water samples were also fixed with Lugol’s acid solution to quantify the phytoplankton abundance.

2.3. Phoslock® Effects on Sediment Nutrient Processes

To evaluate the performance of Phoslock® on P retention and N cycling in the sediments, 1-kg Phoslock® was spread evenly into an open-bottom 2-m diameter limnocorral (3.14 m2, Curry Industry, Ltd., Winnipeg, MB, Canada) on 26 July with a water depth of ~1.5 m. Samples were collected 1 to 2 times per week from ~0.2 m until 12 September for Chl a, DO, pH, and dissolved nutrients. Lugol’s acid-preserved phytoplankton samples were processed weekly to identify the cyanobacteria species and estimate the cell abundance.
On 22 August, a pole corer was used to collect 7-cm inner diameter, 15-cm deep acrylic sediment cores for the pore water analysis, with 4 cores collected in the limnocorral and 7 from untreated areas. At the laboratory, the sediment was hydraulically extruded and placed in 10-mL centrifuge tubes under N2 gas. Intact sediment cores, taken from treated and untreated sites, respectively, were sectioned at the depth intervals of 0–0.5 cm, 0.5–1.0 cm, 1.0–1.5 cm, 1.5–2.0 cm, 2.0–3.0 cm, 5.0–7.0 cm, and 9.0–11.0 cm.
For the other Phoslock® addition experiment, 3 of the 7 sediment cores from the untreated area had 2.5-g Phoslock® (=0.32 Kg m−2) added, with a 4-h settling period for the particle sedimentation. All sediment cores, including 3 after 28 days of Phoslock® exposure, 3 from natural sediments, and 3 with the new Phoslock® addition, were submersed in filtered field water (0.5-µm fibrous polypropylene string-wound cartridges, Cole-Parmer Inc., Vernon Hills, IL, USA) from the bottom of the lake and gently bubbled with air overnight in the dark at 27.5 °C, the ambient temperature at Higgins Mill Pond, in a temperature-controlled incubation chamber. Following the protocol of Gao et al. (2012) [32,33], all the cores were sealed with acrylic O-ring tops with a magnetic stir bar suspended beneath it and a rotating magnetic turntable with a stir bar below the resuspension thresholds. Water-only incubation cores were used as controls to separate water column processes from biological influences, such as the microbial uptake of nutrients, respiration, and nitrogen fixation. During the 6-h incubation, the overlying water was sampled 4 times, with samples filtered through GF/F filters for dissolved inorganic nutrients (SRP, NH4+, NO2, and NO3), and a whole water sample preserved with 10-mg HgCl2 in a stoppered glass tube for analysis of the dissolved gases (N2, O2, and DIC) [34]. Sediment sections for the pore water analysis were extruded into 50-mL centrifuge tubes in a N2-filled glove bag to minimize the iron oxidation and consequent P adsorption. After centrifugation for 10 min at 1000× g, the supernatants were syringe-filtered (pore size 0.45 µm).

2.4. Chemical and Biological Analysis

Concentrations of NH4+ and SRP were determined by colorimetric methods [35]. Both NO3 and NO2 were analyzed by ion chromatography [36]. Dissolved N2 and O2 concentrations were measured using the ratios of N2 to Argon (Ar) and O2:Ar using membrane inlet mass spectrometry, where the Ar concentration was assumed saturated [34]. DIC was quantified with an IR-based DIC analyzer (Apollo SciTech, Inc. ModelAS-C3, Newark, DE, USA). Flux rates of the solutes and gas were estimated as:
Flux   rate = V S × d C d t
where C is the pore water nutrient concentrations, t is the incubation time, V is the volume of the overlying water, and S is the area of sediment in the incubation cores.
The sediment water content was determined as the weight loss after drying at 65 °C for a week, and the grain size was determined by a sieving and pipette analysis [37]. The percent of water and the dry sediment density (r ~ 2.5 g cm−3) were used to calculate the porosity ( ) [38]:
= w a t e r % ( w a t e r % + ( 1 w a t e r % ) ρ )
Chl a was measured by a fluorometric analysis after acetone extraction [35]. The phytoplankton samples were examined microscopically. For phytoplankton identification and enumeration, Lugol’s iodine preserved samples were gently inverted, and a three-milliliter aliquot was settled for at least one hour in a Lab-Tek Chamber SlideTM (Nalge Nunc #155379, Rochester, NY, USA). For the phytoplankton community analysis, nano- and microplankton (>3–200 μm) in the chamber were identified to the lowest taxonomic group possible using a Zeiss Axiovert 200 inverted microscope. Small and numerous phytoplankton species (at least 200 cells/sample, examined in a recorded number of optical fields) were identified and enumerated at 400× magnification; at 320×, a transect of the chamber was examined to capture the identification and enumeration data for moderately sized species, and the large/rare species in the entire chamber were identified and enumerated at 100× magnification.
An ambient water sample was also taken during the experiments for determination of the total microcystins at the Maryland Department of Natural Resources (MD DNR) Laboratory using the Adda Enzyme-Linked Immunosorbent Assay following EPA Method 546.

2.5. Statistical Analysis

The effects of Phoslock® on P removal were assessed using a two-way ANOVA for the sampling time and treatment effects for SRP changes. Flux rates among the Phoslock®-free and 1st day and 28th day of Phoslock® applications in the sediments were compared with the least significant difference at p < 0.05. All data analyses were conducted with SigmaPlot 14.0.

3. Results

3.1. Bloom Progression in the Lake

Cyanobacteria bloomed in Higgins Mill Pond from June to September. The cyanobacteria community was dominated by non-N2-fixing cyanobacteria (e.g., Microcystis spp.) in June and various N2-fixing cyanobacteria (e.g., Anabaena spp., Anabaenopsis spp., Lyngbya spp., Chroococcus sp., and Pseudanabaena sp.) from July to September. The Chl a concentrations exceeded 50 µg L−1. In the water column experiments, the initial cyanobacteria density and the bloom-driven changes were similar to those during the sediment capping experiments. In the closed-bottom experiment (no sediment nutrient supply), the initial total cyanobacteria density was 3.89 × 10⁶ cells mL−1, in which 56% of the cells were potential N2-fixing species. At the beginning of the open-bottom experiment (sediment nutrients released into the overlying water), the cyanobacteria density was 4.3 × 10⁶ cells mL−1, with 59% of the cells potential N2-fixing species. During both experimental periods in the lake, high pH (>9) and DO (>100 µmol L−1) were observed.
The microcystin levels (18 µg L−1, Table 1) exceeded the World Health Organization (WHO) 1998 chronic drinking water guidance value of 1 µg L−1 and were greater than the recreational safety guidance for children of 10 µg L−1. Table 1 provides the conditions in the treated and untreated pond samples and sediment compositions.
Due to the increased biological nutrient uptake, the inorganic nutrients in the lake decreased with the bloom development. NO3 decreased from 34.6 µmol L−1 in June to being undetectable in August, the SRP reduced from 6.5 µmol L−1 to 1.1 µmol L−1, and the NH4+ decreased from 0.5 µmol L−1 to < 0.01 µmol L−1. As a result, the concentration ratios of DIN:SRP in our study period ranged from 0.23 to 10, reflecting a potential N limitation and consistent with the succession of diazotrophic cyanobacteria dominance over time.

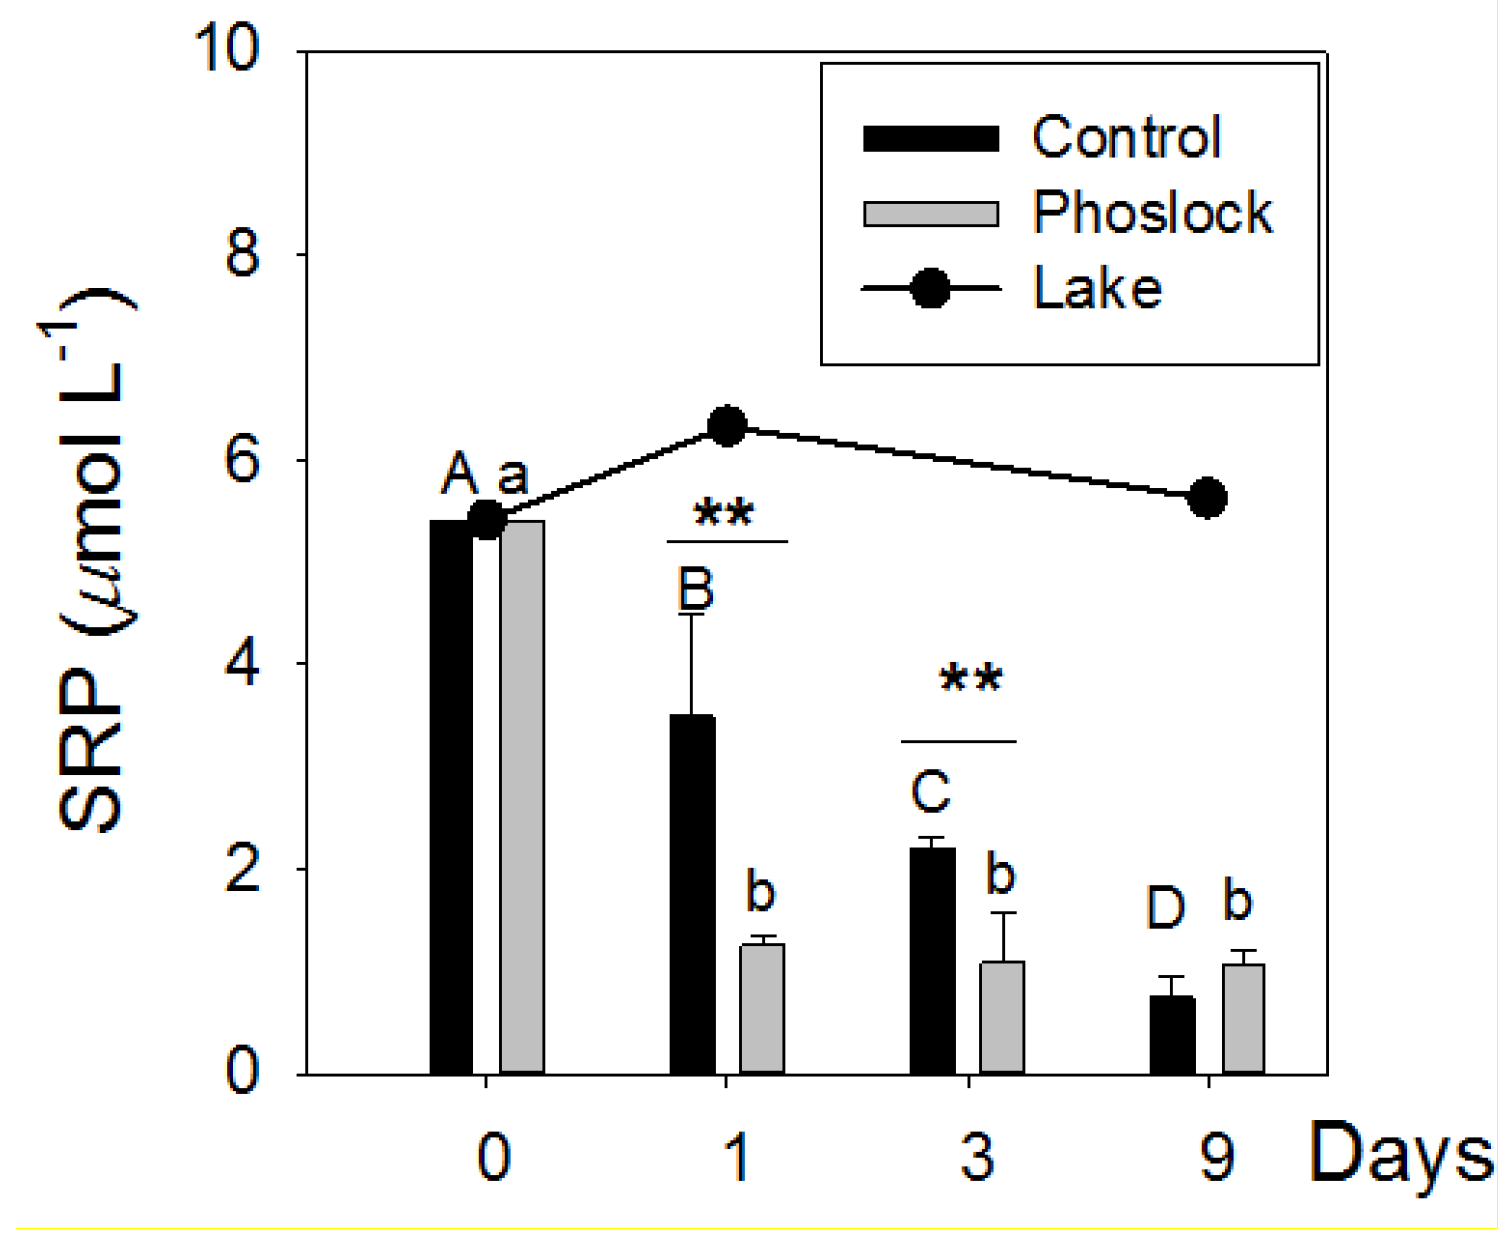
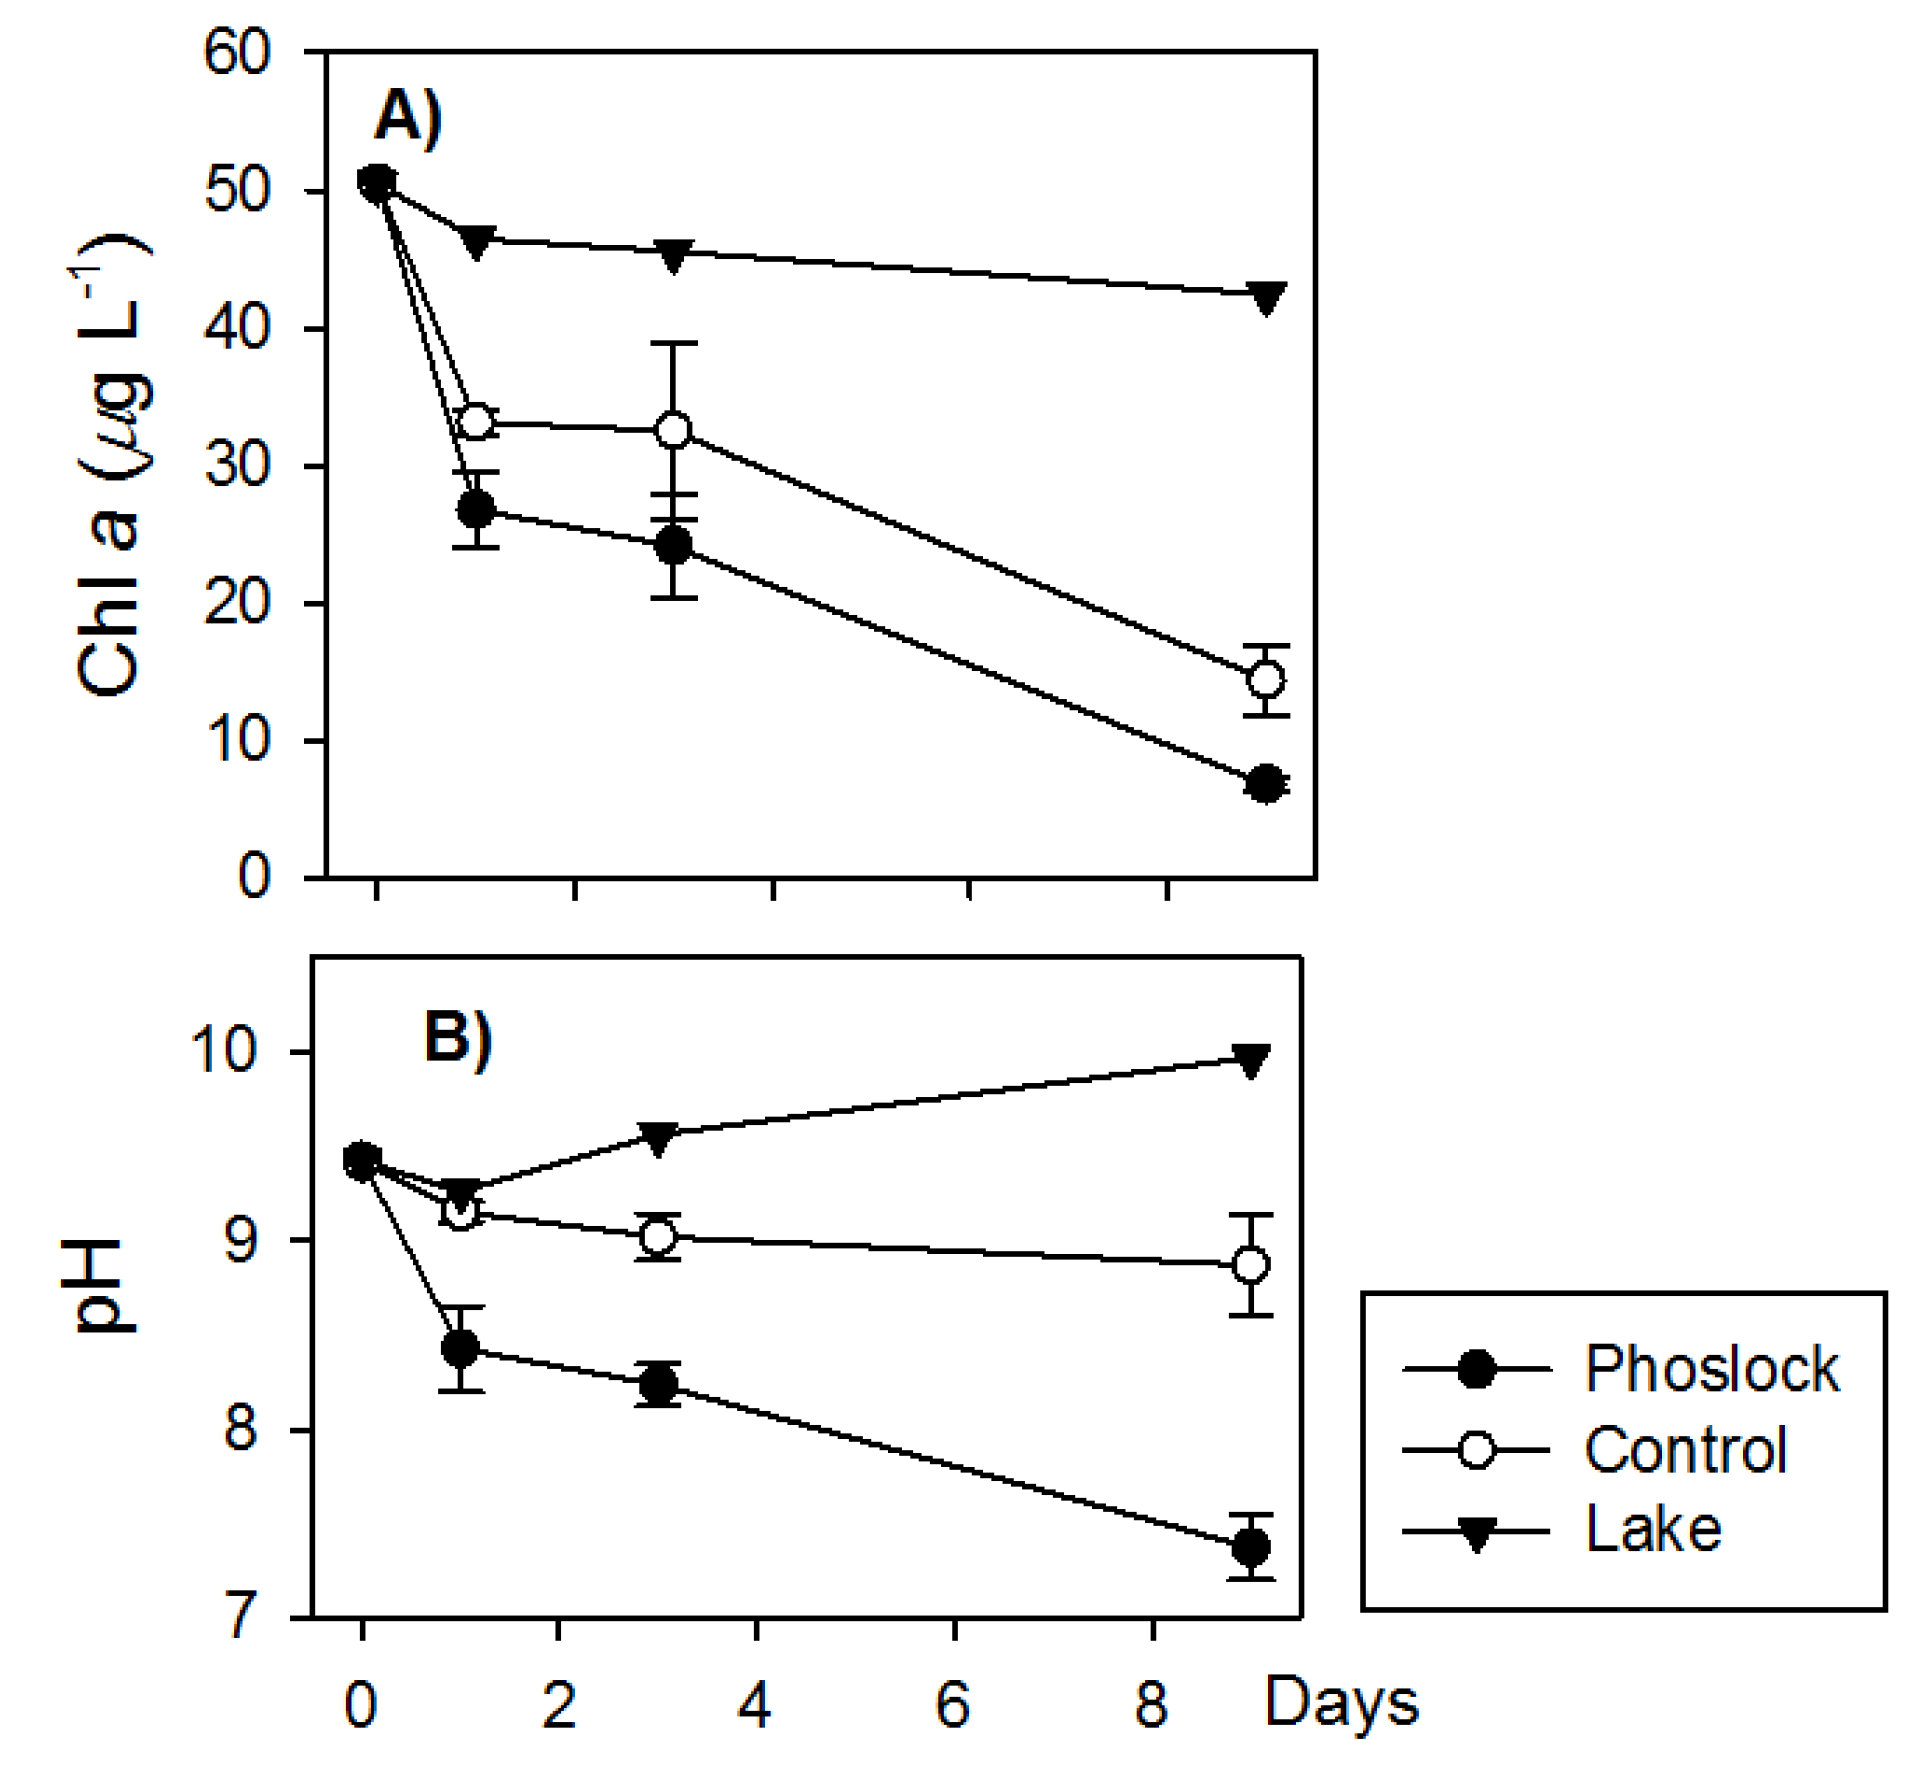
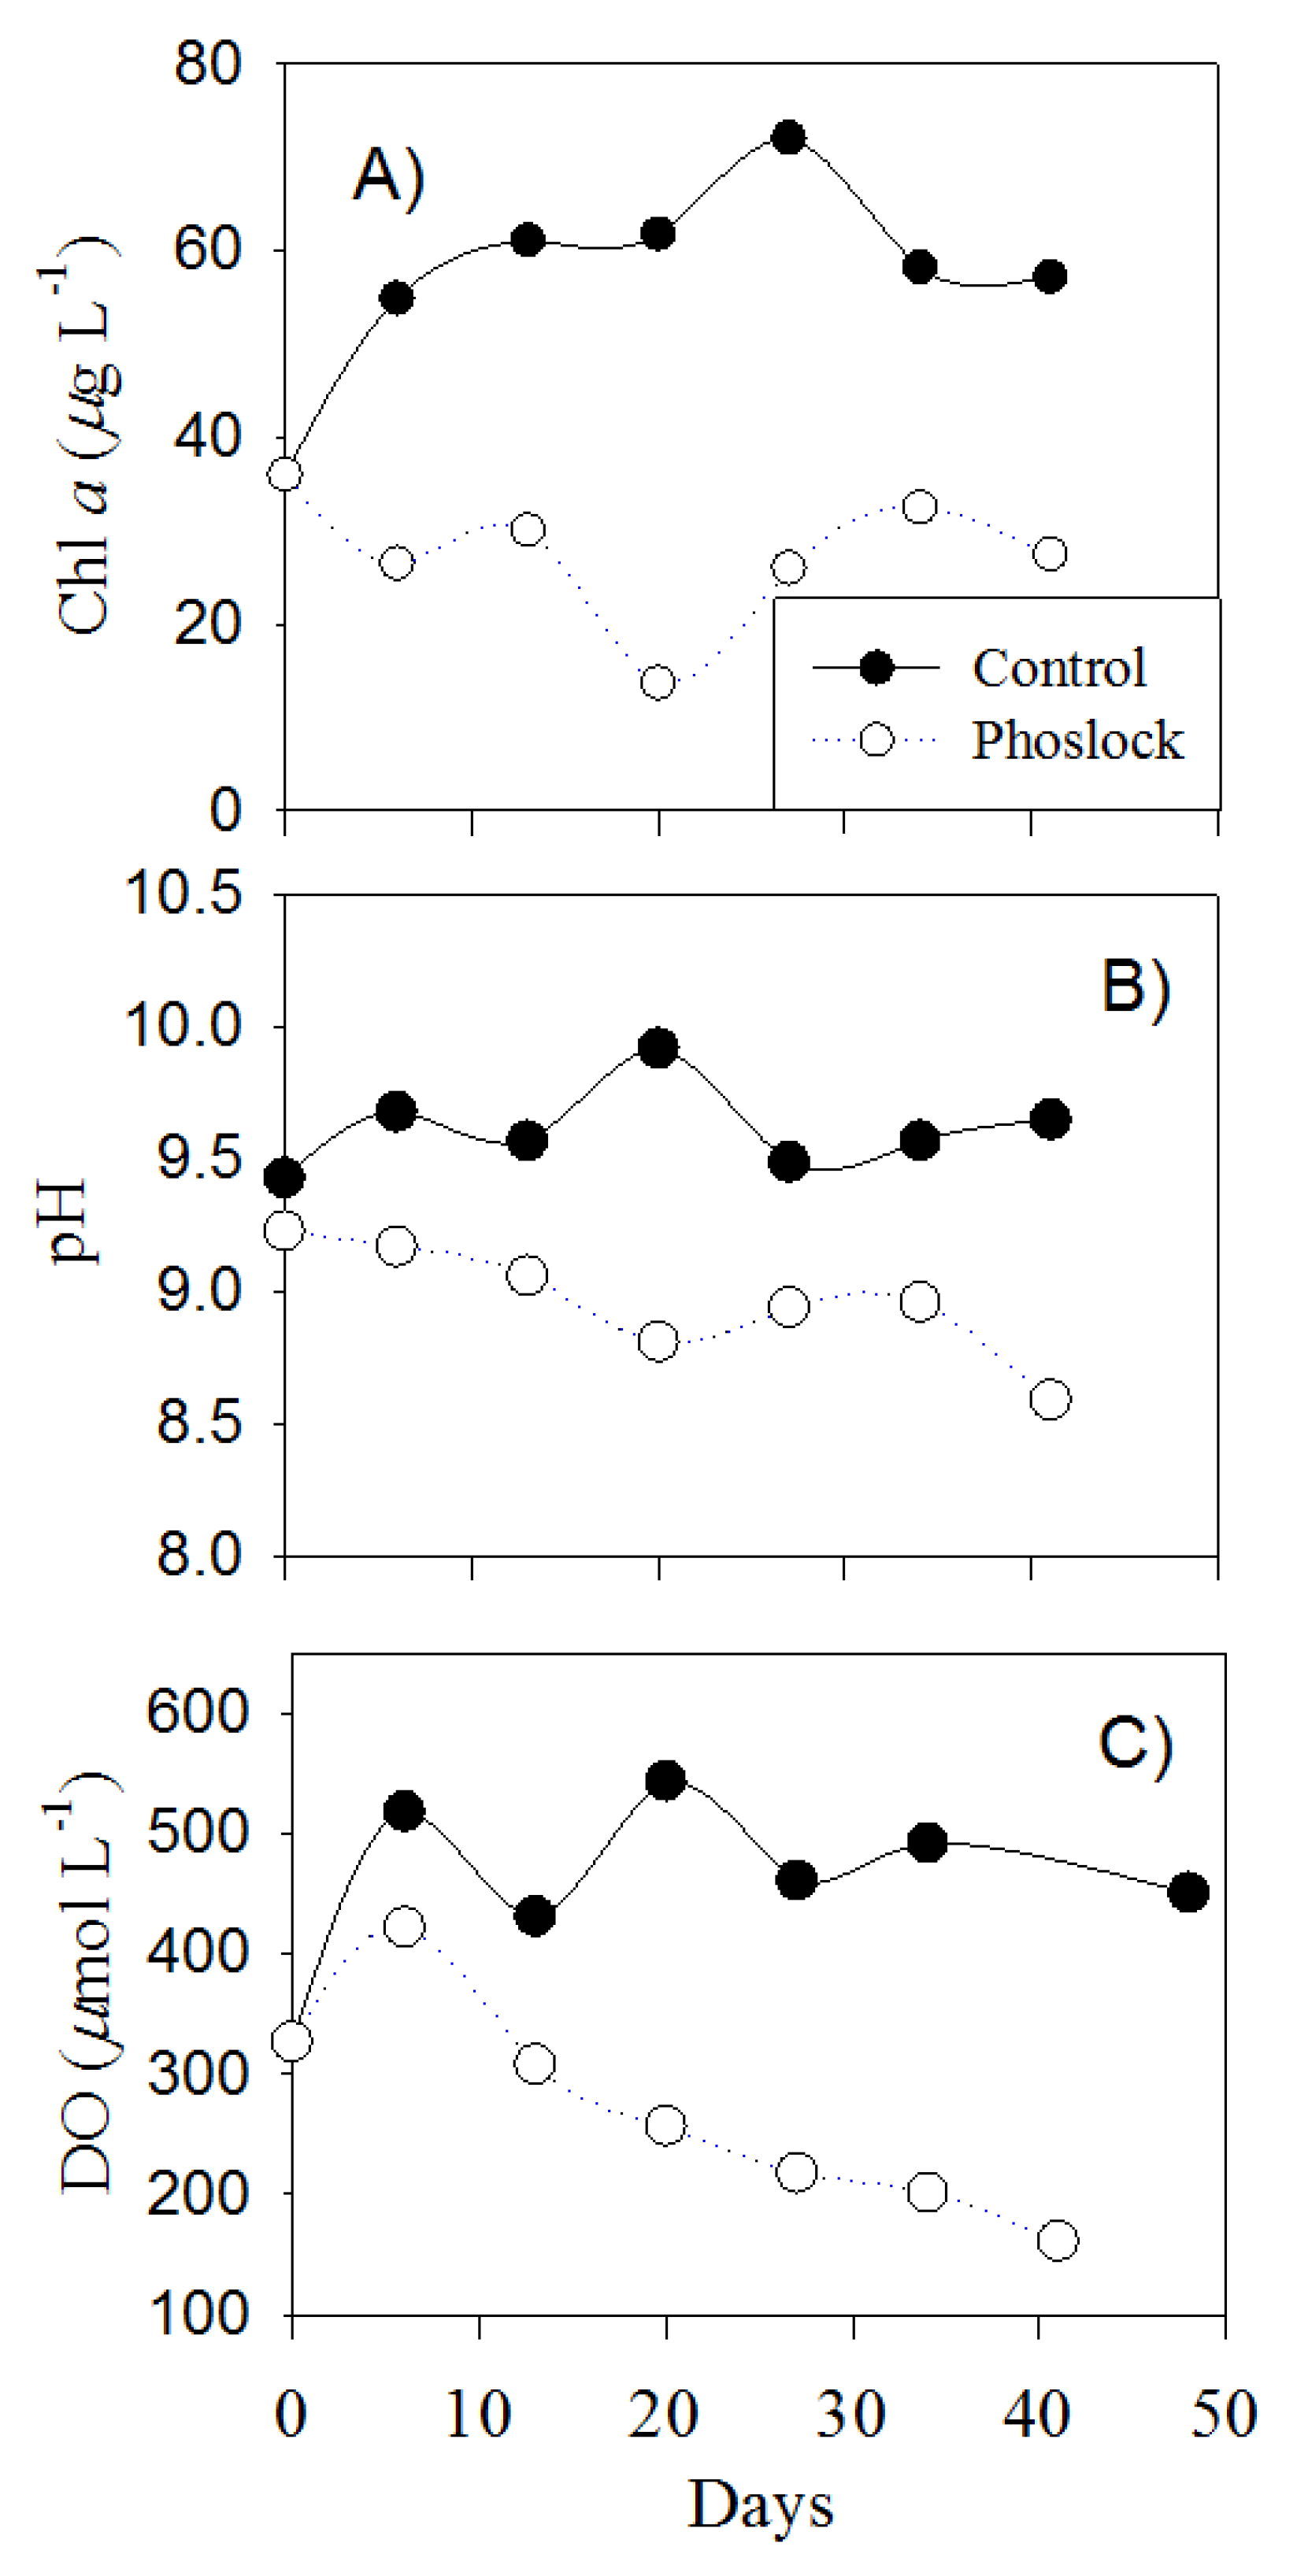
3.2. Lake Water Treated with Phoslock®

Before the experiments, the concentrations of SRP and Chl a were 5.4 µmol L−1 and 50 µg L−1, respectively (Table 1). In the lake water, both SRP and Chl a were sustained around the initial levels, with the pH rising from 9.5 to 10.2 and DO supersaturated (120–250%) in the days after the initiation of the experiment.
In the closed-bottom mesocosms, the SRP, Chl a, and pH decreased in all the mesocosms and remained low in the Phoslock®-treated water without additional nutrient input (Figure 2 and Figure 3). One day after the Phoslock® addition, the SRP concentrations decreased to 1.26 µmol L−1, 62.3% lower than the controls and 92% lower than the lake water (Figure 2). Over the next few days, the Chl a concentrations in the Phoslock®-treated mesocosms were 26–53% lower than the controls and 90–92% lower than the concentrations in the lake. In the Phoslock®-treated water, the pH decreased significantly from 9.5 to 7.4, while the pH increased from 8.9 to 9.9 in the nontreated control and from 9.42 to 9.97 in the lake water (Figure 3).

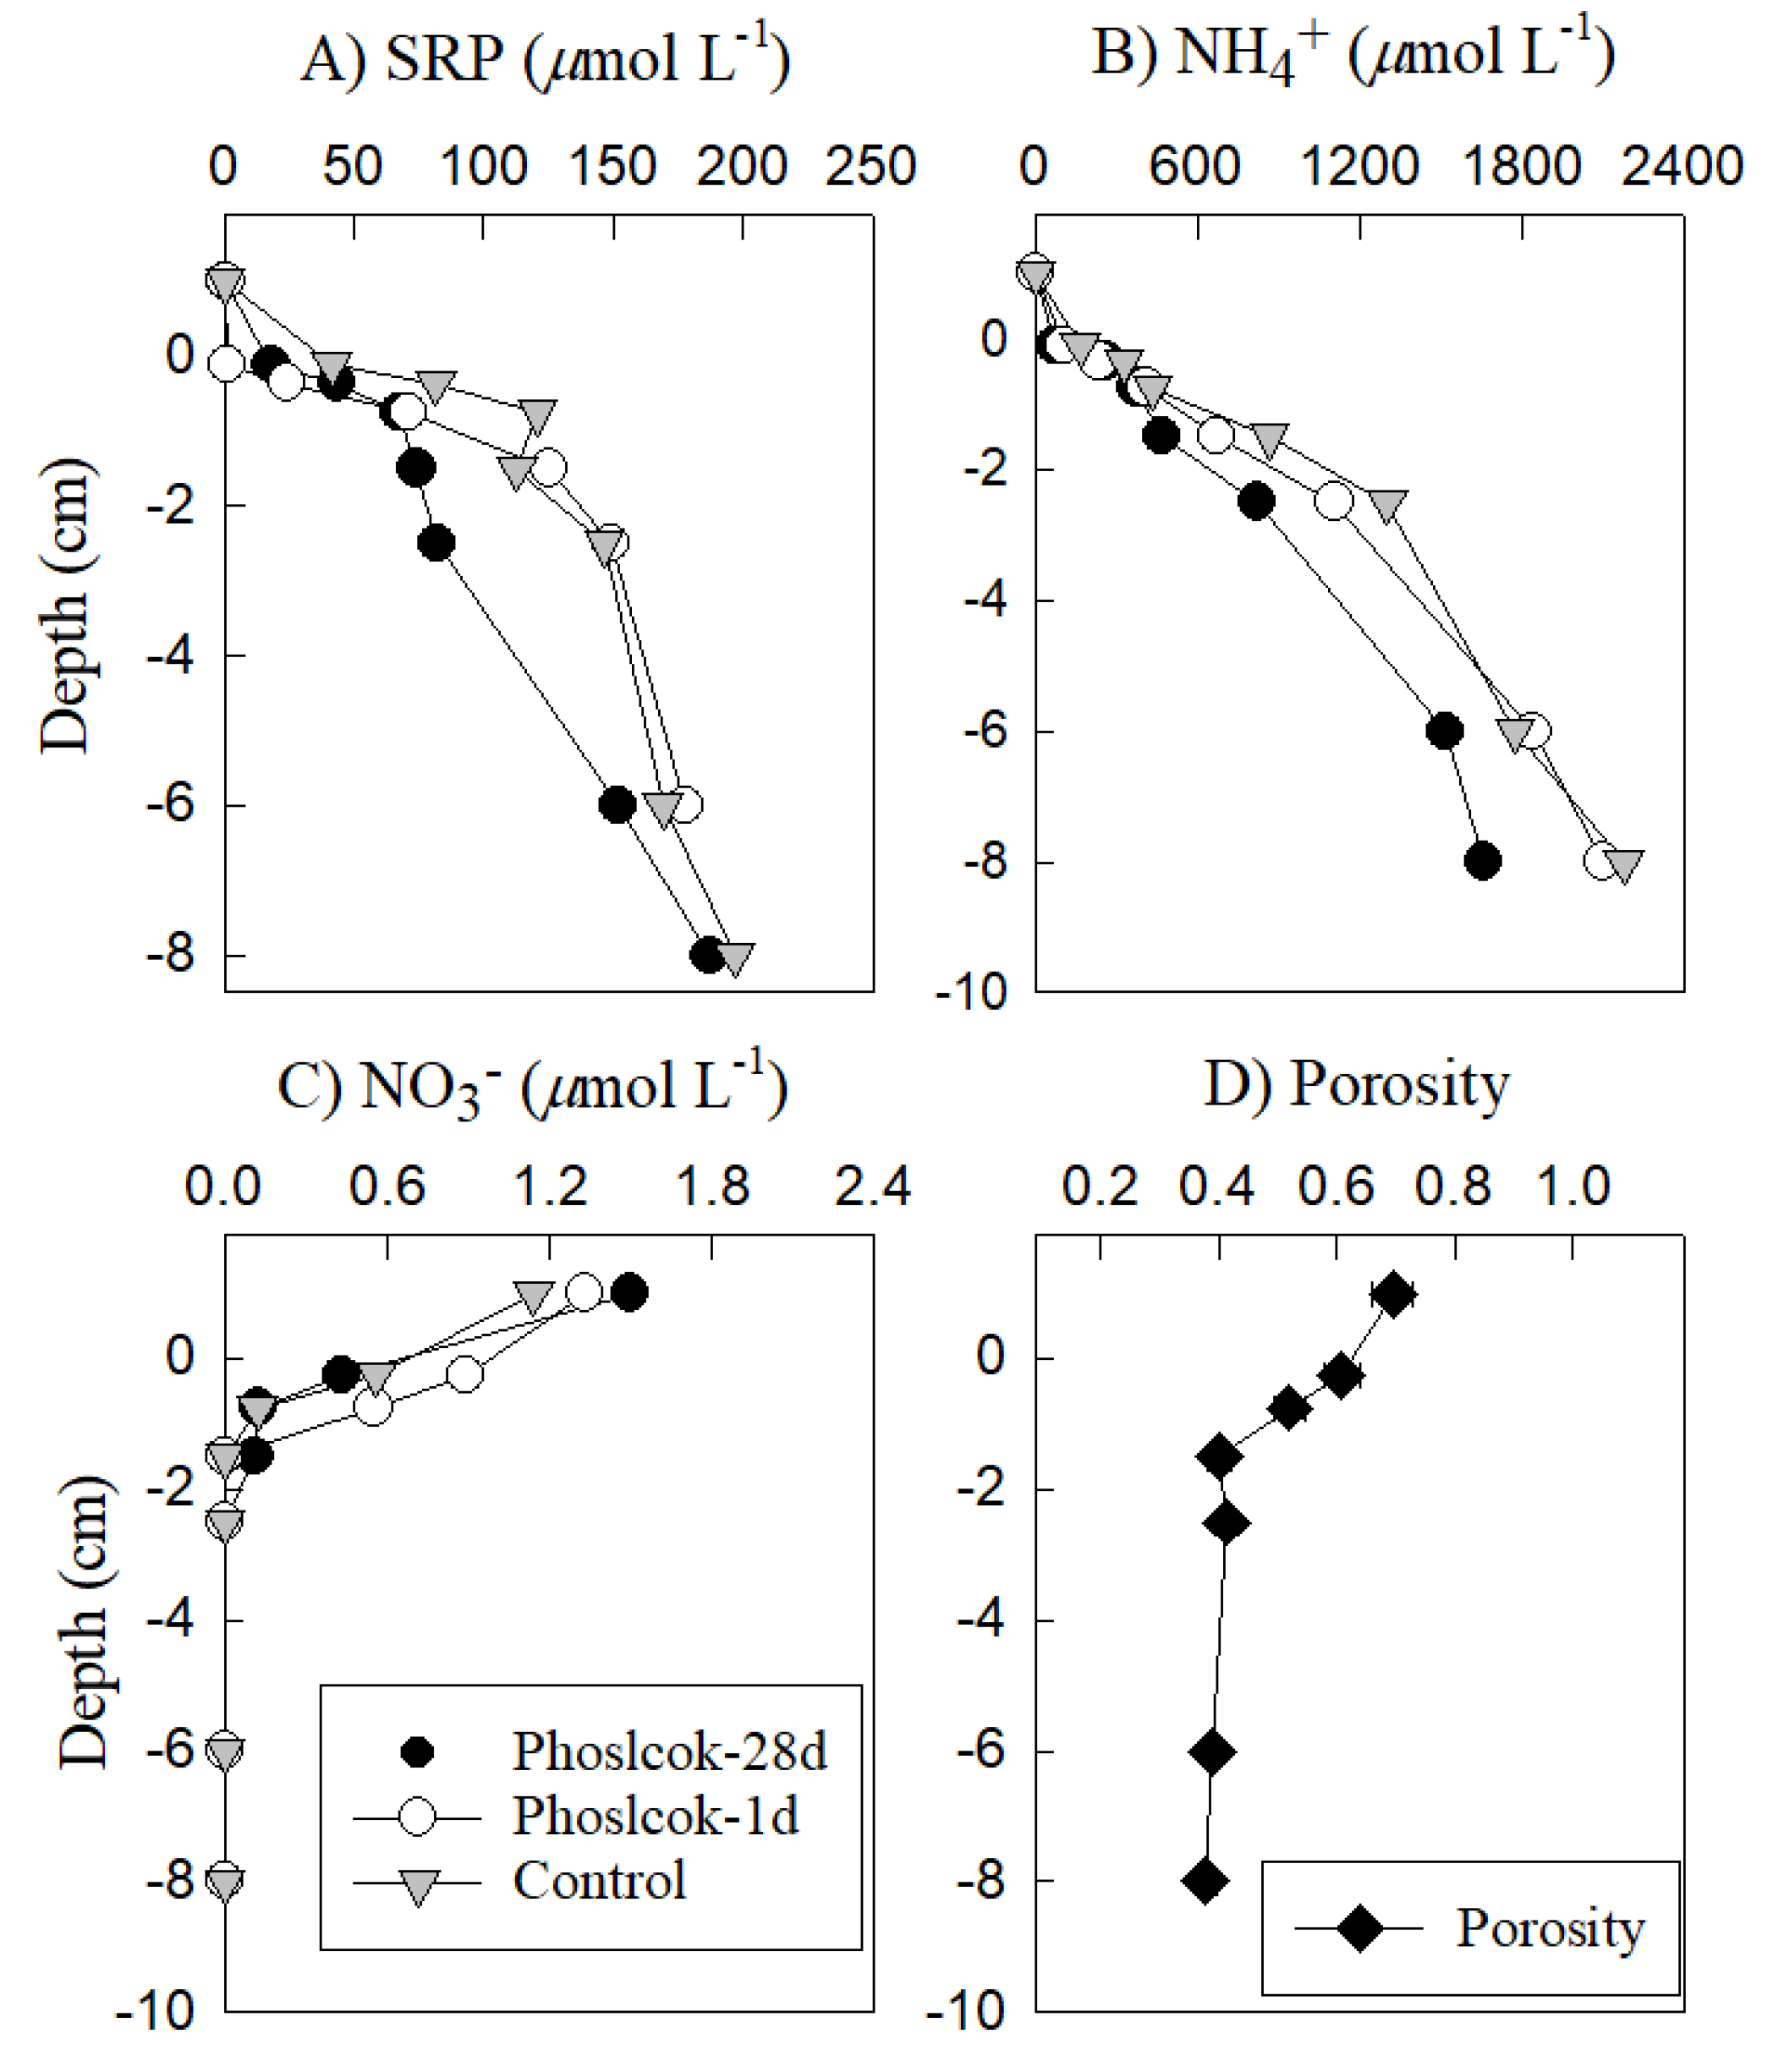
3.3. Sediment Pore Water Changes with Phoslock® Treatment

The pore water SRP concentrations increased to >150 μmol L−1 with the depth, with the steepest gradients in the top 2 cm. The impact of Phoslock® was dramatic at the sediment surface one day after Phoslock® application, with the pore water SRP at near-surface horizons reduced to near the detection limit (0.002 µmol L−1). The SRP gradient below this thin Phoslock® richlayer was barely affected (Figure 4A). In the long-term treatment, the pore water SRP concentrations in the Phoslock®-treated sediments exhibited the smallest concentration gradients (indicating a shift from soluble P to Phoslock®-bound P) within the 0~3-cm depth horizon. At 3 cm deep, the pore water SRP concentrations after a 28-day treatment were 72 µmol L−1, which was ~50% lower than the untreated samples and samples treated for a single day (150–156 µmol L−1, Figure 4A).
Although the pore water NH4+ (Figure 4B) increased gradually with the depth in all the sediment cores, the sediment capped by Phoslock® for 28 days exhibited the lowest concentration gradients down to 3 cm deep, with the concentrations remaining lower than the control and 1-d Phoslock® treatment. The concentrations of NO3 (Figure 4C) within all the sediment cores showed a sharp decrease from ~1.2 µmol L−1 in the overlying water to nearly undetectable at ~1 cm deep in the sediment, indicating a downward flux from the overlying water into the sediment. The porosity (Figure 4D) decreased from 0.7 to 0.4 from the sediment surface to ~2 cm deep.

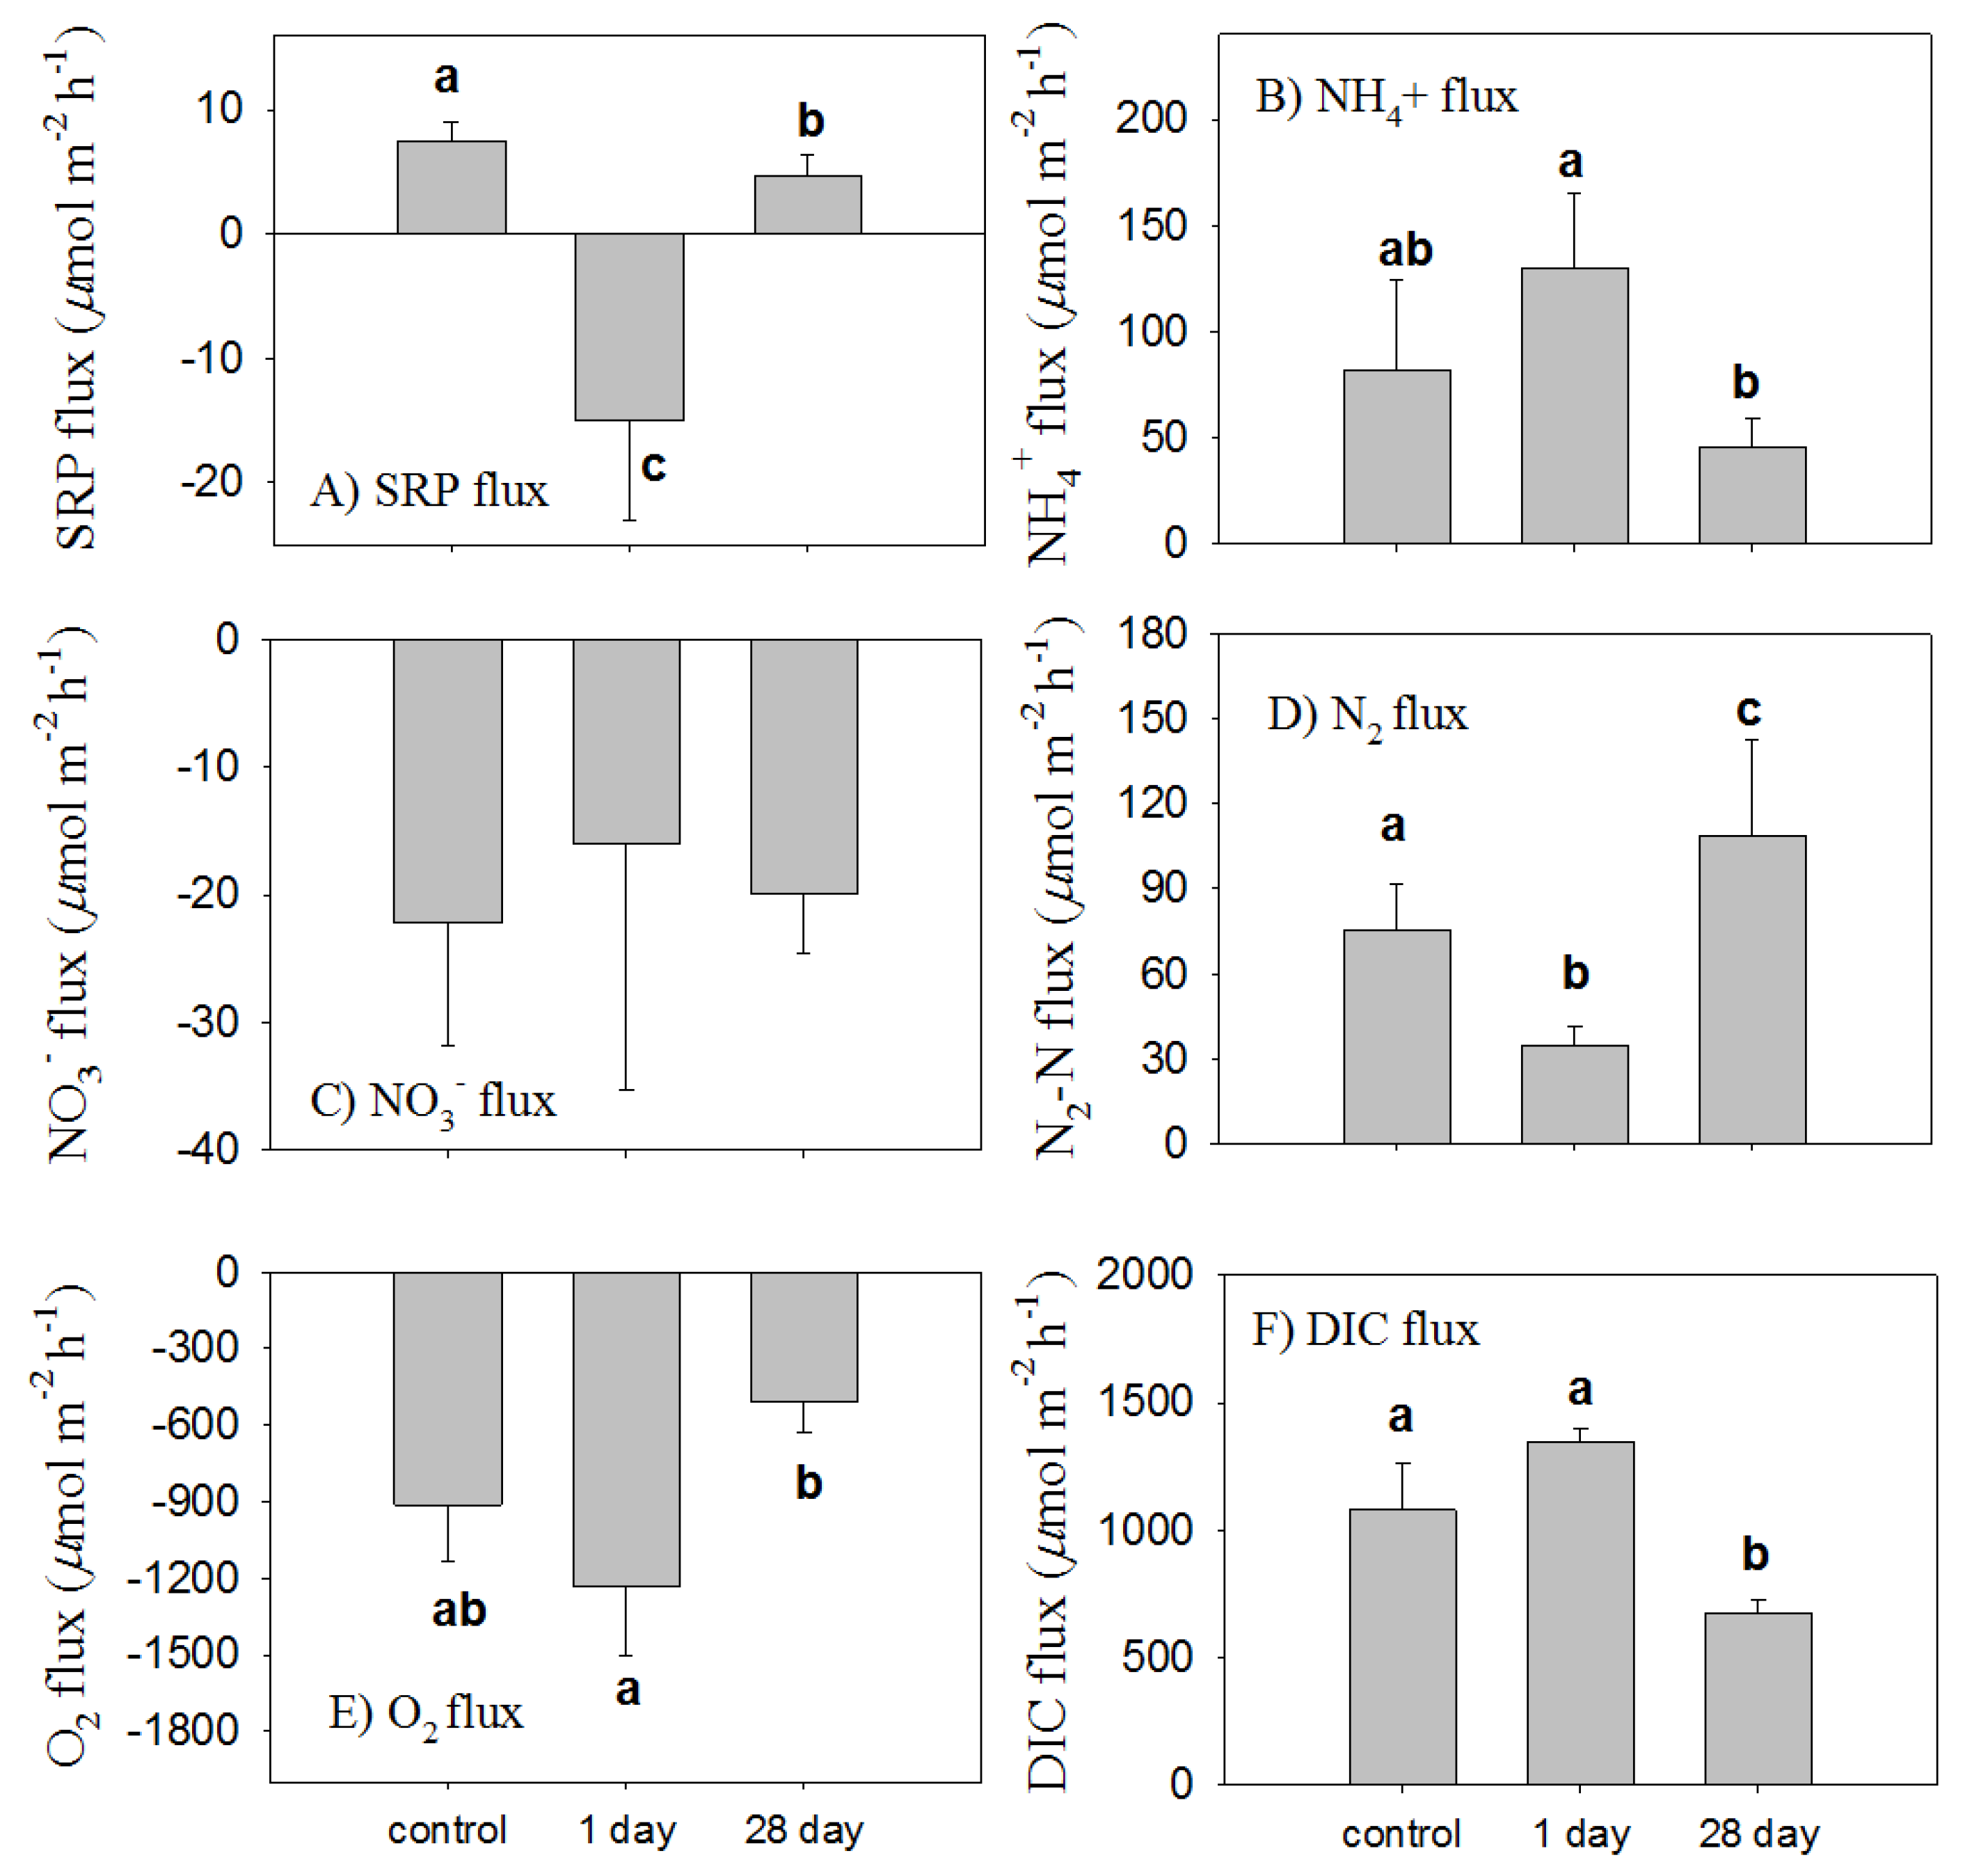
3.4. The Short-Term Effect of Phoslock® on Sediment Flux

The changes in the nutrient fluxes (Figure 5A) were consistent with the vertical profiles in the pore water (Figure 4A). In the short term, Phoslock® capping changed the N and P release from the sediments (Table 2). The Phoslock®-treated sediment cores were typified by a substantial P uptake (−15 µmol m−2 h−1) into the sediment (Figure 5A) in contrast to the P release (7.5 µmol m−2 h−1) in the untreated sediment.
In the control sediments, the fluxes of oxygen into the sediment averaged 911 µmol m−2 h−1 (Figure 5E, similar to the rates of DIC efflux (Figure 5F). Modest increases in the uptake of oxygen and efflux of DIC after 1 day of Phoslock® addition were not significant. After 28 days, the rates of oxygen uptake and DIC efflux decreased significantly; these data suggest a decreased loading of organic material leading to lower rates of sediment metabolism. An inverse relationship between the oxygen consumption rates and DIC effluxes (linear regression coefficient (k) of −1.21, p < 0.01, Figure 5E,F) was observed.
The fluxes of NH4+ (82 µmol m−2 h−1) and N2-N (75 µmol m−2 h−1) were the major sediment–water exchange terms in the N cycle (Figure 5B–D). Both suggested that overlying water NO3 was likely not the dominant source of N2-N production, and the coupled nitrification/denitrification was the dominant process. In terms of the N2-N loss to the total N fluxes, the denitrification efficiency accounted for 64.7%. While the uptake of NO3 did not change in the short-term and longer-term observations (Figure 5C), the fluxes of N2-N decreased significantly with the addition of Phoslock® to the core surface. Short-term Phoslock® additions increased the ammonium efflux, though not significantly; the average N2-N decrease (48 µmol m−2 h−1) was similar to the average NH4+ increase (58 µmol m−2 h−1). Since there was little change in the influx of NO3, these data suggest that short-term additions of Phoslock® suppressed nitrification.

3.5. Long-Term Changes in Sediment Fluxes through Phoslock® Capping

We compared the nutrient fluxes of sediments collected from the controls and the Phoslock®-treated open-bottomed limnocorral after 4 weeks (Figure 5). This comparison allowed us to assess whether the capping capacity was effective over longer time periods. The flux rates of SRP were 45% lower in the Phoslock®-treated sediments than in the controls (Figure 5A). Although the average NH4+ flux rates in the treated mesocosms were lower than the control rates after 28 days, the rates were not significantly different (Figure 5B): a slightly elevated NH4+ release after 1 d of Phoslock® treatment and a decline in the rates similar to the control rates by 28 days. The Phoslock® treatments did not significantly affect the benthic NO3 fluxes (Figure 5C). The denitrification rates were higher after the 28-day Phoslock® treatment than in the untreated controls or after 1 day in the treated samples (Figure 5D). The denitrification rates increased 44.5% relative to the observations in the untreated sediments and ~1.5-fold higher than the one-day capping. The denitrification efficiency at 28 days increased to 82.7% of the remineralized N. Relative to the control, the oxygen consumption rates and DIC flux rates decreased by 721-µmol O2 m−2 h−1 and 670-µmol C m−2 h−1, respectively (Figure 5E,F). Both illustrated a significant decrease in organic matter remineralization.

3.6. Water Column Changes after Phoslock® Treatment on Sediments

Without the Phoslock® treatments, cyanobacteria bloomed throughout the entire experiment period. The water column Chl a doubled, and the photosynthesis led to an elevated pH (9.5–10.2) and DO (400–580 µmol L−1, Figure 6). In the following days (days 10–50), the Chl a concentration (~24 µg L−1) in the treated samples remained 50% of the control’s (57 µg L−1).
The Phoslock® treatment and the lower P availability were accompanied by a lower cyanobacteria abundance and altered speciation (Figure 7). In the treated water, the total cell numbers declined from the initial abundance of 6.1 × 10⁶ cell mL−1 to 1.3 × 10⁵ cell mL−1 in late August (50 days after sediment treatment). During this time, the abundance of N2-fixing cyanobacteria (mainly Pseudanabaena sp., Lyngbya sp., and Chroococcus sp.) decreased from 220 × 106 cell mL−1 to 6.6 × 10⁴ cell mL−1. The abundance of Microcystis spp., the dominant non-N2-fixing species, was 2.8 × 10³ cell mL−1. These abundances were 23.5% and 6.2% of the numbers observed in the control water: 2.8 × 10⁵ cells mL−1 and 4.5 × 10⁵ cells mL−1 for the N2 fixers and non-N2-fixing cyanobacteria (e.g., Microcystis spp.), respectively.

4. Discussion

High nutrient loading, coupled with weak circulation and outflow and elevated summer temperatures, enhances the sedimentation and regeneration of N and P, along with their availability for phytoplankton uptake and subsequent growth in the lake. High P loading, coupled with nutrient sediment release, are the likely causal factors for cyanobacteria blooms in this shallow (<2 m) water. Based on the temperature profiles, the water was well-mixed. In response to N limitation throughout the summer (Table 2, N:P = 0.66), N2-fixing cyanobacteria (e.g., Anabaena spp.) dominated the lake ecosystem (unpublished data, MD DNR). Additionally present was a small fraction of non-N2-fixing cyanobacteria (e.g., Microcystis spp.).

4.1. Phoslock® Influences on Water Chemistry

The results of this study are consistent with the previous results from Phoslock® applications to wastewaters and eutrophic bloom waters [25,39]. The phosphate adsorption kinetics of Phoslock® suggests a rapid equilibrium (<60 min) and high removal efficiency, with faster equilibrium rates and higher adsorption capacity at higher temperatures [40]. Simultaneous algal uptake may account for part of the observed decrease in SRP. Nonetheless, 20–30% higher P removal in the treated waters than in the controls suggests strong Phoslock® adsorption. Elevated pH (>9) and DO (>100 µmol L−1) in the control groups resulted from intense photosynthetic carbon uptake and oxygen release. In contrast, the reduced P availability after the Phoslock® treatments resulted in reduced Chl a concentrations and photosynthesis, leading to a decrease in pH and DO.
Regardless of the other natural effects (e.g., phytoplankton P uptake), we assume all the decrease in the P concentrations in water is due to adsorption. We calculated the maximum phosphorus absorbed on Phoslock® from the reduction in P and the amount of absorbent. This value (~1.5 µmol-Pg−1) was far below saturation compared to the maximum adsorption capacities of ~100–140 µmol-Pg−1 [25], 255–330 µmol-Pg−1 [40], and 645 µmol-Pg−1 [29]. A large pool of ‘active’ P-bonding sites may have remained on the added Phoslock® after sedimentation.

4.2. Changes in Sediment Fluxes One Day after Phoslock® Addition

Once set on the sediment surface, Phoslock® acted as a capping reagent to cover the lake sediment, blocking SRP release from the sediment into the water column. The thickness of the capping layer was ~1.5 mm, similar to the depth noted by Vopel et al. (2008) [41] for the application of 135–700-g m−2 Phoslock®. Their microelectrode measurements revealed that Phoslock® hindered DO penetration into the sediment and raised the location of the oxic–anoxic interface from several millimeters below the natural sediments into the capping layer. This was associated with a decrease in pH, ~0.5–1 units lower at the initial sediment surface (now below the sedimented Phoslock® layer) than the topmost Phoslock® layer [41]. These changes, in turn, exerted temporal influences on the P release and N cycling in the sediments.
Normally, phosphorus from organic matter degradation in sediments is released into pore water [42]. It then diffuses upward into the oxic sediment surface, where it can be sequestered by iron oxides. However, Phoslock® has a much stronger adsorption capacity than the natural oxic layer of the sediments, leading to a reduction in SRP fluxes across the sediment–water interface [43,44]. Moreover, pH decreases also favor the Phoslock®-binding efficiency.
As the pH decreased from 9.4 to 7.3 as the phytoplankton reduced after treatment, the main phosphate species changed from HPO42− to H2PO4. As well, the lanthanum in Phoslock® was converted from insoluble La(OH)3 to La(OH) 2+, which can absorb more phosphorus [40]. Vertically, the sediment pH decreased from >9 at the sediment–water interface to ~6 within the sediments during bloom progression [33,45]. This change would raise the P adsorption capacity by 30% [25,41]. The adsorption of SRP on Phoslock®, derived either from the bioavailable P in the water or P intercepted as it diffuses upward in the pore water, may cause a net P sequestration and sink in the sediments.
The redox environment is a key determinant in biogeochemical N cycling. A portion of the NH4+ regenerated from organic matter decomposition is oxidized to NO3 (nitrification) in the upper few millimeters of the sediment before escaping from the sediment [42,46,47]. Denitrification occurs anaerobically below the oxic layer, where the NO3 or NO2 from nitrification serves as a terminal electron acceptor [48].
After the Phoslock® addition, remineralized N was increasingly released as NH4+ rather than N2 via the nitrification–denitrification process. The condensed Phoslock® slightly slowed the oxygen penetration from the overlying water; thus, a thinner oxic layer may further reduce the possibility for ammonium oxidation (nitrification) and may explain the enhanced NH4+ flux rates. Moreover, one day maybe not be sufficient for denitrifying bacteria to populate near the new oxic–anoxic boundary in the sediment, especially within the organic matter-poor Phoslock® layer [49].

4.3. Long-Term Changes in Sediment Fluxes after Adding Phoslock®

The long-term changes of the SRP pore water profiles and flux rates were consistent with previous studies. Meis et al. [50] reported that La, the main P-binding element in Phoslock®, can be vertically transported by bioturbation or wind-induced sediment resuspension and, thus, disperse La into the top 0–4 cm or even deeper into the sediments one month after Phoslock® is applied. In this study, after Phoslock® was introduced, and the observed concentrations of the pore water SRP were reduced within the top 2 cm sediments where the porosities were larger than the deeper sediments, reflecting either the downward movement of Phoslock® over time or the depuration of diffusive P via enhanced adsorption. This may lead to a decrease of the pore water phosphate concentration at the top of the sediment column by absorbing the labile P (e.g., from pore water and loosely bound P on sediment particles) and forming a refractory P fraction [50]. Moreover, the decreased pH from >9.5 to ~8 in the water after long-term treatment, coupled with the further decrease in the sediment to pH < 7 by adding a Phoslock® layer, led to a better affinity of Phoslock® to monovalent dihydrogen phosphate and a reduction in the SRP flux rates [25,40].
In response to long-term capping, diminished phytodetritus sedimentation and pH may contribute to the reduced NH4+ flux and enhance the N2 release. In the Phoslock®-treated limnocorral, the diminished biomass may reduce the accumulation of phytodetritus on the sediment surface. The decreased rates of oxygen uptake and DIC efflux are consistent with this. Conversely, in the controls, the enriched organic matter may result in faster nutrient fluxes and more rapid rates of respiration [51,52].
In lakes, the penetration of high pH from the overlying water into sediments may decrease P adsorption to Fe-oxides and enhance the total ammonium (NH4+ and NH3) diffusion gradients, elevating fluxes of both P and N [19]). A high pH (9–9.5) can inhibit nitrifying bacteria activity [53], nitrification efficiency [54], and N2 loss through denitrification [33,55]. Moreover, bentonite contributes ~95% of the material in Phoslock® [43]. It may reduce the NH4+ release via adsorption and impact the downstream nitrogen fluxes. Bentonite particles display a negative charge at a wide range of ion strength and pH (4–9) [56] and are used to absorb NH4+ in soil and groundwater [57]. Absorbed NH4+ is theoretically considered as a substrate for nitrification [58], and the anoxic habitats after administration may favor denitrifying bacteria [59]. The remediation-related changes, together with the weak pH penetration, likely enhance the N2 loss from ecosystems.

4.4. Ecological Response due to Phoslock®

In the long-term incubation, the positive feedback was built up after the Phoslock® application for the first ~20 days. With the N2-fixing capacity in N-limited conditions, diazotrophs have a relatively stronger demand for P than N from ambient water. After remediation, P removal from water tended to reduce the bioavailable P, which limited the cyanobacteria growth. The pH fell from abnormally high (>9) to ~8, diminishing the release of sedimentary phosphate driven by high pH [19]. Although no direct measurements were made in this study, diazotrophic cyanobacteria have been shown to maintain the ambient phytoplankton communities by releasing fixed N [16,60]. The loss of N2-fixers, combined with a limited DIN release from the sediments, may finally cause bloom cessation.
Based on the SRP flux measurements in the field (~10 µmol m−2 h−1) and the P-binding capacity from 20-g P/kg Phoslock® [29] to 50-g P/kg Phoslock® [61], the amount applied in this experiment would have reached saturation in 20–50 days if the P capping was completely efficient and the external inputs were reduced. Comprehensive assessments of both the pH and oxic–anoxic effects on nutrient diffusion and P adsorption–desorption in the sediments should be further conducted to optimize the amount and frequency of Phoslock® treatment to manage the environmental effects of cyanobacteria blooms.

5. Conclusions

In this study, the addition of Phoslock® lowered the dissolved P concentration and mitigated the CyanoHABs. Phoslock® rapidly and efficiently adsorbed SRP and reduced the cyanobacterial populations. Phoslock®-capped sediments served as a barrier to slow P diffusion from the sediments into the overlying waters. At the same time, the postulated upward movement of the oxic–anoxic interface through the sediment column slightly enhanced the NH4+ release and temporarily inhibited the cycle of nitrification and denitrification, with denitrification reaching the highest rates 4 weeks after treatment. Phoslock® additions, together with reduced pH and organic matter sedimentation, created a positive feedback loop to reduce the internal nutrient input from the sediment into the water and promoted nitrogen loss associated with coupled nitrification and denitrification.
CyanoHABs pose huge problems globally, now exacerbated by increasing water temperatures, population increases, and food production that deliver increasing nutrients to fresh and marine waters. Phoslock® is one technology that prevent blooms, as its role is to bind soluble P and limit blooms. It works well when the external P supplies are eliminated but can saturate quickly if the watershed loads of P remain high. Hence, external loads determine Phoslock®’s efficacy, with repeated and costly applications if the external P supplies remain substantial. However, reducing the P (and N) loads in watersheds is extremely costly, as land use changes must occur. That requirement curtails the effective prevention of blooms, as modifying sufficient land areas to reduce nutrient supplies remains beyond most community’s fiscal resources, political will, and land access. For internal P, dredging is also costly and suffers from the same problem, i.e., can external P loads be curtailed? The direct intervention of CyanoHABs is often pursued, with short-term success for small-to-medium-sized ponds, lakes, and reservoirs. Some interventions can persist for years (e.g., granular peroxide control of Planktothrix agardhii, Lake Anita Louise, MD, USA [62]); others are effective at annual intervals (e.g., barley straw application for Microcystis in Lake Williston, MD, USA [63]), while others have short-to-long-term efficacies (e.g., clay flocculation and sediment capping [64]). The costs for these relative to Phoslock® are clays > Phoslock® > peroxide >> barley straw. For additional detail, see the reviews by Anderson et al. [65] and Sellner and Rensel [66], as well as a list and review of the many methods, strategies, and technologies at https://hcb-1.itrcweb.org/(accessed on 12 December 2021).

Author Contributions

Conceptualization, K.S. and A.P.; methodology, Y.G. and J.C.; validation, J.L. and Y.G.; investigation, Y.G.; data curation, Y.G.; writing—original draft preparation, Y.G. and J.L.; writing—review and editing, J.L.; supervision, K.S. and A.P.; and funding acquisition, K.S. and A.P. All authors have read and agreed to the published version of the manuscript.

Funding

This research was funded by NOAA, the Prevention, Control, and Mitigation (PCM) of Harmful Algal Blooms program, grant number NA10NOS4780154.

Institutional Review Board Statement

Not applicable.

Informed Consent Statement

Not applicable.

Acknowledgments

We thank Walter Butler from the Maryland Department of Natural Resources (MD DNR) for cell enumeration and cyanobacteria identification and Mike Owens and Todd Kana from the University of Maryland Center for Environmental Science for their technical support. We thank the National Aquarium at Baltimore for the nutrient analysis. We also thank the support from Shanghai Frontiers Science Center of Polar Science (SCOPS).

Conflicts of Interest

The authors declare no conflict of interest.

References

  1. Svirčev, Z.; Lalić, D.; Savić, G.B.; Tokodi, N.; Backović, D.D.; Chen, L.; Meriluoto, J.; Codd, G.A. Global geographical and historical overview of cyanotoxin distribution and cyanobacterial poisonings. Arch. Toxicol. 2019, 93, 2429–2481. [Google Scholar] [CrossRef]
  2. Huisman, J.; Codd, G.A.; Paerl, H.W.; Ibelings, B.W.; Verspagen, J.M.H.; Visser, P.M. Cyanobacterial blooms. Nat. Rev. Genet. 2018, 16, 471–483. [Google Scholar] [CrossRef] [PubMed]
  3. Codd, G.A.; Morrison, L.F.; Metcalf, J. Cyanobacterial toxins: Risk management for health protection. Toxicol. Appl. Pharmacol. 2005, 203, 264–272. [Google Scholar] [CrossRef] [PubMed]
  4. Raven, J.A.; Gobler, C.J.; Hansen, P.J. Dynamic CO2 and pH levels in coastal, estuarine, and inland waters: Theoretical and observed effects on harmful algal blooms. Harmful Algae 2020, 91, 101594. [Google Scholar] [CrossRef] [PubMed]
  5. Michalak, A.M.; Anderson, E.J.; Beletsky, D.; Boland, S.; Bosch, N.S.; Bridgeman, T.B.; Chaffin, J.D.; Cho, K.; Confesor, R.; Daloğlu, I.; et al. Record-setting algal bloom in Lake Erie caused by agricultural and meteorological trends consistent with expected future conditions. Proc. Natl. Acad. Sci. USA 2013, 110, 6448–6452. [Google Scholar] [CrossRef] [PubMed] [Green Version]
  6. Najjar, R.G.; Pyke, C.R.; Adams, M.B.; Breitburg, D.; Hershner, C.; Kemp, M.; Howarth, R.; Mulholland, M.R.; Paolisso, M.; Secor, D.; et al. Potential climate-change impacts on the Chesapeake Bay. Estuarine Coast. Shelf Sci. 2010, 86, 1–20. [Google Scholar] [CrossRef]
  7. Schindler, D.W.; Hecky, R.E.; Findlay, D.L.; Stainton, M.P.; Parker, B.R.; Paterson, M.J.; Beaty, K.G.; Lyng, M.; Kasian, S.E.M. Eutrophication of lakes cannot be controlled by reducing nitrogen input: Results of a 37-year whole-ecosystem experiment. Proc. Natl. Acad. Sci. USA 2008, 105, 11254–11258. [Google Scholar] [CrossRef] [Green Version]
  8. Zehr, J.P.; Capone, D.G. Changing perspectives in marine nitrogen fixation. Science 2020, 368, 729. [Google Scholar] [CrossRef] [PubMed]
  9. Bonnet, S.; Biegala, I.C.; Dutrieux, P.; Slemons, L.O.; Capone, D.G. Nitrogen fixation in the western equatorial Pacific: Rates, diazotrophic cyanobacterial size class distribution, and biogeochemical significance. Glob. Biogeochem. Cycles 2009, 23, 23. [Google Scholar] [CrossRef] [Green Version]
  10. Paerl, H.W.; Hall, N.S.; Calandrino, E.S. Controlling harmful cyanobacterial blooms in a world experiencing anthropogenic and climatic-induced change. Sci. Total. Environ. 2011, 409, 1739–1745. [Google Scholar] [CrossRef]
  11. Paerl, H.W.; Gardner, W.S.; Havens, K.E.; Joyner, A.R.; McCarthy, M.J.; Newell, S.; Qin, B.; Scott, J.T. Mitigating cyanobacterial harmful algal blooms in aquatic ecosystems impacted by climate change and anthropogenic nutrients. Harmful Algae 2016, 54, 213–222. [Google Scholar] [CrossRef] [PubMed] [Green Version]
  12. O’Neil, J.; Davis, T.; Burford, M.; Gobler, C. The rise of harmful cyanobacteria blooms: The potential roles of eutrophication and climate change. Harmful Algae 2012, 14, 313–334. [Google Scholar] [CrossRef]
  13. Liu, W.; Xu, Z.; Long, Y.; Feng, M. Replenishment of urban landscape ponds with reclaimed water: Spatiotemporal variations of water quality and mechanism of algal inhibition with alum sludge. Sci. Total. Environ. 2021, 790, 148052. [Google Scholar] [CrossRef]
  14. Hilt, S.; Brothers, S.; Jeppesen, E.; Veraart, A.; Kosten, S. Translating Regime Shifts in Shallow Lakes into Changes in Ecosystem Functions and Services. Bioscience 2017, 67, 928–936. [Google Scholar] [CrossRef]
  15. Hupfer, M.; Reitzel, K.; Kleeberg, A.; Lewandowski, J. Long-term efficiency of lake restoration by chemical phosphorus precipitation: Scenario analysis with a phosphorus balance model. Water Res. 2016, 97, 153–161. [Google Scholar] [CrossRef]
  16. Wang, C.; Yang, Y.; Yang, B.; Lin, H.; Miller, T.R.; Newton, R.J.; Guo, L. Causal relationship between alkaline phosphatase activities and phosphorus dynamics in a eutrophic coastal lagoon in Lake Michigan. Sci. Total. Environ. 2021, 787, 147681. [Google Scholar] [CrossRef]
  17. Boynton, W.; Garber, J.H.; Summers, R.; Kemp, W.M. Inputs, Transformations, and Transport of Nitrogen and Phosphorus in Chesapeake Bay and Selected Tributaries. Estuaries 1995, 18, 285–314. [Google Scholar] [CrossRef]
  18. Brandes, J.A.; Devol, A.A.H.; Deutsch, C. New Developments in the Marine Nitrogen Cycle. Chem. Rev. 2007, 107, 577–589. [Google Scholar] [CrossRef]
  19. Seitzinger, S.P. The effect of pH on the release of phosphorus from Potomac estuary sediments: Implications for blue-green algal blooms. Estuar. Coast. Shelf Sci. 1991, 33, 409–418. [Google Scholar] [CrossRef]
  20. Kemp, W.M.; Boynton, W.; Adolf, J.E.; Boesch, D.F.; Boicourt, W.C.; Brush, G.; Cornwell, J.; Fisher, T.R.; Glibert, P.; Hagy, J.D.; et al. Eutrophication of Chesapeake Bay: Historical trends and ecological interactions. Mar. Ecol. Prog. Ser. 2005, 303, 1–29. [Google Scholar] [CrossRef]
  21. Roden, E.E.; Edmonds, J.W. Phosphate mobilization in iron-rich anaerobic sediments: Microbial Fe (III) oxide reduction versus iron-sulfide formation. Archiv für Hydrobiologie 1997, 139, 347–378. [Google Scholar] [CrossRef]
  22. Hickey, C.W.; Gibbs, M.M. Lake sediment phosphorus release management—Decision support and risk assessment framework. New Zealand J. Mar. Freshw. Res. 2009, 43, 819–856. [Google Scholar] [CrossRef] [Green Version]
  23. Diatloff, E.; Asher, C.J.; Smith, F.W. Use of GEOCHEM-PC to predict rare earth element (REE) species in nutrient solutions. Plant Soil 1993, 155, 251–254. [Google Scholar] [CrossRef]
  24. Firsching, F.H.; Burne, S.N. Solubility products of the trivalent rare-earth phosphates. J. Chem. Eng. Data 1991, 36, 93–95. [Google Scholar] [CrossRef]
  25. Ross, G.; Haghseresht, F.; Cloete, T. The effect of pH and anoxia on the performance of Phoslock®, a phosphorus binding clay. Harmful Algae 2008, 7, 545–550. [Google Scholar] [CrossRef]
  26. Burns, N.; McIntosh, J.; Scholes, P. Managing the lakes of the Rotorua District, New Zealand. Lake Reserv. Manag. 2009, 25, 284–296. [Google Scholar] [CrossRef] [Green Version]
  27. Ding, S.; Sun, Q.; Chen, X.; Liu, Q.; Wang, D.; Lin, J.; Zhang, C.; Tsang, D.C. Synergistic adsorption of phosphorus by iron in lanthanum modified bentonite (Phoslock®): New insight into sediment phosphorus immobilization. Water Res. 2018, 134, 32–43. [Google Scholar] [CrossRef]
  28. Lürling, M.; Tolman, Y. Effects of lanthanum and lanthanum-modified clay on growth, survival and reproduction of Daphnia magna. Water Res. 2010, 44, 309–319. [Google Scholar] [CrossRef]
  29. Gibbs, M.M.; Hickey, C.W.; Özkundakci, D. Sustainability assessment and comparison of efficacy of four P-inactivation agents for managing internal phosphorus loads in lakes: Sediment incubations. Hydrobiology 2010, 658, 253–275. [Google Scholar] [CrossRef]
  30. Van Oosterhout, F.; Lürling, M. The effect of phosphorus binding clay (Phoslock®) in mitigating cyanobacterial nuisance: A laboratory study on the effects on water quality variables and plankton. Hydrobiology 2012, 710, 265–277. [Google Scholar] [CrossRef] [Green Version]
  31. Su, L.; Zhong, C.; Gan, L.; He, X.; Yu, J.; Zhang, X.; Liu, Z. Effects of Lanthanum Modified Bentonite and Polyaluminium Chloride on the Environmental Variables in the Water and Sediment Phosphorus Form in Lake Yanglan, China. Water 2021, 13, 1947. [Google Scholar] [CrossRef]
  32. Gao, Y.; Cornwell, J.C.; Stoecker, D.K.; Owens, M.S. Effects of cyanobacterial-driven pH increases on sediment nutrient fluxes and coupled nitrification-denitrification in a shallow fresh water estuary. Biogeosciences 2012, 9, 2697–2710. [Google Scholar] [CrossRef] [Green Version]
  33. Kana, T.M.; Sullivan, M.B.; Cornwell, J.C.; Groszkowski, K.M. Denitrification in estuarine sediments determined by membrane inlet mass spectrometry. Limnol. Oceanogr. 1998, 13, 334–339. [Google Scholar] [CrossRef] [Green Version]
  34. Kana, T.M.; Darkangelo, C.; Hunt, M.D.; Oldham, J.B.; Bennett, G.E.; Cornwell, J. Membrane Inlet Mass Spectrometer for Rapid High-Precision Determination of N2, O2, and Ar in Environmental Water Samples. Anal. Chem. 1994, 66, 4166–4170. [Google Scholar] [CrossRef]
  35. Parsons, T.R.; Maita, Y.; Lalli, C.M. A Manual of Chemical and Biological Methods for Seawater Analysis, 2nd ed.; Parsons, T.R., Ed.; Pergamon Press: New York, NY, USA, 1984; p. 178. [Google Scholar]
  36. Kopp, J.F.; McKee, G.D. Methods for Chemical Analysis of Water and Wastes; United States Environmental Protection Angency (EPA): Cincinnati, OH, USA, 1983.
  37. Folk, R.L. Sediment grain size analysis. In Petrology of Sedimentary Rocks; Folk, R.L., Ed.; Hemphill Publishing Co.: Austin, TX, USA, 1974; pp. 3–5. [Google Scholar]
  38. Boudreau, B.P. Diagenetic Models and Their Implementation: Modeling Transport and Reactions in Aquatic Sediments; Springer: New York, NY, USA, 1997. [Google Scholar]
  39. Kaczorkiewicz, M.; Heese, T. Recultivation of Lake Goldap. New application of Phoslock sorbent. Przem. Chem. 2008, 87, 479–481. [Google Scholar]
  40. Haghseresht, F.; Wang, S.; Do, D. A novel lanthanum-modified bentonite, Phoslock, for phosphate removal from wastewaters. Appl. Clay Sci. 2009, 46, 369–375. [Google Scholar] [CrossRef]
  41. Vopel, K.; Gibbs, M.; Hickey, C.W.; Quinn, J. Modification of sediment—water solute exchange by sediment-capping materials: Effects on O2 and pH. Mar. Freshw. Res. 2008, 59, 1101–1110. [Google Scholar] [CrossRef]
  42. Heggie, D.T.; Logan, G.A.; Smith, C.S.; Fredericks, D.J.; Palmer, D. Biogeochemical processes at the sediment–water interface, Bombah Broadwater, Myall Lakes. Hydrobiology 2008, 608, 49–67. [Google Scholar] [CrossRef]
  43. Lürling, M.; Faassen, E.J. Controlling toxic cyanobacteria: Effects of dredging and phosphorus-binding clay on cyanobacteria and microcystins. Water Res. 2012, 46, 1447–1459. [Google Scholar] [CrossRef]
  44. Robb, M.; Greenop, B.; Goss, Z.; Douglas, G.; Adeney, J. Application of PhoslockTM, an innovative phosphorus binding clay, to two Western Australian waterways: Preliminary findings. Hydrobiology 2003, 494, 237–243. [Google Scholar] [CrossRef]
  45. Bailey, E.; Owens, M.; Boynton, W.; Cornwell, J. Sediment Phosphorus Flux: pH Interaction in the Tidal Freshwater Potomac River Estuary; UMCES Report TS-505-08-CBL; Interstate Commission on the Potomac River Basin: Rockville, MD, USA, 2006; pp. 1–91. [Google Scholar]
  46. Petersen, N.R.; Rysgaard, S.; Nielsen, L.P.; Revsbech, N.P. Diurnal variation of denitrification and nitrification in sediments colonized by benthic microphytes. Limnol. Oceanogr. 1994, 39, 573–579. [Google Scholar] [CrossRef]
  47. Magalhães, C.; Bordalo, A.; Wiebe, W. Temporal and spatial patterns of intertidal sediment-water nutrient and oxygen fluxes in the Douro River estuary, Portugal. Mar. Ecol. Prog. Ser. 2002, 233, 55–71. [Google Scholar] [CrossRef] [Green Version]
  48. Cornwell, J.; Kemp, W.M.; Kana, T.M. Denitrification in coastal ecosystems: Methods, environmental controls, and ecosystem level controls, a review. Aquat. Ecol. 1999, 33, 41–54. [Google Scholar] [CrossRef]
  49. Baumann, B.; Snozzi, M.; Zehnder, A.J.; Van Der Meer, J.R. Dynamics of denitrification activity of Paracoccus denitrificans in continuous culture during aerobic-anaerobic changes. J. Bacteriol. 1996, 178, 4367–4374. [Google Scholar] [CrossRef] [PubMed] [Green Version]
  50. Meis, S.; Spears, B.M.; Maberly, S.C.; O’Malley, M.B.; Perkins, R.G. Sediment amendment with Phoslock® in Clatto Reservoir (Dundee, UK): Investigating changes in sediment elemental composition and phosphorus fractionation. J. Environ. Manag. 2012, 93, 185–193. [Google Scholar] [CrossRef] [PubMed]
  51. Cowan, J.; Pennock, J.; Boynton, W. Seasonal and interannual patterns of sediment-water nutrient and oxygen fluxes in Mobile Bay, Alabama (USA): Regulating factors and ecological significance. Mar. Ecol. Prog. Ser. 1996, 141, 229–245. [Google Scholar] [CrossRef] [Green Version]
  52. Newell, R.I.E.; Cornwell, J.C.; Owens, M.S. Influence of simulated bivalve biodeposition and microphytobenthos on sediment nitrogen dynamics: A laboratory study. Limnol. Oceanogr. 2002, 47, 1367–1379. [Google Scholar] [CrossRef]
  53. Sĭmek, M.; Laughlin, R.J.; Bru, D.; Chèneby, D.; Watson, C.J.; Philippot, L. Insights into the Effect of Soil pH on N2O and N2 Emissions and Denitrifier Community Size and Activity. Appl. Environ. Microbiol. 2010, 76, 1870–1878. [Google Scholar] [CrossRef] [Green Version]
  54. Isnansetyo, A.; Thien, N.D.; Seguchi, M. Potential of mud sediment of the Ariake Sea tidal flat and the individual effect of temperature, pH, salinity and ammonium concentration on its nitrification rate. Res. J. Environ. Earth Sci. 2011, 3, 587–599. [Google Scholar]
  55. Šimek, M.; Jíšová, L.; Hopkins, D.W. What is the so-called optimum pH for denitrification in soil? Soil Biol. Biochem. 2002, 34, 1227–1234. [Google Scholar] [CrossRef]
  56. Niriella, D.; Carnahan, R.P. Comparison Study of Zeta Potential Values of Bentonite in Salt Solutions. J. Dispers. Sci. Technol. 2006, 27, 123–131. [Google Scholar] [CrossRef]
  57. Buragohain, P.; Sredeep, S.; Saiyouri, N. A study on the adsorption of ammonium in Bentonite and Kaolinite. Int. J. Chem. 2013, 1, 2320–4087. [Google Scholar]
  58. Seitzinger, S.P.; Gardner, W.S.; Spratt, A.K. The Effect of Salinity on Ammonium Sorption in Aquatic Sediments: Implications for Benthic Nutrient Recycling. Estuaries 1991, 14, 167–174. [Google Scholar] [CrossRef]
  59. Tiedje, J.M.; Simkins, S.; Groffman, P. Perspectives on measurement of denitrification in the field including recommended protocols for acetylene based methods. Plant Soil 1989, 115, 261–284. [Google Scholar] [CrossRef]
  60. Capone, D.G.; Burns, J.A.; Montoya, J.; Subramaniam, A.; Mahaffey, C.; Gunderson, T.; Michaels, A.F.; Carpenter, E.J. Nitrogen fixation by Trichodesmium spp.: An important source of new nitrogen to the tropical and subtropical North Atlantic Ocean. Glob. Biogeochem. Cycles 2005, 19, 2024. [Google Scholar] [CrossRef]
  61. Afsar, A.; Groves, S. Eco-Toxicity Assessment of Phoslock. Available online: http://www.phoslock.eu/media/7407/Eco-toxicity-Assessment-Report-May-2009.pdf (accessed on 12 December 2021).
  62. Mattheiss, J.; Sellner, K.G.; Ferrier, D. Lake Anita Louise Peroxide Treatment Summary—December 2016; CCWS Contribution #17-01; Center for Coastal and Watershed Studies, Hood College: Frederick, MD, USA, 2017; p. 9. [Google Scholar]
  63. Pan, G.; Yang, B.; Wang, D.; Chen, H.; Tian, B.-H.; Zhang, M.-L.; Yuan, X.-Z.; Chen, J. In-lake algal bloom removal and submerged vegetation restoration using modified local soils. Ecol. Eng. 2011, 37, 302–308. [Google Scholar] [CrossRef]
  64. Sellner, K.G.; Place, A.; Williams, E.; Gao, Y.; VanDolah, E.; Paolisso, M.; Bowers, H.; Roche, S. Hydraulics and barley straw (Hordeum vulgare) as effective treatment options for a cyanotoxin-impacted lake. In Proceedings of the 16th International conference on Harmful Algae, Wellington, NZ, USA, 27–31 October 2014; Mackenzie, L., Ed.; The International Society for the Study of Harmful Algae (ISSHA), Cawthron Institute: Nelson, New Zealand, 2015; pp. 218–221. [Google Scholar]
  65. Anderson, C.R.; Sellner, K.G.; Anderson, D.M. Bloom prevention and control. In Harmful Algal Blooms (HABs) and Desalination: A Guide to Impacts, Monitoring, and Management; Anderson, D.M., Boerlage, S.F.E., Dixon, M.B., Eds.; UNESCO: Paris, France, 2017; pp. 205–222. [Google Scholar]
  66. Sellner, K.G.; Rensel, J. A review of prevention, control, and mitigation options for harmful algal blooms. In Harmful Algal Blooms: A Compendium Desk Reference; Shumway, S.E., Burkholder, J.M., Morton, S.L., Eds.; Wiley-Blackwell: Hoboken, NJ, USA, 2018; pp. 433–492. [Google Scholar]
Figure 1. Experimental design.
Ijerph 18 13360 g001
Figure 2. Changes of soluble reactive phosphorus (SRP ± standard error) after Phoslock® treatment. Data collected from lake water (n = 1) and from closed-bottom mesocosms for the controls (n = 3) and the Phoslock treatments (n = 3). Capital letters and lowercase present the differences over time in the control and Phoslock-treated mesocosms (p < 0.05), respectively. ** The differences between treatments at the same sampling time (p < 0.01).
Ijerph 18 13360 g002
Figure 3. Changes in Chlorophyll a (A) and pH (B) over time in the lake water and the Phoslock®-treated and untreated mesocosms. Data were collected from the lake water (n = 1) and from the closed-bottom mesocosms for the controls (n = 3) and Phoslock® treatments (n = 3) from 2 July to 11 July. Error bars indicate standard errors.
Ijerph 18 13360 g003
Figure 4. Vertical profiles of the pore water nutrients and porosity taken from Phoslock®-free sediments (control) and from sediments capped with Phoslock® for 1 day and 28 days. The top symbol in each panel represents the conditions in the pond water immediately above the sediment. The pore water nutrients include SRP (A), NH4+ (B), NO3 (C), and Porosity (D).
Ijerph 18 13360 g004
Figure 5. Flux rates at the sediment–water interface in Phoslock®-free and 1 day and 28 days after Phoslock® treatment. Flux rates include inorganic nutrient flux (AC), denitrification (D), sediment oxygen consumption (E), and respiration rates (F). Symbols a, b, and c present the differences between means at a significance level of p < 0.05.
Ijerph 18 13360 g005
Figure 6. Water quality improvement after Phoslock® treatment, including changes in Chlorophyll a (A), pH (B), and dissolved oxygen (C). Water samples were collected for ~50 days after the Phoslock® addition.
Ijerph 18 13360 g006
Figure 7. Cyanobacteria species changes over time in the lake and treated limnocorral. Data was collected from 25 July to 12 September.
Ijerph 18 13360 g007
Table 1. Experiment details.
Experiment InformationPhoslock® Application
--WaterSediment
time2–11 July26 July–12 September
containerclosed-bottomopen-bottom
sediment nutrient inputnoyes
Initial conditions in lake water (mean ± standard error)
temperature (°C)32.5 ± 2.7727.6 ± 2.19
salinity0.2 ± 0.010.2 ± 0.02
pH9.6 ± 0.19.5 ± 0.13
microcystin (µg L−1)18.0 (n = 1)7.8 ± 2.83
Table 2. Bottom water and sediment properties with/without the Phoslock® treatment on 22 August at Higgins Mill Pond.
ParametersPhoslock®Controls
Properties in water column—
temperature (°C)25.7926.05
pH8.808.97
DO (µmol L−1)97.81149.06
Chl a (ug L−1)32.7069.80
SRP (µmol L−1)1.471.13
NO3 (µmol L−1)-0.48
NO2 (µmol L−1)0.220.22
NH4+ (µmol L−1)0.060.05
Sediment—
sand (%)18.52 ± 0.31
silt (%)56.24 ± 0.36
clay(%)25.31 ± 0.43
Publisher’s Note: MDPI stays neutral with regard to jurisdictional claims in published maps and institutional affiliations.

