
Assessing Spatial Accessibility to Primary Health Care Services in Beijing, China


Abstract
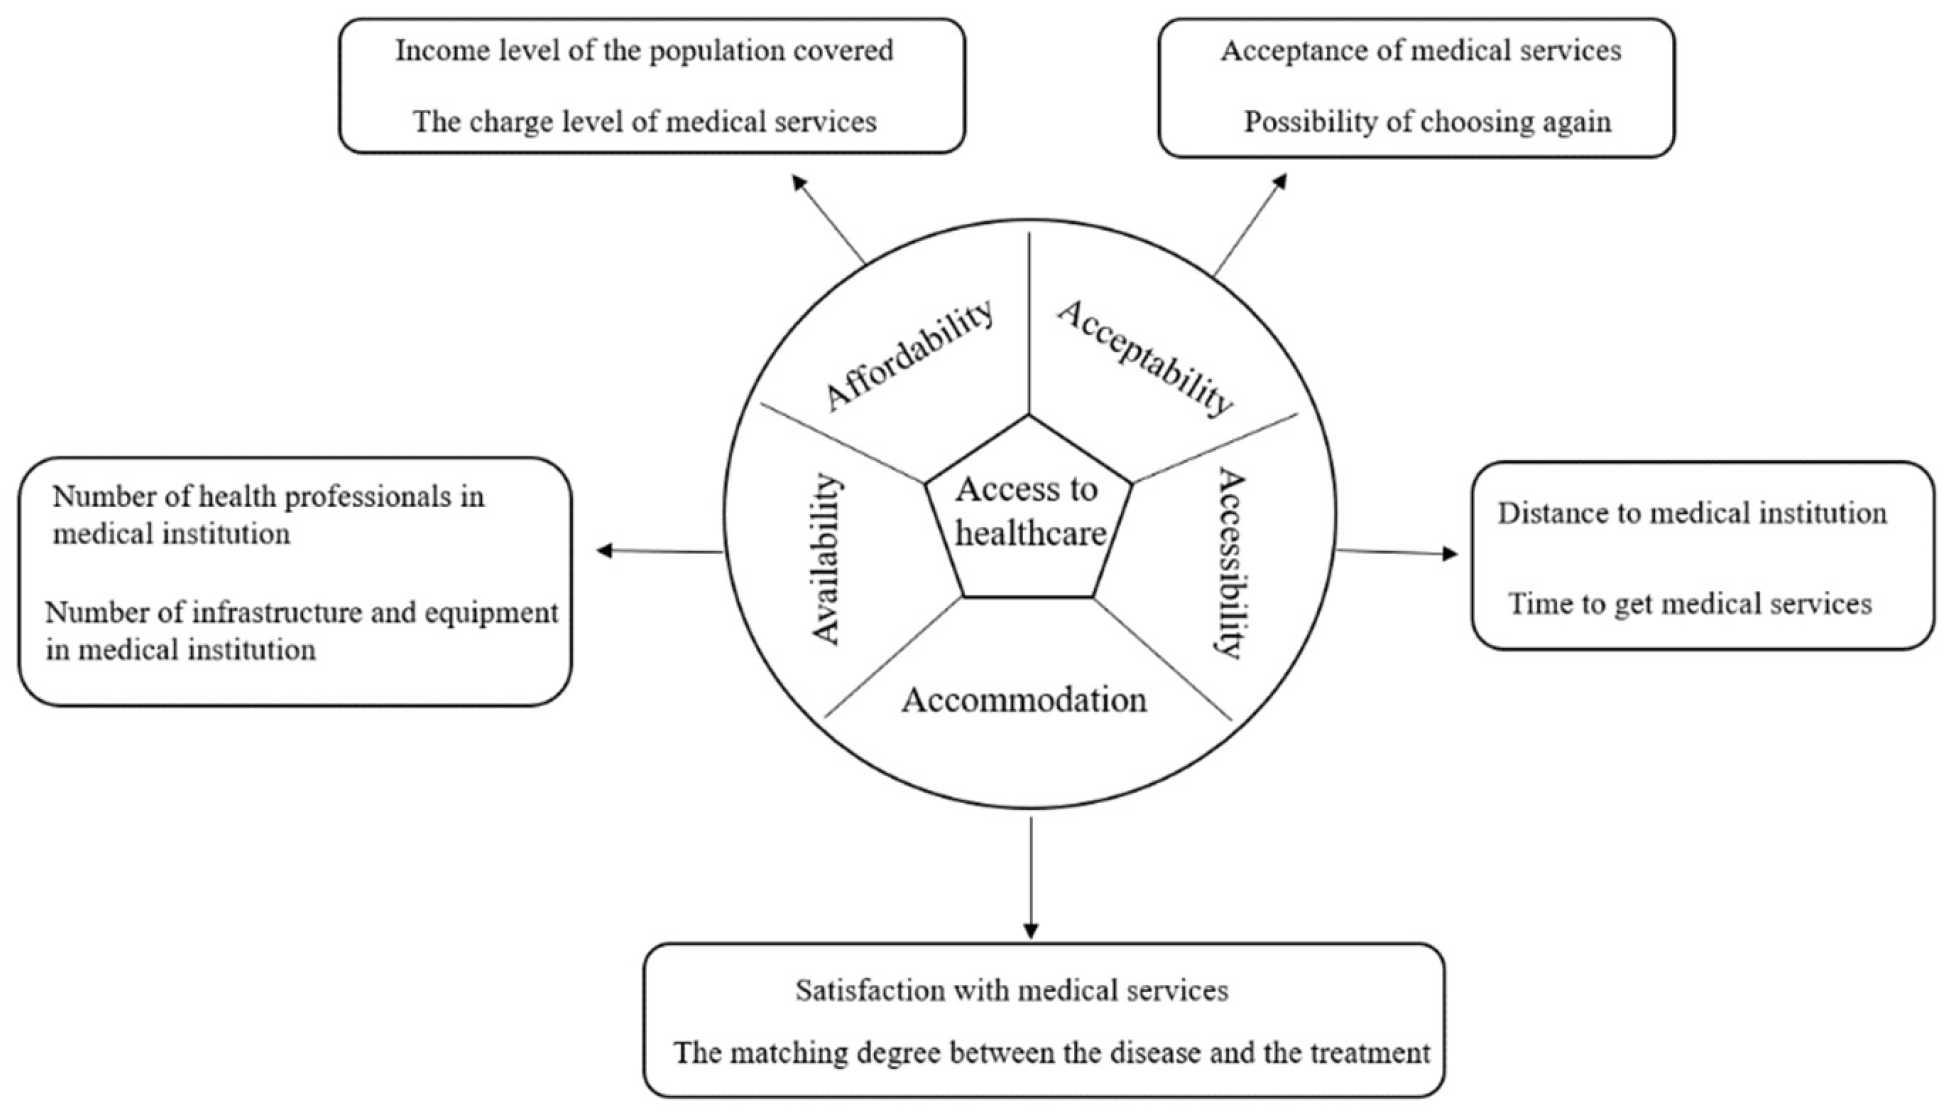
:1. Introduction
2. Materials and Methods
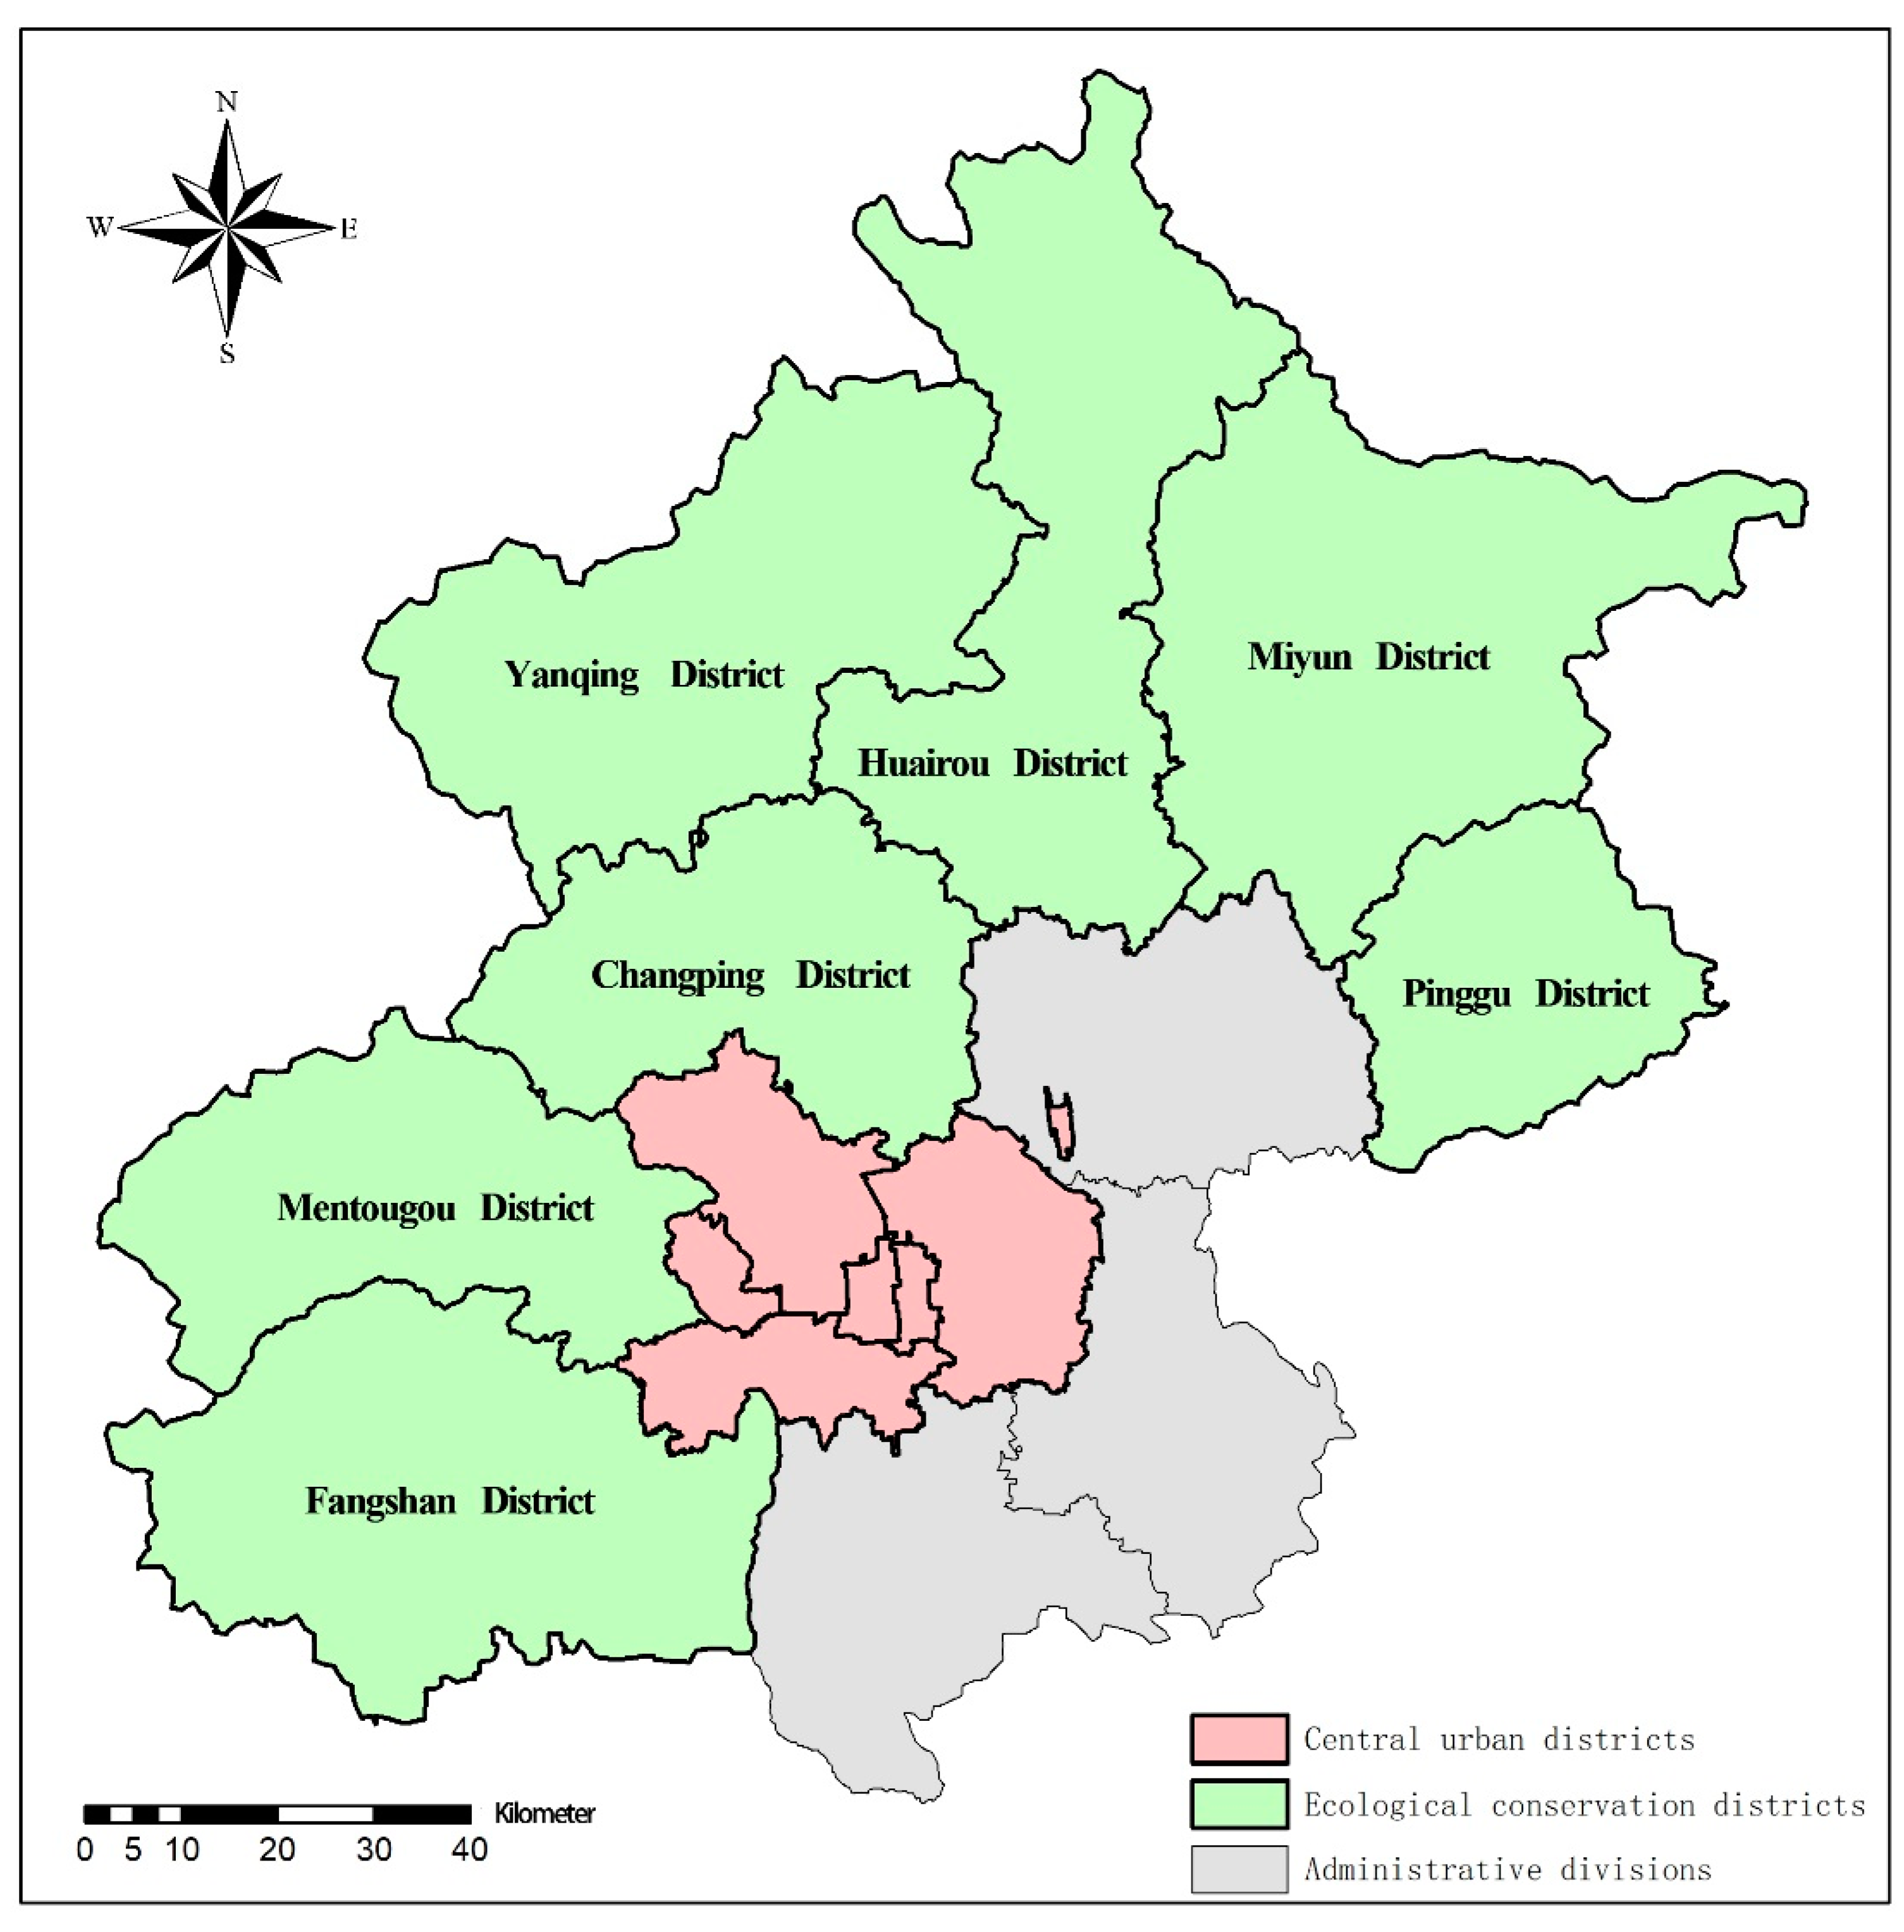
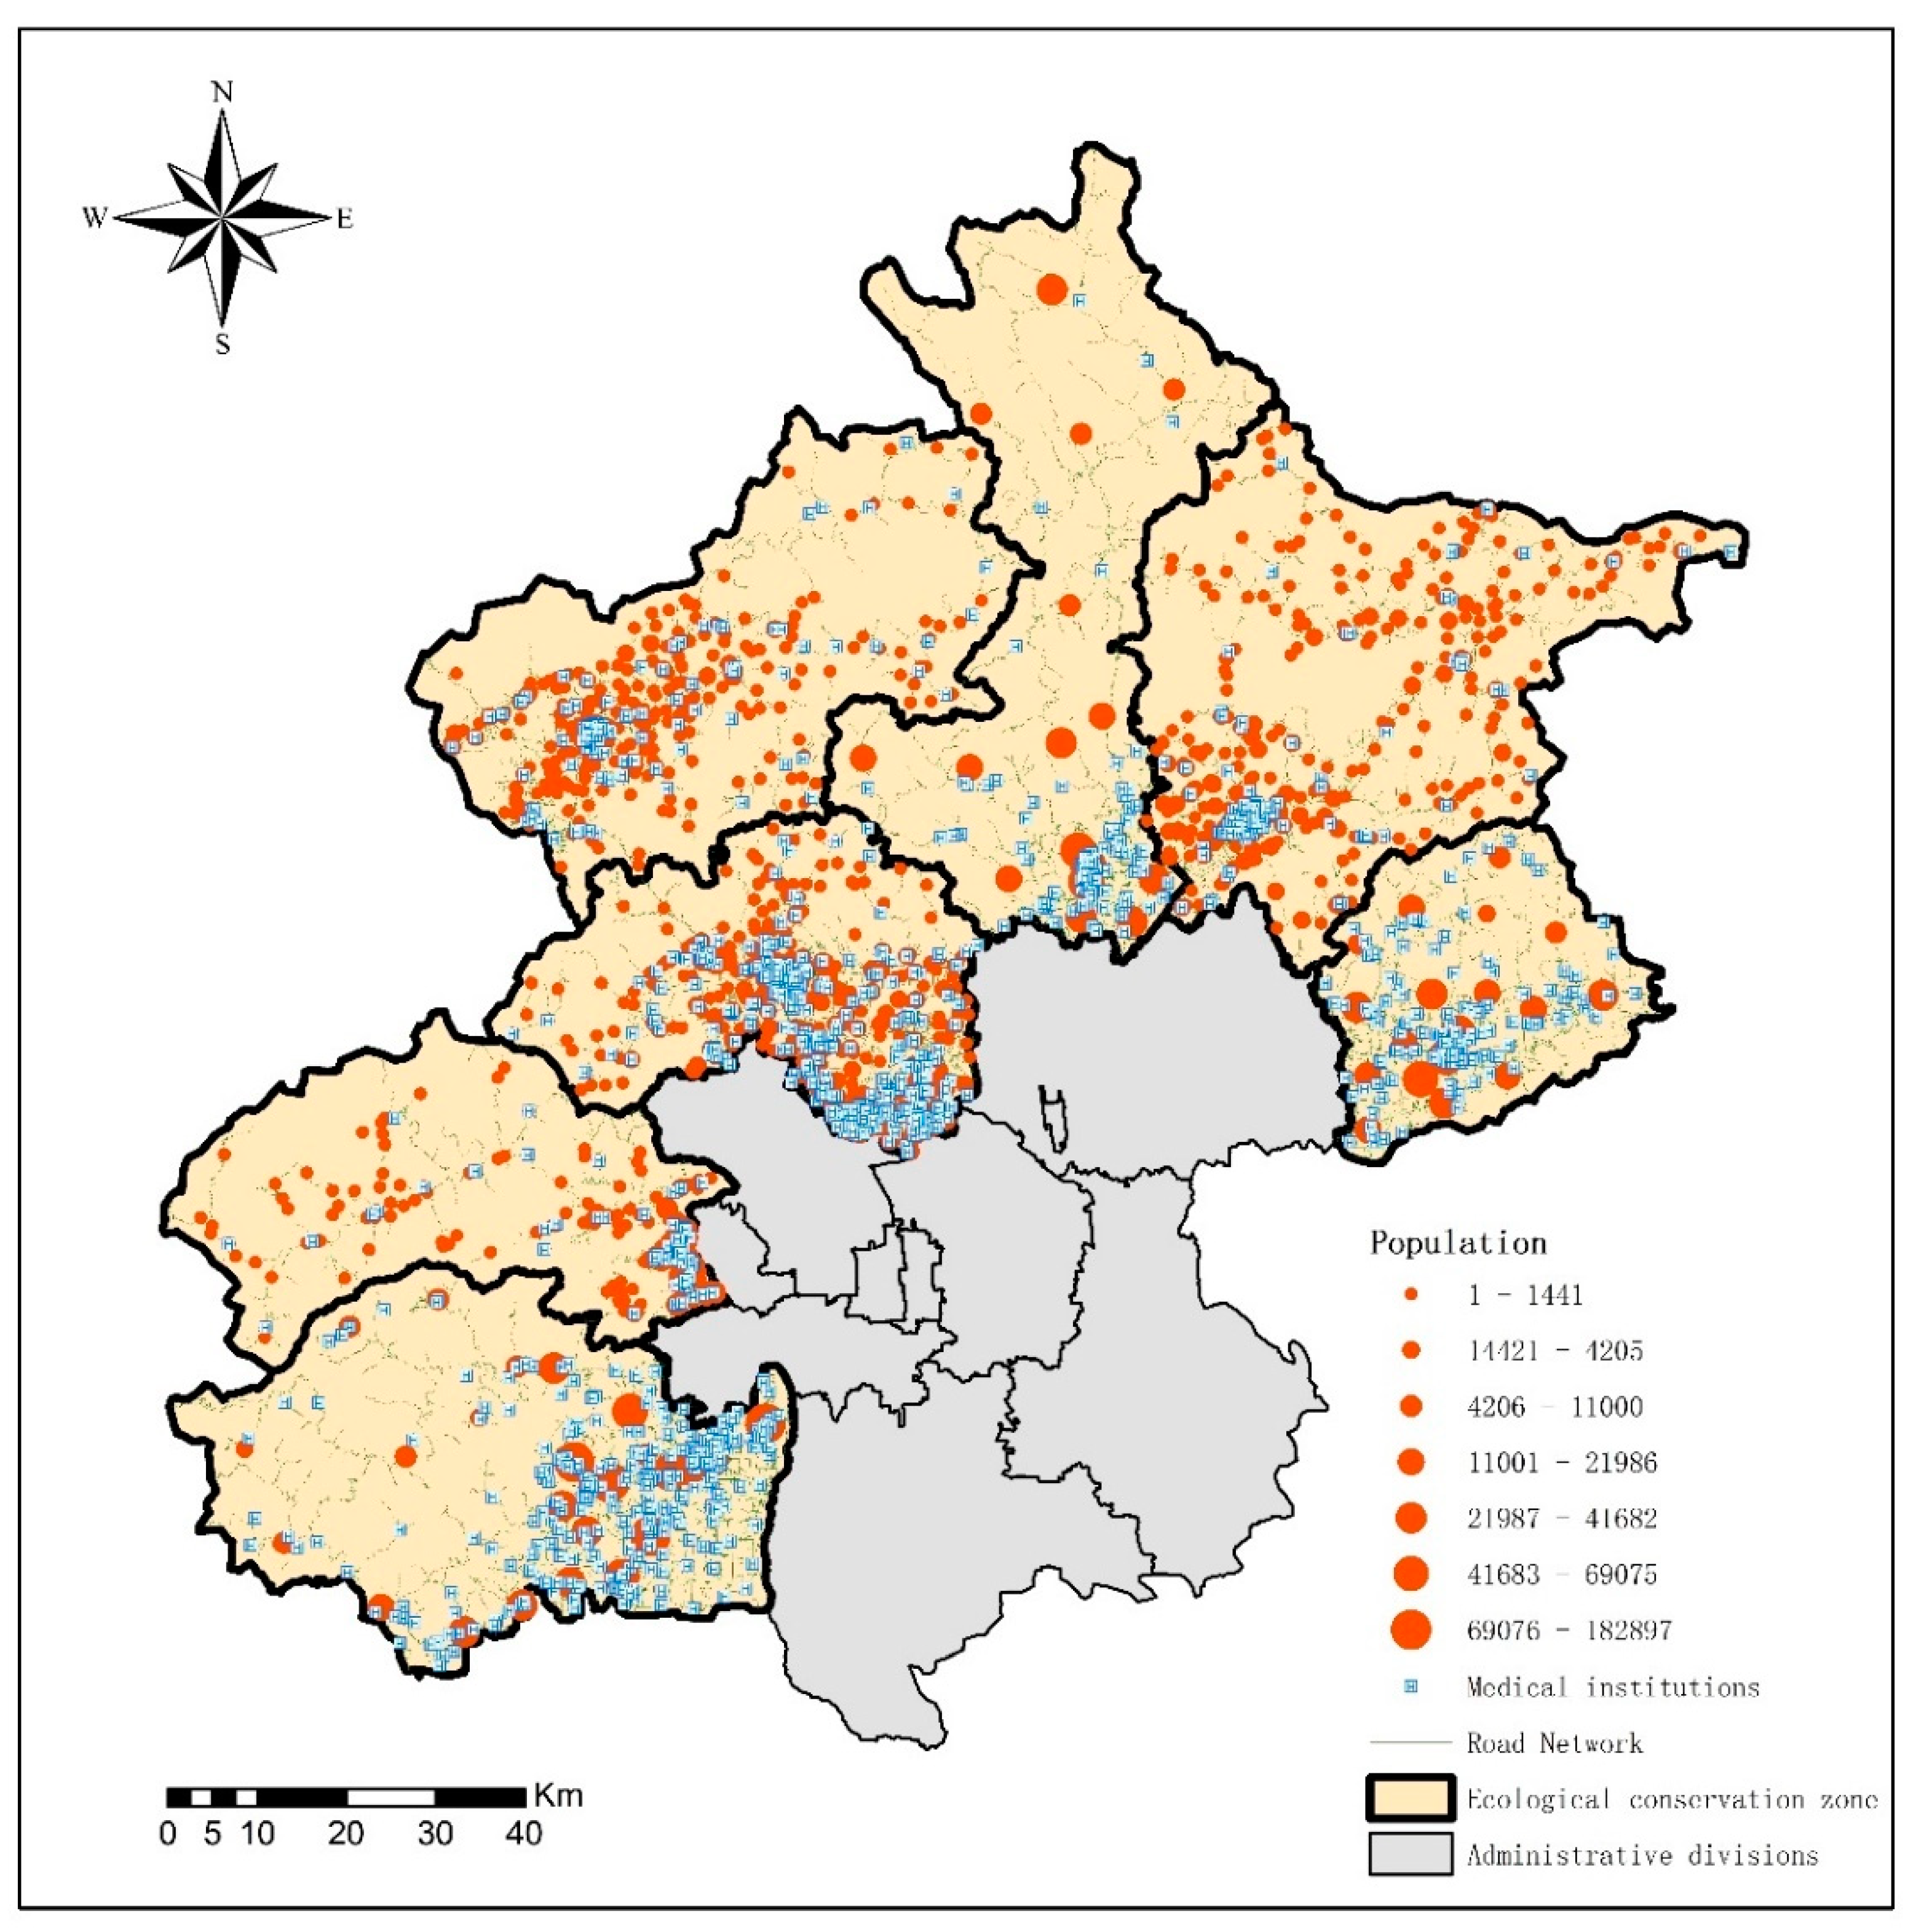
2.1. Study Area
2.2. Data
2.3. Data Pretreatment
2.4. Lorenz Curve
2.5. Gini Coefficient
2.6. The Shortest Travel Time
2.7. The Modified Two-Step Floating Catchment Area (M2SFCA) Method
3. Results
3.1. Gini Coefficient and Lorenz Curves
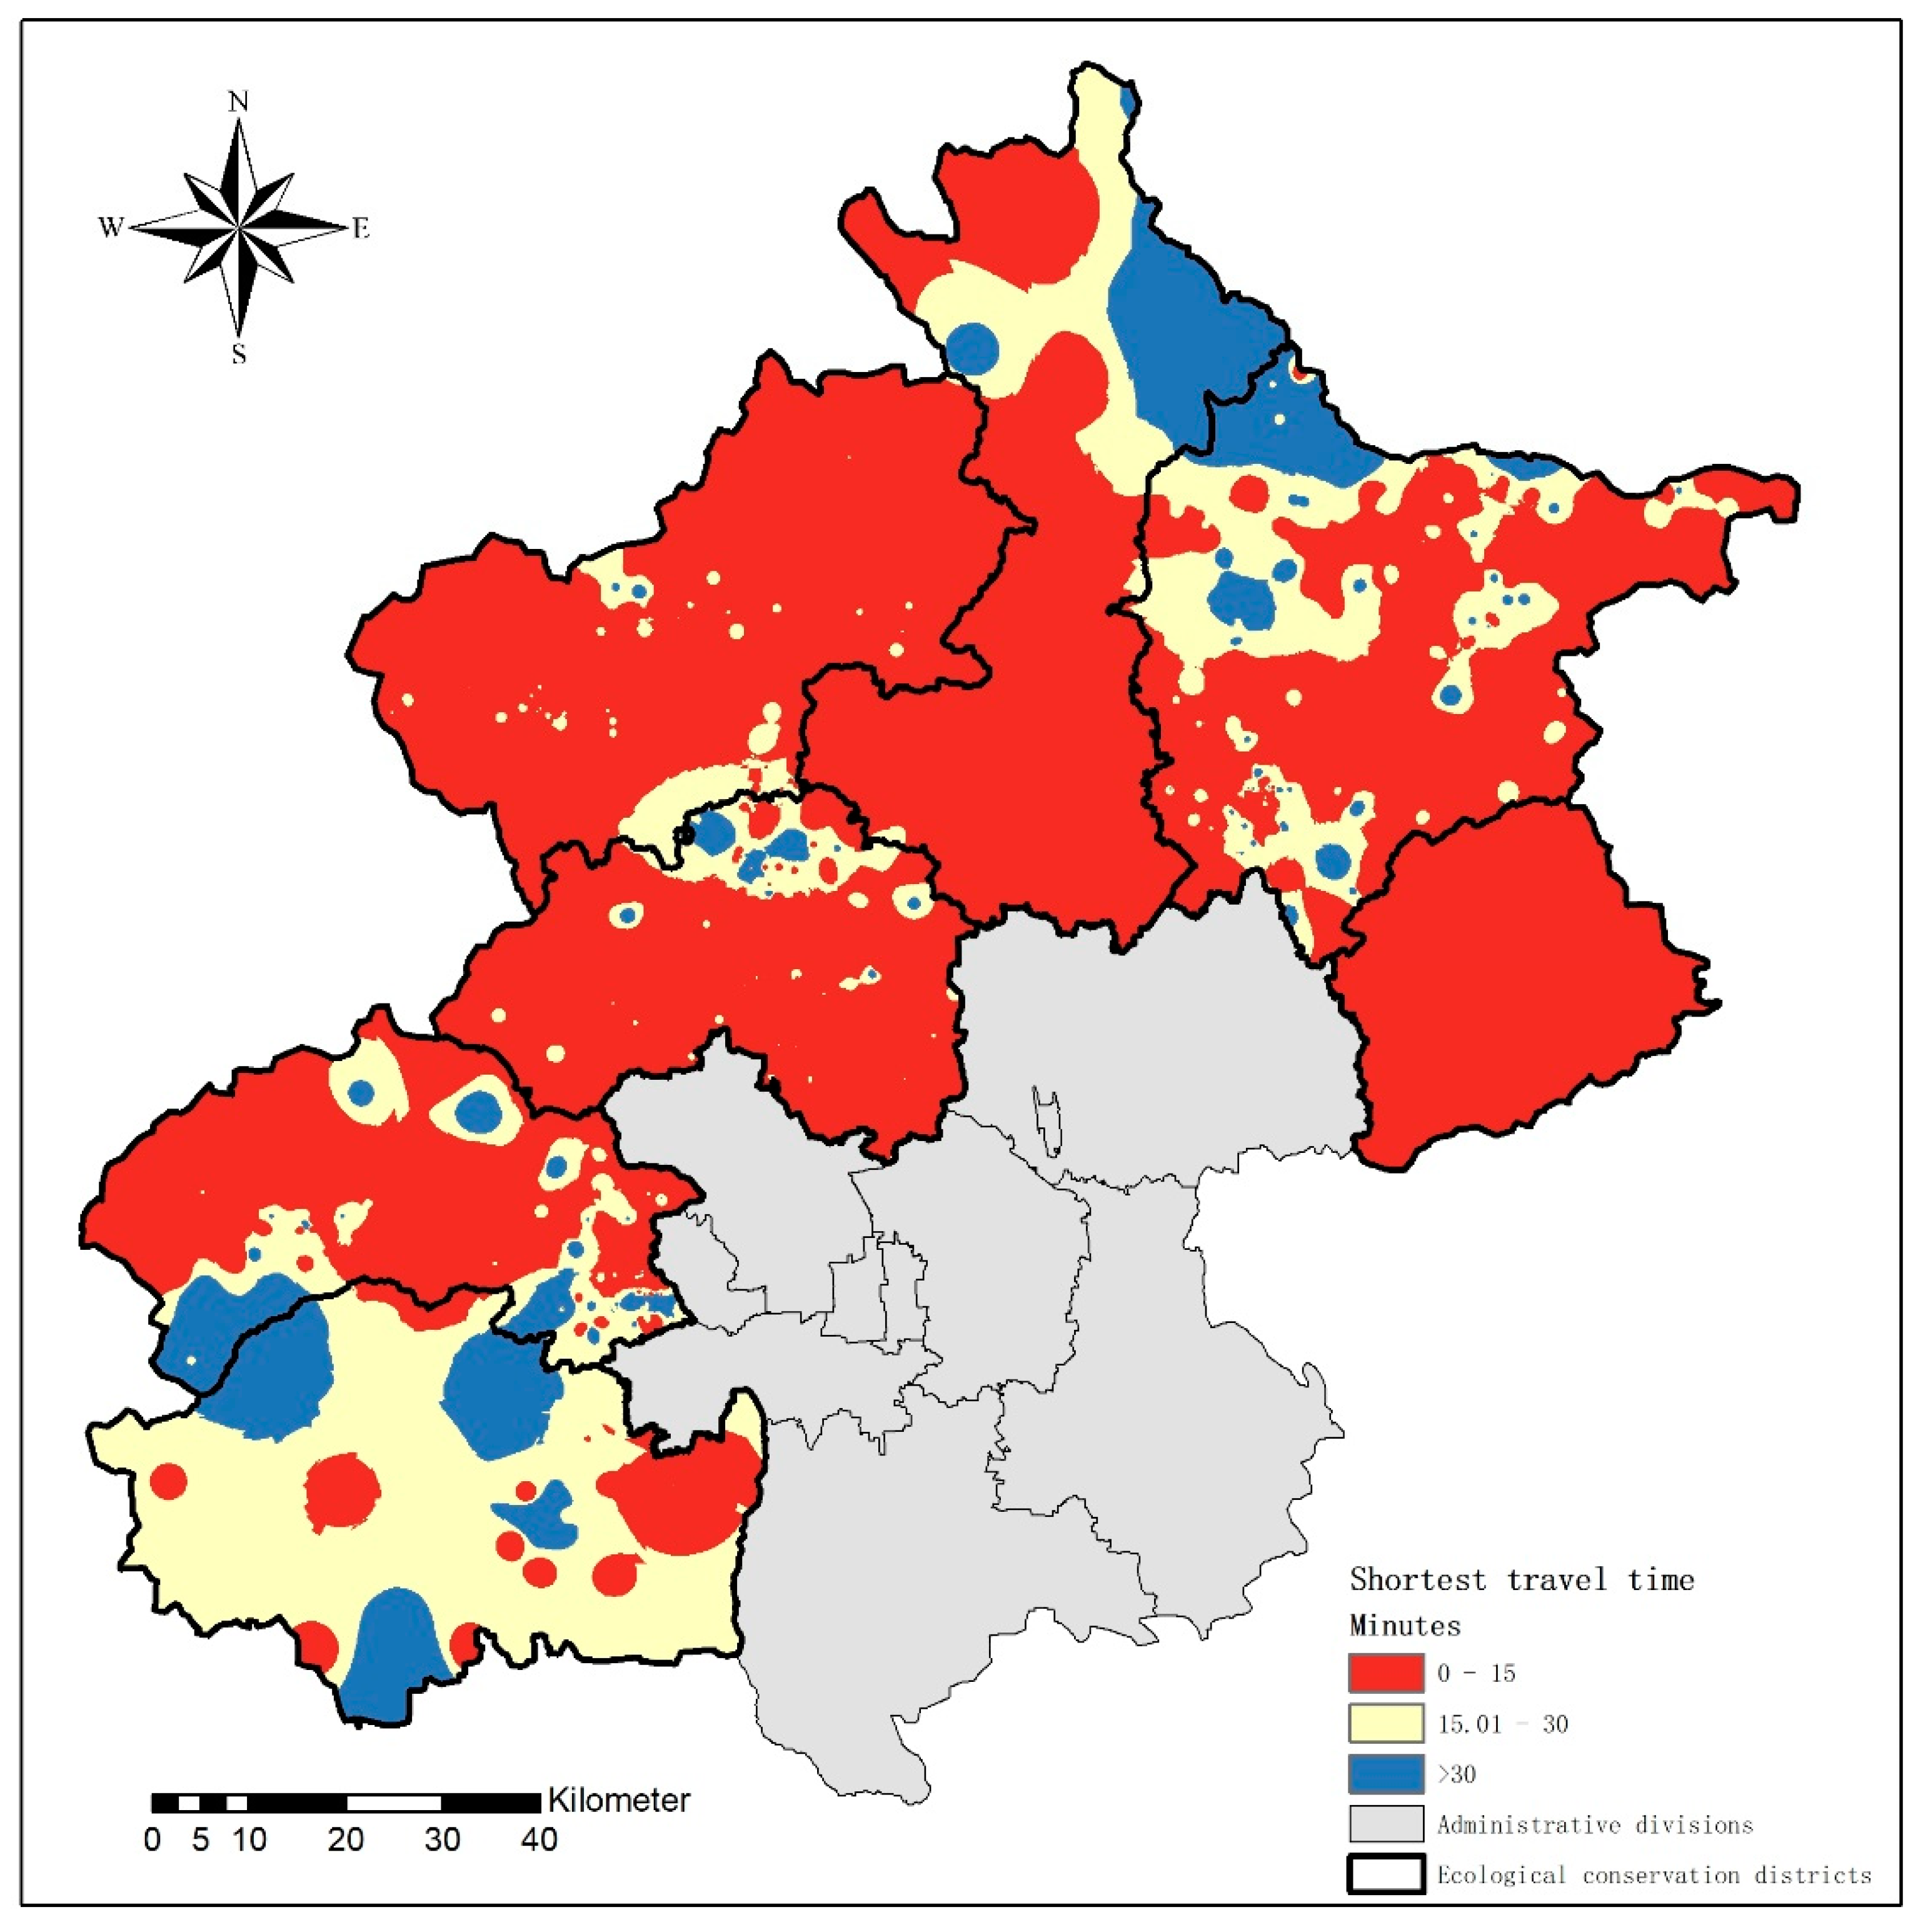
3.2. Shortest Travel Time of Primary Health Care in Seven Ecological Conservation Districts
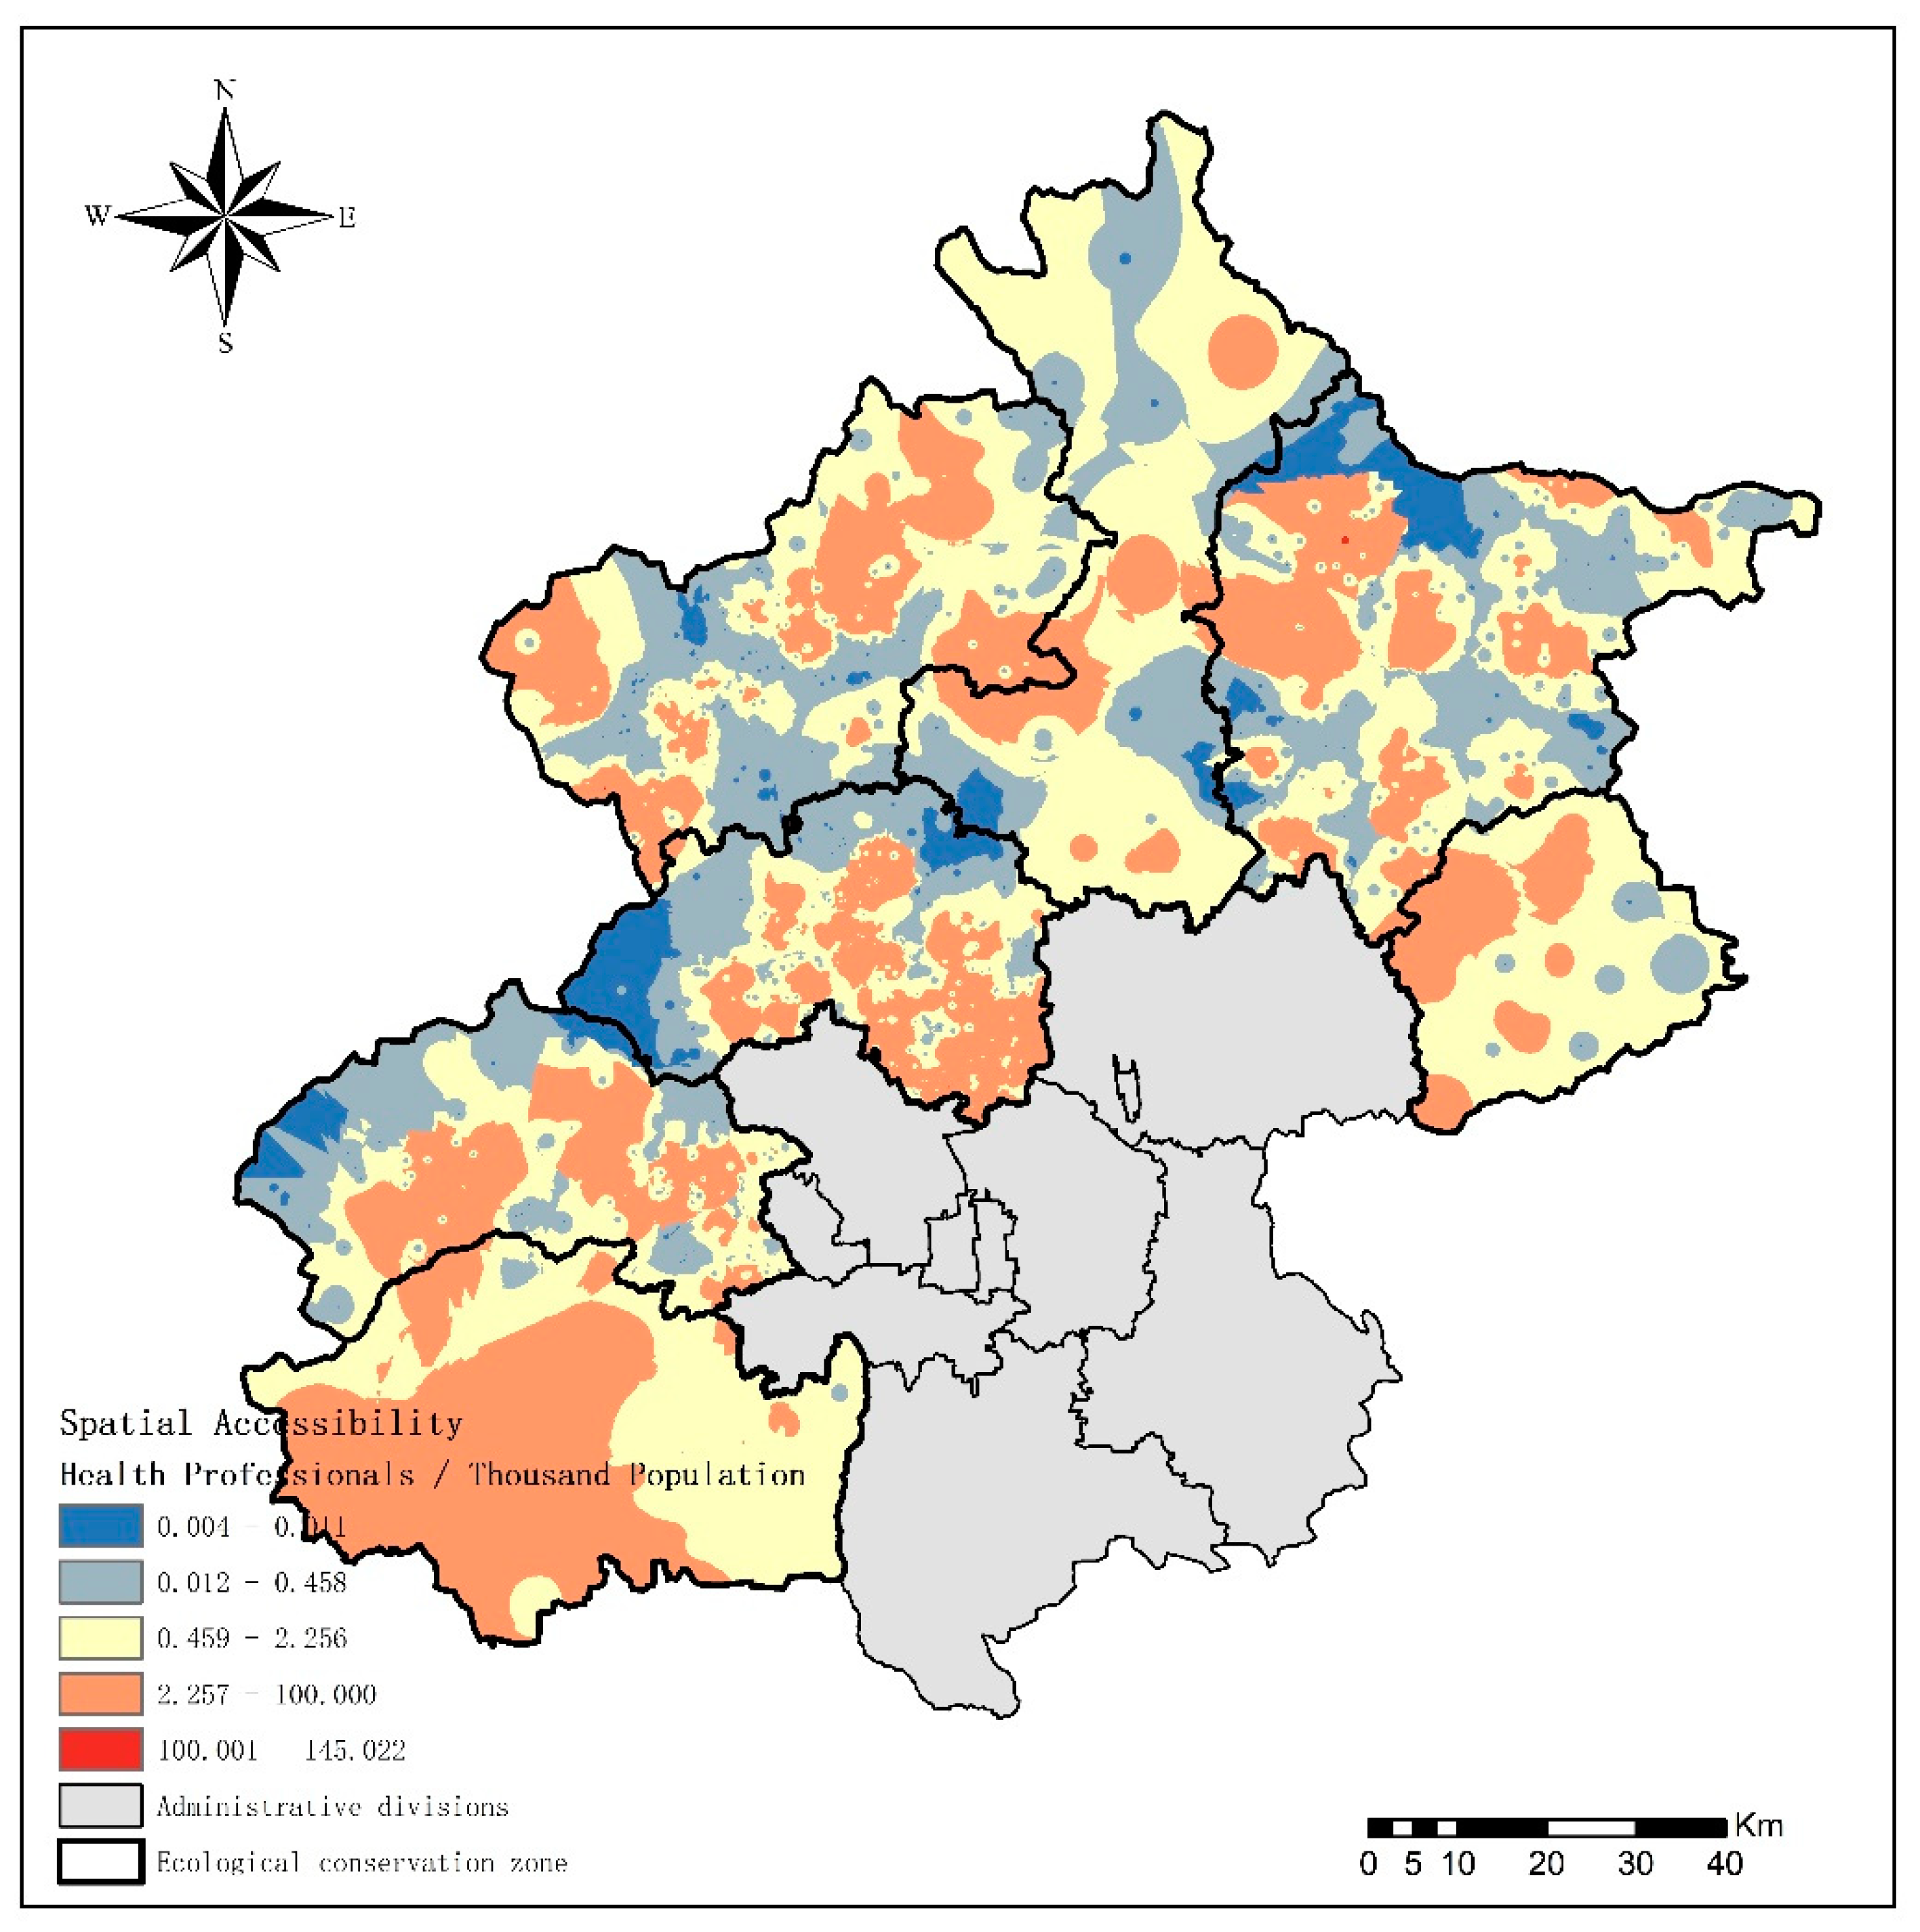
3.3. Spatial Accessibility of Primary Health Care in Seven Ecological Conservation Districts
4. Discussion
5. Conclusions
Author Contributions
Funding
Institutional Review Board Statement
Informed Consent Statement
Data Availability Statement
Conflicts of Interest
References
- Penchansky, R.; Thomas, J.W. The Concept of Access: Definition and Relationship to Consumer Satisfaction. Med. Care 1981, 19, 127–140. [Google Scholar] [CrossRef] [PubMed]
- Khan, A.A. An integrated approach to measuring potential spatial access to health care services. Socio-Econ. Plan. Sci. 1992, 26, 275–287. [Google Scholar] [CrossRef]
- Wang, F. Measurement, Optimization, and Impact of Health Care Accessibility: A Methodological Review. Annals of the Association of American Geographers. Assoc. Am. Geogr. 2012, 102, 1104–1112. [Google Scholar] [CrossRef] [PubMed] [Green Version]
- Wang, F.; Luo, W. Assessing spatial and nonspatial factors for healthcare access: Towards an integrated approach to defining health professional shortage areas. Health Place 2005, 11, 131–146. [Google Scholar] [CrossRef] [PubMed]
- Yin, C.; He, Q.; Liu, Y.; Chen, W.; Gao, Y. Inequality of public health and its role in spatial accessibility to medical facilities in China. Appl. Geogr. 2018, 92, 50–62. [Google Scholar] [CrossRef]
- World Health Assembly. International Conference on Primary Health Care, Alma-Ata: Twenty-Fifth Anniversary; World Health Organization: Geneva, Switzerland, 2003. [Google Scholar]
- Tao, W.; Zeng, Z.; Dang, H.; Lu, B.; Chuong, L.; Yue, D.; Wen, J.; Zhao, R.; Li, W.; Kominski, G.F. Towards universal health coverage: Lessons from 10 years of healthcare reform in China. BMJ Glob. Health 2020, 5, e002086. [Google Scholar] [CrossRef] [Green Version]
- Zhang, X.; Xiong, Y.; Ye, J.; Deng, Z.; Zhang, X. Analysis of government investment in primary healthcare institutions to promote equity during the three-year health reform program in China. BMC Health Serv. Res. 2013, 13, 114. [Google Scholar] [CrossRef] [PubMed] [Green Version]
- National Health Comission. China Health Statistics Yearbook; National Health Comission: Beijing, China, 2020. [Google Scholar]
- Zhang, T.; Xu, Y.; Ren, J.; Sun, L.; Liu, C. Inequality in the distribution of health resources and health services in China: Hospitals versus primary care institutions. Int. J. Equity Health 2017, 16, 42. [Google Scholar] [CrossRef] [Green Version]
- Li, X.; Krumholz, H.M.; Yip, W.; Cheng, K.K.; De Maeseneer, J.; Meng, Q.; Mossialos, E.; Li, C.; Lu, J.; Su, M.; et al. Quality of primary health care in China: Challenges and recommendations. Lancet 2020, 395, 1802–1812. [Google Scholar] [CrossRef]
- The State Council Of China. Health China 2030; The State Council Of China: Beijing, China, 2017. [Google Scholar]
- Luo, W.; Qi, Y. An enhanced two-step floating catchment area (E2SFCA) method for measuring spatial accessibility to primary care physicians. Health Place 2009, 15, 1100–1107. [Google Scholar] [CrossRef] [PubMed]
- Ni, J.; Wang, J.; Rui, Y.; Qian, T.; Wang, J. An Enhanced Variable Two-Step Floating Catchment Area Method for Measuring Spatial Accessibility to Residential Care Facilities in Nanjing. Int. J. Environ. Res. Public Health 2015, 12, 14490–14504. [Google Scholar] [CrossRef] [Green Version]
- Tao, Z.; Cheng, Y.; Dai, T.; Rosenberg, M.W. Spatial optimization of residential care facility locations in Beijing, China: Maximum equity in accessibility. Int. J. Health Geogr. 2014, 13, 33. [Google Scholar] [CrossRef] [PubMed] [Green Version]
- Tao, Z.; Yao, Z.; Kong, H.; Duan, F.; Li, G. Spatial accessibility to healthcare services in Shenzhen, China: Improving the multi-modal two-step floating catchment area method by estimating travel time via online map APIs. BMC Health Serv. Res. 2018, 18, 345. [Google Scholar] [CrossRef] [PubMed] [Green Version]
- Pan, J.; Zhao, H.; Wang, X.; Shi, X. Assessing spatial access to public and private hospitals in Sichuan, China: The influence of the private sector on the healthcare geography in China. Soc. Sci. Med. (1982) 2016, 170, 35–45. [Google Scholar] [CrossRef] [PubMed]
- Tandi, T.E.; Cho, Y.; Akam, A.J.; Afoh, C.O.; Ryu, S.H.; Choi, M.S.; Kim, K.; Choi, J.W. Cameroon public health sector: Shortage and inequalities in geographic distribution of health personnel. Int. J. Equity Health 2015, 14, 43. [Google Scholar] [CrossRef] [Green Version]
- Fang, P.; Dong, S.; Xiao, J.; Liu, C.; Feng, X.; Wang, Y. Regional inequality in health and its determinants: Evidence from China. Health Policy 2010, 94, 14–25. [Google Scholar] [CrossRef]
- Druckman, A.; Jackson, T. Measuring resource inequalities: The concepts and methodology for an area-based Gini coefficient. Ecol. Econ. 2008, 65, 242–252. [Google Scholar] [CrossRef] [Green Version]
- Horev, T.; Pesis-Katz, I.; Mukamel, D.B. Trends in geographic disparities in allocation of health care resources in the US. Health Policy 2004, 68, 223–232. [Google Scholar] [CrossRef] [PubMed]
- Yang, D.H.; Goerge R Fau-Mullner, R.; Mullner, R. Comparing GIS-based methods of measuring spatial accessibility to health services. J. Med. Syst. 2016, 30, 23–32. [Google Scholar] [CrossRef]
- Wang, F. Why Public Health Needs GIS: A Methodological Overview. Ann. GIS 2020, 26, 1–12. [Google Scholar] [CrossRef] [PubMed] [Green Version]
- Guagliardo, M.F. Spatial accessibility of primary care: Concepts, methods and challenges. Int. J. Health Geogr. 2004, 3, 3. [Google Scholar] [CrossRef] [Green Version]
- Tao, Z.; Cheng, Y. Research progress of the two-step floating catchment area method and extensions. Prog. Geogr. 2016, 35, 589–599. [Google Scholar] [CrossRef]
- Wang, X.; Pan, J. Assessing the disparity in spatial access to hospital care in ethnic minority region in Sichuan Province, China. BMC Health Serv. Res. 2016, 16, 399. [Google Scholar] [CrossRef] [PubMed] [Green Version]
- Kanuganti, S.; Sarkar, A.K.; Singh, A.P. Evaluation of access to health care in rural areas using enhanced two-step floating catchment area (E2SFCA) method. J. Transp. Geogr. 2016, 56, 45–52. [Google Scholar] [CrossRef]
- Cheng, G.; Zeng, X.; Duan, L.; Lu, X.; Sun, H.; Jiang, T.; Li, Y. Spatial difference analysis for accessibility to high level hospitals based on travel time in Shenzhen, China. Habitat Int. 2016, 53, 485–494. [Google Scholar] [CrossRef] [Green Version]
- Bauer, J.; Müller, R.; Brüggmann, D.; Groneberg, D.A. Spatial Accessibility of Primary Care in England: A Cross-Sectional Study Using a Floating Catchment Area Method. Health Serv. Res. 2018, 53, 1957–1978. [Google Scholar] [CrossRef] [PubMed]
- Delamater, P.L. Spatial accessibility in suboptimally configured health care systems: A modified two-step floating catchment area (M2SFCA) metric. Health Place 2013, 24, 30–43. [Google Scholar] [CrossRef]
- Luo, J.; Tian, L.; Luo, L.; Yi, H.; Wang, F. Two-Step Optimization for Spatial Accessibility Improvement: A Case Study of Health Care Planning in Rural China. BioMed Res. Int. 2017, 2017, 2094654. [Google Scholar] [CrossRef] [PubMed] [Green Version]
- Shah, T.I.; Bell, S.; Wilson, K. Spatial Accessibility to Health Care Services: Identifying under-Serviced Neighbourhoods in Canadian Urban Areas. PLoS ONE 2016, 11, e0168208. [Google Scholar] [CrossRef] [PubMed]
- Crooks, V.A.; Schuurman, N. Interpreting the results of a modified gravity model: Examining access to primary health care physicians in five Canadian provinces and territories. BMC Health Serv. Res. 2012, 12, 230. [Google Scholar] [CrossRef] [PubMed] [Green Version]
- McGrail, M.R.; Humphreys, J.S. Spatial access disparities to primary health care in rural and remote Australia. Geospat. Health 2015, 10, 358. [Google Scholar] [CrossRef] [PubMed] [Green Version]


| Shortest Travel Time (Minutes) | All | Changping | Fangshan | Huairou | Mentougou | Miyun | Pinggu | Yanqing | |
|---|---|---|---|---|---|---|---|---|---|
| 0–15 | Communities (%) | 81.22 | 90.52 | 56.00 | 88.24 | 77.78 | 66.58 | 100 | 86.17 |
| Population (%) | 82.88 | 92.48 | 71.66 | 96.24 | 79.79 | 72.88 | 100 | 86.77 | |
| 15–30 | Communities (%) | 11.55 | 6.69 | 28.00 | 0 | 9.15 | 18.84 | 0 | 12.62 |
| Population (%) | 11.39 | 6.22 | 21.45 | 0 | 8.27 | 13.77 | 0 | 12.64 | |
| >30 | Communities (%) | 7.23 | 2.79 | 16.00 | 11.76 | 13.07 | 14.58 | 0 | 1.21 |
| Population (%) | 5.74 | 1.30 | 6.89 | 3.76 | 11.94 | 13.35 | 0 | 0.58 | |
| Spatial Accessibility | Max | Min | Median | Q1 a | Q3 a |
|---|---|---|---|---|---|
| Changping | 84.91 | <0.01 | 1.93 | 0.16 | 5.09 |
| Fangshan | 6.35 | 0.18 | 2.27 | 1.34 | 3.33 |
| Huairou | 5.05 | <0.01 | 1.97 | <0.01 | 2.61 |
| Mentougou | 69.36 | <0.01 | 0.69 | 0.01 | 2.29 |
| Miyun | 46.95 | <0.01 | 0.27 | <0.01 | 1.74 |
| Pinggu | 6.48 | <0.01 | 1.33 | <0.01 | 3.29 |
| Yanqing | 76.25 | <0.01 | 0.47 | 0.02 | 2.86 |
Publisher’s Note: MDPI stays neutral with regard to jurisdictional claims in published maps and institutional affiliations. |
© 2021 by the authors. Licensee MDPI, Basel, Switzerland. This article is an open access article distributed under the terms and conditions of the Creative Commons Attribution (CC BY) license (https://creativecommons.org/licenses/by/4.0/).
Share and Cite
Zhang, J.; Han, P.; Sun, Y.; Zhao, J.; Yang, L. Assessing Spatial Accessibility to Primary Health Care Services in Beijing, China. Int. J. Environ. Res. Public Health 2021, 18, 13182. https://doi.org/10.3390/ijerph182413182
Zhang J, Han P, Sun Y, Zhao J, Yang L. Assessing Spatial Accessibility to Primary Health Care Services in Beijing, China. International Journal of Environmental Research and Public Health. 2021; 18(24):13182. https://doi.org/10.3390/ijerph182413182
Chicago/Turabian StyleZhang, Jiawei, Peien Han, Yan Sun, Jingyu Zhao, and Li Yang. 2021. "Assessing Spatial Accessibility to Primary Health Care Services in Beijing, China" International Journal of Environmental Research and Public Health 18, no. 24: 13182. https://doi.org/10.3390/ijerph182413182
APA StyleZhang, J., Han, P., Sun, Y., Zhao, J., & Yang, L. (2021). Assessing Spatial Accessibility to Primary Health Care Services in Beijing, China. International Journal of Environmental Research and Public Health, 18(24), 13182. https://doi.org/10.3390/ijerph182413182