
Development and Validation of a Sub-National, Satellite-Based Land-Use Regression Model for Annual Nitrogen Dioxide Concentrations in North-Western China


 , ,
, , 
 ,
,  ,
, 
Abstract
:
1. Introduction
2. Materials and Methods
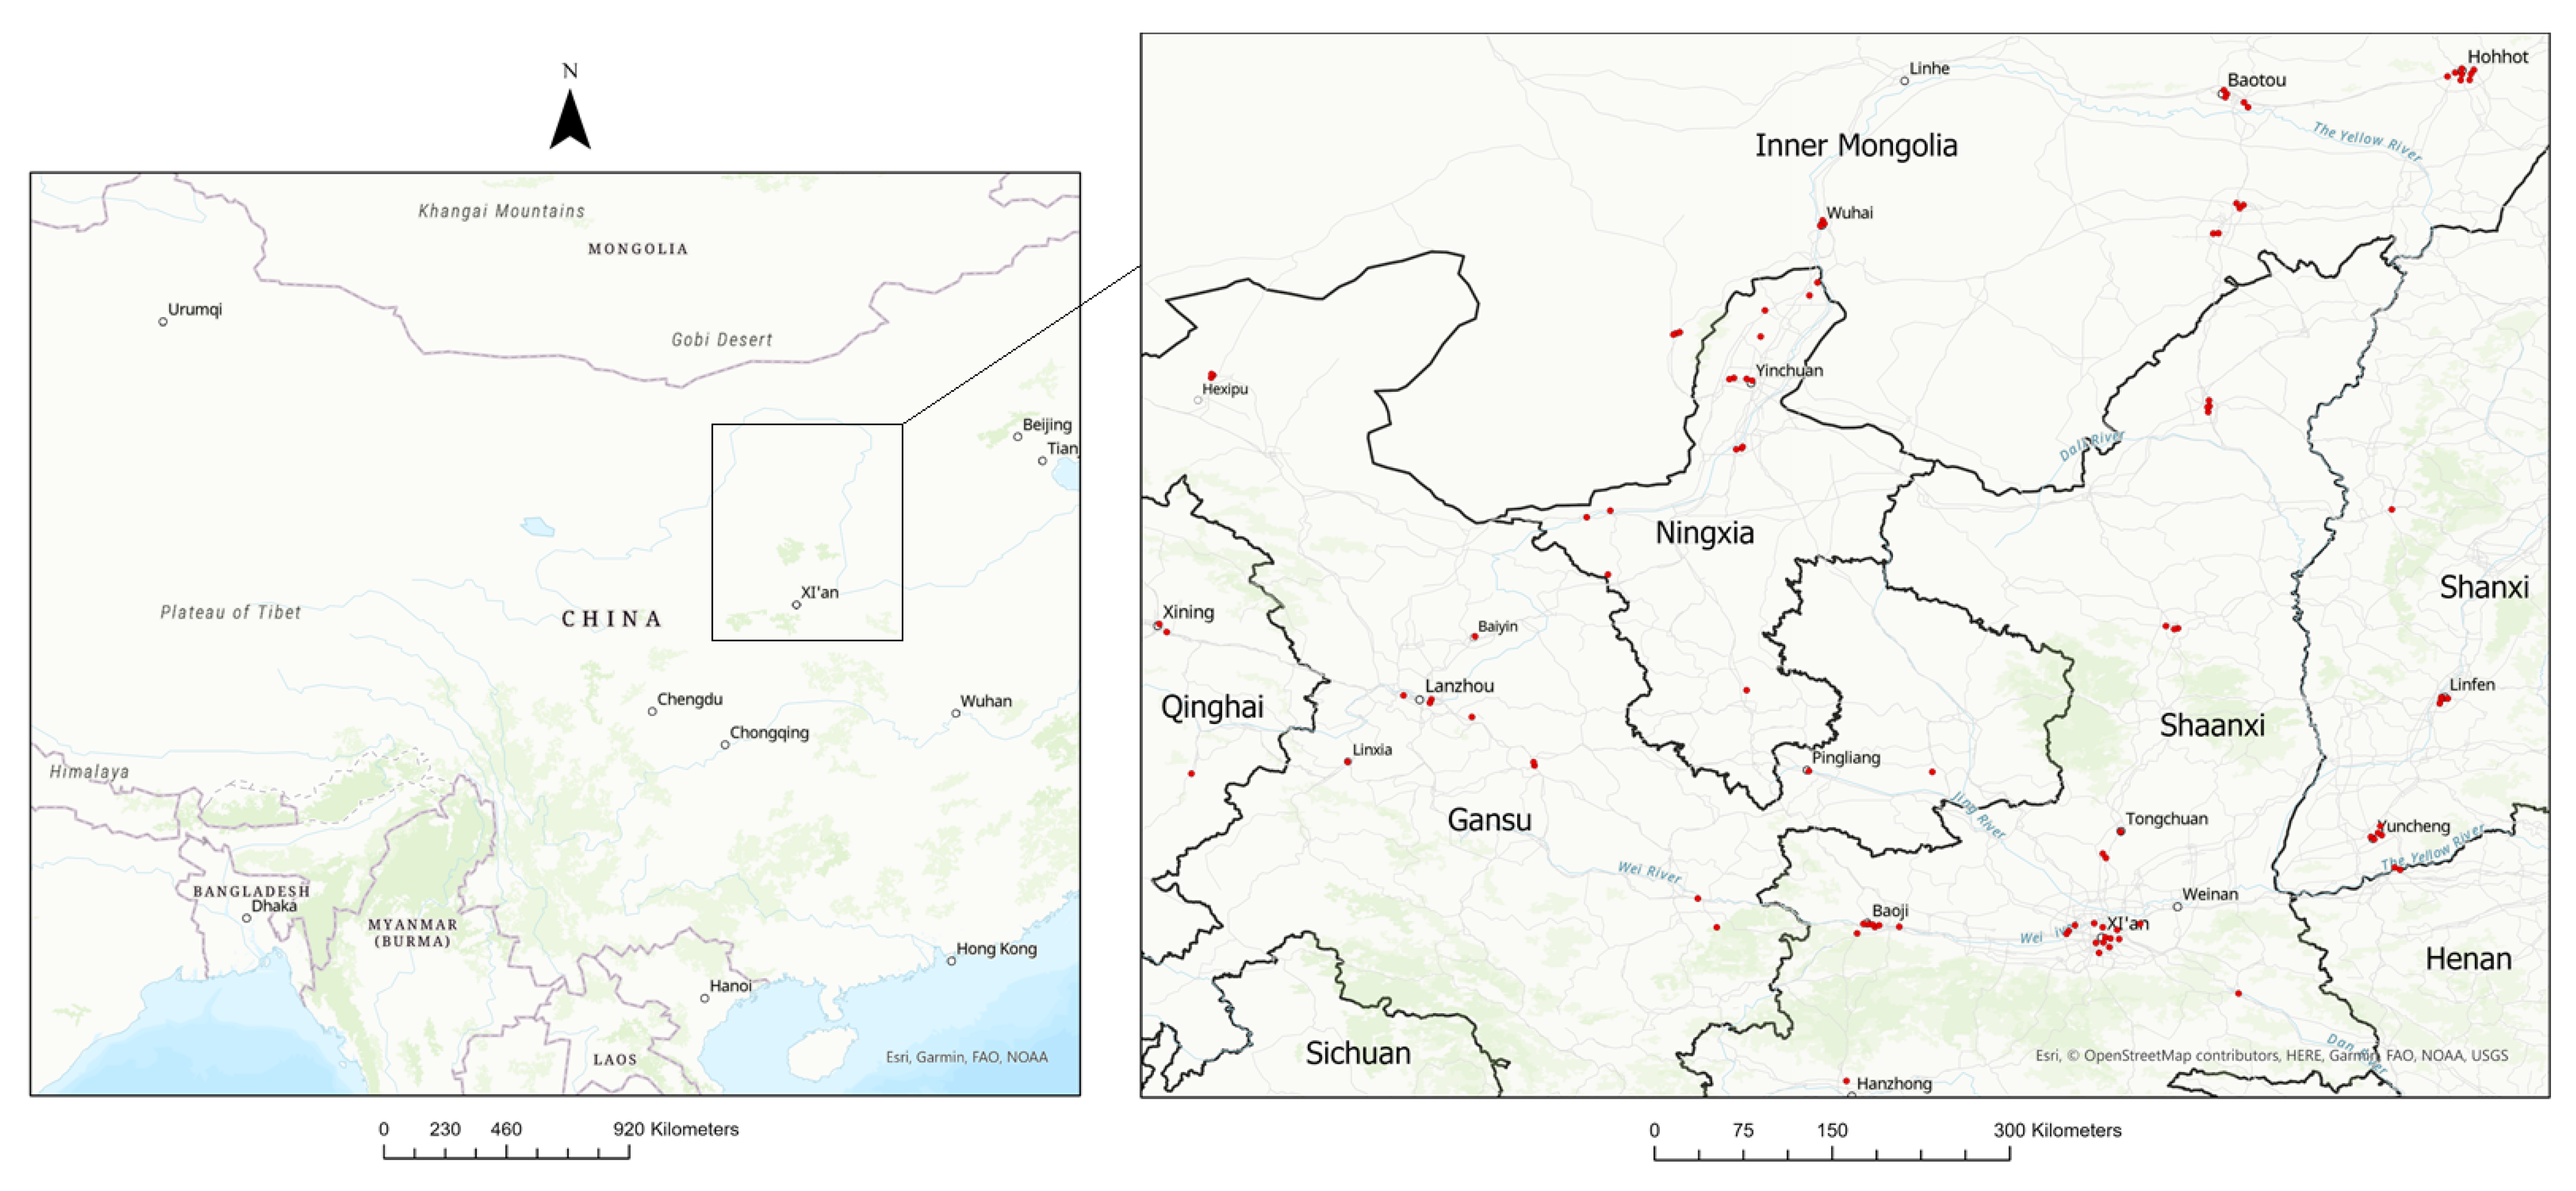
2.1. Study Area
2.1.1. Measured NO2
2.1.2. Variables
2.2. Model Development
2.2.1. Variable Selection
2.2.2. Model Development
2.2.3. Model Diagnostics and Cross-Validation
2.2.4. Independent Evaluation
2.2.5. Model Predictions
3. Results
3.1. NO2 Measurements
3.2. Model Performance
3.3. Model Diagnostics and Cross-Validation
3.4. Historical Validation
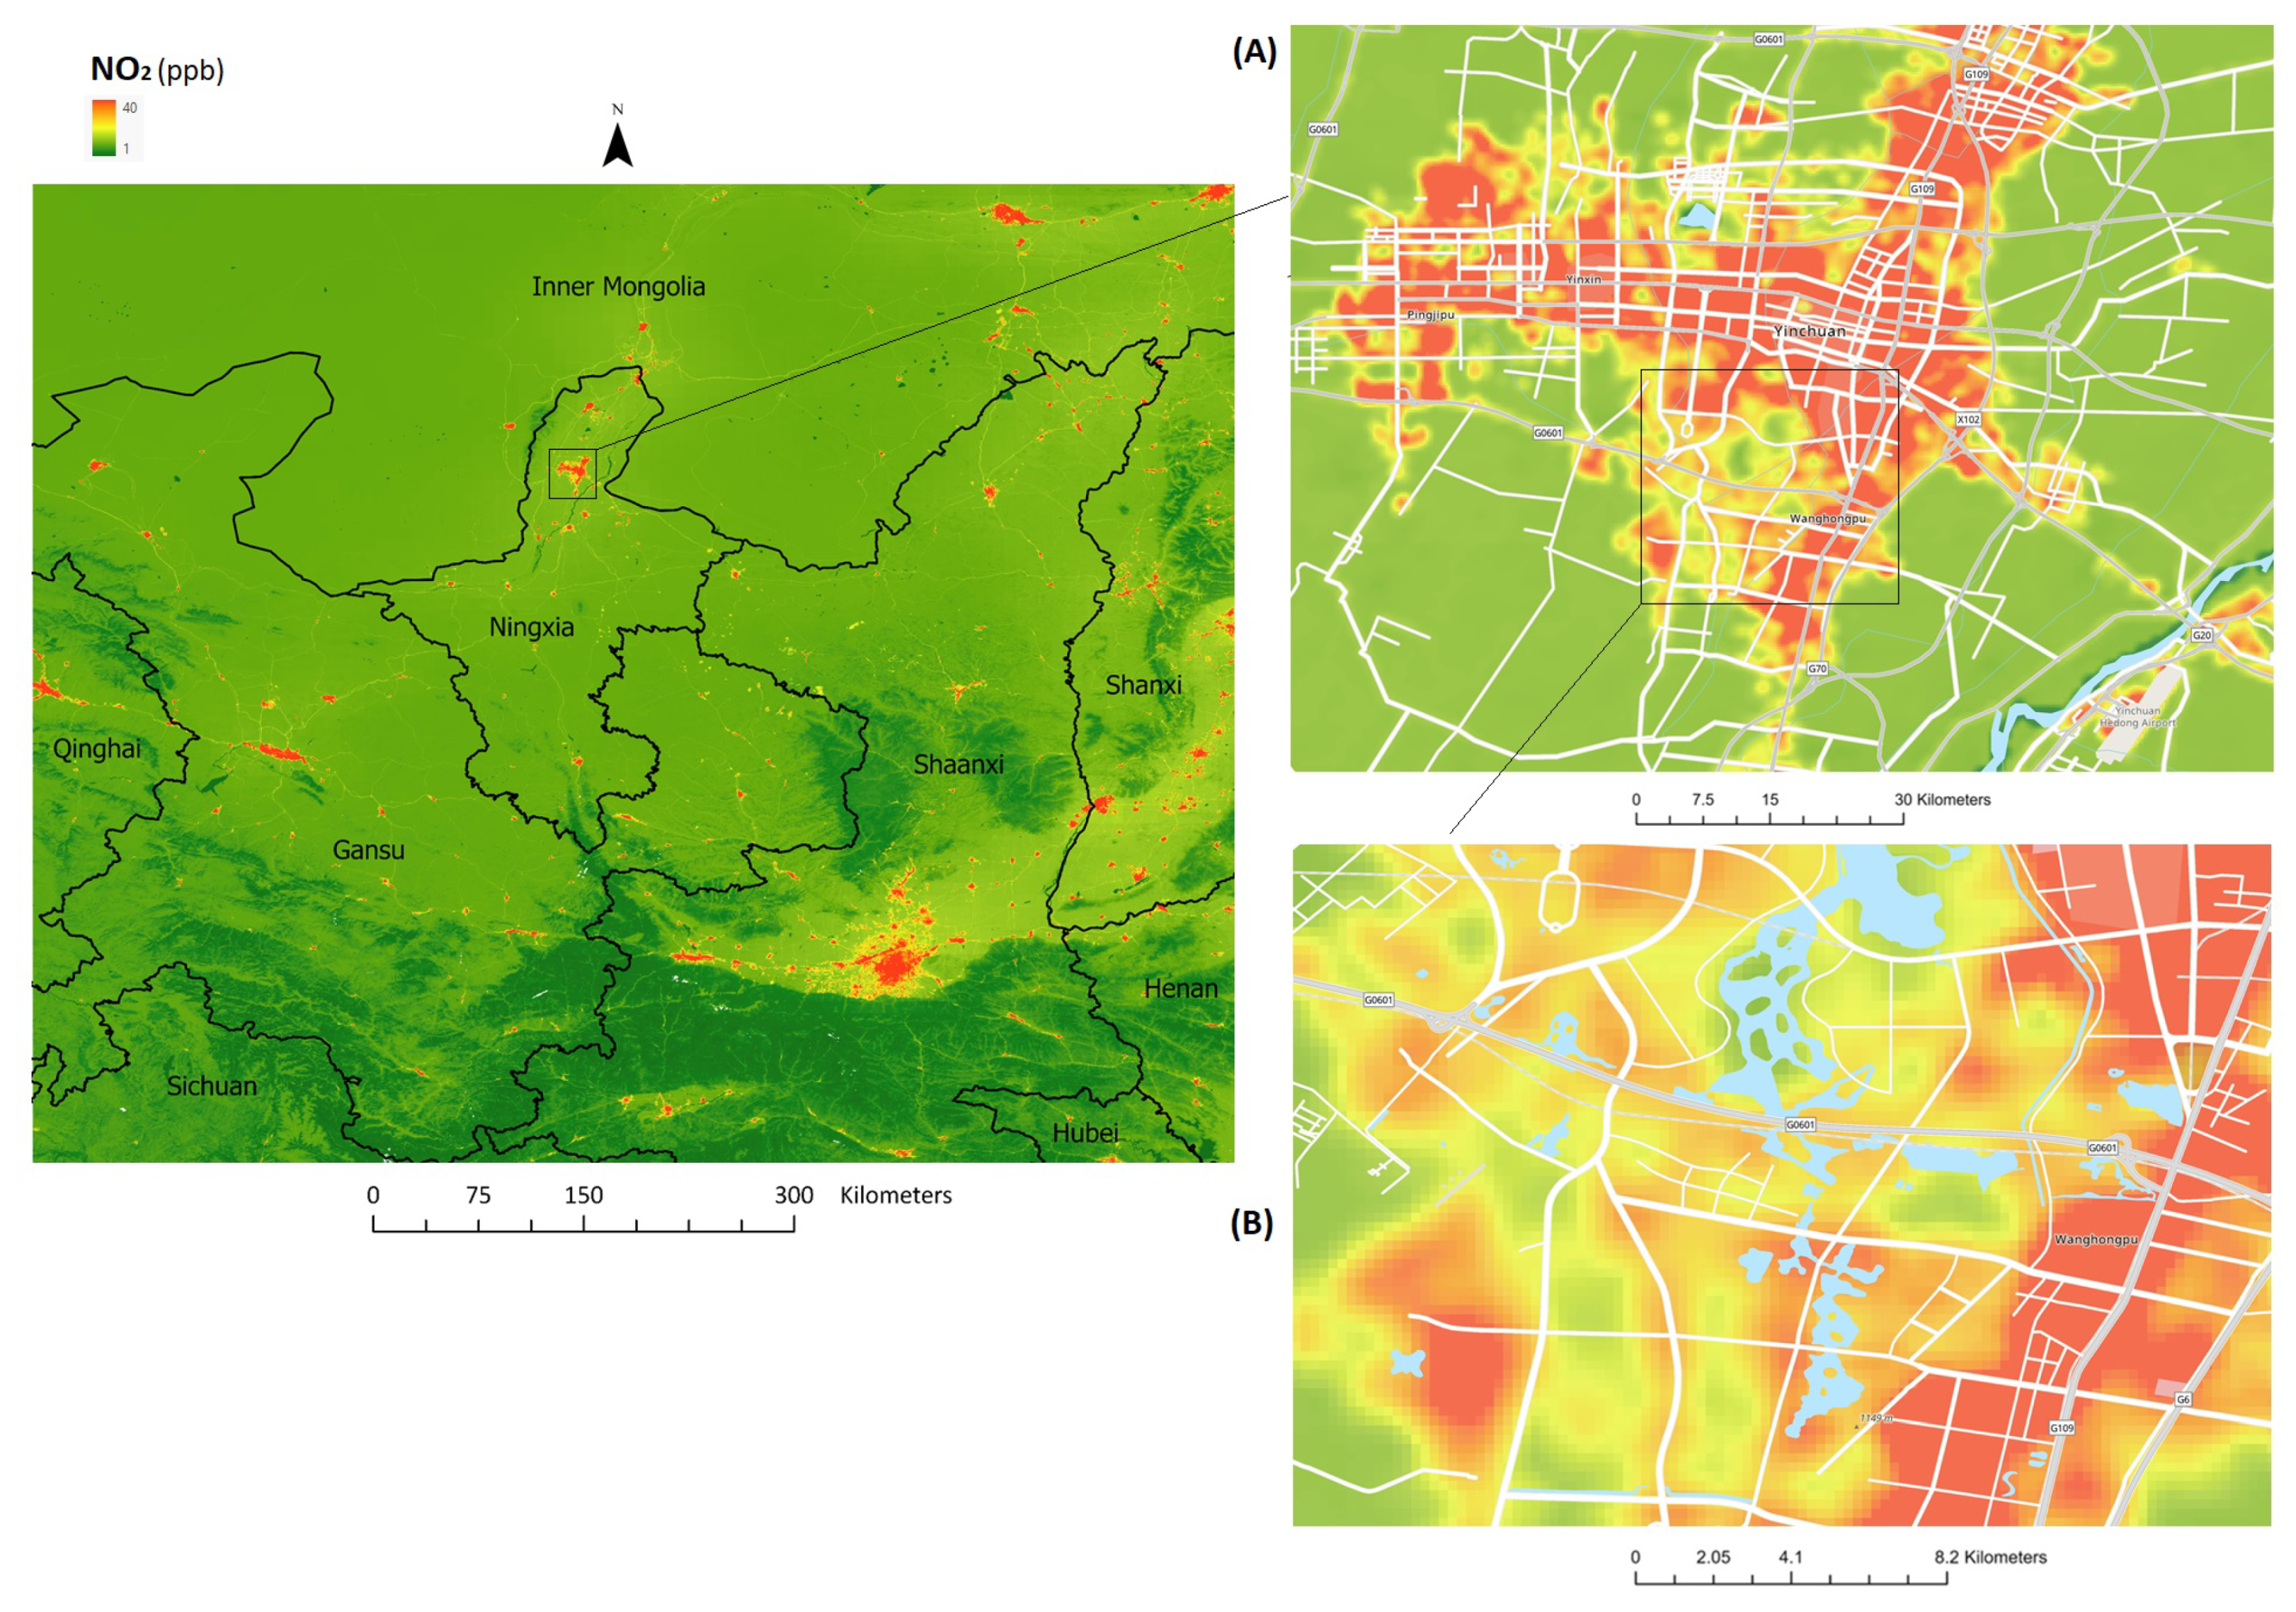
3.5. Model Predictions
4. Discussion
4.1. Overall Findings and Model Performance
4.2. Comparison with Existing LUR Models in China
4.3. Limitations
5. Conclusions
Supplementary Materials
Author Contributions
Funding
Institutional Review Board Statement
Informed Consent Statement
Data Availability Statement
Acknowledgments
Conflicts of Interest
References
- WHO. Ambient Air Pollution: A Global Assessment of Exposure and Burden of Disease; World Health Organization: Geneva, Switzerland, 2016. [Google Scholar]
- Babatola, S.S. Global burden of diseases attributable to air pollution. J. Public Health Afr. 2018, 9, 813. [Google Scholar] [CrossRef] [PubMed] [Green Version]
- Manisalidis, I.; Stavropoulou, E.; Stavropoulos, A.; Bezirtzoglou, E. Environmental and Health Impacts of Air Pollution: A Review. Front. Public Health 2020, 8, 14. [Google Scholar] [CrossRef] [PubMed] [Green Version]
- GBD 2019 Risk Factors Collaborators. Global burden of 87 risk factors in 204 countries and territories, 1990-2019: A systematic analysis for the Global Burden of Disease Study 2019. Lancet 2019, 396, 1223–1249. [Google Scholar] [CrossRef]
- Cohen, A.J.; Brauer, M.; Burnett, R.; Anderson, H.R.; Frostad, J.; Estep, K.; Balakrishnan, K.; Brunekreef, B.; Dandona, L.; Dandona, R.; et al. Estimates and 25-year trends of the global burden of disease attributable to ambient air pollution: An analysis of data from the Global Burden of Diseases Study 2015. Lancet 2017, 389, 1907–1918. [Google Scholar] [CrossRef] [Green Version]
- Batterman, S.; Berrocal, V.J.; Milando, C.; Gilani, O.; Arunachalam, S.; Zhang, K.M. Enhancing Models and Measurements of Traffic-Related Air Pollutants for Health Studies Using Dispersion Modeling and Bayesian Data Fusion. Res. Rep. Health Eff. Inst. 2020, 202, 1–63. [Google Scholar]
- Xu, H.; Bechle, M.J.; Wang, M.; Szpiro, A.A.; Vedal, S.; Bai, Y.; Marshall, J.D. National PM2.5 and NO2 exposure models for China based on land use regression, satellite measurements, and universal kriging. Sci. Total Environ. 2019, 655, 423–433. [Google Scholar] [CrossRef] [PubMed] [Green Version]
- Kobza, J.; Geremek, M. Do the pollution related to high-traffic roads in urbanised areas pose a significant threat to the local population? Environ. Monit. Assess. 2016, 189, 33. [Google Scholar] [CrossRef] [Green Version]
- Richmond-Bryant, J.; Owen, R.C.; Graham, S.; Snyder, M.; McDow, S.; Oakes, M.; Kimbrough, E.S. Estimation of on-road NO2 concentrations, NO2/NOX ratios, and related roadway gradients from near-road monitoring data. Air Qual. Atmos. Health 2017, 10, 611–625. [Google Scholar] [CrossRef] [PubMed]
- Paraschiv, S.; Paraschiv, L.-S. Analysis of traffic and industrial source contributions to ambient air pollution with nitrogen dioxide in two urban areas in Romania. Energy Procedia 2019, 157, 1553–1560. [Google Scholar] [CrossRef]
- Hoek, G. Methods for Assessing Long-Term Exposures to Outdoor Air Pollutants. Curr. Environ. Health Rep. 2017, 4, 450–462. [Google Scholar] [CrossRef] [PubMed]
- Di Tommaso, M.R.; Spigarelli, F.; Barbieri, E.; Rubini, L. Challenges for the Future and the Role of Industrial Policy. In International Business and Emerging Economy Firms; Springer: Singapore, 2020; pp. 163–183. [Google Scholar]
- Kan, H. Environment and Health in China: Challenges and Opportunities. Environ. Health Perspect. 2009, 117, A530–A531. [Google Scholar] [CrossRef] [Green Version]
- Han, W.; Li, Z.; Guo, J.; Su, T.; Chen, T.; Wei, J.; Cribb, M. The Urban–Rural Heterogeneity of Air Pollution in 35 Metropolitan Regions across China. Remote Sens. 2020, 12, 2320. [Google Scholar] [CrossRef]
- Knibbs, L.D.; Hewson, M.G.; Bechle, M.J.; Marshall, J.D.; Barnett, A. A national satellite-based land-use regression model for air pollution exposure assessment in Australia. Environ. Res. 2014, 135, 204–211. [Google Scholar] [CrossRef] [Green Version]
- Knibbs, L.D.; Van Donkelaar, A.; Martin, R.V.; Bechle, M.J.; Brauer, M.; Cohen, D.D.; Cowie, C.; Dirgawati, M.; Guo, Y.; Hanigan, I.; et al. Satellite-Based Land-Use Regression for Continental-Scale Long-Term Ambient PM2.5 Exposure Assessment in Australia. Environ. Sci. Technol. 2018, 52, 12445–12455. [Google Scholar] [CrossRef] [Green Version]
- Beelen, R.; Hoek, G.; Vienneau, D.; Eeftens, M.; Dimakopoulou, K.; Pedeli, X.; Tsai, M.-Y.; Künzli, N.; Schikowski, T.; Marcon, A.; et al. Development of NO2 and NOx land use regression models for estimating air pollution exposure in 36 study areas in Europe–The ESCAPE project. Atmos. Environ. 2013, 72, 10–23. [Google Scholar] [CrossRef]
- Vienneau, D.; de Hoogh, K.; Bechle, M.J.; Beelen, R.; van Donkelaar, A.; Martin, R.V.; Millet, D.B.; Hoek, G.; Marshall, J.D. Western European Land Use Regression Incorporating Satellite- and Ground-Based Measurements of NO2 and PM10. Environ. Sci. Technol. 2013, 47, 13555–13564. [Google Scholar] [CrossRef]
- Larkin, A.; Geddes, J.A.; Martin, R.V.; Xiao, Q.; Liu, Y.; Marshall, J.D.; Brauer, M.; Hystad, P. Global Land Use Regression Model for Nitrogen Dioxide Air Pollution. Environ. Sci. Technol. 2017, 51, 6957–6964. [Google Scholar] [CrossRef]
- Jin, L.; Berman, J.D.; Warren, J.L.; Levy, J.I.; Thurston, G.; Zhang, Y.; Xu, X.; Wang, S.; Zhang, Y.; Bell, M.L. A land use regression model of nitrogen dioxide and fine particulate matter in a complex urban core in Lanzhou, China. Environ. Res. 2019, 177, 108597. [Google Scholar] [CrossRef] [PubMed]
- Chen, L.; Bai, Z.; Kong, S.; Han, B.; You, Y.; Ding, X.; Du, S.; Liu, A. A land use regression for predicting NO2 and PM10 concentrations in different seasons in Tianjin region, China. J. Environ. Sci. 2010, 22, 1364–1373. [Google Scholar] [CrossRef]
- Qin, K.; Rao, L.; Xu, J.; Bai, Y.; Zou, J.; Hao, N.; Li, S.; Yu, C. Estimating Ground Level NO2 Concentrations over Central-Eastern China Using a Satellite-Based Geographically and Temporally Weighted Regression Model. Remote Sens. 2017, 9, 950. [Google Scholar] [CrossRef] [Green Version]
- Yang, X.; Zheng, Y.; Geng, G.; Liu, H.; Man, H.; Lv, Z.; He, K.; de Hoogh, K. Development of PM 2.5 and NO 2 models in a LUR framework incorporating satellite remote sensing and air quality model data in Pearl River Delta region. China. Environ. Pollut. 2017, 226, 143–153. [Google Scholar] [CrossRef]
- Huang, L.; Zhang, C.; Bi, J. Development of land use regression models for PM2.5, SO2, NO2 and O3 in Nanjing, China. Environ. Res. 2017, 158, 542–552. [Google Scholar] [CrossRef] [PubMed]
- Li, C.; Du, S.-Y.; Bai, Z.-P.; Shao-Fei, K.; Yan, Y.; Bin, H.; Dao-Wen, H.; Li, Z.-Y. Application of land use regression for estimating concentrations of major outdoor air pollutants in Jinan, China. J. Zhejiang Univ. A 2010, 11, 857–867. [Google Scholar] [CrossRef]
- Liu, C.; Henderson, B.H.; Wang, D.; Yang, X.; Peng, Z.-R. A land use regression application into assessing spatial variation of intra-urban fine particulate matter (PM2.5) and nitrogen dioxide (NO2) concentrations in City of Shanghai, China. Sci. Total Environ. 2016, 565, 607–615. [Google Scholar] [CrossRef]
- Meng, X.; Chen, L.; Cai, J.; Zou, B.; Wu, C.-F.; Fu, Q.; Zhang, Y.; Liu, Y.; Kan, H. A land use regression model for estimating the NO2 concentration in shanghai, China. Environ. Res. 2015, 137, 308–315. [Google Scholar] [CrossRef] [PubMed]
- Zhang, Z.; Wang, J.; Hart, J.E.; Laden, F.; Zhao, C.; Li, T.; Zheng, P.; Li, D.; Ye, Z.; Chen, K. National scale spatiotemporal land-use regression model for PM2.5, PM10 and NO2 concentration in China. Atmos. Environ. 2018, 192, 48–54. [Google Scholar] [CrossRef]
- Yang, Y.R.; McManus, D.P.; Gray, D.J.; Wang, X.L.; Yang, S.K.; Ross, A.G.; Williams, G.M.; Ellis, M.K. Evaluation of the tuberculosis programme in Ningxia Hui Autonomous region, the People’s Republic of China: A retrospective case study. BMC Public Health 2012, 12, 1110. [Google Scholar] [CrossRef] [Green Version]
- Restrepo, A.M.C.; Yang, Y.R.; McManus, D.P.; Gray, D.J.; Barnes, T.S.; Williams, G.M.; Magalhaes, R.S.; Hamm, N.A.S.; Clements, A.C.A. Spatiotemporal patterns and environmental drivers of human echinococcoses over a twenty-year period in Ningxia Hui Autonomous Region, China. Parasites Vectors 2018, 11, 1–19. [Google Scholar] [CrossRef]
- UN Data. City Population by Sex, City and City Type; U.N.S. Division, Ed.; United Nations: New York, NY, USA, 2021. [Google Scholar]
- Carbon Brief. Global Coal Power Plant Emissions; Carbon Brief: London, UK, 2019. [Google Scholar]
- OpenAQ. OpenAQ Platform; Open AQ Inc.: Washington, DC, USA, 2019. [Google Scholar]
- Van Der A, R.J.; Peters, D.H.M.U.; Eskes, H.; Boersma, K.F.; Van Roozendael, M.; De Smedt, I.; Kelder, H.M. Detection of the trend and seasonal variation in tropospheric NO2 over China. J. Geophys. Res. Atmos. 2006, 111, D12. [Google Scholar] [CrossRef] [Green Version]
- Eeftens, M.; Beelen, R.; De Hoogh, K.; Bellander, T.; Cesaroni, G.; Cirach, M.; Declercq, C.; Dedele, A.; Dons, E.; De Nazelle, A.; et al. Development of Land Use Regression models for PM(2.5), PM(2.5) absorbance, PM(10) and PM(coarse) in 20 European study areas; results of the ESCAPE project. Environ. Sci. Technol. 2012, 46, 11195–11205. [Google Scholar] [CrossRef] [PubMed]
- de Hoogh, K.; Gulliver, J.; van Donkelaar, A.; Martin, R.V.; Marshall, J.D.; Bechle, M.J.; Cesaroni, G.; Pradas, M.C.; Dedele, A.; Eeftens, M.; et al. Development of West-European PM(2.5) and NO(2) land use regression models incorporating satellite-derived and chemical transport modelling data. Environ. Res. 2016, 151, 1–10. [Google Scholar] [CrossRef] [Green Version]
- Hebbali, A. Tools for Building OLS Regression Models; Rsquared Academy: Chennai, India, 2020. [Google Scholar]
- Kuhn, M.W.J.; Western, S.; Williams, A.; Keefer, C.; Engelhardt, A.; Cooper, T.; Mayer, Z.; Kenkel, B.; Benesty, M.; Lescarbeau, R. Caret Package’-Misc functions for training and plotting classification and regression models. J. Stat. Softw. 2008, 28, 5. [Google Scholar]
- Shakor, A.; Su’ad, A.; Pahrol, M.A.; Mazeli, M.I. Effects of Population Weighting on PM10 Concentration Estimation. J. Environ. Public Health 2020, 2020, 1561823. [Google Scholar]
- WorldPop. Global High Resolution Population Denominators Project; U.o.S. School of Geography and Environmental Science, Ed.; University of Southampton: Southampton, UK, 2020. [Google Scholar]
- Liu, W.; Li, X.; Chen, Z.; Zeng, G.; León, T.; Liang, J.; Huang, G.; Gao, Z.; Jiao, S.; He, X.; et al. Land use regression models coupled with meteorology to model spatial and temporal variability of NO2 and PM10 in Changsha, China. Atmos. Environ. 2015, 116, 272–280. [Google Scholar] [CrossRef]
- Liu, Z.; Guan, Q.; Luo, H.; Wang, N.; Pan, N.; Yang, L.; Xiao, S.; Lin, J. Development of land use regression model and health risk assessment for NO2 in different functional areas: A case study of Xi’an, China. Atmos. Environ. 2019, 213, 515–525. [Google Scholar] [CrossRef]


| Variable (Units) | Spatial Resolution | Point or Buffer Estimate |
|---|---|---|
| OMI (Ozone Monitoring Instrument) NO2 observations (ppb) | 10 km | Point |
| Elevation (m) | 90 m | Point |
| Annual mean Temperature (°C) | 1 km | Point |
| Annual mean Precipitation (mm) | 1 km | Point |
| Distance to nearest major road (km) | - | Point |
| Distance to nearest coal power station (km) | - | Point |
| Vegetation cover (%) | 250 m | Buffer Average |
| Tree cover (%) | 30 m | Buffer Average |
| Impervious surfaces (%) | 250 m | Buffer Average |
| Water cover (%) | 500 m | Buffer Average |
| Active Fires (fires/1000 km2/day) | 10 km | Buffer Sum |
| Population density (persons/km2) | 1 km | Buffer Average |
| Major roads (km) | - | Buffer Sum |
| Minor roads (km) | - | Buffer Sum |
| Power Plant Emissions (tons of CO2/year) | - | Buffer Sum |
| Land use by type—Residential, Commercial, and Industrial (%) | - | Buffer Average |
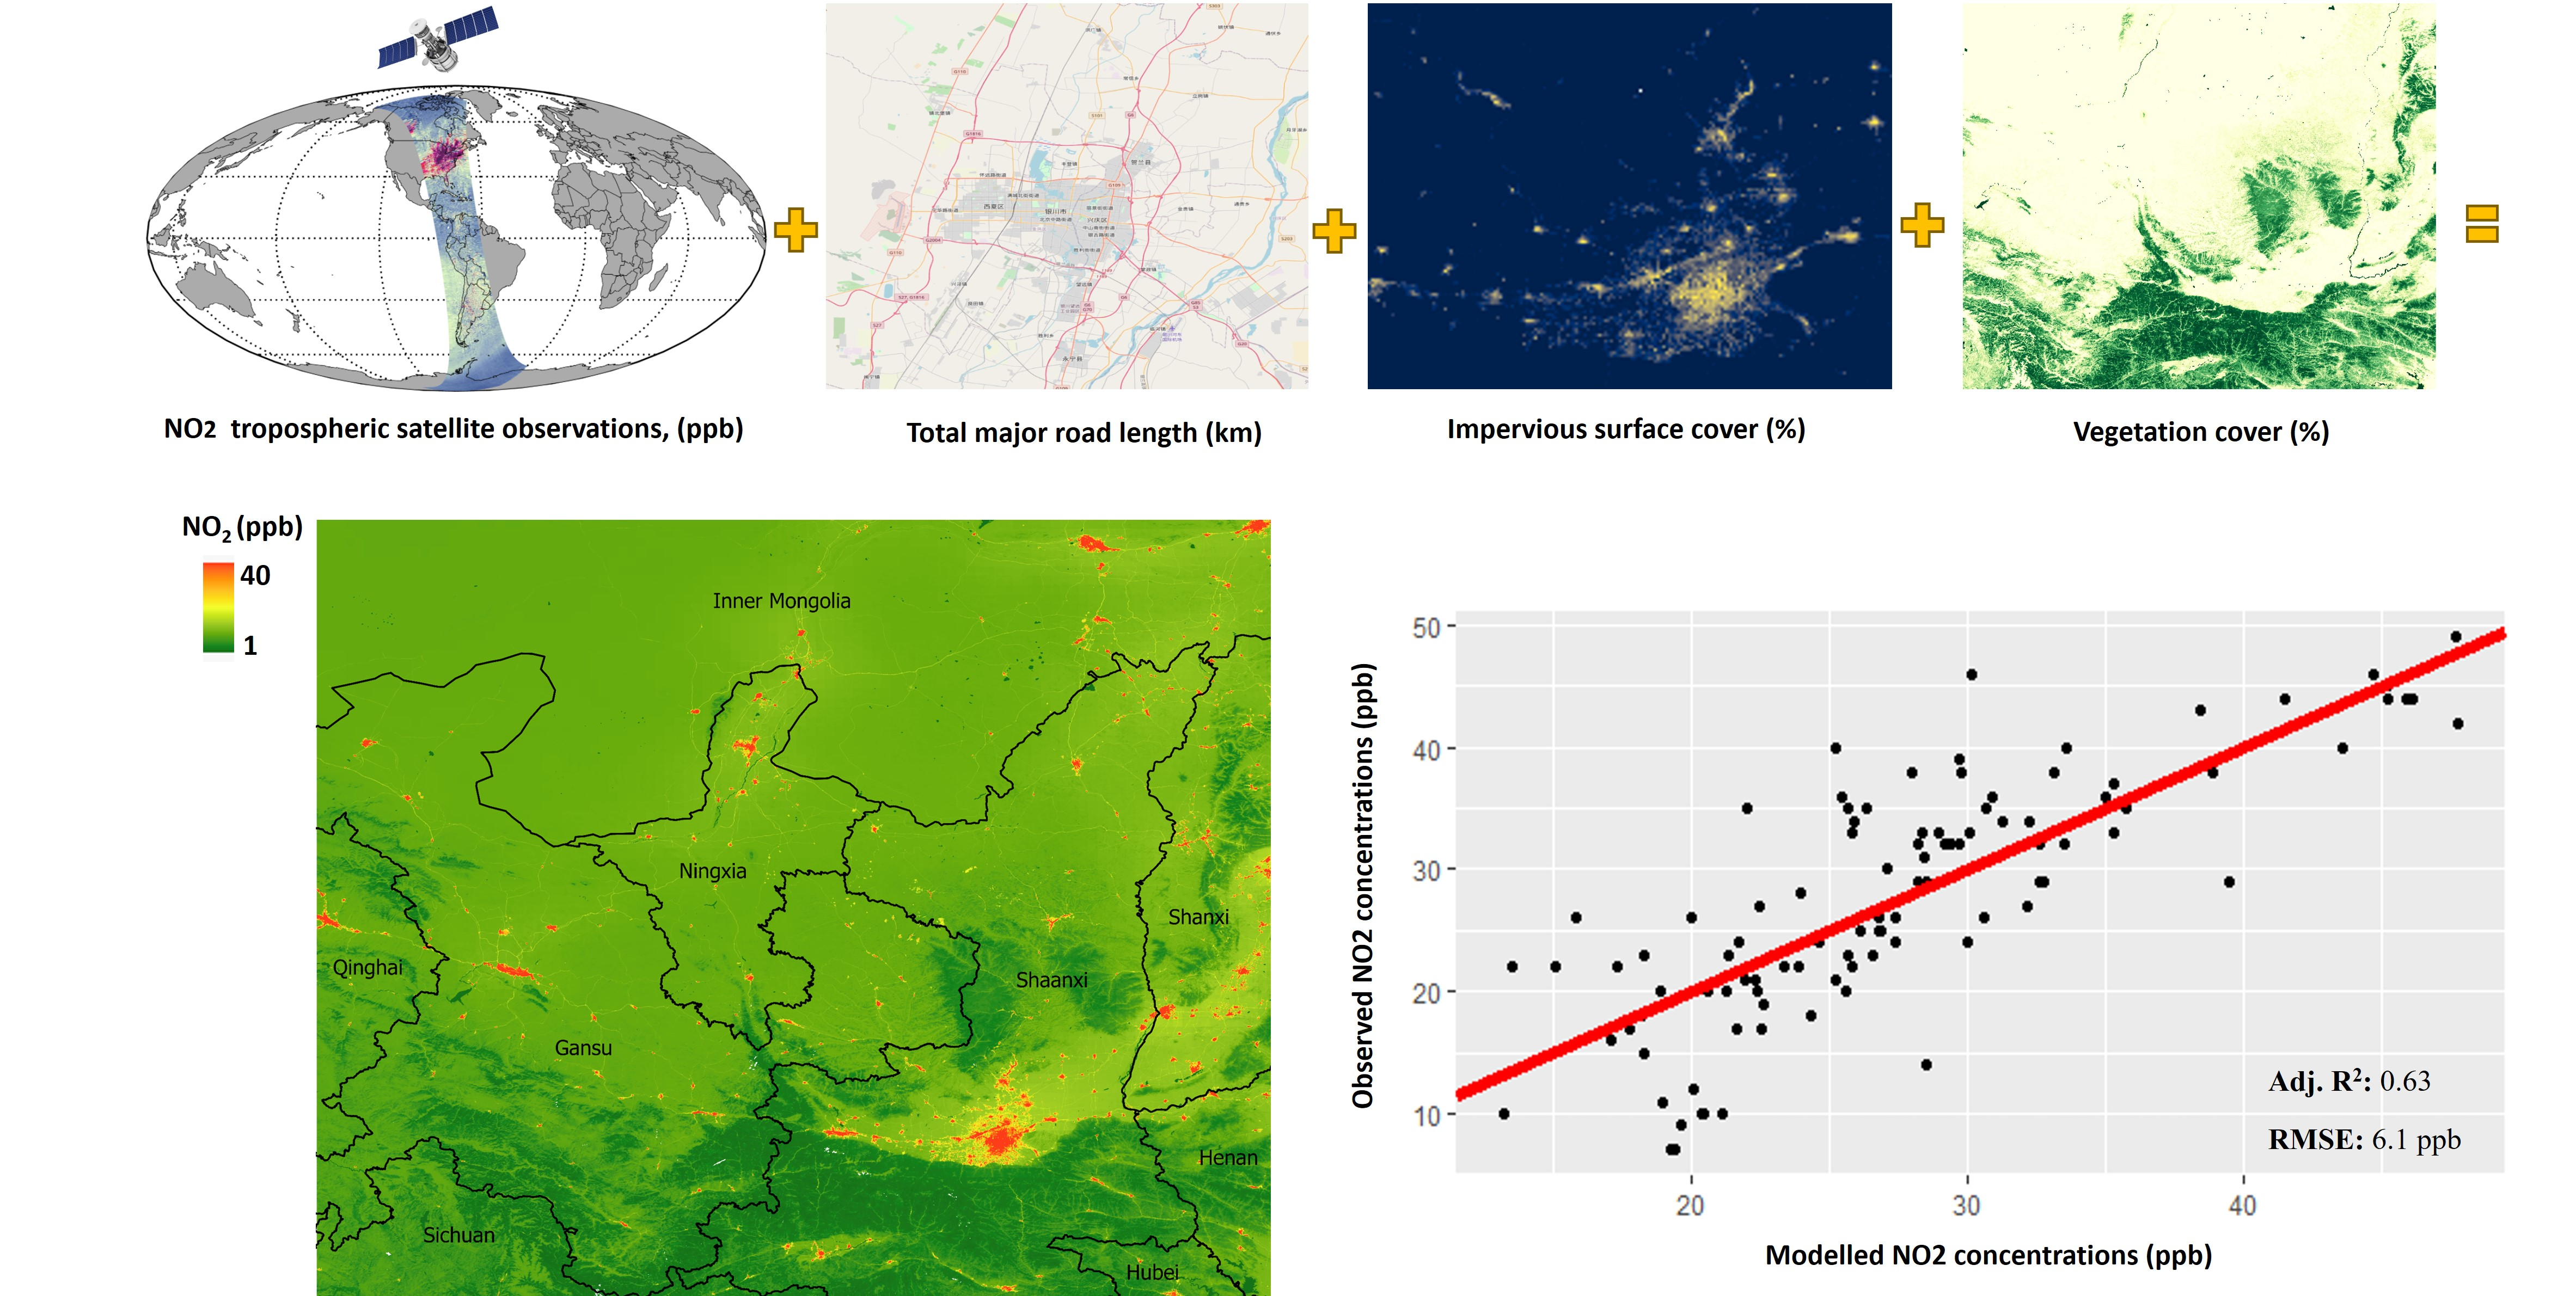
| Final Model Output | Predictor, Buffer (Units) | Β * | SE | Adj. R2 | VIF | Contribution to Model (%) |
|---|---|---|---|---|---|---|
| R2: 0.64 | Intercept | 27.40 | 0.59 | |||
| Adj. R2: 0.63 | (OMI) tropospheric NO2, (ppb) | 6.03 | 0.83 | 0.45 | 1.96 | 45% |
| RMSE: 6.1 ppb | Major roads, 5 km (km) | 3.02 | 0.80 | 0.53 | 1.76 | 8% |
| % RMSE: 21.9 % | Vegetation cover, 1.8 km (%) | −3.43 | 0.71 | 0.61 | 1.47 | 8% |
| Impervious surface, 7 km (%) | 1.87 | 0.76 | 0.63 | 1.67 | 2% |
| Year | 5th | 25th | 50th | 75th | 95th | Unweighted Average | Population Weighted Average |
|---|---|---|---|---|---|---|---|
| 2005 | 11.0 | 13.6 | 14.5 | 17.4 | 21.7 | 14.9 | 15.6 |
| 2006 | 11.1 | 14.0 | 14.7 | 17.6 | 21.9 | 15.4 | 16.1 |
| 2007 | 11.2 | 14.1 | 15.0 | 17.9 | 22.0 | 15.6 | 16.3 |
| 2008 | 11.4 | 14.3 | 15.1 | 17.9 | 22.2 | 15.7 | 16.4 |
| 2009 | 11.5 | 14.3 | 15.1 | 18.0 | 22.4 | 15.9 | 16.6 |
| 2010 | 11.6 | 14.3 | 15.3 | 18.0 | 22.6 | 15.9 | 16.6 |
| 2011 | 11.8 | 14.4 | 15.5 | 18.0 | 22.8 | 16.1 | 16.7 |
| 2012 | 12.0 | 14.5 | 15.6 | 18.1 | 23.0 | 16.5 | 17.0 |
| 2013 | 12.2 | 14.7 | 15.6 | 18.2 | 23.1 | 16.7 | 17.2 |
| 2014 | 12.3 | 14.8 | 15.7 | 18.4 | 23.3 | 16.8 | 17.3 |
| 2015 | 12.4 | 14.8 | 15.8 | 18.6 | 23.5 | 16.7 | 17.3 |
| 2016 | 12.5 | 14.8 | 15.8 | 18.7 | 23.7 | 16.8 | 17.4 |
| 2017 | 12.7 | 15.0 | 15.9 | 18.7 | 23.7 | 16.9 | 17.5 |
| 2018 | 12.8 | 15.2 | 16.1 | 18.7 | 23.8 | 16.9 | 17.5 |
Publisher’s Note: MDPI stays neutral with regard to jurisdictional claims in published maps and institutional affiliations. |
© 2021 by the authors. Licensee MDPI, Basel, Switzerland. This article is an open access article distributed under the terms and conditions of the Creative Commons Attribution (CC BY) license (https://creativecommons.org/licenses/by/4.0/).
Share and Cite
Popovic, I.; Magalhães, R.J.S.; Yang, S.; Yang, Y.; Ge, E.; Yang, B.; Dong, G.; Wei, X.; Marks, G.B.; Knibbs, L.D. Development and Validation of a Sub-National, Satellite-Based Land-Use Regression Model for Annual Nitrogen Dioxide Concentrations in North-Western China. Int. J. Environ. Res. Public Health 2021, 18, 12887. https://doi.org/10.3390/ijerph182412887
Popovic I, Magalhães RJS, Yang S, Yang Y, Ge E, Yang B, Dong G, Wei X, Marks GB, Knibbs LD. Development and Validation of a Sub-National, Satellite-Based Land-Use Regression Model for Annual Nitrogen Dioxide Concentrations in North-Western China. International Journal of Environmental Research and Public Health. 2021; 18(24):12887. https://doi.org/10.3390/ijerph182412887
Chicago/Turabian StylePopovic, Igor, Ricardo J. Soares Magalhães, Shukun Yang, Yurong Yang, Erjia Ge, Boyi Yang, Guanghui Dong, Xiaolin Wei, Guy B. Marks, and Luke D. Knibbs. 2021. "Development and Validation of a Sub-National, Satellite-Based Land-Use Regression Model for Annual Nitrogen Dioxide Concentrations in North-Western China" International Journal of Environmental Research and Public Health 18, no. 24: 12887. https://doi.org/10.3390/ijerph182412887
APA StylePopovic, I., Magalhães, R. J. S., Yang, S., Yang, Y., Ge, E., Yang, B., Dong, G., Wei, X., Marks, G. B., & Knibbs, L. D. (2021). Development and Validation of a Sub-National, Satellite-Based Land-Use Regression Model for Annual Nitrogen Dioxide Concentrations in North-Western China. International Journal of Environmental Research and Public Health, 18(24), 12887. https://doi.org/10.3390/ijerph182412887