Article

Association between Temporomandibular Joint Disorder and Weight Changes: A Longitudinal Follow-Up Study Using a National Health Screening Cohort

1
Department of Otorhinolaryngology-Head & Neck Surgery, CHA Bundang Medical Center, CHA University, Seongnam 13496, Korea
2
Hallym Data Science Laboratory, Hallym University College of Medicine, Anyang 14068, Korea
3
Department of Oral & Maxillofacial Surgery, Dentistry, Hallym University College of Medicine, Anyang 14068, Korea
4
Graduate School of Public Health, Seoul National University, Seoul 08826, Korea
5
Department of Neurosurgery, Hallym University College of Medicine, Anyang 14068, Korea
6
Department of Pathology, Hallym University College of Medicine, Anyang 14068, Korea
7
Division of Pulmonary, Allergy, and Critical Care Medicine, Department of Medicine, Hallym University College of Medicine, Anyang 14068, Korea
8
Department of Otorhinolaryngology-Head & Neck Surgery, Hallym University College of Medicine, Anyang 14068, Korea
*
Author to whom correspondence should be addressed.
These two authors are equally contributed to this work.
Int. J. Environ. Res. Public Health 2021, 18(22), 11793; https://doi.org/10.3390/ijerph182211793
Submission received: 13 October 2021 / Revised: 4 November 2021 / Accepted: 6 November 2021 / Published: 10 November 2021
(This article belongs to the Special Issue 2nd Edition: The Impact of ENT Diseases in Social Life)

Abstract

:
This study aimed to investigate BMI changes following a temporomandibular joint disorder (TMJD) diagnosis. The Korean National Health Insurance Service-Health Screening Cohort from 2002 to 2015 was used. In Study I, 1808 patients with TMJD (TMJD I) were matched with 7232 participants in comparison group I. The change in BMI was compared between the TMJD I and comparison I groups for 1 year. In study II, 1621 patients with TMJD (TMJD II) were matched with 6484 participants in comparison group II participants. The change in BMI was compared between the TMJD II and comparison II groups for 2 years. In Study I, the BMI change was not associated with TMJD. In Study II, the BMI change was associated with TMJD in the interaction of the linear mixed model (p = 0.003). The estimated value (EV) of the linear mixed model was −0.082. The interaction was significant in women < 60 years old, women ≥ 60 years old, and the obese I category. TMJD was not associated with BMI changes after 1–2 years in the overall population. In women and obese patients, TMJD was associated with a decrease in BMI after 2 years.

1. Introduction

Temporomandibular disorder (TMD) is a group of disorders that includes temporomandibular joint (TMJ) pain and dysfunction. It might originate from changes in the structure and function of the TMJ, masticator muscle, and osseous structure [1]. It is the most common orofacial pain, and its prevalence is ~20% of the general population [2]. The peak onset age of TMD was reported to be between 20 and 40 years old and to mainly present in women [3]. In Korea, 11.8% of the general population experiences TMD [4]. The risk factors for TMD have been reported to be obesity, occlusion abnormalities, bruxism, trauma, osteoporosis, stress, anxiety, and depression [5,6]. Temporomandibular joint disorder (TMJD) is one of the common etiologies of TMD, and is prevalent in older population without gender preference [7].
The common symptoms of TMD are pain and difficulty during mastication [1]. It results in problems in the oral preparatory phase with solid (33%) and liquid (28%) swallowing [8]. TMD can cause headaches, neck pain, body pain, and dietary problems [9,10]. It has also been reported that TMD can cause weight loss (26%) [8]. However, this last study was not compared with an appropriate comparison group and studied in a limited population (n = 178) using only a self-report survey [8].
We hypothesized that TMJD might be associated with weight loss, as it is closely associated to mastication function. However, this relationship had not previously been evaluated using rigorous methods. We evaluated this association using health check-up data that were objectively measured and compared the data with the matched comparison participants using a large population-based cohort.

2. Materials and Methods

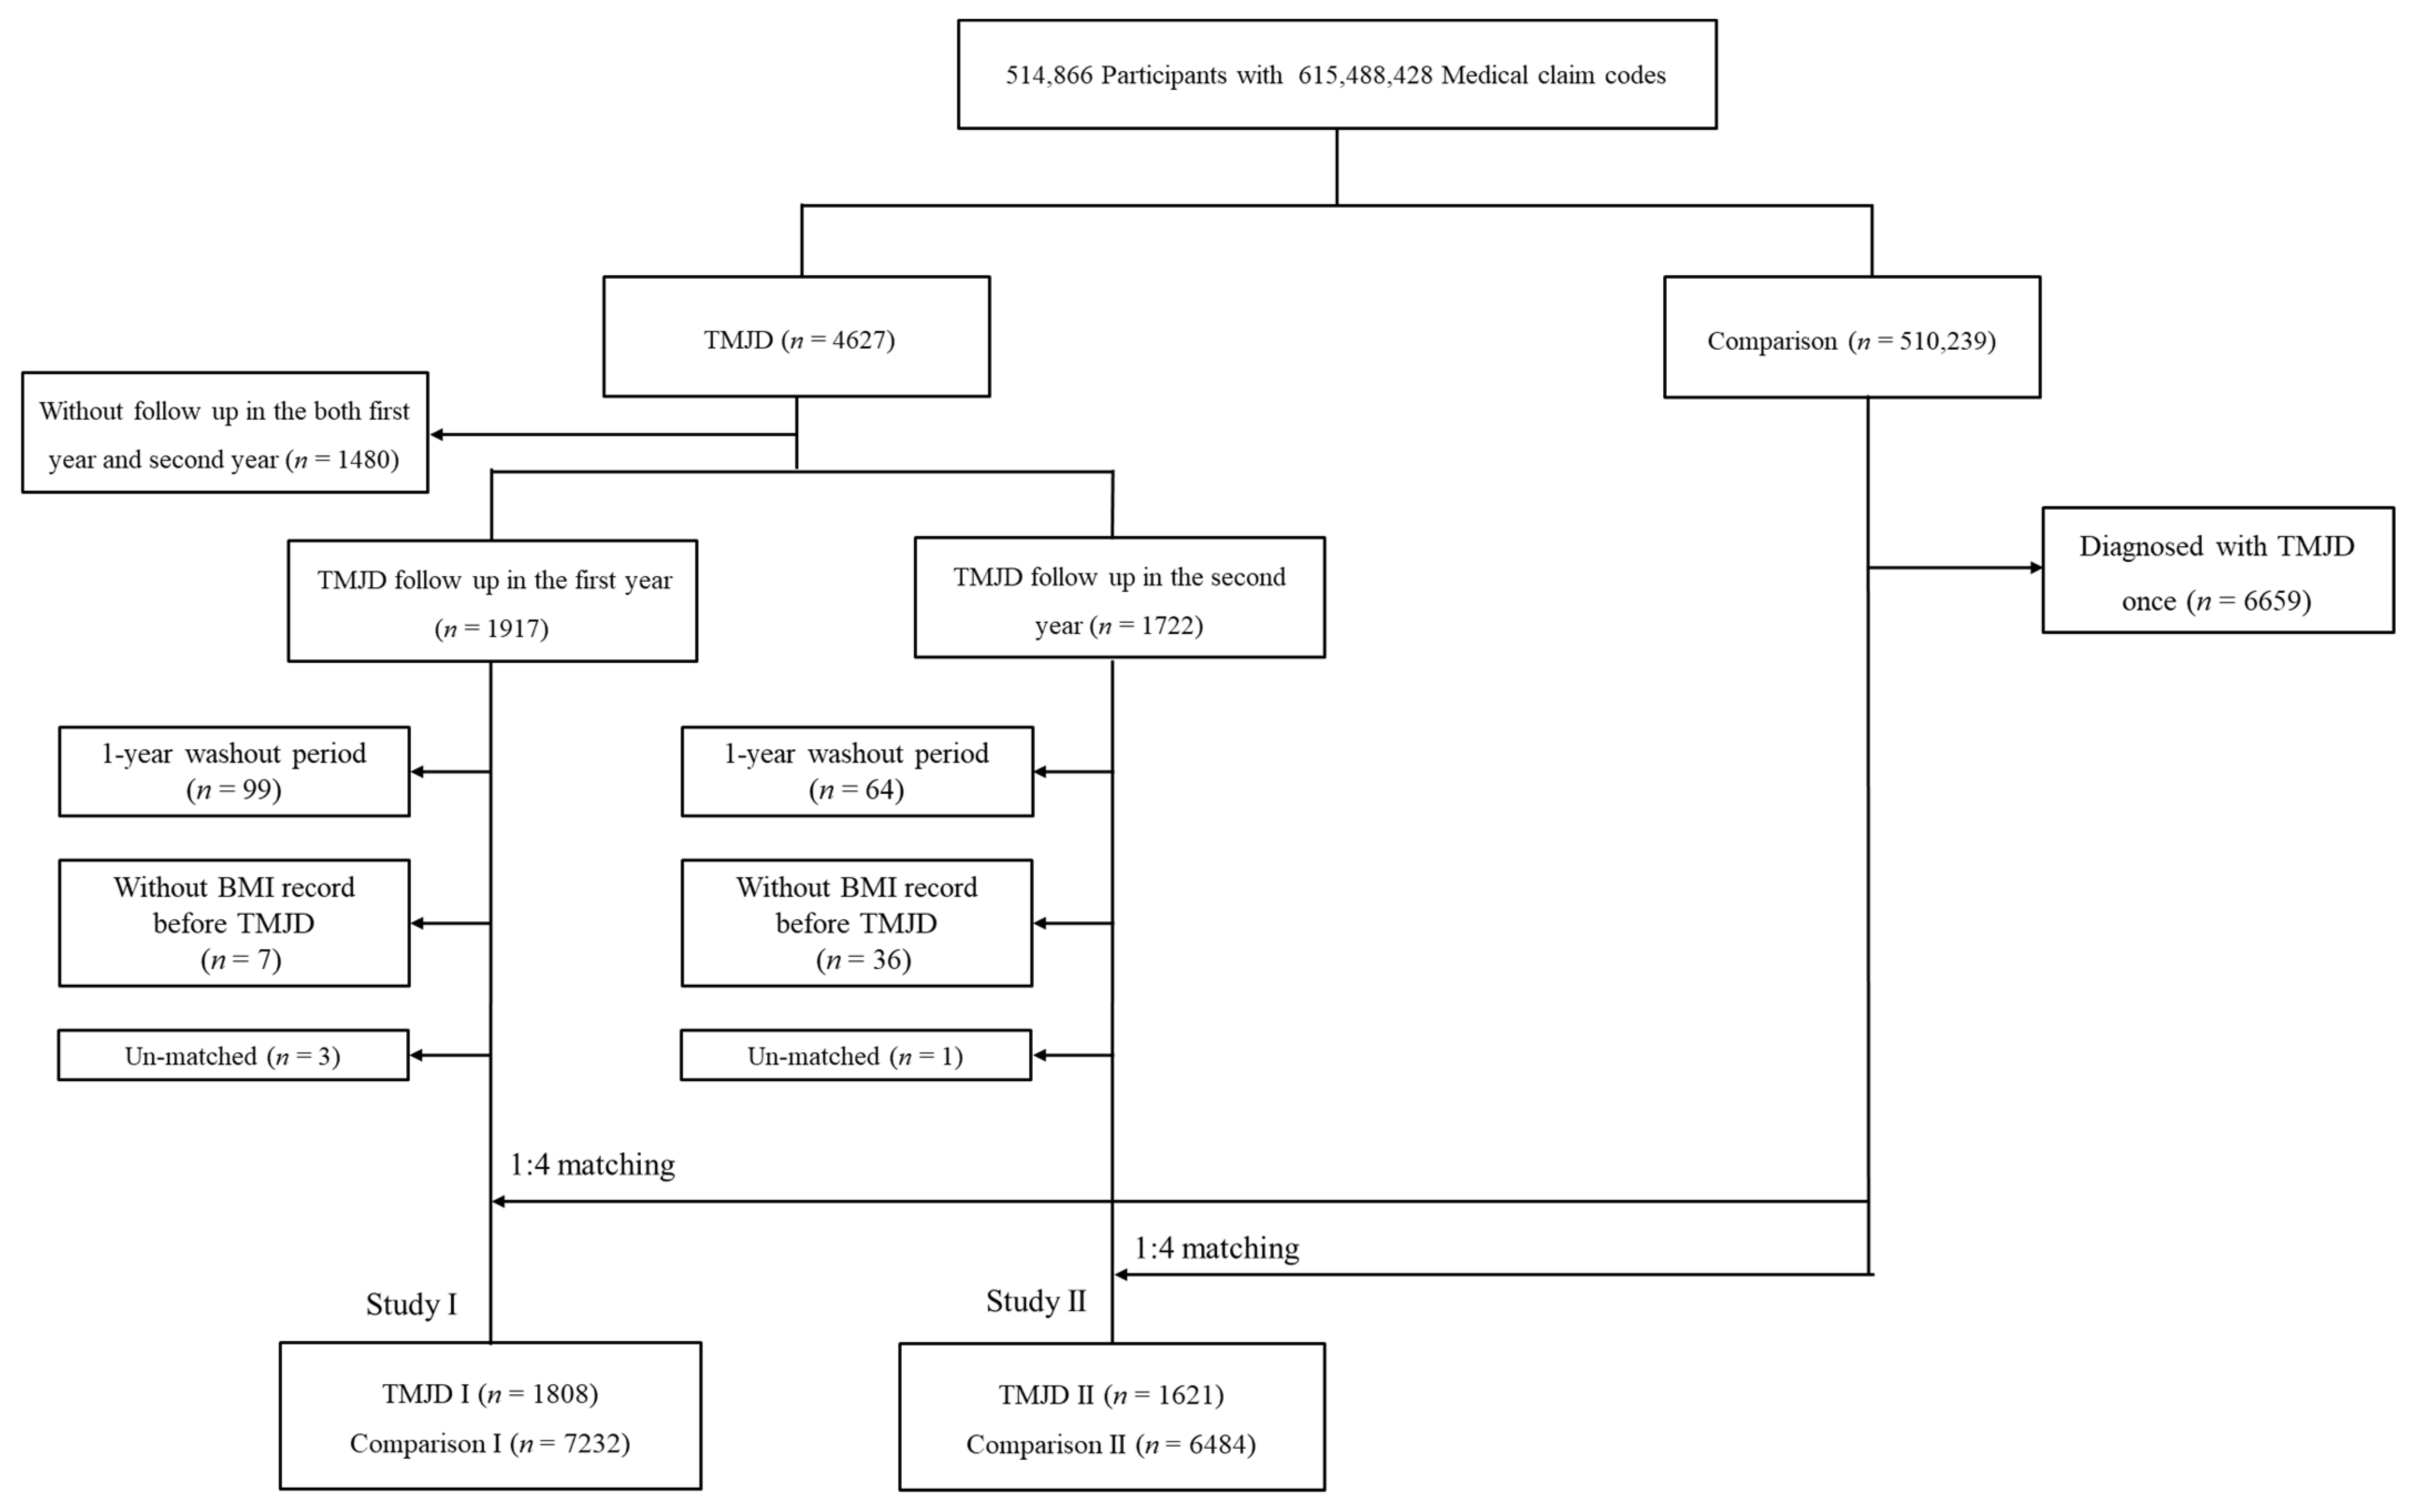
2.1. Study Population

This study was approved by the Ethics Committee of Hallym University (2019-10-023). The Institutional Review Board waived the requirement of written informed consent. This study used the Korean National Health Insurance Service–Health Screening Cohort data [11].

2.2. Definition of Temporomandibular Joint Disorder (Independent Variable)

The participants had been diagnosed under the diagnostic code for TMJD (ICD-10: K07.6 (temporomandibular joint disorders)). Participants who had histories of two or more clinical visits presenting with TMJD were included [9,12].

2.3. Definition of Weight Change (Dependent Variable)

In study I, BMI change safter one year from the TMJD diagnosis were followed up. In study II, BMI changes after two years from the diagnosis of TMJD were followed up (Study II).

2.4. Participant Selection

From total cohort data from 2002–2015 with 514,866 participants, 4627 TMJD participants were enrolled. TMJD participants who did not provide follow-up data (n = 1480) were excluded. From the identical total cohort data, comparison participants who had no history of TMJD were selected (n = 510,239). Comparison participants who had a history of TMJD were excluded (n = 6659). The comparison participants were randomly selected to prevent selection bias. The 1917 comparison participants provided 1-year follow-up data. The 1722 comparison participants provided 2-year follow-up data. A total of 492 comparison participants provided both one-year and two-year follow-up data.
In Study I, 99 TMJD participants were excluded due to a diagnosed history of TMJD before 2002 (washout periods). TMJD participants who did not have BMI records were excluded (n = 7). TMJD participants were 1:4 matched with comparison participants for age, sex, income, region of residence, and obesity. The index date of each TMJD participant was defined as the time of diagnosis of TMJD. The index date of the comparison participants was matched with their matched TMJD participants. Three TMJD participants and 496,348 comparison participants were excluded due to unmatched data. Finally, 1808 participants in the TMJD I group and 7232 participants in the comparison I group were selected (Figure 1).
In Study II, TMJD participants who had been followed up for 2 or more years were selected. The TMD participants and their matched comparison II participants were enrolled with identical inclusion and exclusion criteria. There were 64 patients who were diagnosed with TMJD before 2002 and 36 patients who did not have BMI records. These TMJD patients were excluded from the TMJD II group. Finally, 1621 TMJD II participants and 6484 comparison II participants were enrolled (Figure 1).

2.5. Covariates

The 40 years and older study population was divided into 10 age groups with 5-year intervals. Level of income was divided into 5 classes [13]. Regions of residence was divided into urban and rural areas [11]. Participants’ histories of tobacco smoking and alcohol consumption were surveyed. Participants’ systolic blood pressure, diastolic blood pressure, fasting blood glucose, and total cholesterol levels were measured [11]. The Charlson Comorbidity Index (CCI) was calculated as a continuous variable (between 0 (no comorbidities) and 29 (multiple comorbidities)). BMI (kg/m2) was classified as underweight (<18.5), normal (≥18.5 to <23), overweight (≥23 to <25), obese I (≥25 to <30), or obese II (≥30) [14].

2.6. Statistical Analyses

The chi-square test was used to calculate the differences in the rates of general characteristics.
Paired t-tests were used to analyze the differences in weight pre- and post-TMJD diagnosis. A linear mixed model was used to analyze the interaction and estimated value (EV). The independent variables of age, sex, income, region of residence, TMJD, and time of measurement were used as the fixed effects. BMI, systolic blood pressure, diastolic blood pressure, fasting blood glucose, total cholesterol level, smoking status, alcohol consumption, and CCI scores were used as random effects. A first-order autoregressive model was selected as the repeated covariance type, which considered the correlation of each participant’s iteration. The statistical analysis model of the linear mixed model is as follows.
Y i = X i 1 β 1   + . .   . + X i p β p + Z i 1 u i + . .   . + Z i q u q + e i ,   for   all   i = 1 , , n  
where Y = ( Y 1 , ,   Y n )′, X is the n × p matrix of covariates with fixed effects β = β 1 , ,   β p , Z is the n × q matrix of covariates with random effects, u = u 1 , ,   u q ~   N 0 , τ I q , and the residual error vector e = e 1 , ,   e n ~   N 0 , τ I n , .
Subgroup analyses were conducted according to age and sex (<60 years and ≥60 years; men and women) and by obesity status (underweight, normal, overweight, obese I, obese II).
Two-tailed analyses were conducted. Statistical significance was defined as p < 0.05/2 to avoid type I error caused by the comparison of two studies. SAS version 9.4 (SAS Institute Inc., Cary, NC, USA) was used.

3. Results

The general characteristics of age, sex, income, and region of residence were exactly the same between the TMJD and comparison groups in both Study I and Study II due to matching (Table 1).
The paired t-test did not show differences between the pre- and post-TMJD 1-year records of the participants in the TMJD I and comparison I groups (Table 2). The interaction in the linear mixed model did not reach statistical significance in Study I. The decrease in BMI was significant in the TMJD I group of men aged <60 years, but this change was not significant in the interaction model.
In the subgroup analyses according to obesity status, the change in weight was significant in both the TMJD I and comparison I groups, except for the overweight group (Table 3). In the underweight/normal weight category, the BMIs of the participants in both the TMJD I and comparison I groups increased. In the obese I category, the BMIs of the participants in the TMJD I group decreased and those in participants in comparison I group increased. In the obese II category, the BMIs of the participants in both the TMJD I and comparison I groups decreased. However, none of these changes were statistically significant in the interaction model.
The paired t-test did not show differences in the pre- and post-TMJD 2-year records among all participants in the TMJD II and comparison II groups (Table 4). On the other hand, the interaction in the linear mixed model reached statistical significance (p = 0.003), and the EV of the linear mixed model was −0.082. A decrease in BMI was found in the TMJD II group in women ≥ 60 years old, while an increase in BMI was observed in the comparison II group in men < 60 years old and women < 60 years old. The interaction was significant in women < 60 years old and women ≥ 60 years old. The EV was −0.109 for women < 60 years old and −0.272 in women ≥ 60 years old.
In the subgroup analyses according to obesity status, an increase in BMI was observed in underweight/normal weight individuals in the TMJD II and comparison II groups (Table 5). A decrease in BMI was found in obese individuals in the TMJD II and comparison II groups. The interaction model was significant in the obese I category, and its EV was −0.200.

4. Discussion

It was found that the change in BMI was significant only in Study II, which measured the 2-year change in patients with TMJD in the present study. A decrease in BMI was observed in the TMJD II group compared with the comparison II group only in women and the obese I category. This association was not found in any of the subgroups of Study I, which had a 1-year follow-up. This is the first study that reports the change in BMI in TMJD participants compared to matched comparison participants.
We believe this change in BMI is clinically meaningful, even though statistical significance was observed only in the women and obese I subgroups with the 2-year follow-up. The BMI change over 1 or 2 years was not significant in most of the subgroups, and the change in BMI was very small. As this study enrolled a large number of participants, statistical significance was detected with these minimal changes in BMI. In this study, among the statistically significant values, the largest EV was −0.272. This means that the BMIs of the participants in the TMJD group decreased by −0.272 compared to those of participants in of the comparison group. If the height of a participant were 170 cm, their BMI would change by −0.78 kg in 2 years.
The association of TMD with BMI has been suggested in several prior studies with differing results [5,15,16,17,18]. In a cross-sectional study, TMD was associated with low BMI in women (adjusted odds ratio (aOR) = 1.44, 95% confidence interval (95% CI) = 1.09–1.93, p = 0.037) [5]. However, other cross-sectional studies demonstrated no association between BMI and TMD in adolescents [15] or the general population [16]. On the other hand, overweight (BMI ≥ 25) was associated with frequent pain-associated TMD symptoms among Finnish conscripts (aOR = 1.23, 95% CI = 1.01–1.49) [18]. Another cross-sectional study in an adult population suggested an association of TMD with obesity in a univariate analysis. These differing observed associations between TMD and weight loss may originate from the limited numbers of participants in the above studies. Previously, few studies reported such an association compared with comparison groups. In addition, the potential effects of the aging process on weight loss could not be excluded in previous studies, because they did not have comparison participants who matched for age and BMI. As follow-up durations were not defined in most prior studies, the temporal association between TMD and weight loss could not be estimated.
TMJD could be associated with decreased BMI due to changes in eating behaviors and stress factors associated with TMJD. Patients with TMD may have weakened biting force, which impairs masticatory movement [19]. The pain of TMJ was reported to affect dietary intake, which leads to the avoidance of specific foods, such as meat and apples [20]. In addition, patients with TMD showed a higher rate of mental stress [5]. Mental stress was reported to delay the gastrointestinal transit time and peak glucose response, which decreased the appetite and dietary intake [21]. Mastication difficulties, pain, and psychological stress could decrease a person’s dietary intake, which may result in a decreased BMI in patients with TMD. Because obesity was suggested to be one of the factors associated with TMD, the present study analyzed the impact of TMD on BMI changes according to different BMI groups. As a result, the obese I population showed an association of TMD with decreased BMI. Compared with male subgroups, female subgroups demonstrated decreased BMI associated with TMJD in this study. Similar to the present result, a previous study also reported a sex-specific association of TMD with decreased BMI [5]. They supposed that a higher susceptibility to psychological stress and anxiety associated with TMD in women may be linked with a decreased BMI [5].
In the overall population and other subgroups, TMJD was not associated with BMI changes in the present study. Several explanations could support the present results. First, the decreased dietary intake could be compensated by the substitution of foods by patients with TMJD. A survey described the modifications of diet in patients with TMD [22]. Approximately 77.6% (66/85) of TMD patients modified their diet, including by cutting food into smaller pieces (71.8% [61/85]), softening (42.4% [36/85]), and mashing (40% [34/85]) their food [22]. By these efforts, the potential risk of nutritional deficits could be prevented in patients with TMJD. Second, a decrease in BMI could relieve the pain and other symptoms of TMJD, which alleviates dietary disturbances in TMJD patients. Third, the contribution of TMJD to BMI changes was not considerable, and many other factors could mediate the link between TMJD and BMI changes. For instance, a previous study reported that the association of TMD with obesity was not evident after adjusting for sex and other comorbidities, such as headaches and obstructive sleep apnea [17]. As the present study comprehensively adjusted for potential confounders, that could explain why the association of TMJD with BMI changes was not statistically significant.
The present study used a large nationwide cohort population. Many comparison participants were matched for age, sex, income, region of residence, and obesity status, and were randomly selected. The variables were reliable and were collected from national health insurance and health check-up data. Participants’ past medical histories were based on diagnostic codes, and laboratory measures were used for the levels of blood pressure, blood glucose, and total cholesterol. The accuracy of BMI data could be guaranteed by objective measures during health check-ups. In addition, the duration of follow-up was classified into 1 year and 2 years, so that we could assess the sensitivity of the association of TMJD with weight loss. To minimize the bias due to multiple comparisons, the Bonferroni correction was conducted. However, the long-term effects of TMJD on weight loss could not be evaluated in the present cohort data. To compensate for the short follow-up duration of this study, two independent studies were conducted with 1-year and 2-year follow-up durations. This study was based on health check-up data, thus selection bias cannot be excluded. Some information about our cohort was not accessible, which could induce information bias. The severity of TMJD was heterogeneous, and the treatment histories of patients with TMJD were not available in this study. Because this study was based on diagnostic code ICD10, the etiology of TMJD could not be isolated. TMJD could be mixed with TMD. However, TMD is more common in children and adolescents [23]. On the other hand, TMJD was more common in the elderly population in our study and was associated with TMJ degeneration [7]. Although many comorbidities, anthropometric data, and lifestyle factors were adjusted, confounders, such as nutritional factors, may have remained. Last, a detailed etiology for weight loss could not be isolated in the present data.

5. Conclusions

Patients with TMJD did not show more changes in BMI than comparison participants in the overall population. A decrease in BMI associated with TMJD was observed in a subpopulation of women and obese patients with a 2-year follow-up duration.

Author Contributions

H.G.C. designed the study; D.M.Y., C.M., S.-H.B. and H.G.C. analyzed the data; S.Y.K., J.H.K., M.J.K., J.-H.K. and H.G.C. drafted and revised the paper; and H.G.C. drew the figures. All authors have read and agreed to the published version of the manuscript.

Funding

This work was supported in part by research grants (NRF-2018-R1D1A1A02085328 and 2021-R1C1C100498611) from the National Research Foundation (NRF) of Korea and Hallym University Research Fund (HURF). The APC was funded by NRF-2021-R1C1C100498611.

Institutional Review Board Statement

The Ethics Committee of Hallym University (2014-I148) approved the use of the data. The need for written informed consent was waived by the Institutional Review Board.

Informed Consent Statement

Written informed consent was waived by the Institutional Review Board.

Data Availability Statement

Releasing of the data by the researcher is not legally permitted. All data are available from the database of the Korea Center for Disease Control and Prevention. The Korea Center for Disease Control and Prevention allows data access, at a certain cost, for any researcher who promises to follow the stipulated code of research ethics. The data of this article can be downloaded from the website after agreeing to follow the code.

Conflicts of Interest

The authors declare no conflict of interest.

References

  1. Gilheaney, Ó.; Stassen, L.F.; Walshe, M. The epidemiology, nature, and impact of eating and swallowing problems in adults presenting with temporomandibular disorders. Cranio 2020, 2020, 1–9. [Google Scholar] [CrossRef] [PubMed]
  2. Dworkin, S.F.; Huggins, K.H.; LeResche, L.; Von Korff, M.; Howard, J.; Truelove, E.; Sommers, E. Epidemiology of Signs and Symptoms in Temporomandibular Disorders: Clinical Signs in Cases and Controls. J. Am. Dent. Assoc. 1990, 120, 273–281. [Google Scholar] [CrossRef]
  3. Liu, F.; Steinkeler, A. Epidemiology, Diagnosis, and Treatment of Temporomandibular Disorders. Dent. Clin. N. Am. 2013, 57, 465–479. [Google Scholar] [CrossRef] [PubMed]
  4. Song, H.-S.; Shin, J.-S.; Lee, J.; Lee, Y.J.; Kim, M.-R.; Cho, J.-H.; Kim, K.-W.; Park, Y.; Park, S.-Y.; Kim, S.; et al. Association between temporomandibular disorders, chronic diseases, and ophthalmologic and otolaryngologic disorders in Korean adults: A cross-sectional study. PLoS ONE 2018, 13, e0191336. [Google Scholar] [CrossRef] [PubMed] [Green Version]
  5. Rhim, E.; Han, K.; Yun, K.-I. Association between temporomandibular disorders and obesity. J. Cranio-Maxillofac. Surg. 2016, 44, 1003–1007. [Google Scholar] [CrossRef]
  6. Chisnoiu, A.M.; Picos, A.M.; Popa, S.; Chisnoiu, P.D.; Lascu, L.; Picos, A.; Chisnoiu, R. Factors involved in the etiology of temporomandibular disorders—A literature review. Med. Pharm. Rep. 2015, 88, 473–478. [Google Scholar] [CrossRef]
  7. Yadav, S.; Yang, Y.; Dutra, E.H.; Robinson, J.L.; Wadhwa, S. Temporomandibular Joint Disorders in Older Adults. J. Am. Geriatr. Soc. 2018, 66, 1213–1217. [Google Scholar] [CrossRef]
  8. Gilheaney, Ó.; Stassen, L.F.; Walshe, M. Prevalence, Nature, and Management of Oral Stage Dysphagia in Adults With Temporomandibular Joint Disorders: Findings From an Irish Cohort. J. Oral Maxillofac. Surg. 2018, 76, 1665–1676. [Google Scholar] [CrossRef]
  9. Byun, S.-H.; Min, C.; Yoo, D.-M.; Yang, B.-E.; Choi, H.-G. Increased Risk of Migraine in Patients with Temporomandibular Disorder: A Longitudinal Follow-Up Study Using a National Health Screening Cohort. Diagnostics 2020, 10, 724. [Google Scholar] [CrossRef]
  10. Ohrbach, R.; Fillingim, R.B.; Mulkey, F.; Gonzalez, Y.; Gordon, S.; Gremillion, H.; Lim, P.-F.; Ribeiro-Dasilva, M.; Greenspan, J.D.; Knott, C.; et al. Clinical findings and pain symptoms as potential risk factors for chronic TMD: Descriptive data and empirically identified domains from the OPPERA case-control study. J. Pain 2011, 12, T27–T45. [Google Scholar] [CrossRef] [Green Version]
  11. Kim, S.Y.; Min, C.; Oh, D.J.; Choi, H.G. Tobacco Smoking and Alcohol Consumption Are Related to Benign Parotid Tumor: A Nested Case-Control Study Using a National Health Screening Cohort. Clin. Exp. Otorhinolaryngol. 2019, 12, 412–419. [Google Scholar] [CrossRef] [Green Version]
  12. Byun, S.-H.; Min, C.; Choi, H.-G.; Hong, S.J. Increased Risk of Temporomandibular Joint Disorder in Patients with Rheumatoid Arthritis: A Longitudinal Follow-Up Study. J. Clin. Med. 2020, 9, 3005. [Google Scholar] [CrossRef]
  13. Kim, S.Y.; Min, C.; Yoo, D.M.; Chang, J.; Lee, H.-J.; Park, B.; Choi, H.G. Hearing Impairment Increases Economic Inequality. Clin. Exp. Otorhinolaryngol. 2021, 14, 278–286. [Google Scholar] [CrossRef]
  14. WHO, I. IOTF. The Asia-Pacific Perspective. Redefining Obesity and Its Treatment. In Obesity: Preventing and Managing the Global Epidemic; WHO: Geneva, Switzerland, 2000. [Google Scholar]
  15. Jordani, P.C.; Campi, L.B.; Braido, G.V.V.; Fernandes, G.; Visscher, C.M.; Gonçalves, D. Obesity, sedentarism and TMD-pain in adolescents. J. Oral Rehabil. 2019, 46, 460–467. [Google Scholar] [CrossRef]
  16. Ahlberg, J.P.; Kovero, O.A.; Hurmerinta, K.A.; Zepa, I.; Nissinen, M.J.; Könönen, M.H. Maximal bite force and its association with signs and symptoms of TMD, occlusion, and body mass index in a cohort of young adults. Cranio 2003, 21, 248–252. [Google Scholar] [CrossRef]
  17. Jordani, P.C.; Campi, L.; Circeli, G.Z.; Visscher, C.M.; Bigal, M.E.; Gonçalves, D. Obesity as a risk factor for temporomandibular disorders. J. Oral Rehabil. 2016, 44, 1–8. [Google Scholar] [CrossRef] [PubMed]
  18. Miettinen, O.; Kämppi, A.; Tanner, T.; Anttonen, V.; Patinen, P.; Päkkilä, J.; Tjäderhane, L.; Sipilä, K. Association of Temporomandibular Disorder Symptoms with Physical Fitness among Finnish Conscripts. Int. J. Environ. Res. Public Health 2021, 18, 3032. [Google Scholar] [CrossRef]
  19. Pereira, L.J.; Gavião, M.B.D.; Bonjardim, L.R.; Castelo, P.M.; Van Der Bilt, A. Muscle thickness, bite force, and craniofacial dimensions in adolescents with signs and symptoms of temporomandibular dysfunction. Eur. J. Orthod. 2007, 29, 72–78. [Google Scholar] [CrossRef] [PubMed]
  20. Irving, J.; Wood, G.; Hackett, A. Does temporomandibular disorder pain dysfunction syndrome affect dietary intake? Dent. Update 1999, 26, 405–407. [Google Scholar] [CrossRef] [PubMed]
  21. Wing, R.R.; Blair, E.H.; Epstein, L.H.; McDermott, M.D. Psychological stress and glucose metabolism in obese and normal-weight subjects: A possible mechanism for differences in stress-induced eating. Health Psychol. 1990, 9, 693–700. [Google Scholar] [CrossRef] [PubMed]
  22. Edwards, D.C.; Bowes, C.C.; Penlington, C.; Durham, J. Temporomandibular disorders and dietary changes: A cross-sectional survey. J. Oral Rehabil. 2021. [Google Scholar] [CrossRef] [PubMed]
  23. Perez, C. Temporomandibular disorders in children and adolescents. Gen. Dent. 2018, 66, 51–55. [Google Scholar] [PubMed]
Figure 1. A schematic illustration of the participant selection process that was used in the present study. Of a total of 514,866 participants, 4627 TMJD participants were selected. Among them, we excluded participants without histories of first- or second-year follow-up records (n = 1480). Then, participants were categorized as TMJD I with a first year of follow-up (n = 1917) and TMJD II with a second year of follow-up (1722). A total of 492 TMJD participants were included in both groups. After the exclusion of 1 year of wash out, participants without BMI records, and unmatched participants, TMJD participants were 1:4 matched with comparison participants.
Ijerph 18 11793 g001
Table 1. General characteristics of participants.
Characteristics Study I Study II
Total (n)TMJD I (n, %)Total (n)Comparison I (n, %)p-ValueTotal (n)TMJD II (n, %)Total (n)Comparison II (n, %)p-Value
Age (years) 1.000 1.000
40–44180866 (3.7)7232264 (3.7) 162164 (4.0)6484256 (4.0)
45–491808239 (13.2)7232956 (13.2) 1621199 (12.3)6484796 (12.3)
50–541808326 (18.0)72321304 (18.0) 1621358 (22.1)64841432 (22.1)
55–591808359 (19.9)72321436 (19.9) 1621265 (16.4)64841060 (16.4)
60–641808228 (12.6)7232912 (12.6) 1621192 (11.8)6484768 (11.8)
65–691808247 (13.7)7232988 (13.7) 1621209 (12.9)6484836 (12.9)
70–741808188 (10.4)7232752 (10.4) 1621221 (13.6)6484884 (13.6)
75–791808131 (7.3)7232524 (7.3) 162180 (4.9)6484320 (4.9)
80–84180821 (1.2)723284 (1.2) 162130 (1.9)6484120 (1.9)
85+18083 (0.2)723212 (0.2) 16213 (0.2)648412 (0.2)
Sex 1.000 1.000
Male1808849 (47.0)72323396 (47.0) 1621737 (45.5)64842948 (45.5)
Female1808959 (53.0)72323836 (53.0) 1621884 (54.5)64843536 (54.5)
Income 1.000 1.000
1 (lowest)1808283 (15.7)72321132 (15.7) 1621244 (15.1)6484976 (15.1)
21808252 (13.9)72321008 (13.9) 1621231 (14.3)6484924 (14.3)
31808281 (15.5)72321124 (15.5) 1621277 (17.1)64841108 (17.1)
4 1808375 (20.7)72321500 (20.7) 1621340 (21.0)64841360 (21.0)
5 (highest)1808617 (34.1)72322468 (34.1) 1621529 (32.6)64842116 (32.6)
Region of residence 1.000 1.000
Urban1808740 (40.9)72322960 (40.9) 1621675 (41.6)64842700 (41.6)
Rural18081068 (59.1)72324272 (59.1) 1621946 (58.4)64843784 (58.4)
Obesity † 1.000 1.000
Underweight180843 (2.4)7232172 (2.4) 162138 (2.3)6484152 (2.3)
Normal1808725 (40.1)72322900 (40.1) 1621637 (39.3)64842548 (39.3)
Overweight1808529 (29.3)72322116 (29.3) 1621472 (29.1)64841888 (29.1)
Obese I1808474 (26.2)72321896 (26.2) 1621445 (27.5)64841780 (27.5)
Obese II180837 (2.1)7232148 (2.1) 162129 (1.8)6484116 (1.8)
Smoking status 0.036 * 0.002 *
Nonsmoker18081346 (74.5)72325357 (74.1) 16211250 (77.1)64844820 (74.3)
Past smoker1808228 (12.6)7232801 (11.1) 1621178 (11.0)6484671 (10.4)
Current smoker1808234 (12.9)72321074 (14.9) 1621193 (11.9)6484993 (15.3)
Alcohol consumption 0.572 0.879
<1 time a week18081319 (73.0)72325228 (72.3) 16211197 (73.8)64844800 (74.0)
≥1 time a week1808489 (27.1)72322004 (27.7) 1621424 (26.2)64841684 (26.0)
Systolic blood pressure 0.002 * 0.007 *
<120 mmHg1808629 (34.8)72322338 (32.3) 1621561 (34.6)64842078 (32.1)
120–139 mmHg1808900 (49.8)72323531 (48.8) 1621787 (48.6)64843100 (47.8)
≥140 mmHg1808279 (15.4)72321363 (18.9) 1621273 (16.8)64841306 (20.1)
Diastolic blood pressure 0.002 * 0.005 *
<80 mmHg1808930 (51.4)72323524 (48.7) 1621839 (51.8)64843079 (47.5)
80–89 mmHg1808647 (35.8)72322545 (35.2) 1621550 (33.9)64842331 (36.0)
≥90 mmHg1808231 (12.8)72321163 (16.1) 1621232 (14.3)64841074 (16.6)
Fasting blood glucose 0.188 0.381
<100 mg/dL18081201 (66.4)72324746 (65.6) 16211104 (68.1)64844359 (67.2)
100–125 mg/dL1808497 (27.5)72321957 (27.1) 1621411 (25.4)64841636 (25.2)
≥126 mg/dL1808110 (6.1)7232529 (7.3) 1621106 (6.5)6484489 (7.5)
Total cholesterol 0.016 * 0.510
<200 mg/dL1808999 (55.3)72323788 (52.4) 1621870 (53.7)64843377 (52.1)
200–239 mg/dL1808607 (33.6)72322470 (34.2) 1621544 (33.6)64842261 (34.9)
≥240 mg/dL1808202 (11.2)7232974 (13.5) 1621207 (12.8)6484846 (13.1)
CCI score 0.562 0.297
018081286 (71.1)72325221 (72.2) 16211162 (71.7)64844737 (73.1)
11808259 (14.3)7232974 (13.5) 1621225 (13.9)6484867 (13.4)
21808143 (7.9)7232526 (7.3) 1621131 (8.1)6484434 (6.7)
3180852 (2.9)7232245 (3.4) 162150 (3.1)6484205 (3.2)
≥4180868 (3.8)7232266 (3.7) 162153 (3.3)6484241 (3.7)
Abbreviations: CCI, Charlson comorbidity index; TMJD, Temporomandibular joint disorder. * Chi-square test; significance was defined as p < 0.05. † Obesity (BMI, body mass index, kg/m2) was categorized as underweight (<18.5), normal (≥18.5 to <23), overweight (≥23 to <25), obese I (≥25 to <30), and obese II (≥30).
Table 2. Differences in mean BMI between pre- and 1-year-post-study of TMJD in Study I according to age and sex.
CharacteristicsTMJD IComparison IInteraction ‡Linear Mixed Model ¶
Previous (Mean, SD)Post 1yr
(Mean, SD)
p-ValuePrevious (Mean, SD)Post 1yr
(Mean, SD)
p-Valuep-ValueEV §p-Value
Total participants (n = 9040)23.58 ± 2.8323.58 ± 2.830.95723.62 ± 2.8423.62 ± 2.890.9790.769−0.0140.850
Age 40–60 years old, men (n = 2365)23.92 ± 2.5424.04 ± 2.540.010 *23.98 ± 2.6624.02 ± 2.670.1540.1460.0440.736
Age 40–60 years old, women (n = 2585)23.45 ± 3.0923.49 ± 3.090.37423.44 ± 2.9223.47 ± 2.950.3940.7990.0550.698
Age ≥60 years old, men (n = 1880)23.23 ± 2.7623.06 ± 2.620.03223.28 ± 2.7823.22 ± 2.830.0920.208−0.1350.389
Age ≥60 years old, women (n = 2210)23.67 ± 2.8423.61 ± 2.910.39723.73 ± 2.9423.72 ± 3.020.6680.468−0.0690.656
Abbreviations: CCI, Charlson Comorbidity Index; EV, estimated value; TMJD, temporomandibular joint disorders. * Paired t-test; significance was defined as p < 0.05/2. ‡ Interaction effects between time and group. § Estimated value of the linear mixed model for TMJD I group based on the comparison I group. ¶ Fixed effects were age, sex, income, region of residence, TMJD, and time of measurement. Random effects were systolic blood pressure, diastolic blood pressure, fasting blood glucose, total cholesterol, smoking, alcohol consumption, and CCI score.
Table 3. Differences in mean BMI between pre- and 1-year-post-study of TMJD in TMJD I and the comparison I group according to obesity.
CharacteristicsTMJD IComparison IInteraction ‡Linear Mixed Model ¶
Previous (Mean, SD)Post 1 Year
(Mean, SD)
p-ValuePrevious (Mean, SD)Post 1 Year
(Mean, SD)
p-Valuep-ValueEV §p-Value
Underweight (n = 215)17.55 ± 0.8017.99 ± 1.090.008 *17.57 ± 0.7918.05 ± 1.46<0.001 *0.810−0.0460.807
Normal (n = 3625)21.26 ± 1.1621.49 ± 1.55<0.001 *21.26 ± 1.1721.46 ± 1.63<0.001 *0.6490.0420.465
Overweight (n = 2645)23.96 ± 0.5623.91 ± 1.190.25424.01 ± 0.5723.98 ± 1.290.3340.584−0.0680.154
Obese I (n = 2370)26.58 ± 1.1926.34 ± 1.82<0.001 *26.73 ± 1.2626.47 ± 1.74<0.001 *0.785−0.1080.165
Obese II (n = 185)31.99 ± 2.4530.72 ± 3.040.007 *31.52 ± 1.5430.75 ± 2.34<0.001 *0.165−0.0870.821
Abbreviations: CCI, Charlson Comorbidity Index; EV, estimated value; TMJD, temporomandibular joint disorders. * Paired t-test; significance was defined as p < 0.05/2. ‡ Interaction effects between time and group. § Estimated value of the linear mixed model for the TMJD I group based on the comparison I group. ¶ Fixed effects were age, sex, income, region of residence, TMJD, and time of measurement. Random effects were systolic blood pressure, diastolic blood pressure, fasting blood glucose, total cholesterol, smoking, alcohol consumption, and CCI score.
Table 4. Differences in mean BMI between pre- and 2-year-post-study of TMJD in Study II according to age and sex.
CharacteristicsTMJD IIComparison IIInteraction ‡Linear Mixed Model ¶
Previous (Mean, SD)Post 2 Years
(Mean, SD)
p-ValuePrevious (Mean, SD)Post 2 Years
(Mean, SD)
p-Valuep-ValueEV §p-Value
Total participants (n = 8105)23.70 ± 2.9623.62 ± 2.840.06423.69 ± 2.8223.72 ± 2.900.1480.003 †−0.0820.294
Age 40–60 years, men (n = 2090)24.13 ± 2.6824.21 ± 2.550.15624.07 ± 2.6524.14 ± 2.700.023 *0.8790.0470.740
Age 40–60 years, women (n = 2340)23.38 ± 3.4123.28 ± 2.980.34323.28 ± 2.8423.42 ± 2.87<0.001 *0.003 †−0.1090.458
Age ≥60 years, men (n = 1595)23.36 ± 2.5823.33 ± 2.830.76323.39 ± 2.6223.33 ± 2.770.1100.9630.0230.888
Age ≥60 years, women (n = 2080)23.90 ± 2.8723.64 ± 2.880.001 *24.00 ± 3.0223.93 ± 3.140.1090.023†−0.2720.098
Abbreviations: CCI, Charlson Comorbidity Index; EV, estimated value; TMJD, temporomandibular joint disorders. * Paired t-test; significance was defined as p < 0.05/2. † Linear mixed model; significance was defined as p < 0.05/2. ‡ Interaction effects between time and group. § Estimated value of the linear mixed model for the TMJD II group based on the comparison II group. ¶ Fixed effects were age, sex, income, region of residence, TMJD, and time of measurement. Random effects were systolic blood pressure, diastolic blood pressure, fasting blood glucose, total cholesterol, smoking, alcohol consumption, and CCI score.
Table 5. Differences in mean BMI between pre- and 2-year-post-study of TMJD in TMJD II and comparison II group according to obesity.
CharacteristicsTMJD IIComparison IIInteraction ‡Linear Mixed Model ¶
Previous (Mean, SD)Post 1 Year
(Mean, SD)
p-ValuePrevious (Mean, SD)Post 1 Year
(Mean, SD)
p-Valuep-ValueEV §p-Value
Underweight (n = 190)17.52 ± 0.8818.58 ± 1.860.003 *17.50 ± 0.9118.13 ± 1.72<0.001 *0.2020.4670.061
Normal (n = 3185)21.39 ± 1.1421.56 ± 1.51<0.001 *21.38 ± 1.1421.63 ± 1.68<0.001 *0.151−0.0710.248
Overweight (n = 2360)23.96 ± 0.5723.90 ± 1.590.35523.98 ± 0.5723.94 ± 1.400.2920.574−0.0390.488
Obese I (n = 2225)26.66 ± 1.2526.24 ± 1.87<0.001 *26.69 ± 1.2526.45 ± 1.88<0.001 *0.010 †−0.2000.017 †
Obese II (n = 145)33.08 ± 6.2730.84 ± 4.100.13931.96 ± 3.2631.33 ± 2.830.0570.095−0.5410.460
Abbreviations: CCI, Charlson Comorbidity Index; EV, estimated value; TMJD, temporomandibular joint disorders. * Paired t-test; significance was defined as p < 0.05/2. † Linear mixed model; significance was defined as p < 0.05/2. ‡ Interaction effects between time and group. § Estimated value of the linear mixed model for the TMJD II group based on the comparison II group. ¶ Fixed effects were age, sex, income, region of residence, TMJD, and time of measurement. Random effects were systolic blood pressure, diastolic blood pressure, fasting blood glucose, total cholesterol, smoking, alcohol consumption, and CCI score.
Publisher’s Note: MDPI stays neutral with regard to jurisdictional claims in published maps and institutional affiliations.

