
Open Application of Statistical and Machine Learning Models to Explore the Impact of Environmental Exposures on Health and Disease: An Asthma Use Case

 ,
,
Abstract
:1. Introduction
2. Materials and Methods
2.1. Overview of ICEES Open Multivariate Approach
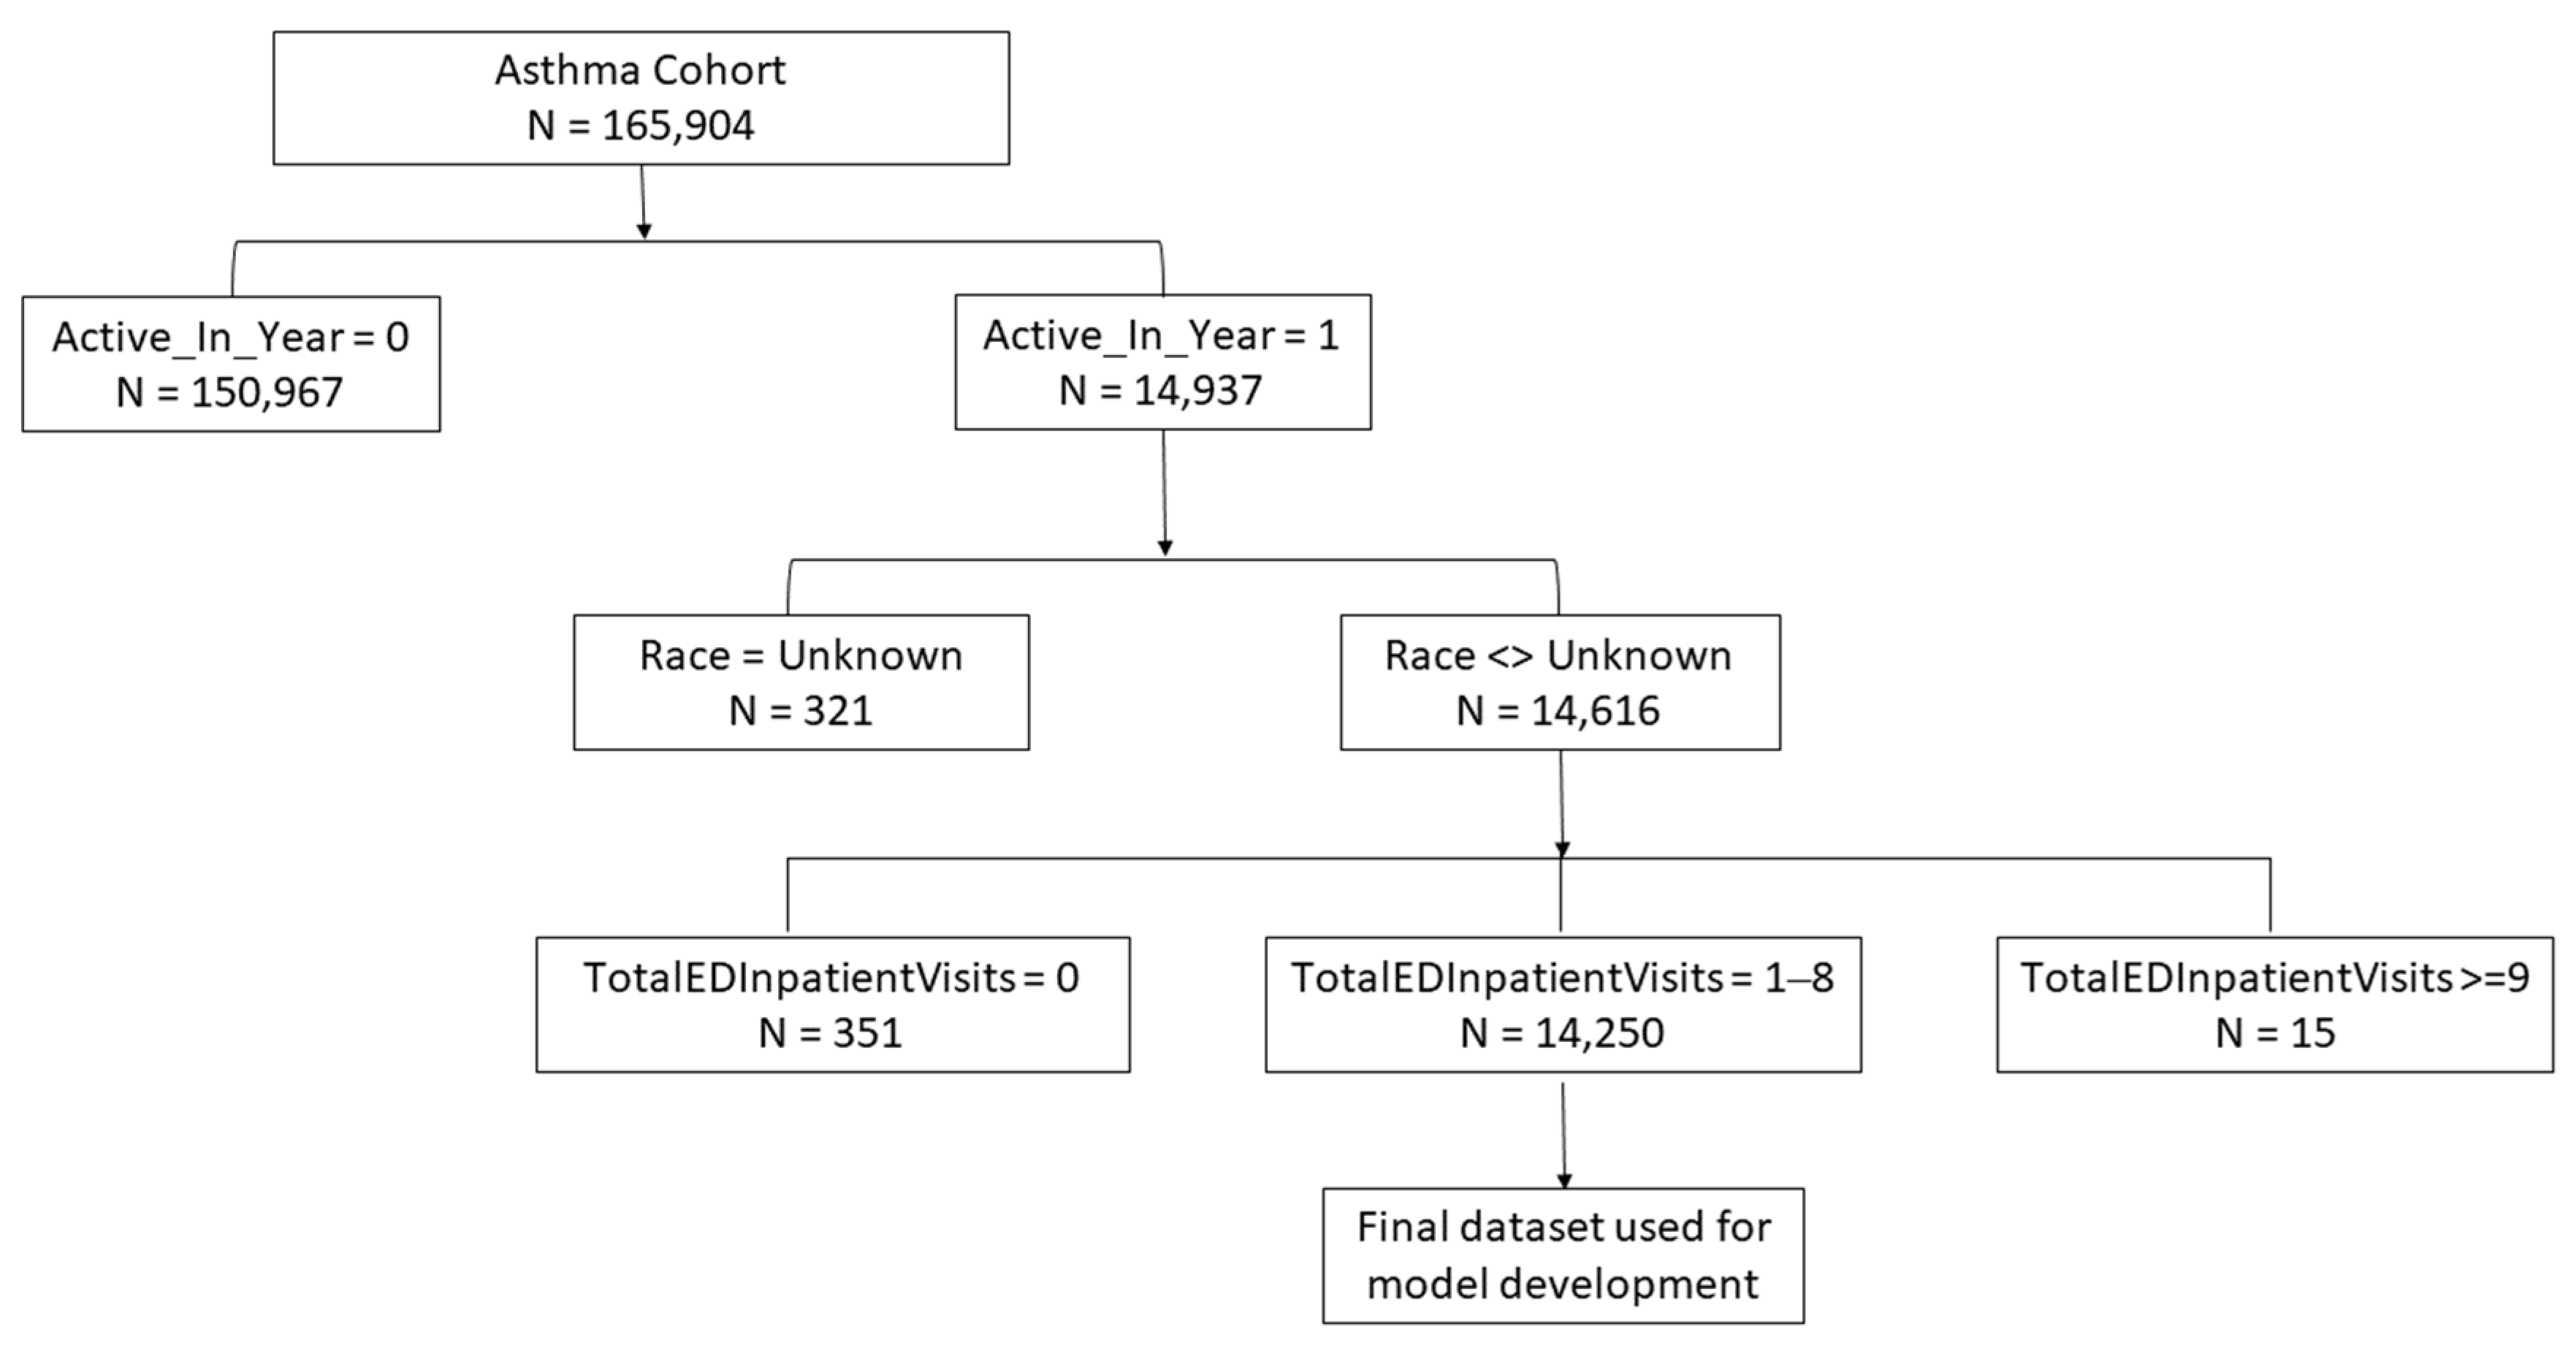
2.2. Data Source and Multivariate Table Generation
2.3. Analytic Approach
2.3.1. CRF Analysis
2.3.2. CTree Analysis
2.3.3. GLM Analysis
3. Results
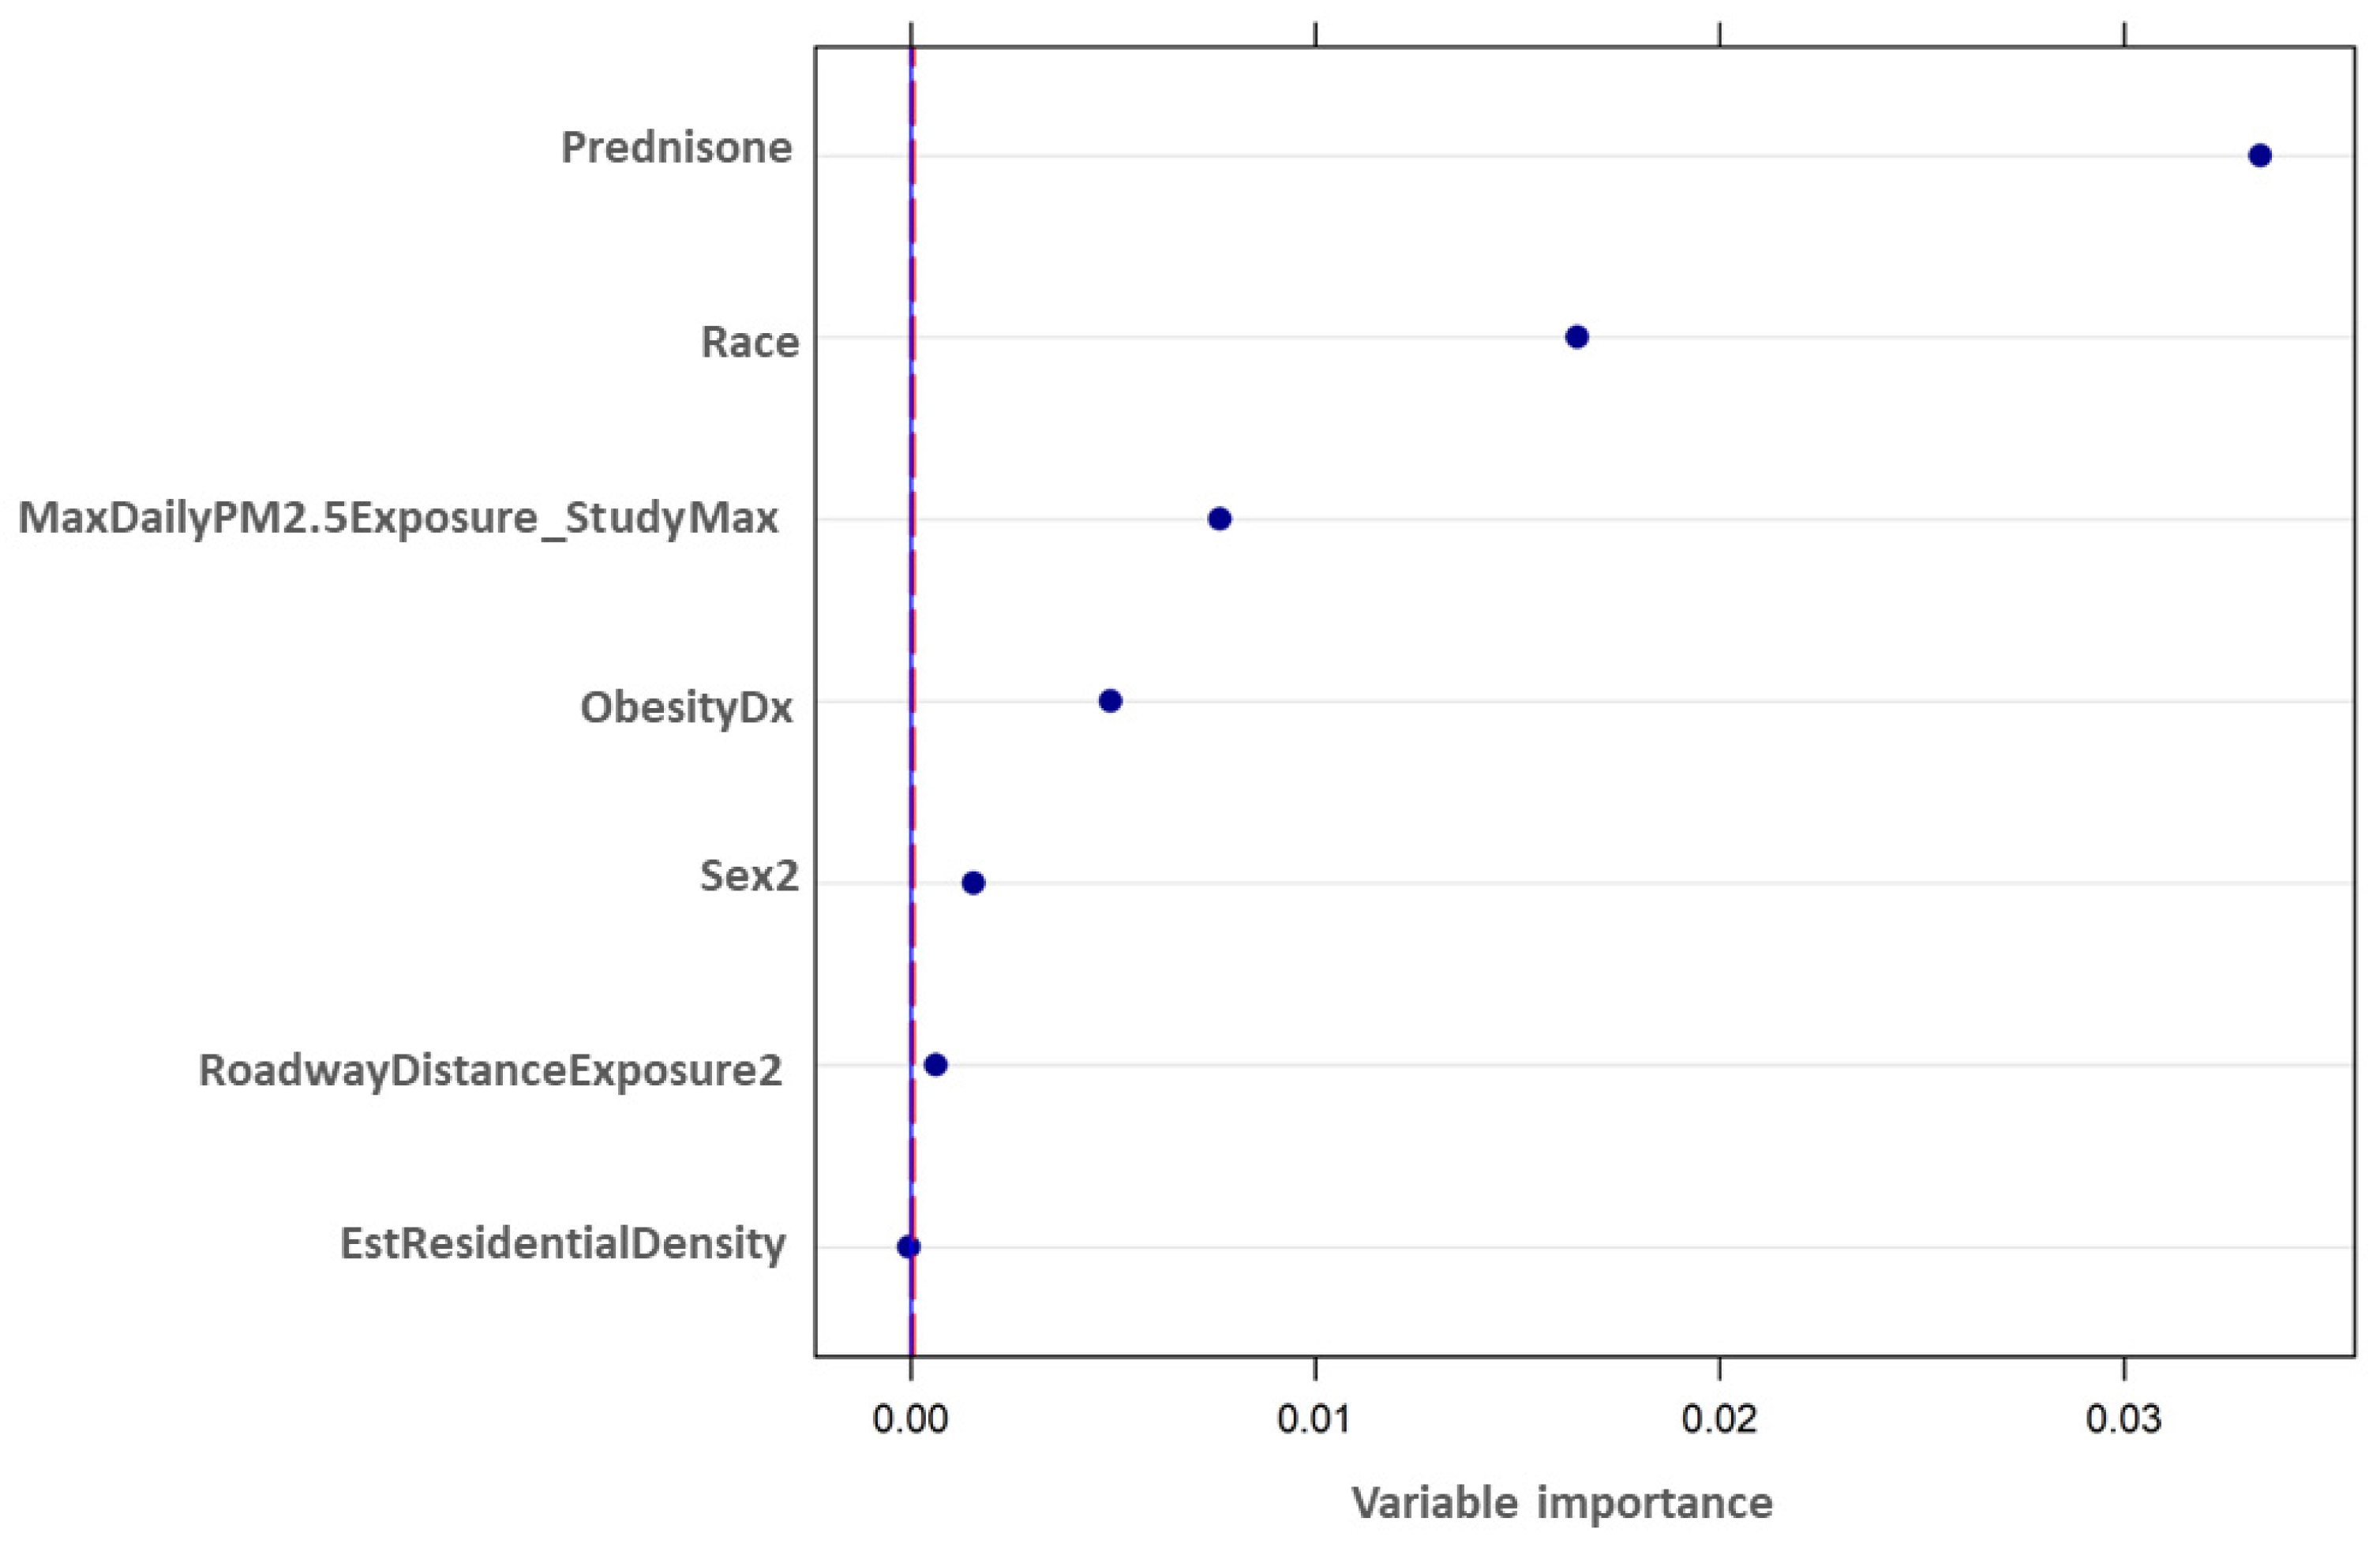
3.1. CRF Analysis
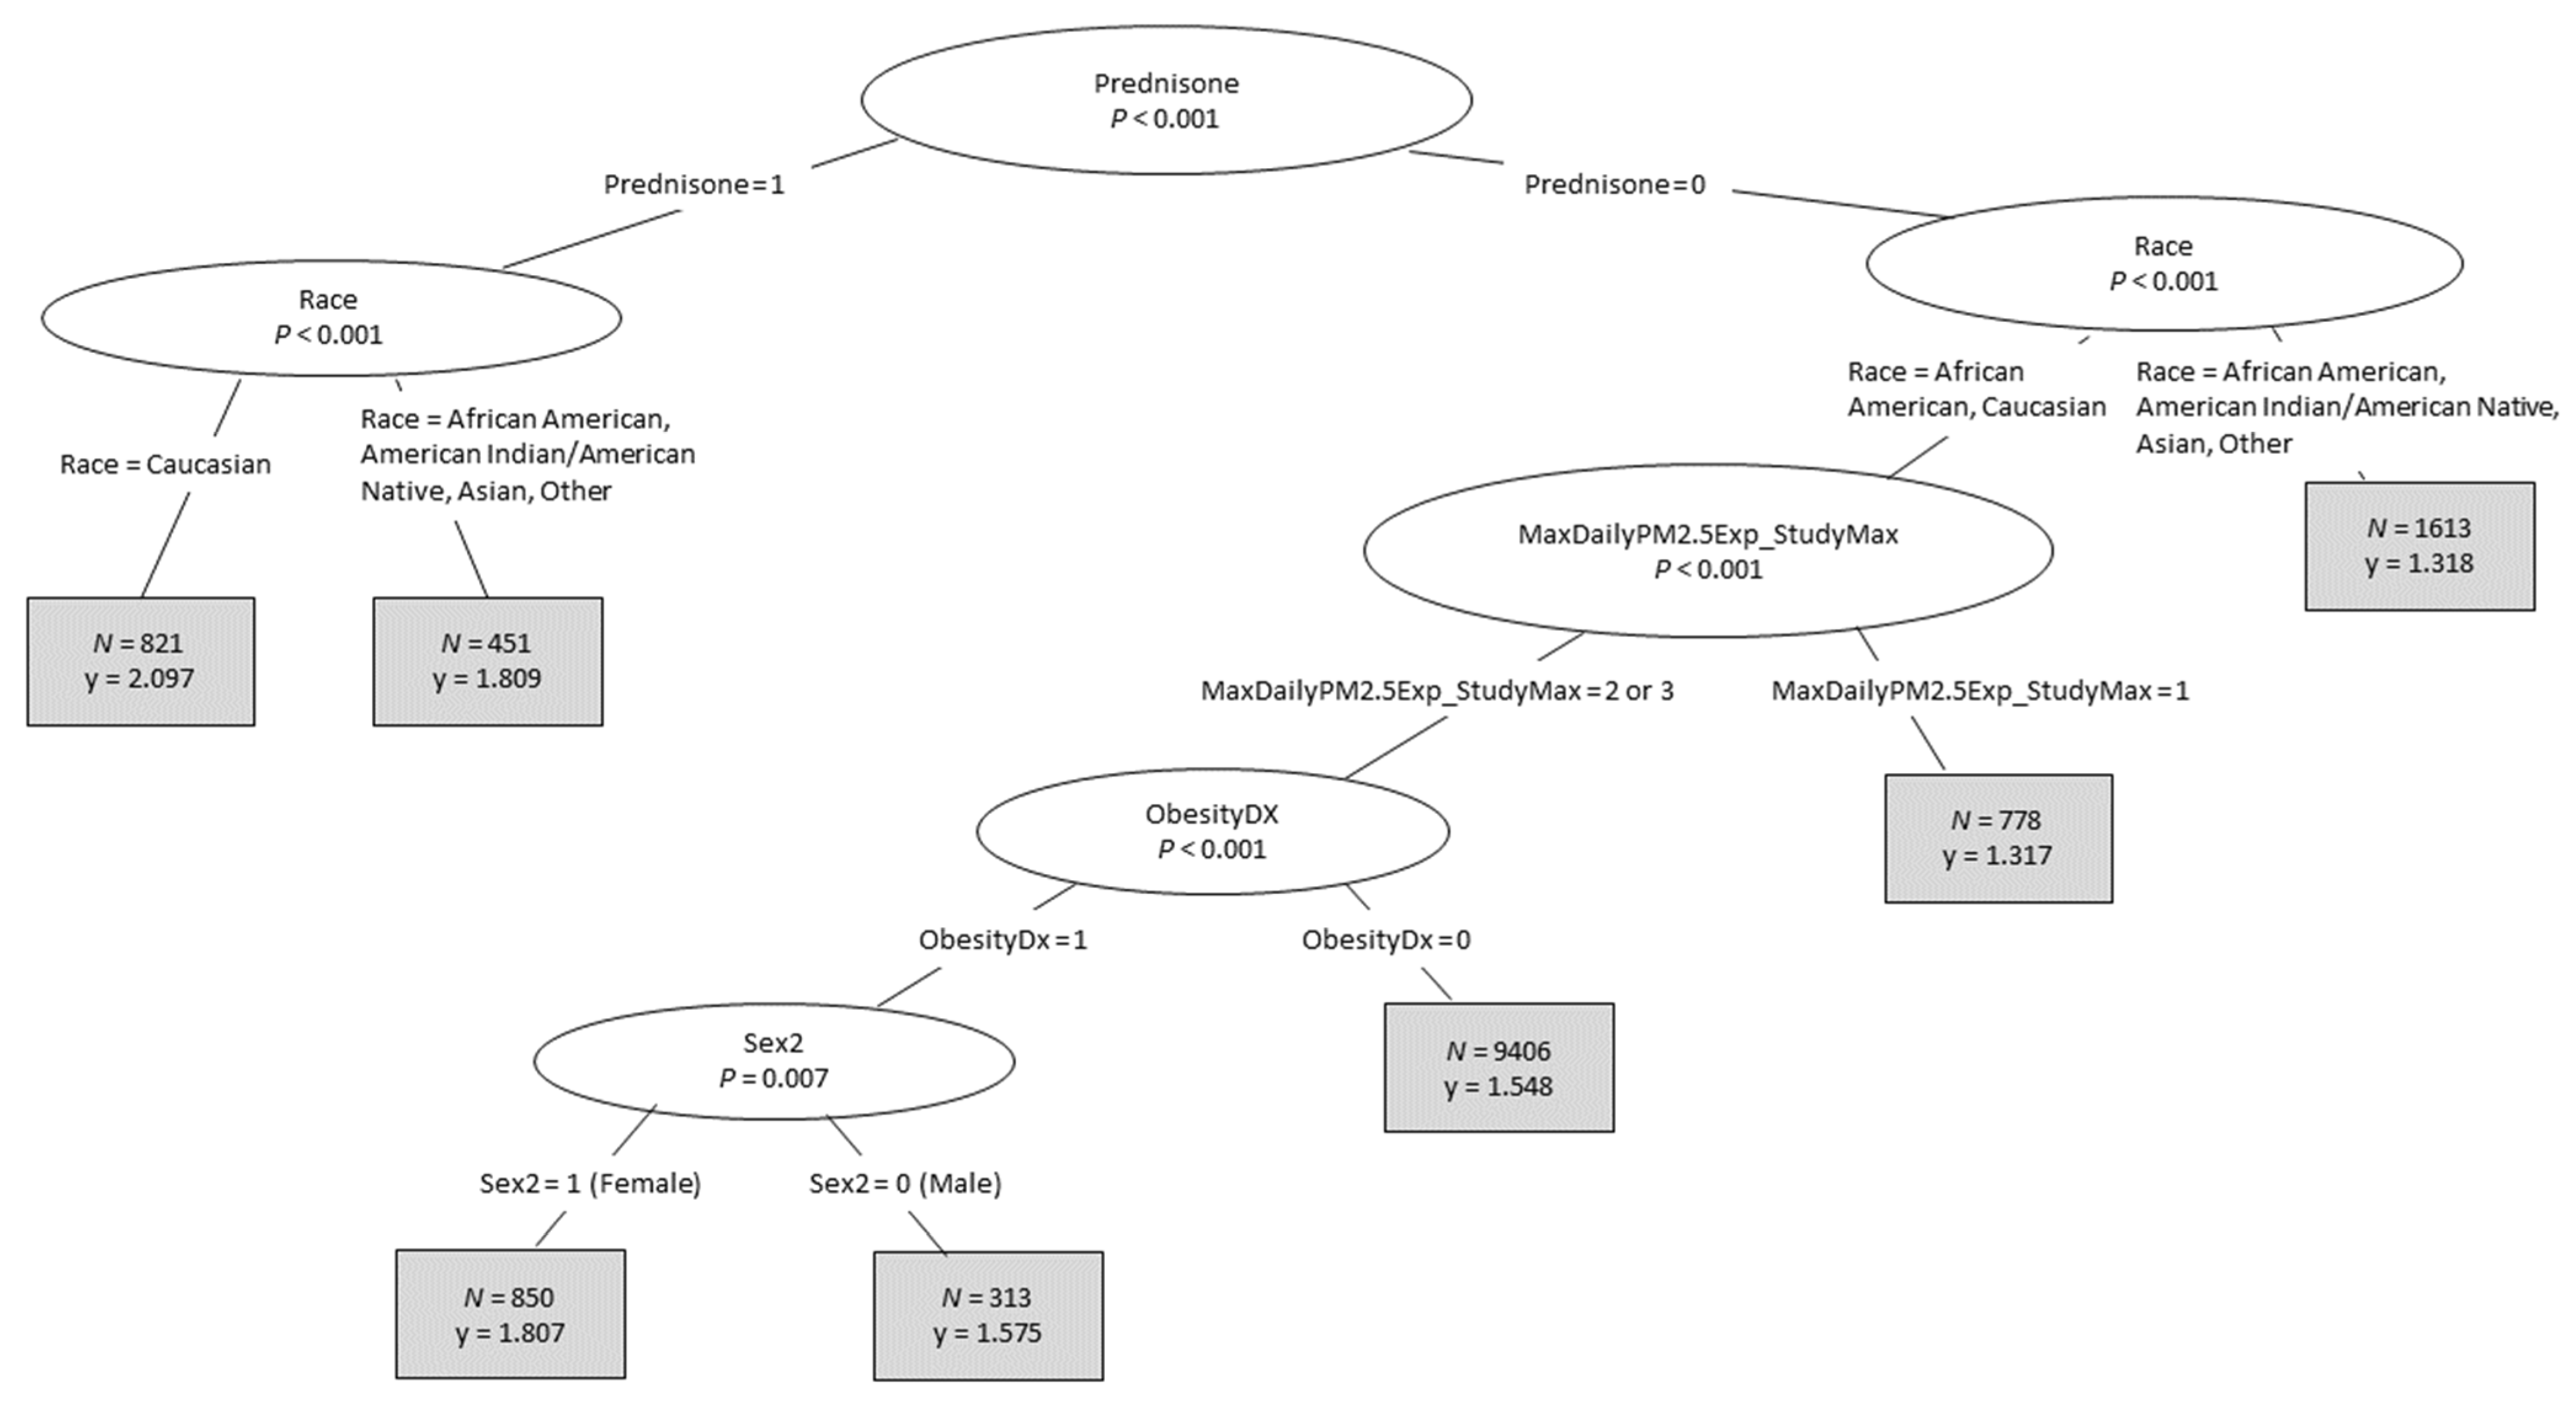
3.2. CTree Analysis
3.3. GLM Analysis
4. Discussion
4.1. Summary of Results and Relation to Published Literature
4.2. Service Considerations
4.3. Model Considerations
5. Conclusions
Author Contributions
Funding
Institutional Review Board Statement
Informed Consent Statement
Data Availability Statement
Acknowledgments
Conflicts of Interest
References
- Mirabelli, M.; Vaidyanathan, A.; Flanders, W.D.; Qin, X.; Garbe, P. Outdoor PM2.5, Ambient Air Temperature, and Asthma Symptoms in the Past 14 Days among Adults with Active Asthma. Environ. Health. Perspect. 2016, 124, 1882–1890. [Google Scholar] [CrossRef] [Green Version]
- Requia, W.J.; Adams, M.D.; Koutrakis, P. Association of PM2.5 with diabetes, asthma, and high blood pressure incidence in Canada: A spatiotemporal analysis of the impacts of the energy generation and fuel sales. Sci. Total Environ. 2017, 584-585, 1077–1083. [Google Scholar] [CrossRef]
- Pérez, L.; Lurmann, F.; Wilson, J.; Pastor, M.; Brandt, S.J.; Künzli, N.; McConnell, R. Near-Roadway Pollution and Childhood Asthma: Implications for Developing “Win–Win” Compact Urban Development and Clean Vehicle Strategies. Environ. Health Perspect. 2012, 120, 1619–1626. [Google Scholar] [CrossRef] [Green Version]
- Schurman, S.H.; Bravo, M.; Innes, C.L.; Jackson, W.B.; McGrath, J.A.; Miranda, M.L.; Garantziotis, S. Toll-like Receptor 4 Pathway Polymorphisms Interact with Pollution to Influence Asthma Diagnosis and Severity. Sci. Rep. 2018, 8, 12713. [Google Scholar] [CrossRef] [Green Version]
- Keet, C.A.; McCormack, M.C.; Pollack, C.E.; Peng, R.D.; McGowan, E.; Matsui, E.C. Neighborhood poverty, urban residence, race/ethnicity, and asthma: Rethinking the inner-city asthma epidemic. J. Allergy Clin. Immunol. 2015, 135, 655–662. [Google Scholar] [CrossRef] [PubMed] [Green Version]
- Greenblatt, R.E.; Zhao, E.J.; Henrickson, S.E.; Apter, A.J.; Hubbard, R.A.; Himes, B.E. Factors associated with exacerbations among adults with asthma according to electronic health record data. Asthma Res. Pract. 2019, 5, 1. [Google Scholar] [CrossRef]
- Bind, M.-A. Causal Modeling in Environmental Health. Annu. Rev. Public Health 2019, 40, 23–43. [Google Scholar] [CrossRef] [Green Version]
- Parija, S.C.; Mandal, J.; Acharya, S. Ethics in human research. Trop. Parasitol. 2011, 1, 2–3. [Google Scholar] [CrossRef] [PubMed]
- Wacker, J.; Kolbe, M. The challenge of learning from perioperative patient harm. Trends Anaesth. Crit. Care 2016, 7–8, 5–10. [Google Scholar] [CrossRef] [Green Version]
- Lubarski, B. Re-Identification of “Anonymized” Data. Georgetown Law Technology Review. Available online: https://www.georgetownlawtechreview.org/re-identification-of-anonymized-data/GLTR-04-2017 (accessed on 10 September 2021).
- Fecho, K.; Pfaff, E.; Xu, H.; Champion, J.; Cox, S.; Stillwell, L.; Peden, D.B.; Bizon, C.; Krishnamurthy, A.; Tropsha, A.; et al. A novel approach for exposing and sharing clinical data: The Translator Integrated Clinical and Environmental Exposures Service. J. Am. Med. Inform. Assoc. 2019, 26, 1064–1073. [Google Scholar] [CrossRef] [PubMed]
- Ahalt, S.C.; Chute, C.G.; Fecho, K.; Glusman, G.; Hadlock, J.; Taylor, C.; Pfaff, E.; Robinson, P.N.; Solbrig, H.; Ta, C.; et al. Clinical Data: Sources and Types, Regulatory Constraints, Applications. Clin. Transl. Sci. 2019, 12, 329–333. [Google Scholar] [CrossRef]
- Fecho, K.; Ahalt, S.C.; Arunachalam, S.; Champion, J.; Chute, C.G.; Davis, S.; Gersing, K.; Glusman, G.; Hadlock, J.; Lee, J.; et al. Sex, obesity, diabetes, and exposure to particulate matter among patients with severe asthma: Scientific insights from a comparative analysis of open clinical data sources during a five-day hackathon. J. Biomed. Inform. 2019, 100, 103325. [Google Scholar] [CrossRef] [PubMed]
- Pfaff, E.R.; Champion, J.; Bradford, R.L.; Clark, M.; Xu, H.; Fecho, K.; Krishnamurthy, A.; Cox, S.; Chute, C.G.; Taylor, C.O.; et al. Fast Healthcare Interoperability Resources (FHIR) as a Meta Model to Integrate Common Data Models: Development of a Tool and Quantitative Validation Study. JMIR Med. Inform. 2019, 7, e15199. [Google Scholar] [CrossRef]
- Xu, H.; Cox, S.; Stillwell, L.; Pfaff, E.; Champion, J.; Ahalt, S.C.; Fecho, K. FHIR PIT: An open software application for spatiotemporal integration of clinical data and environmental exposures data. BMC Med. Inform. Decis. Mak. 2020, 20, 1–8. [Google Scholar] [CrossRef] [PubMed] [Green Version]
- Fecho, K.; Haaland, P.; Krishnamurthy, A.; Lan, B.; Ramsey, S.; Schmitt, P.L.; Sharma, P.; Sinha, M.; Xu, H. Development and application of an open approach for multivariate analysis of integrated clinical and environmental exposures data. IMU 2021, in press. [Google Scholar]
- Hothorn, T. Party: A Laboratory for Recursive Partytioning. Available online: http://cran.r-project.org/web/packages/party/index.html (accessed on 10 September 2021).
- Strobl, C.; Boulesteix, A.-L.; Zeileis, A.; Hothorn, T. Bias in random forest variable importance measures: Illustrations, sources and a solution. BMC Bioinform. 2007, 8, 25. [Google Scholar] [CrossRef] [PubMed] [Green Version]
- Strobl, C.; Boulesteix, A.-L.; Kneib, T.; Augustin, T.; Zeileis, A. Conditional variable importance for random forests. BMC Bioinform. 2008, 9, 307. [Google Scholar] [CrossRef] [Green Version]
- Strobl, C.; Malley, J.; Tutz, G. An introduction to recursive partitioning: Rationale, application, and characteristics of classification and regression trees, bagging, and random forests. Psychol. Methods 2009, 14, 323–348. [Google Scholar] [CrossRef] [PubMed] [Green Version]
- Townes, F.W. Review of Probability Distributions for Modeling Count Data. Available online: https://arxiv.org/abs/2001.04343v1 (accessed on 10 September 2021).
- Brieman, L.; Cutler, A. Random Forests. 2013. Available online: http://www.stat.berkeley.edu/~breiman/RandomForests/ (accessed on 10 September 2021).
- Breiman, L.; Friedman, J.H.; Olshen, R.A.; Stone, C.J. Classification and Regression Trees. Classification and Regression Trees; Routledge: London, UK, 2017; p. 368. [Google Scholar] [CrossRef]
- Liaw, A.; Wiener, M. Classification and regression by randomForest. R News 2002, 2/3, 18–22. [Google Scholar]
- Akaike, H. Information Theory and an Extension of the Maximum Likelihood Principle. In Selected Papers of Hirotugu Akaike; Parzen, E., Tanabe, K., Kitagawa, G., Eds.; Springer Series in Statistics (Perspectives in Statistics); Springer: New York, NY, USA, 1998; pp. 199–213. [Google Scholar] [CrossRef]
- Burnham, K.P.; Anderson, D.R. Model Selection and Multimodel Inference: A Practical Information-Theoretic Approach, 2nd ed.; Springer: New York, NY, USA, 2002; p. 488. [Google Scholar] [CrossRef] [Green Version]
- Raftery, A.E. Bayes Factors and BIC. Sociol. Methods Res. 1999, 27, 411–427. [Google Scholar] [CrossRef]
- Schwarz, G. Estimating the Dimension of a Model. Ann. Stat. 1978, 6, 461–464. [Google Scholar] [CrossRef]
- Alangari, A.A. Corticosteroids in the treatment of acute asthma. Ann. Thorac. Med. 2014, 9, 187–192. [Google Scholar] [CrossRef] [PubMed]


| Feature Variable (ICEES Feature Variable Name) | Variable Enumeration | N (%) |
|---|---|---|
| Total Annual ED or Inpatient Visits for Respiratory Issues | 1 | 9633 (67.6%) |
| 2 | 2677 (18.8%) | |
| 3 | 1067 (7.5%) | |
| 4 | 492 (3.5%) | |
| 5 | 210 (1.5%) | |
| 6 | 115 (0.8%) | |
| 7 | 43 (0.3%) | |
| 8 | 13 (0.1%) | |
| Sex (Sex2) | 0 (Male) | 6231 (43.7%) |
| 1 (Female) | 8019 (56.3%) | |
| Race (Race) | Caucasian | 8457 (59.3%) |
| African American | 4111 (28.9%) | |
| Asian, Native Hawaiian/Pacific Islander, American/Alaskan Native, Other | 1682 (11.8%) | |
| Prescription or Administration of Prednisone (Prednisone) 1 | 0 (No) | 12,978 (91.1%) |
| 1 (Yes) | 1272 (8.9%) | |
| Diagnosis of Obesity (ObesityDx) 2 | 0 (No) | 12,859 (90.2%) |
| 1 (Yes) | 1391 (9.8%) | |
| Maximum Daily PM2.5 Exposure, µg/m3 (MaxDailyPM2.5Exposure_StudyMax) | 1 (6.58, 25.09) | 878 (6.2%) |
| 2 (25.09, 98.76) | 13,372 (93.8%) | |
| Residential Distance to a Major Roadway or Highway, Meters (RoadwayDistanceExposure2) | 1 (0–49) | 1629 (11.4%) |
| 2 (50–99) | 1008 (7.1%) | |
| 3 (100–149) | 878 (6.2%) | |
| 4 (150–199) | 922 (6.5%) | |
| 5 (200–249) | 861 (6.0%) | |
| 6 (≥250) | 8952 (62.8%) | |
| Estimated Residential Density, Persons (EstResidentialDensity) 3 | 1 (0, 2500) | 10,321 (72.4%) |
| 2 (2500, 50,000) | 3929 (27.6%) | |
| 3 (50,000, infinity) | 0 (0.0%) | |
| TOTAL | 14,250 | |
| Scenario 1 | Poisson Regression | Lasso Poisson Regression | ||
|---|---|---|---|---|
| AIC | BIC | AIC | BIC | |
| Scenario 1: main effects, no interaction terms | 39,548 | 39,593 | 39,559 | 39,612 |
| Scenario 2: main effects, top significant two-way interaction identified by CTree analysis | 39,531 | 39,592 | 39,559 | 39,627 |
| Scenario 3: main effects, all significant two-way interactions identified by CTree analysis | 39,525 | 39,601 | 39,563 | 39,608 |
| Scenario 4: main effects, all significant two- and three-way interactions identified by CTree analysis | 39,520 | 39,618 | 39,544 | 39,604 |
| Parameter | Estimate | Standard Error | p-Value | |
|---|---|---|---|---|
| Intercept | 0.0916 | 0.0366 | 0.0122 | |
| Race = African American | 0.1491 | 0.0254 | <0.0001 | |
| Race = Caucasian | 0.1685 | 0.0235 | <0.0001 | |
| Race = Asian, Native Hawaiian/Pacific Islander, American/Alaskan Native, Other | 0 | 0 | . | |
| MaxDailyPM2.5Exposure_StudyMax = 2 | 0.1869 | 0.0304 | <0.0001 | |
| MaxDailyPM2.5Exposure_StudyMax = 1 | 0 | 0 | . | |
| ObesityDx = 1 | 0.0966 | 0.0217 | <0.0001 | |
| ObesityDx = 0 | 0 | 0 | . | |
| Race = African American | Prednisone = 1 | 0.2062 | 0.0385 | <0.0001 |
| Race = African American | Prednisone = 0 | 0 | 0 | . |
| Race = Caucasian | Prednisone = 1 | 0.294 | 0.0258 | <0.0001 |
| Race = Caucasian | Prednisone = 0 | 0 | 0 | . |
| Race = Asian, Native Hawaiian/Pacific Islander, American/Alaskan Native, Other | Prednisone = 1 | −0.2785 | 0.1417 | 0.0493 |
| Race = Asian, Native Hawaiian/Pacific Islander, American/Alaskan Native, Other | Prednisone = 0 | 0 | 0 | . |
| Parameter | N | Mean 1 | Std Dev (Observed) | Std Dev (Predicted) | |
|---|---|---|---|---|---|
| Race = African American | 4111 | 1.58 | 1 | 0.14 | |
| Race = Caucasian | 8457 | 1.61 | 1.11 | 0.18 | |
| Race = Asian, Native Hawaiian/Pacific Islander, American/Alaskan Native, Other | 1682 | 1.31 | 0.64 | 0.07 | |
| MaxDailyPM2.5Exposure_StudyMax = 2 | 13372 | 1.58 | 1.06 | 0.18 | |
| MaxDailyPM2.5Exposure_StudyMax = 1 | 878 | 1.31 | 0.58 | 0.11 | |
| ObesityDx = 1 | 1391 | 1.73 | 1.05 | 0.17 | |
| ObesityDx = 0 | 12859 | 1.55 | 1.03 | 0.18 | |
| Race = African American | Prednisone = 1 | 400 | 1.91 | 1.11 | 0.07 |
| Race = African American | Prednisone = 0 | 3711 | 1.54 | 0.98 | 0.08 |
| Race = Caucasian | Prednisone = 1 | 821 | 2.1 | 1.42 | 0.1 |
| Race = Caucasian | Prednisone = 0 | 7636 | 1.56 | 1.05 | 0.09 |
| Race = Asian, Native Hawaiian/Pacific Islander, American/Alaskan Native, Other | Prednisone = 1 | 51 | 1 | 0 | 0 |
| Race = Asian, Native Hawaiian/Pacific Islander, American/Alaskan Native, Other | Prednisone = 0 | 1631 | 1.32 | 0.64 | 0.05 |
Publisher’s Note: MDPI stays neutral with regard to jurisdictional claims in published maps and institutional affiliations. |
© 2021 by the authors. Licensee MDPI, Basel, Switzerland. This article is an open access article distributed under the terms and conditions of the Creative Commons Attribution (CC BY) license (https://creativecommons.org/licenses/by/4.0/).
Share and Cite
Lan, B.; Haaland, P.; Krishnamurthy, A.; Peden, D.B.; Schmitt, P.L.; Sharma, P.; Sinha, M.; Xu, H.; Fecho, K. Open Application of Statistical and Machine Learning Models to Explore the Impact of Environmental Exposures on Health and Disease: An Asthma Use Case. Int. J. Environ. Res. Public Health 2021, 18, 11398. https://doi.org/10.3390/ijerph182111398
Lan B, Haaland P, Krishnamurthy A, Peden DB, Schmitt PL, Sharma P, Sinha M, Xu H, Fecho K. Open Application of Statistical and Machine Learning Models to Explore the Impact of Environmental Exposures on Health and Disease: An Asthma Use Case. International Journal of Environmental Research and Public Health. 2021; 18(21):11398. https://doi.org/10.3390/ijerph182111398
Chicago/Turabian StyleLan, Bo, Perry Haaland, Ashok Krishnamurthy, David B. Peden, Patrick L. Schmitt, Priya Sharma, Meghamala Sinha, Hao Xu, and Karamarie Fecho. 2021. "Open Application of Statistical and Machine Learning Models to Explore the Impact of Environmental Exposures on Health and Disease: An Asthma Use Case" International Journal of Environmental Research and Public Health 18, no. 21: 11398. https://doi.org/10.3390/ijerph182111398
APA StyleLan, B., Haaland, P., Krishnamurthy, A., Peden, D. B., Schmitt, P. L., Sharma, P., Sinha, M., Xu, H., & Fecho, K. (2021). Open Application of Statistical and Machine Learning Models to Explore the Impact of Environmental Exposures on Health and Disease: An Asthma Use Case. International Journal of Environmental Research and Public Health, 18(21), 11398. https://doi.org/10.3390/ijerph182111398