
Applying a Pedestrian Level of Service in the Context of Social Distancing: The Case of the City of Madrid


Abstract
:1. Introduction
- Evaluate the effects of social distancing on spatio-temporal patterns of pedestrian mobility using pedestrian counters.
- Propose a pedestrian level of service for pandemics that enables the use of tactical urban planning measures.
- Evaluate the pedestrian level of service with and without social distancing.
2. Literature Review
2.1. Pedestrian Levels of Service (PLOS)
2.2. Big Data
2.3. COVID-19 Transmission
3. Materials and Methods
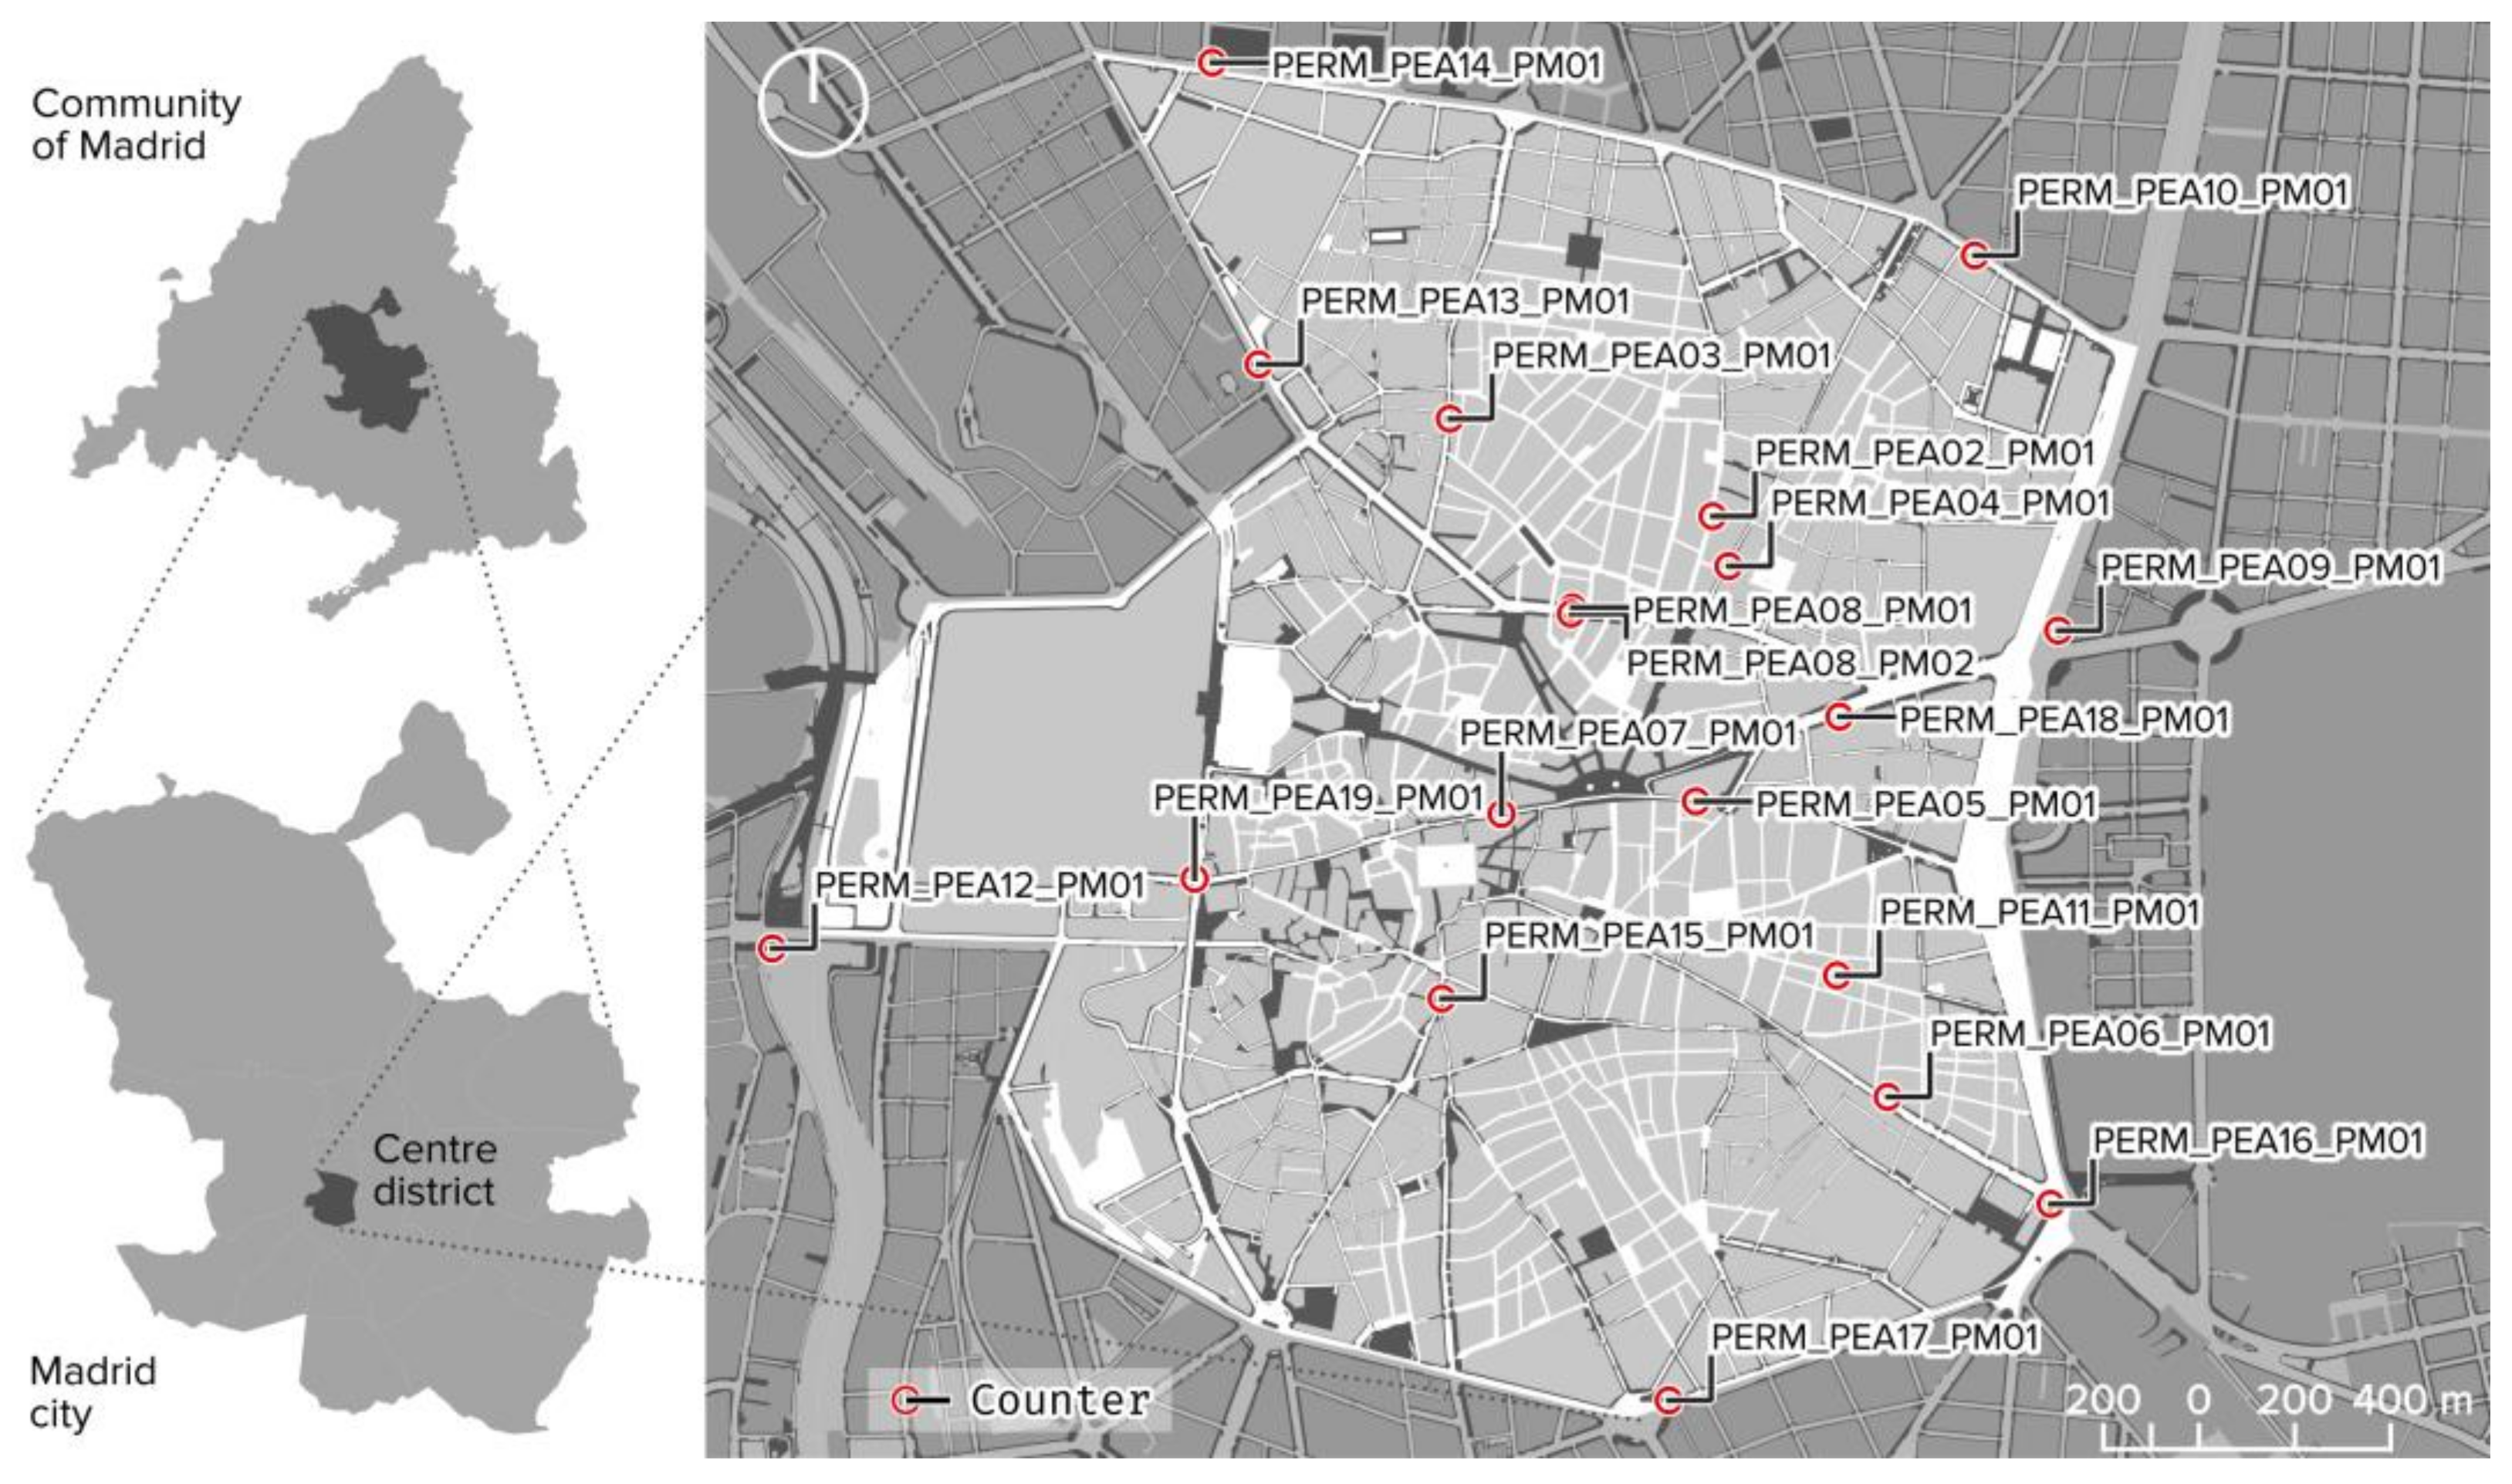
3.1. Case Study
3.2. Data
- (a)
- The data provided by Apple [28] refer to the number of requests for directions by country, region, or city, and were compared to the reference data of 13 January 2020 used in this study. These data from Apple users were included anonymously, which implies that the associated identifiers are random and rotating. Moreover, the data do not include any demographic information about the users, so no relations can be established with specific population groups.
- (b)
- Google provided Local Mobility Reports on COVID-19 [42], which showed the trend in movement over time at different scales, classified by categories of places (shops and leisure, supermarkets and pharmacies, public transport stations, workplaces, and residential areas).
- (c)
- The database of pedestrian counters is available to the public on the Madrid Council’s open data (Datos Abiertos) website [41]. This data source is maintained by the local administration, which periodically publishes data with a high level of disaggregation and in an exhaustive manner, which results in high-quality data. The counter data have been available since 2019, but they are not homogenous, and these limitations must be taken into account if the information is to be correctly processed. A total of 19 counters are available and distributed around the Centro district, some in main streets and others in smaller, more outlying ones. The durations for which the numbers of pedestrians were recorded was 15 min in 2019 and 60 min in 2020 and 2021. This change in frequency must be taken into account and we return to it in Section 3.3.
- (d)
- Finally, we used the street plan of the pavements of the city of Madrid as the base map for analysis. It is freely available through the Geoportal of the Madrid Council [43] at a scale of 1:1000, with the latest update in 2016. This information has been updated manually on the pavements that have been extended after the date of publication of the plan.
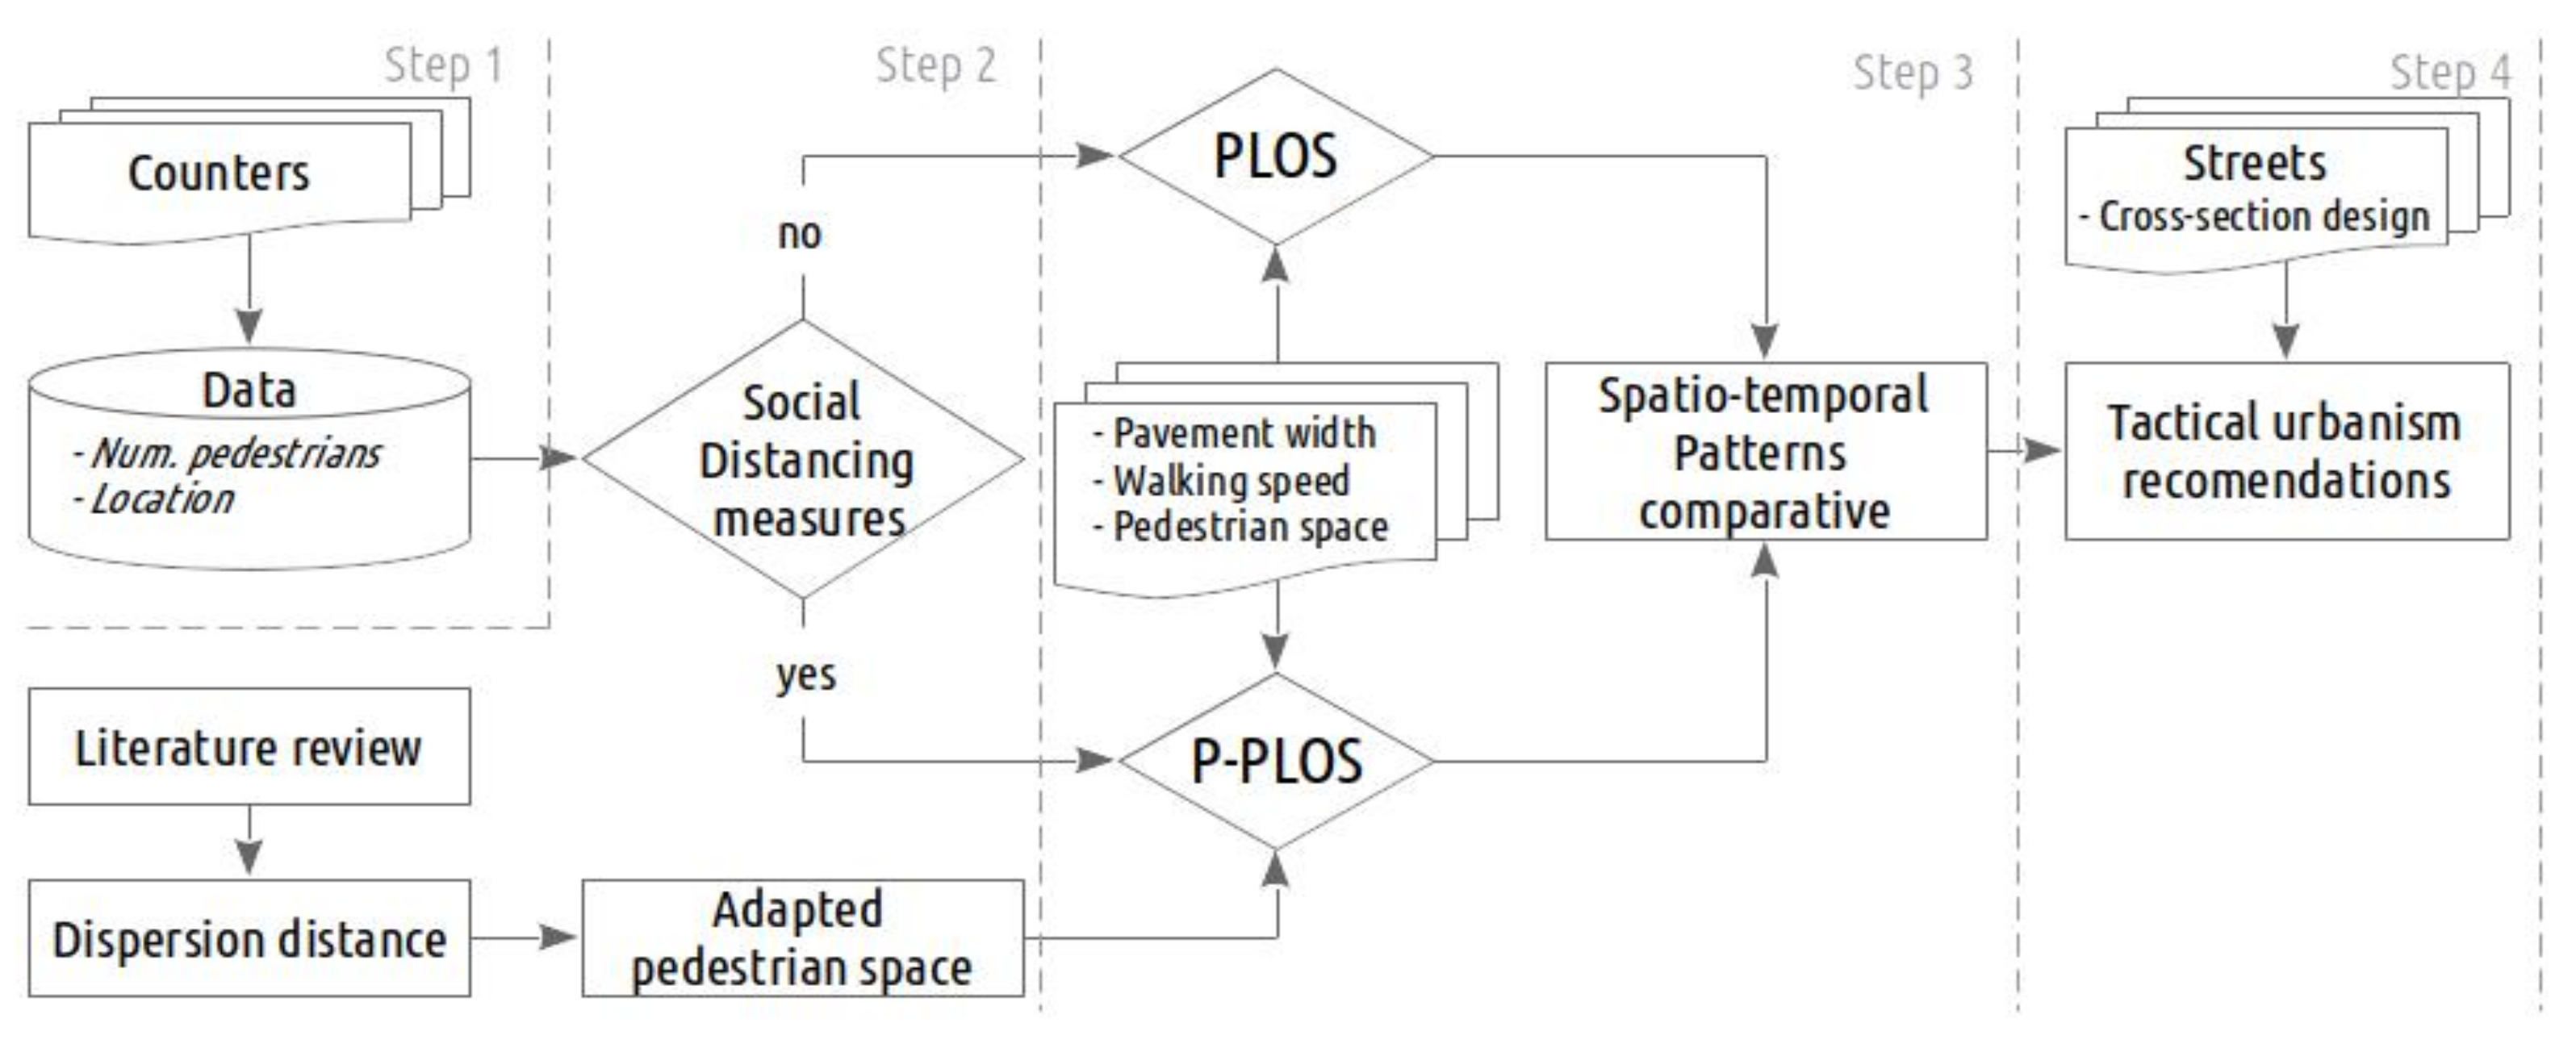
3.3. Methodology
3.3.1. Data Preprocessing and Street Characterisation
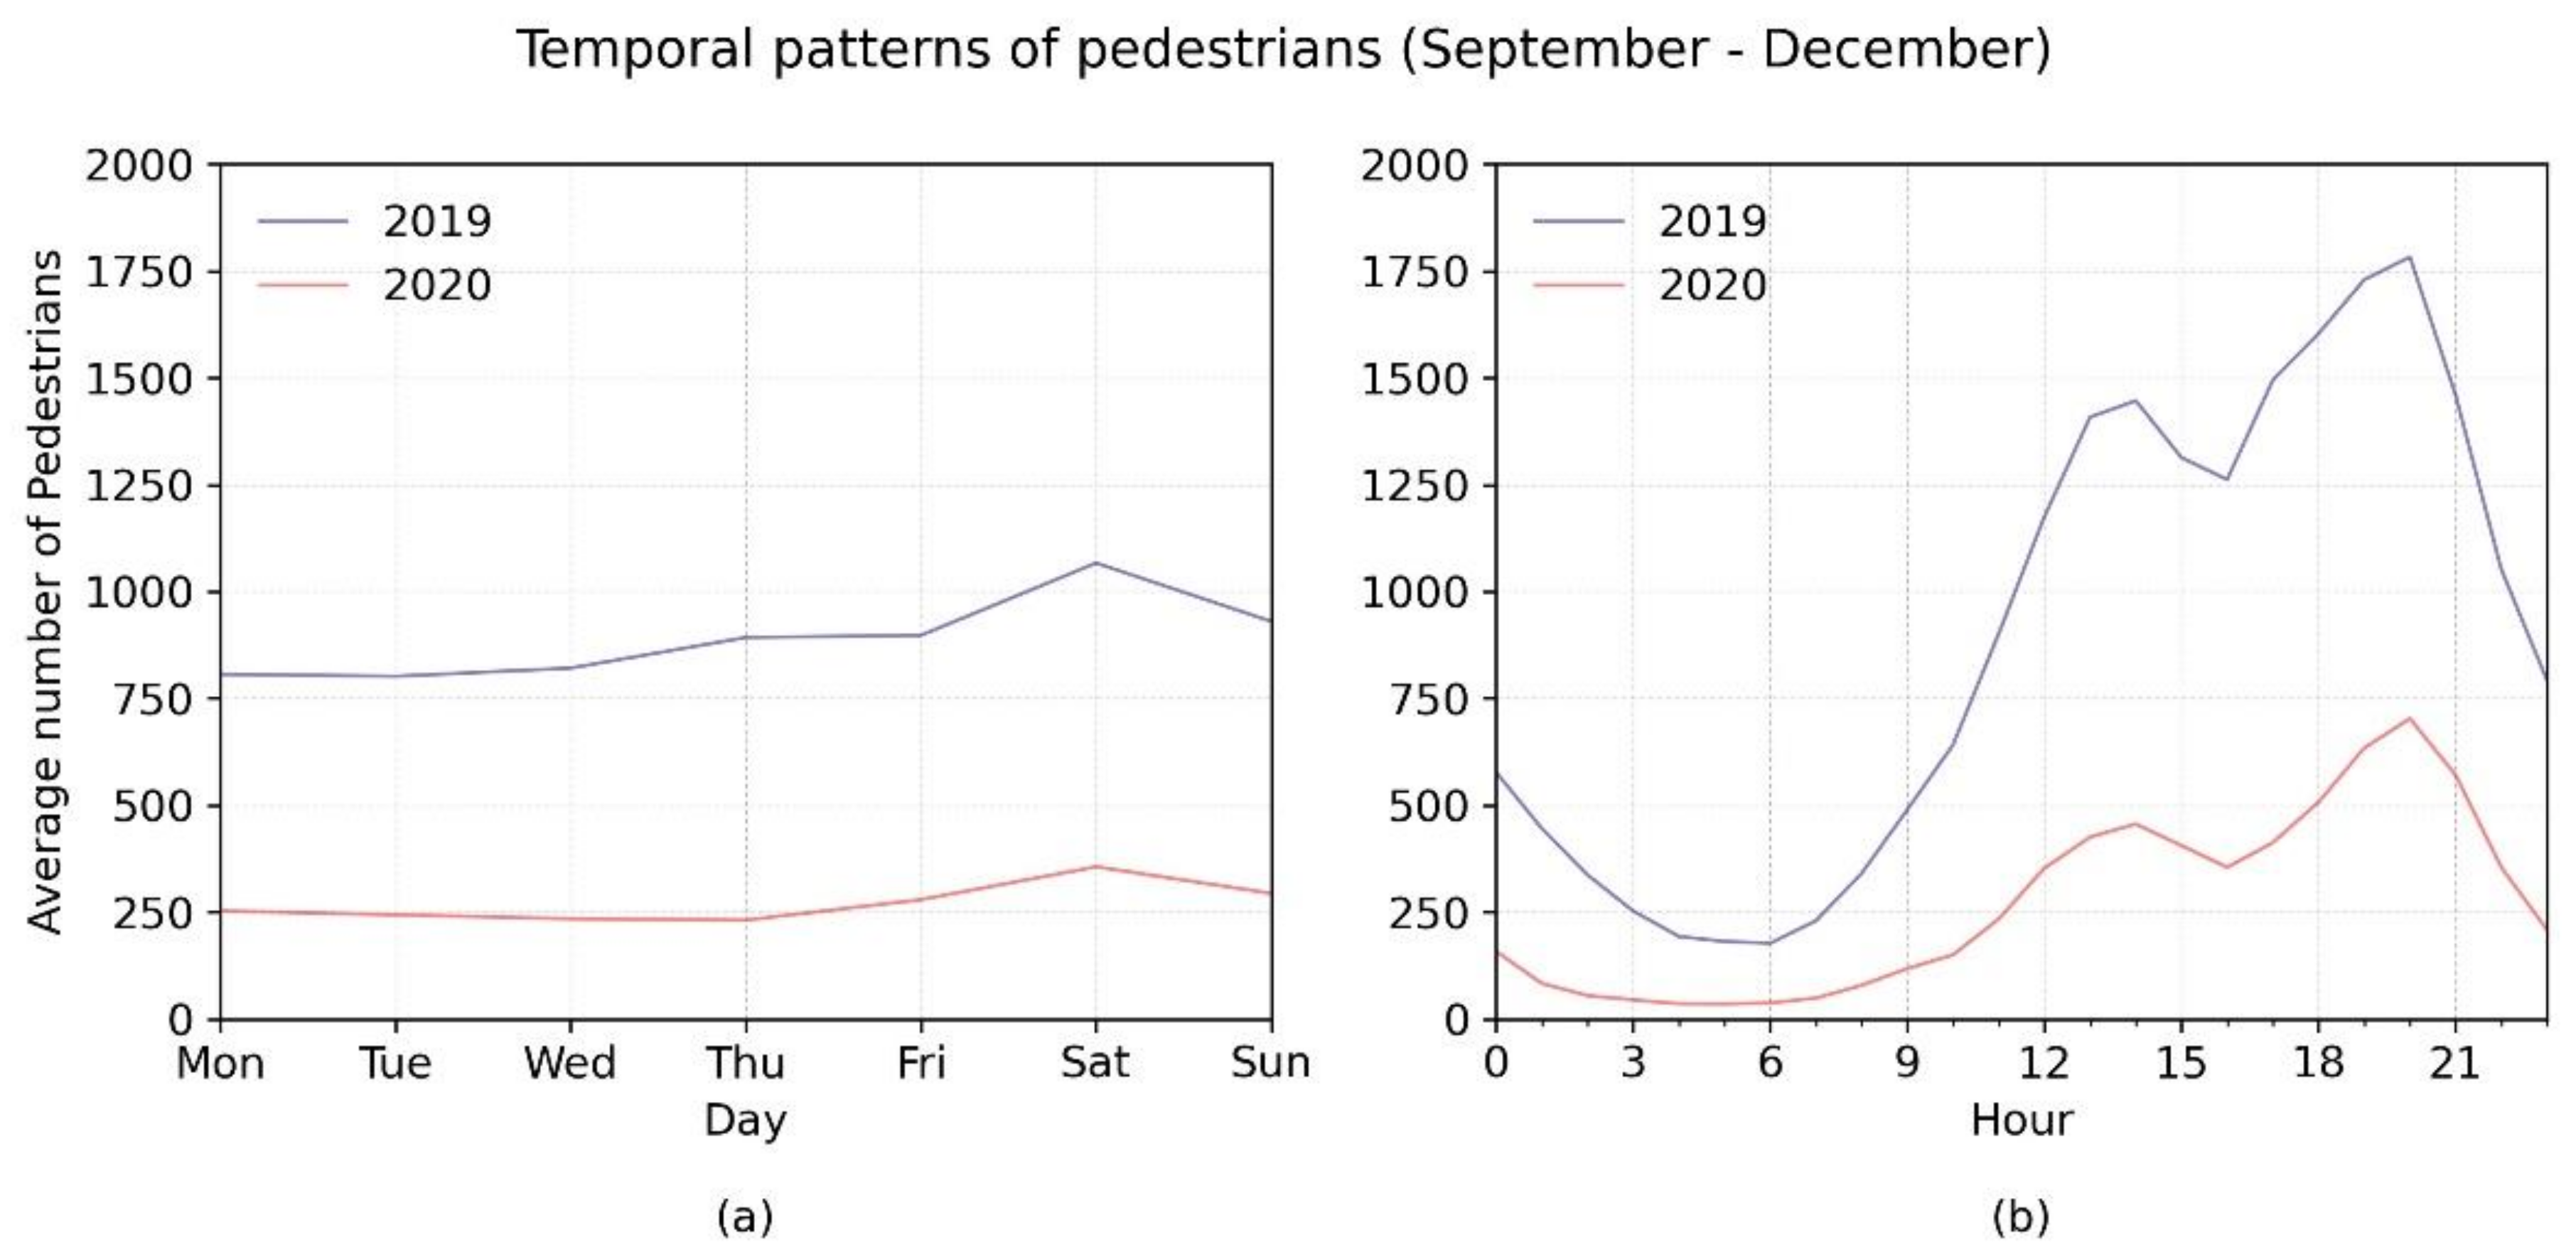
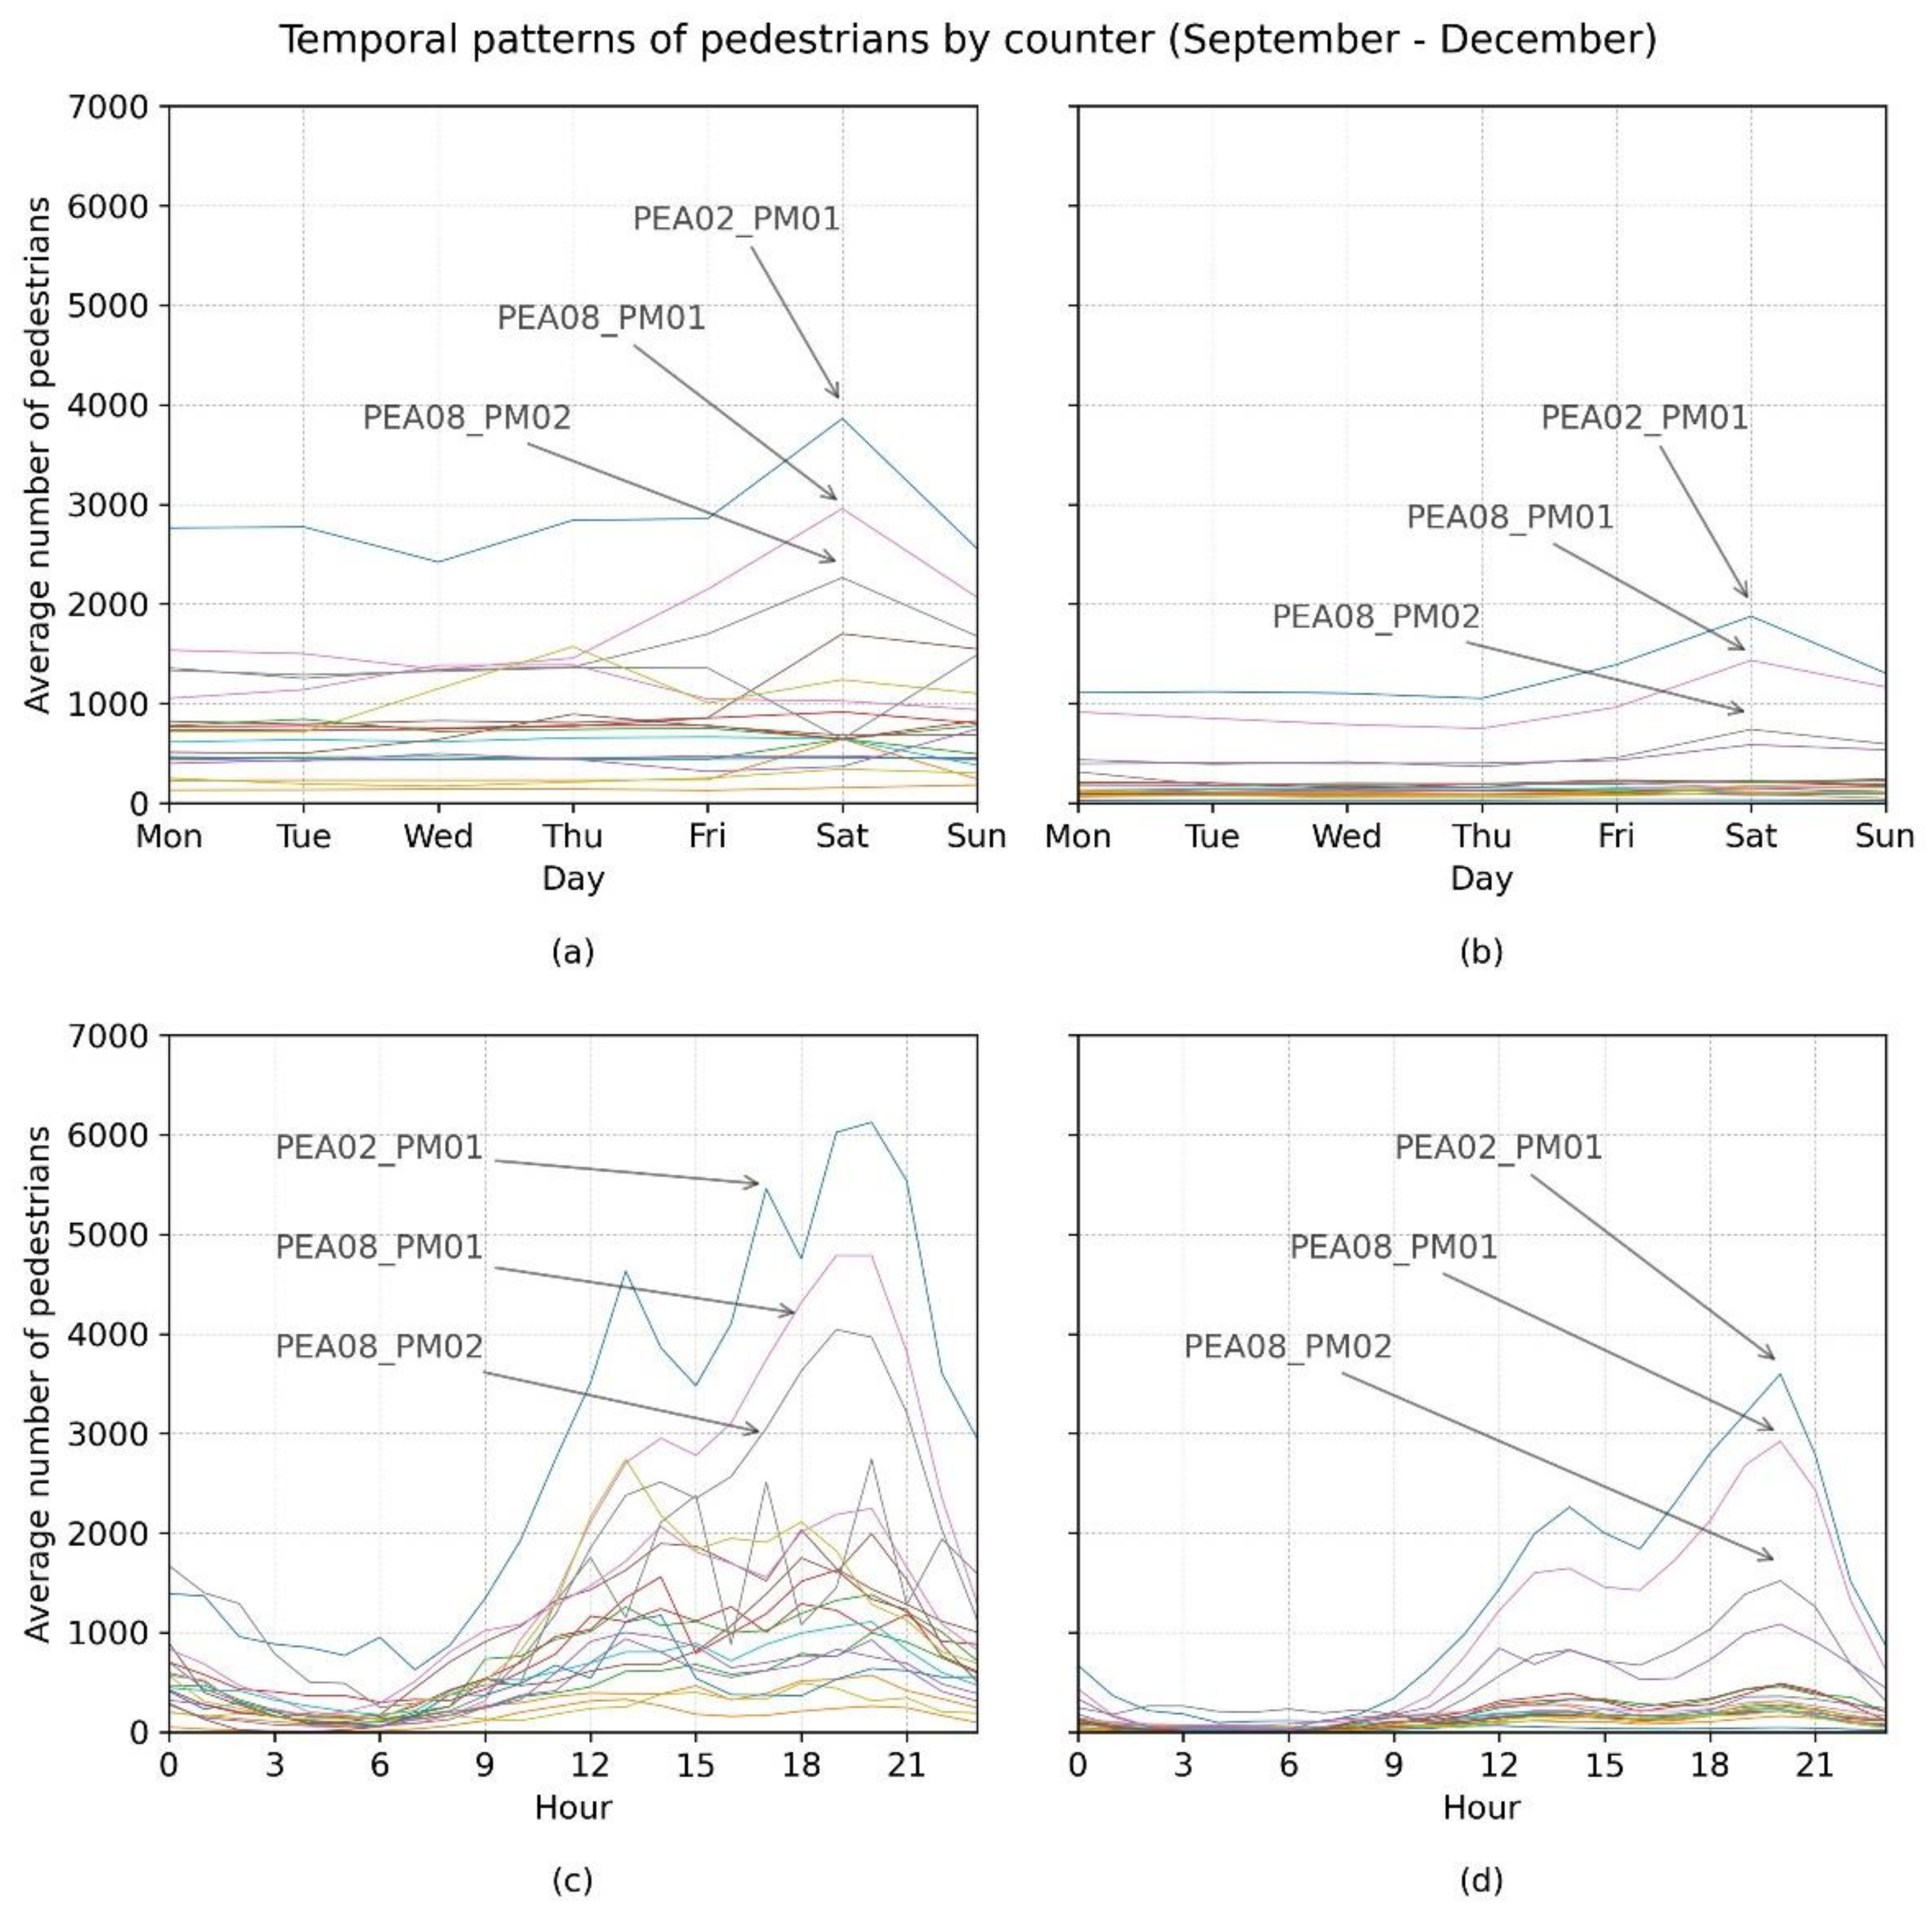
3.3.2. Spatio-Temporal Patterns
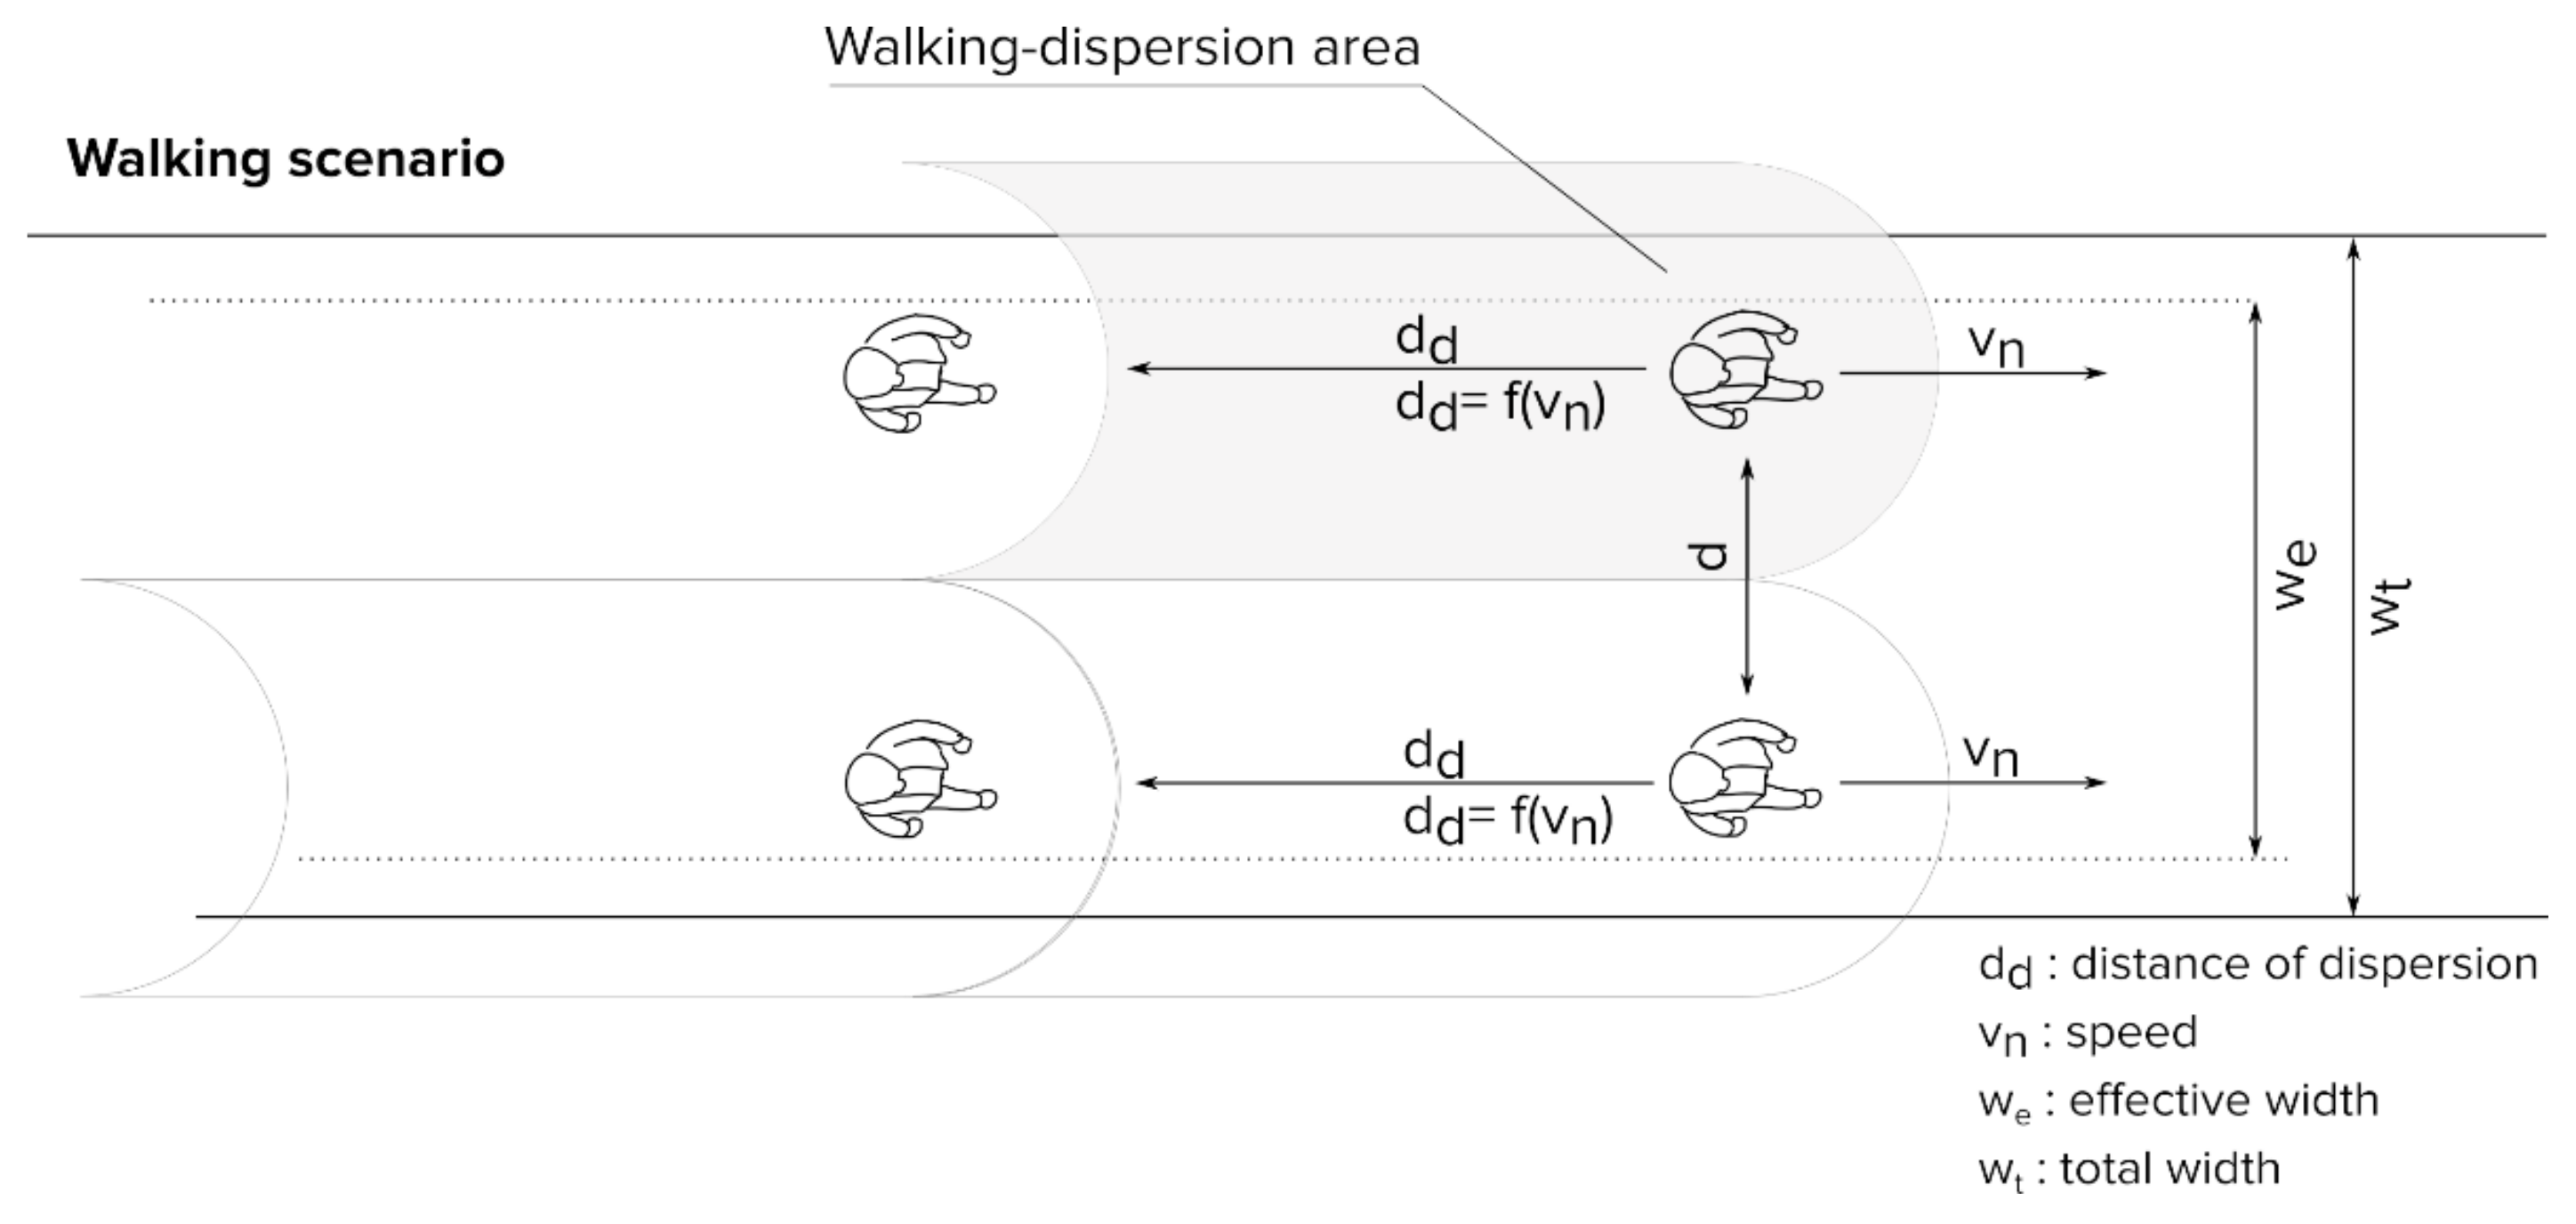
3.3.3. Designing a Pandemic Pedestrian Level of Service (P-PLOS)
- Ad is the walking-dispersion area;
- Ddf(v) is the walking-dispersion distance based on speed;
- LDd is the walking-dispersion lateral distance.
- Vp is the flow rate per unit of width (pedestrian/min/m);
- Spr is the reference pedestrian walking speed (m/min);
- Ap is the pedestrian space (m2/p).
4. Results
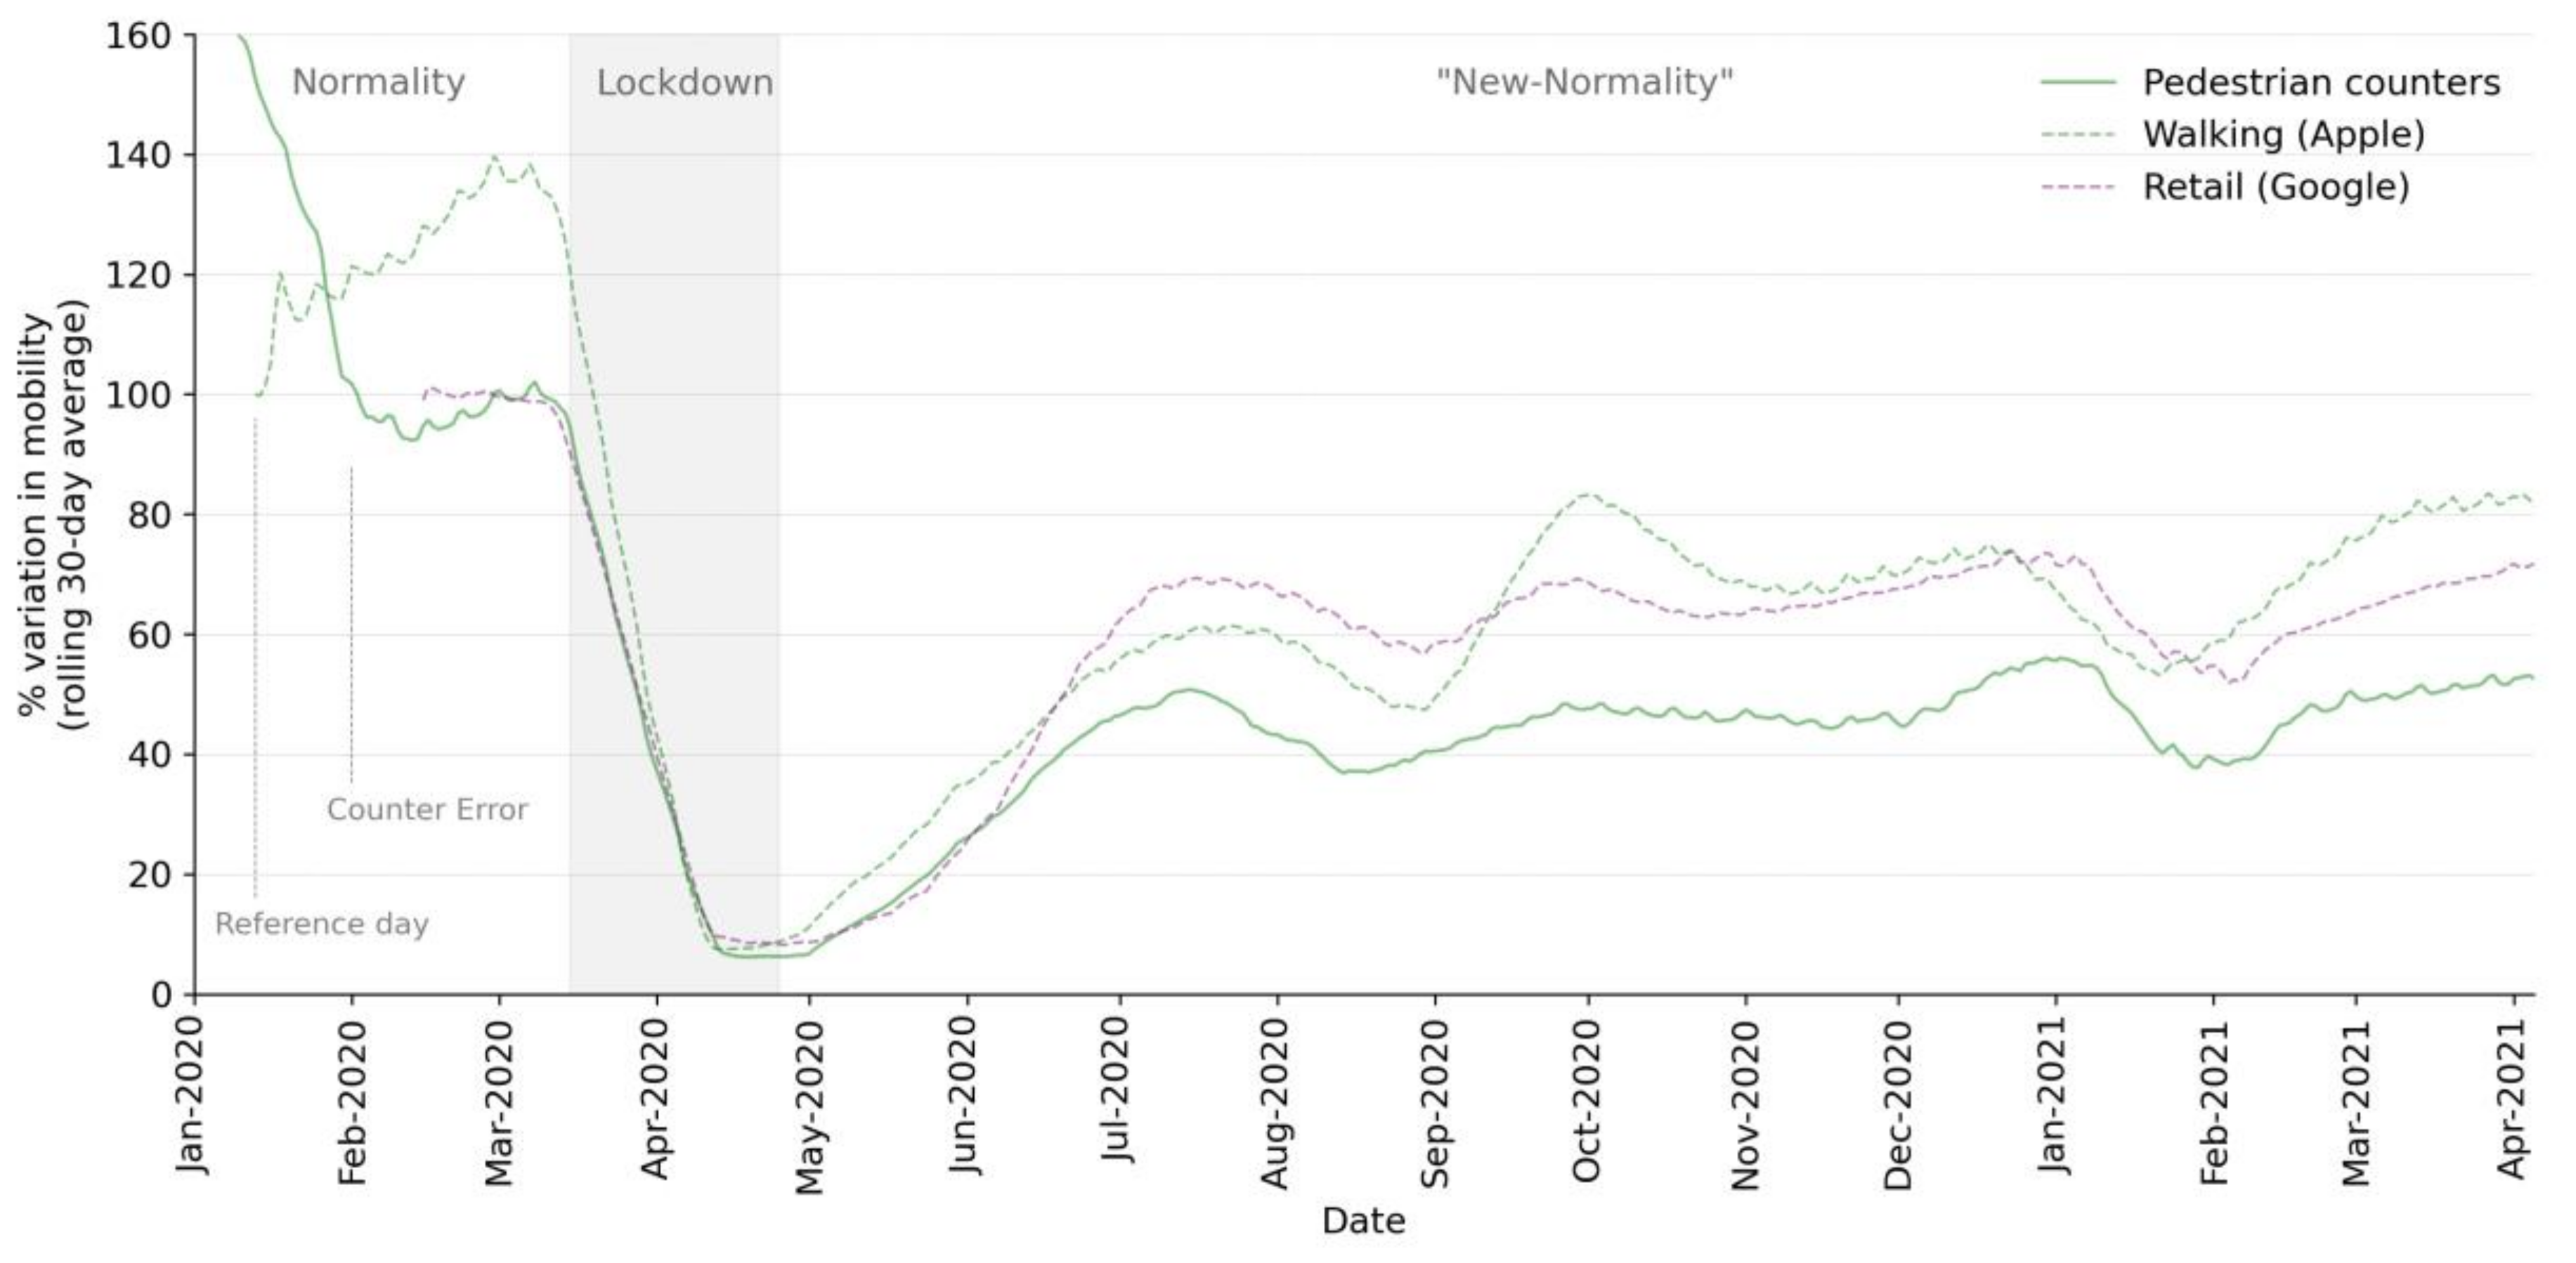
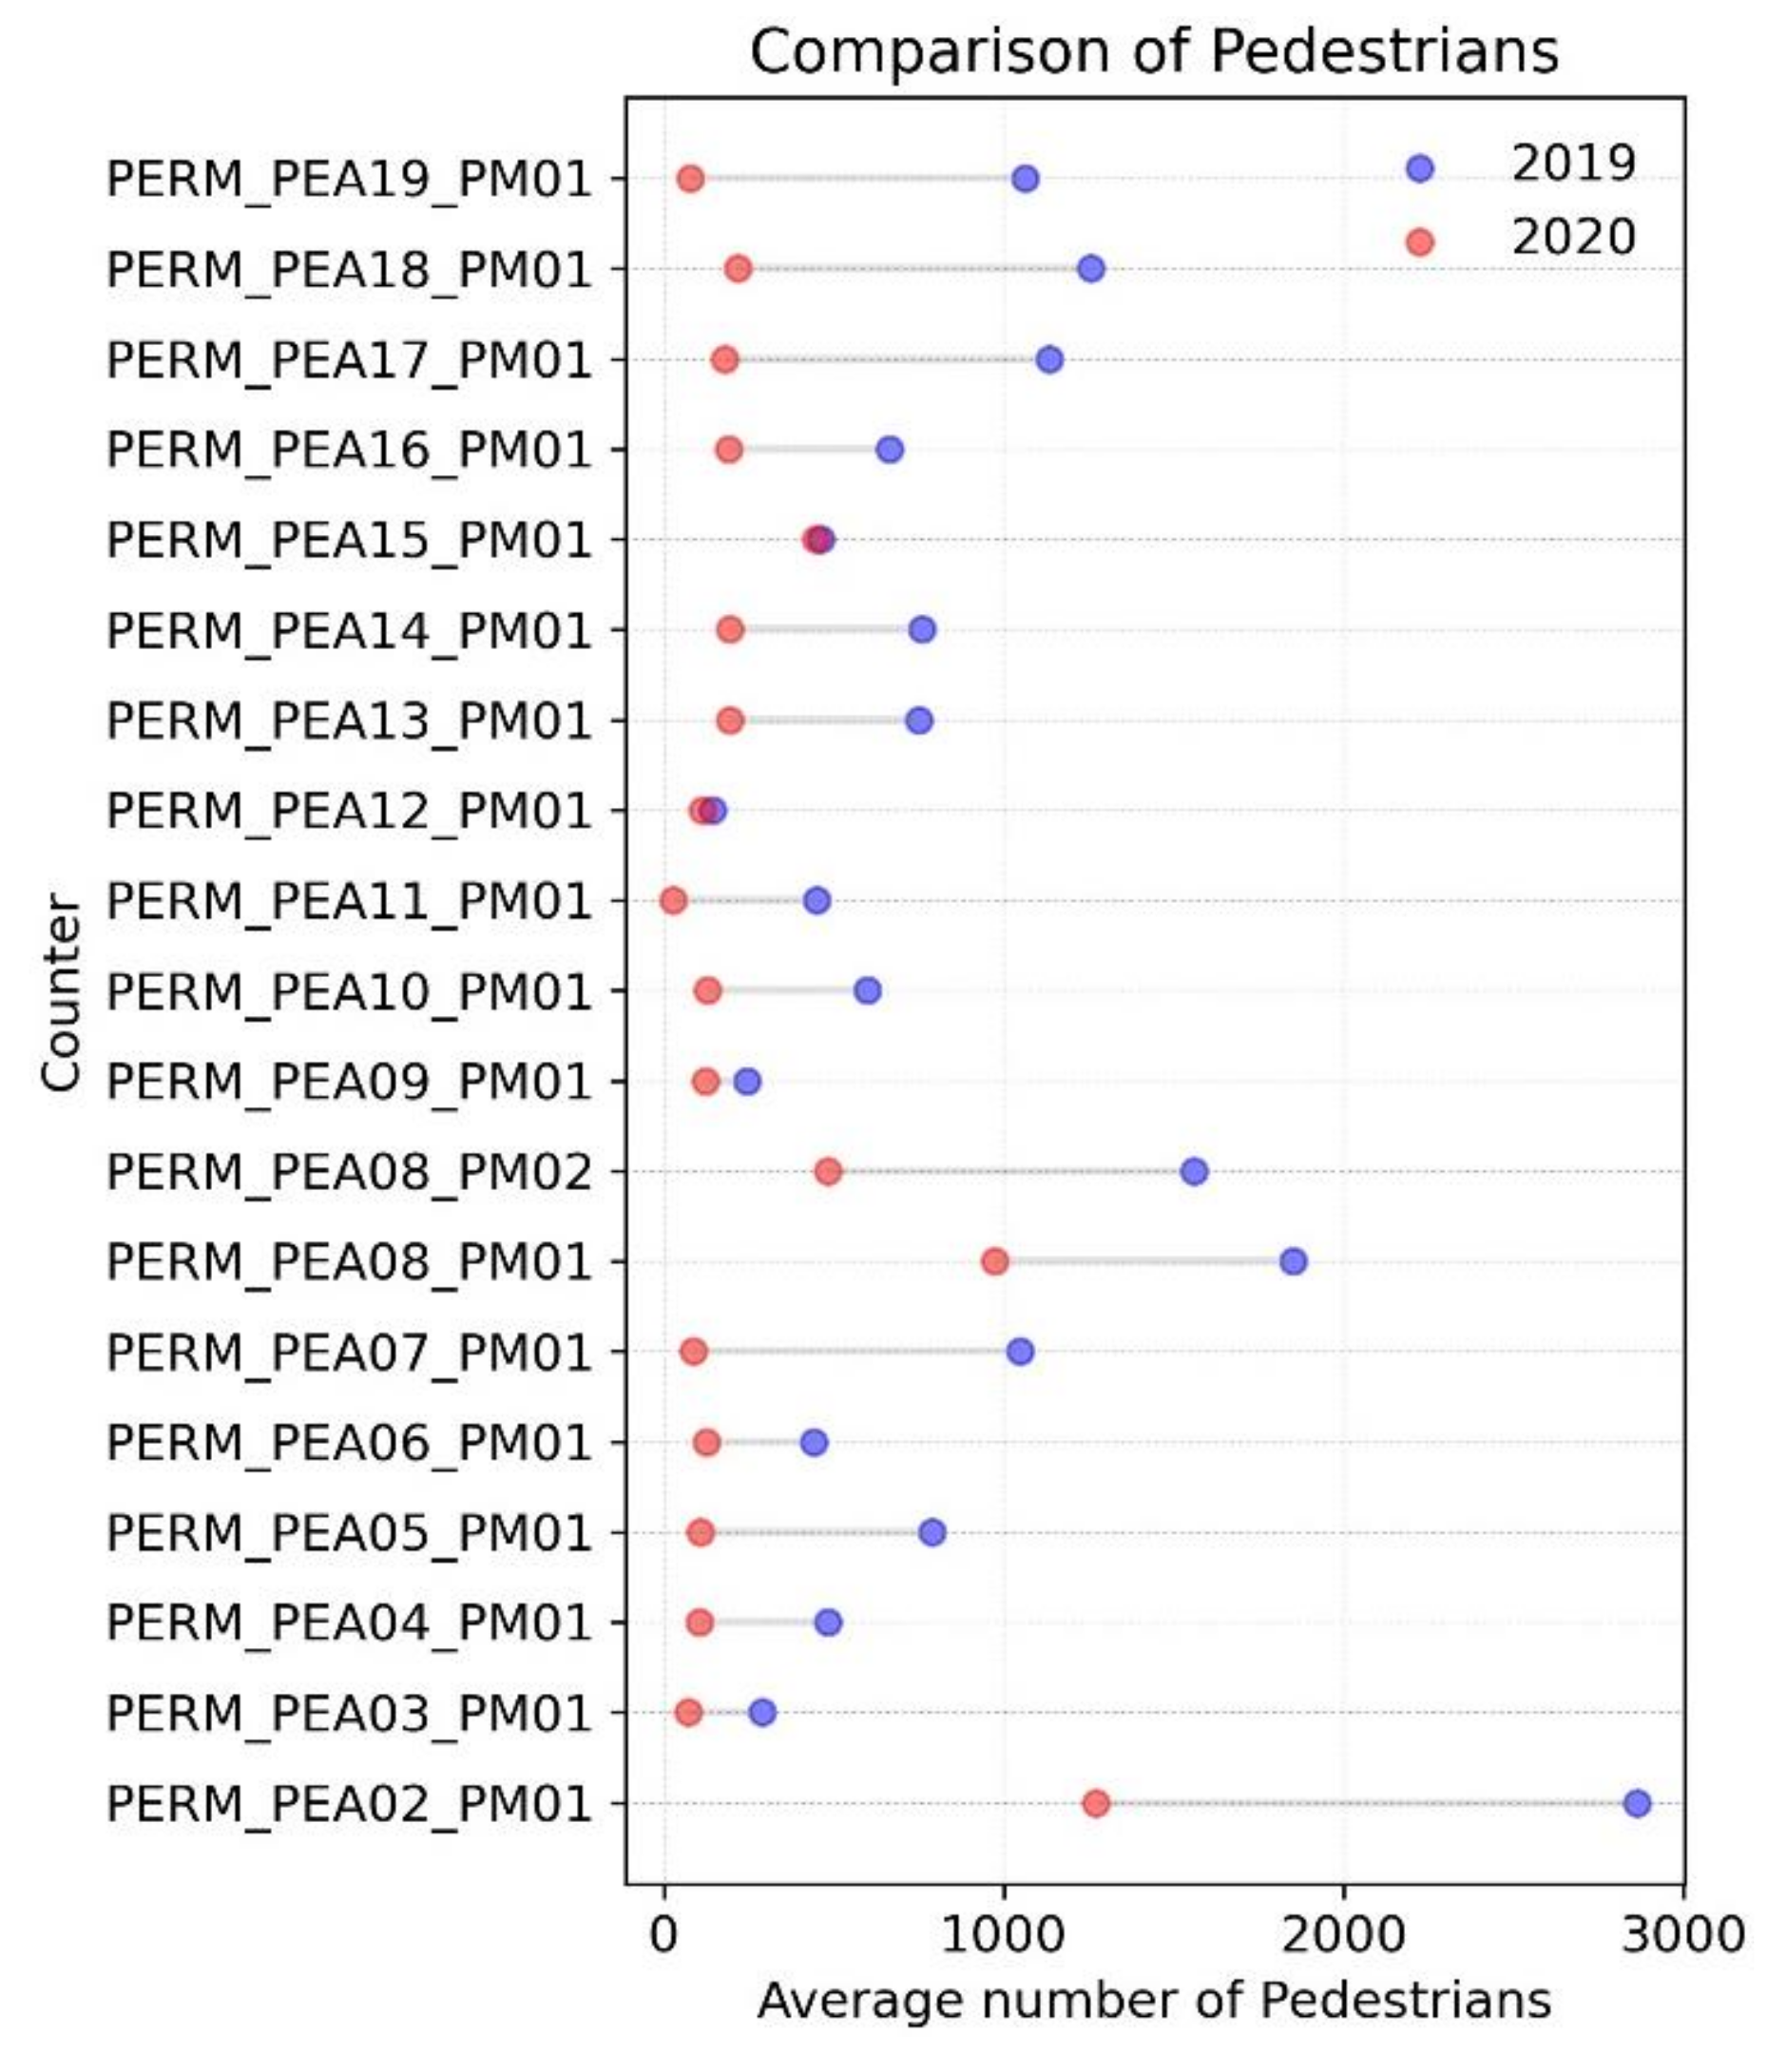
4.1. Changes in Mobility Patterns
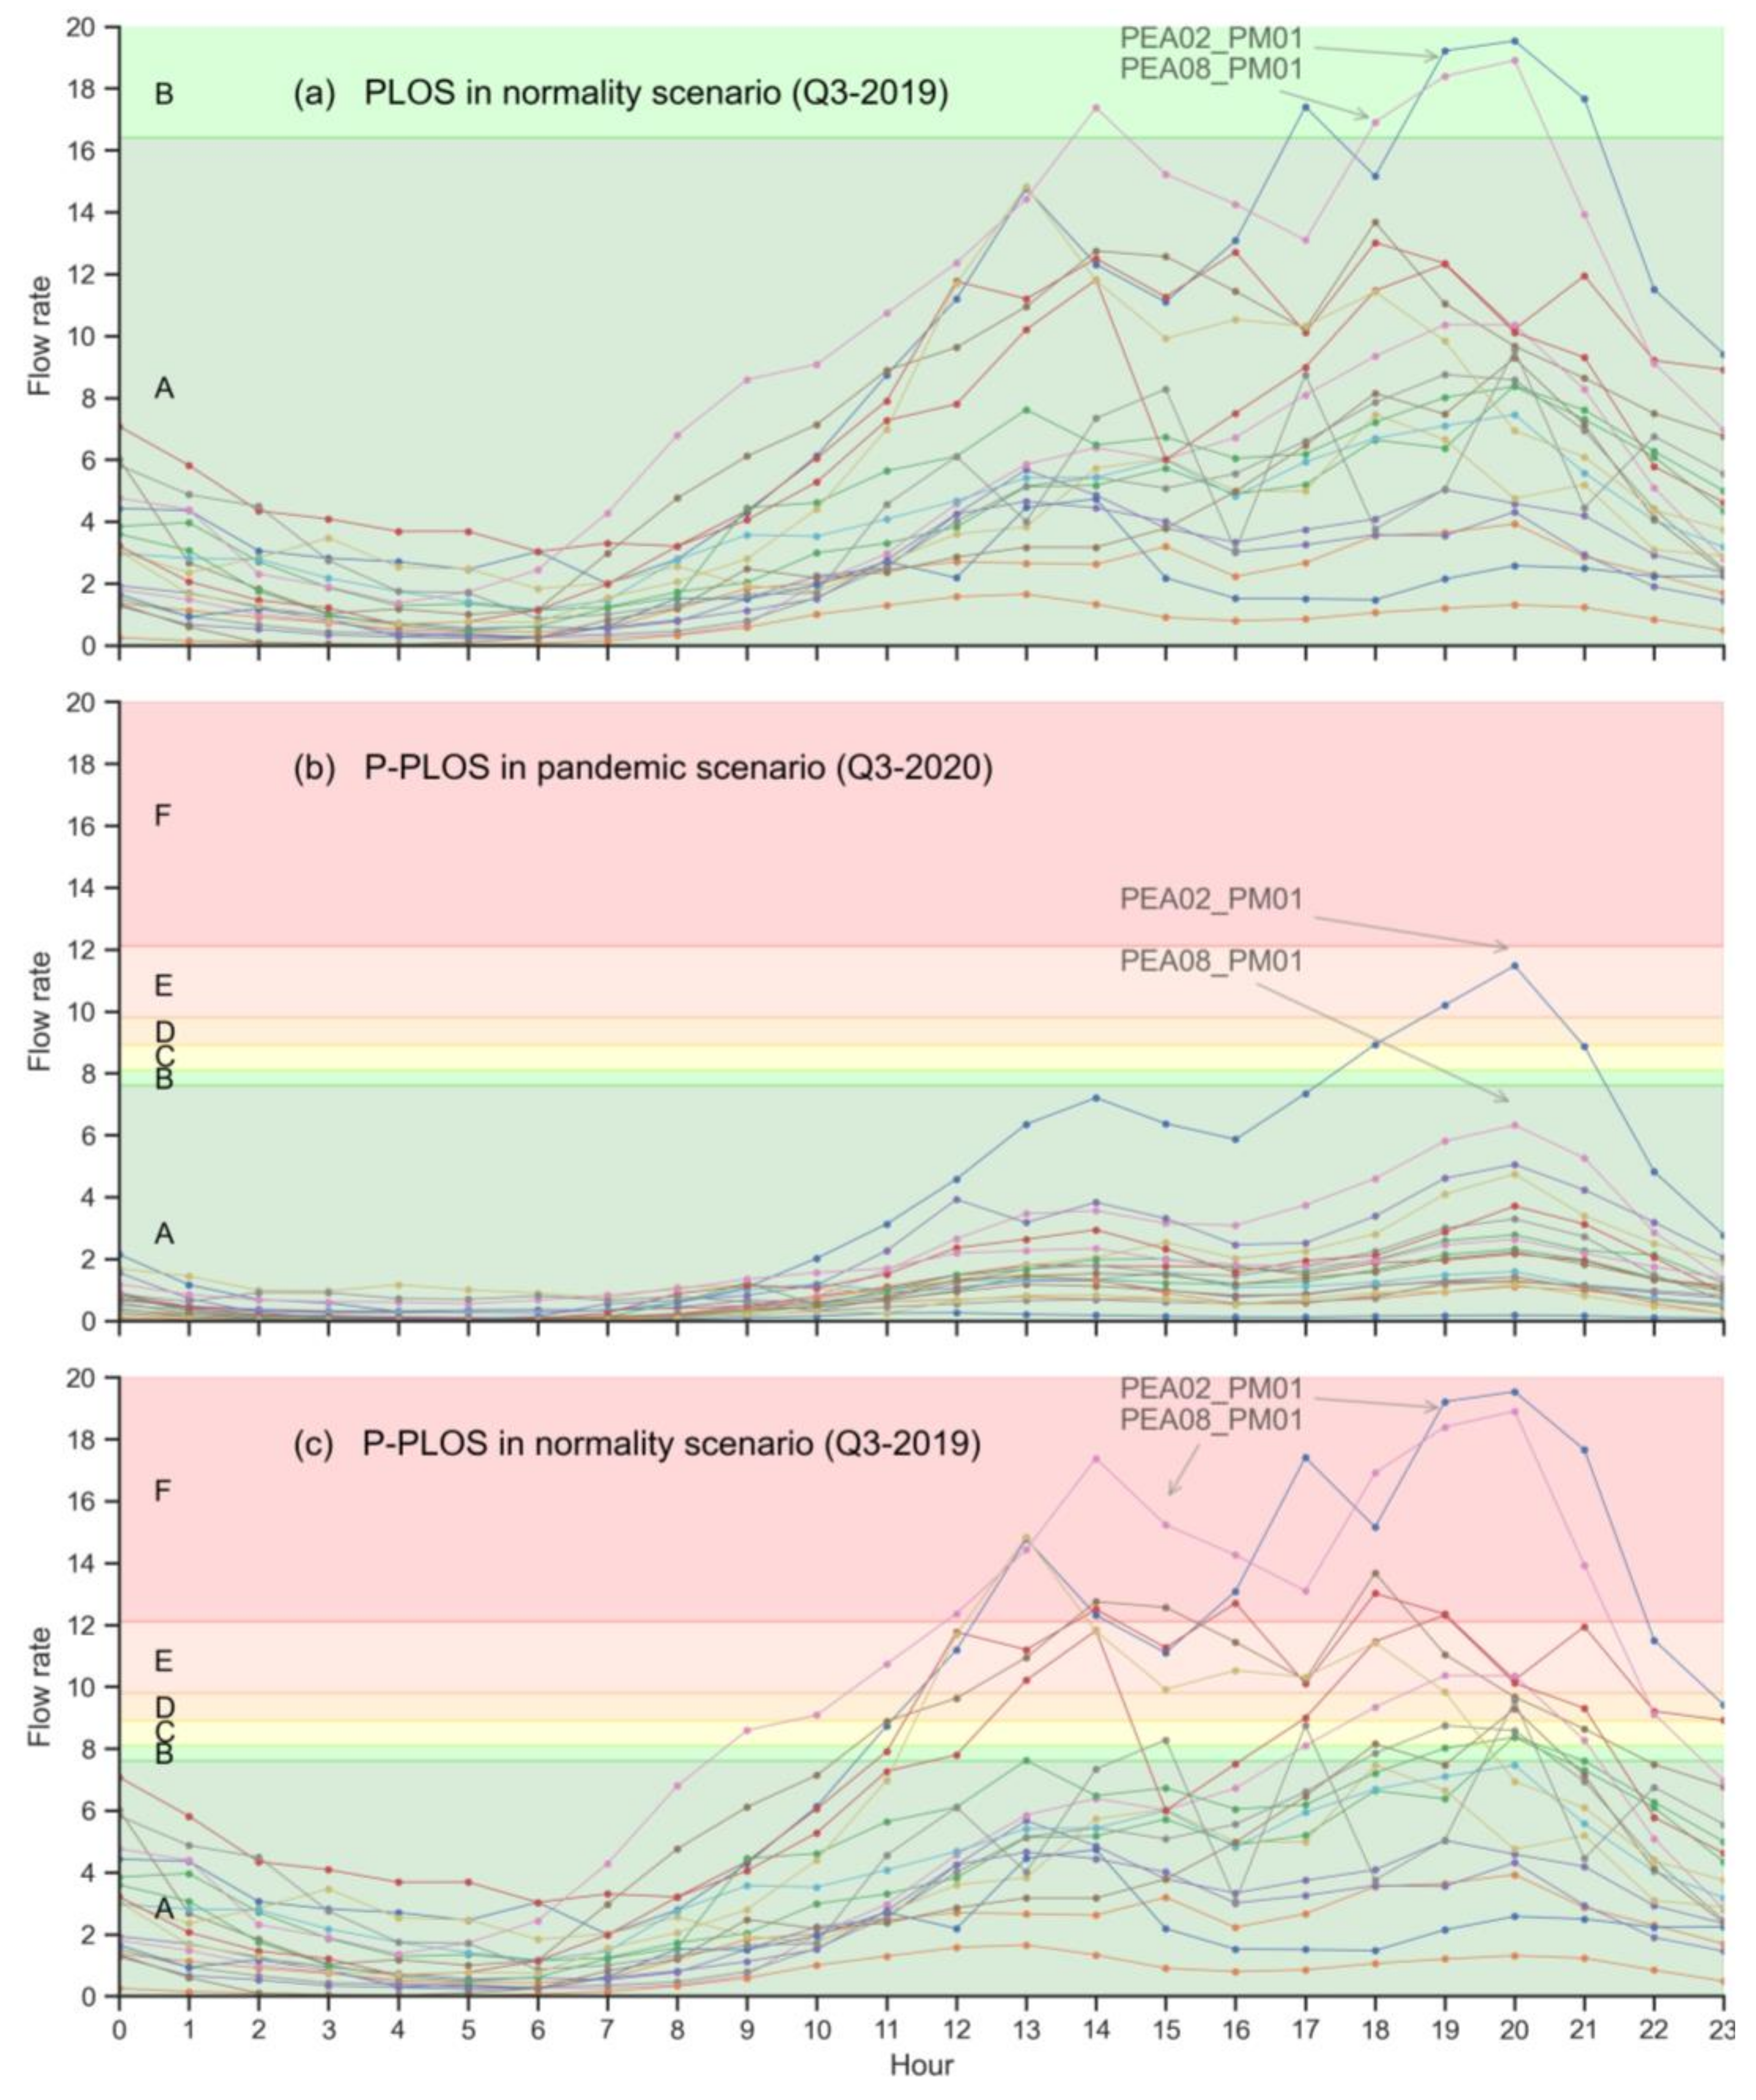
4.2. Changes in Pedestrian Level of Service (PLOS)
5. Discussion
6. Conclusions
Author Contributions
Funding
Institutional Review Board Statement
Informed Consent Statement
Data Availability Statement:
Acknowledgments
Conflicts of Interest
Appendix A

| Counter name | Pavement Width (m) | Parking lane | >1 Traffic Lane | Pedestrian Flow (Peak Hour) 1 | Photo |
|---|---|---|---|---|---|
| PERM_PEA02_PM01 | 9.5 | No | No | 6124 (19–20 h) |  |
| PERM_PEA03_PM01 | 3 | Yes | No | 570 (19–20 h) |  |
| PERM_PEA04_PM01 | 3.6 | No | No | 997 (19–20 h) |  |
| PERM_PEA05_PM01 | 3 | No | No | 1288 (17–18 h) |  |
| PERM_PEA06_PM01 | 5 | No | Yes | 937 (12–13 h) | 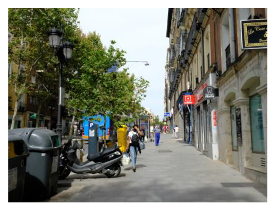 |
| PERM_PEA07_PM01 | 4.5 | Yes | No | 2031 (17–18 h) |  |
| PERM_PEA08_PM01 | 14 | No | Yes | 4787 (18–19 h) |  |
| PERM_PEA08_PM02 | 14 | No | Yes | 4041 (18–19 h) | 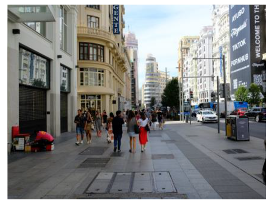 |
| PERM_PEA09_PM01 | 2 | No | Yes | 493 (17–18 h) | 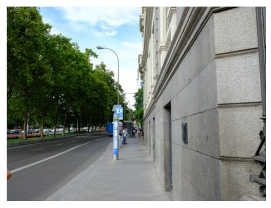 |
| PERM_PEA10_PM01 | 4.5 | Yes | Yes | 1108 (19–20 h) |  |
| PERM_PEA11_PM01 | 7.5 | No | No | 1172 (13–14 h) |  |
| PERM_PEA12_PM01 | 6 | No | Yes | 328 (12–13 h) |  |
| PERM_PEA13_PM01 | 5 | No | Yes | 1380 (19–20 h) | 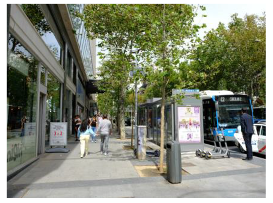 |
| PERM_PEA14_PM01 | 4 | No | Yes | 1626 (18–19 h) | 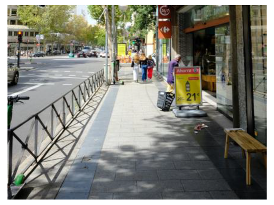 |
| PERM_PEA15_PM01 | 6.3 | No | No | 999 (12–13 h) | 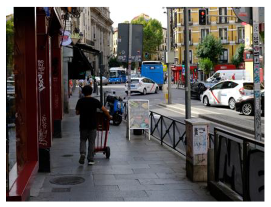 |
| PERM_PEA16_PM01 | 6.5 | No | Yes | 1992 (19–20 h) |  |
| PERM_PEA17_PM01 | 3.6 | No | Yes | 2246 (19–20 h) | 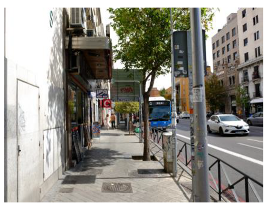 |
| PERM_PEA18_PM01 | 4.5 | No | Yes | 2740 (19–20 h) | 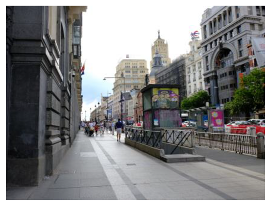 |
| PERM_PEA19_PM01 | 5.6 | No | Yes | 2740 (12–13 h) | 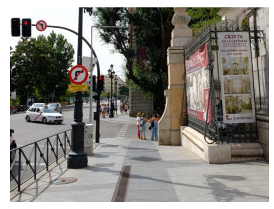 |
References
- López, L.; Rodó, X. The End of Social Confinement and COVID-19 Re-Emergence Risk. Nat. Hum. Behav. 2020, 4, 746–755. [Google Scholar] [CrossRef]
- Galeazzi, A.; Cinelli, M.; Bonaccorsi, G.; Pierri, F.; Schmidt, A.L.; Scala, A.; Pammolli, F.; Quattrociocchi, W. Human Mobility in Response to COVID-19 in France, Italy and UK. Sci. Rep. 2021, 11, 13141. [Google Scholar] [CrossRef] [PubMed]
- Nouvellet, P.; Bhatia, S.; Cori, A.; Ainslie, K.E.C.; Baguelin, M.; Bhatt, S.; Boonyasiri, A.; Brazeau, N.F.; Cattarino, L.; Cooper, L.V.; et al. Reduction in Mobility and COVID-19 Transmission. Nat. Commun. 2021, 12, 1090. [Google Scholar] [CrossRef]
- Murano, Y.; Ueno, R.; Shi, S.; Kawashima, T.; Tanoue, Y.; Tanaka, S.; Nomura, S.; Shoji, H.; Shimizu, T.; Nguyen, H.; et al. Impact of Domestic Travel Restrictions on Transmission of COVID-19 Infection Using Public Transportation Network Approach. Sci. Rep. 2021, 11, 3109. [Google Scholar] [CrossRef]
- Romanillos, G.; García-Palomares, J.C.; Moya-Gómez, B.; Gutiérrez, J.; Torres, J.; López, M.; Cantú-Ros, O.G.; Herranz, R. The City Turned off: Urban Dynamics during the COVID-19 Pandemic Based on Mobile Phone Data. Appl. Geogr. 2021, 134, 102524. [Google Scholar] [CrossRef]
- Borkowski, P.; Jażdżewska-Gutta, M.; Szmelter-Jarosz, A. Lockdowned: Everyday Mobility Changes in Response to COVID-19. J. Transp. Geogr. 2021, 90, 102906. [Google Scholar] [CrossRef]
- Buehler, R.; Pucher, J. COVID-19 Impacts on Cycling, 2019–2020. Transp. Rev. 2021, 41, 393–400. [Google Scholar] [CrossRef]
- Das, S.; Boruah, A.; Banerjee, A.; Raoniar, R.; Nama, S.; Maurya, A.K. Impact of COVID-19: A Radical Modal Shift from Public to Private Transport Mode. Transp. Policy 2021, 109, 1–11. [Google Scholar] [CrossRef]
- Haghani, M. The Knowledge Domain of Crowd Dynamics: Anatomy of the Field, Pioneering Studies, Temporal Trends, Influential Entities and Outside-Domain Impact. Phys. Stat. Mech. Appl. 2021, 580, 126145. [Google Scholar] [CrossRef]
- Brunetti, A.; Buongiorno, D.; Trotta, G.F.; Bevilacqua, V. Computer Vision and Deep Learning Techniques for Pedestrian Detection and Tracking: A Survey. Neurocomputing 2018, 300, 17–33. [Google Scholar] [CrossRef]
- Zhang, R.; Li, Y.; Zhang, A.L.; Wang, Y.; Molina, M.J. Identifying Airborne Transmission as the Dominant Route for the Spread of COVID-19. Proc. Natl. Acad. Sci. USA 2020, 117, 14857–14863. [Google Scholar] [CrossRef] [PubMed]
- Leung, N.H.L.; Chu, D.K.W.; Shiu, E.Y.C.; Chan, K.-H.; McDevitt, J.J.; Hau, B.J.P.; Yen, H.-L.; Li, Y.; Ip, D.K.M.; Peiris, J.S.M.; et al. Respiratory Virus Shedding in Exhaled Breath and Efficacy of Face Masks. Nat. Med. 2020, 26, 676–680. [Google Scholar] [CrossRef] [PubMed] [Green Version]
- Dixon, L.B. Bicycle and Pedestrian Level-of-Service Performance Measures and Standards for Congestion Management Systems. Transp. Res. Rec. 1996, 1538, 1–9. [Google Scholar] [CrossRef]
- Fruin, J.J. Pedestrian Planning and Design; Metropolitan Association of Urban Designers and Environmental Planners: New York, NY, USA, 1971. [Google Scholar]
- Mōri, M.; Tsukaguchi, H. A New Method for Evaluation of Level of Service in Pedestrian Facilities. Transp. Res. Part Gen. 1987, 21, 223–234. [Google Scholar] [CrossRef]
- Reilly, W. Highway Capacity Manual 2000; Transportation Research Board, National Research Council: Washington, DC, USA, 1997. [Google Scholar]
- Alfonzo, M.A. To Walk or Not to Walk? The Hierarchy of Walking Needs. Environ. Behav. 2005, 37, 808–836. [Google Scholar] [CrossRef]
- Talavera-Garcia, R.; Soria-Lara, J.A. Q-PLOS, Developing an Alternative Walking Index. A Method Based on Urban Design Quality. Cities 2015, 45, 7–17. [Google Scholar] [CrossRef]
- Das, P. Review of Simulation Techniques for Microscopic Mobility of Pedestrian Movement. Trends Transp. Eng. Appl. 2019, 1, 27–45. [Google Scholar] [CrossRef]
- Hagos, K.G.; Adnan, M.; Yasar, A.-H. Effect of Sidewalk Vendors on Pedestrian Movement Characteristics: A Microscopic Simulation Study of Addis Ababa, Ethiopia. Cities 2020, 103, 102769. [Google Scholar] [CrossRef]
- Mohammadi, A.; Chowdhury, M.T.U.; Yang, S.; Park, P.Y. Developing Levels of Pedestrian Physical Distancing during a Pandemic. Saf. Sci. 2021, 134, 105066. [Google Scholar] [CrossRef]
- Gutiérrez Puebla, J. Big Data y nuevas geografías: La huella digital de las actividades humanas. Doc. Anàlisi Geogràfica 2018, 64, 0195–0217. [Google Scholar] [CrossRef]
- Talavera-Garcia, R.; Romanillos, G.; Arias-Molinares, D. Examining Spatio-Temporal Mobility Patterns of Bike-Sharing Systems: The Case of BiciMAD (Madrid). J. Maps 2021, 17, 7–13. [Google Scholar] [CrossRef]
- Bragazzi, N.L.; Dai, H.; Damiani, G.; Behzadifar, M.; Martini, M.; Wu, J. How Big Data and Artificial Intelligence Can Help Better Manage the COVID-19 Pandemic. Int. J. Environ. Res. Public. Health 2020, 17, 3176. [Google Scholar] [CrossRef] [PubMed]
- Zhou, C.; Su, F.; Pei, T.; Zhang, A.; Du, Y.; Luo, B.; Cao, Z.; Wang, J.; Yuan, W.; Zhu, Y.; et al. COVID-19: Challenges to GIS with Big Data. Geogr. Sustain. 2020, 1, 77–87. [Google Scholar] [CrossRef]
- Oliver, N.; Lepri, B.; Sterly, H.; Lambiotte, R.; Deletaille, S.; Nadai, M.D.; Letouzé, E.; Salah, A.A.; Benjamins, R.; Cattuto, C.; et al. Mobile Phone Data for Informing Public Health Actions across the COVID-19 Pandemic Life Cycle. Sci. Adv. 2020, 6. [Google Scholar] [CrossRef] [PubMed]
- Bengtsson, L.; Gaudart, J.; Lu, X.; Moore, S.; Wetter, E.; Sallah, K.; Rebaudet, S.; Piarroux, R. Using Mobile Phone Data to Predict the Spatial Spread of Cholera. Sci. Rep. 2015, 5, 8923. [Google Scholar] [CrossRef] [PubMed]
- Apple COVID-19—Mobility Trends Reports. Available online: https://www.apple.com/covid19/mobility (accessed on 14 July 2021).
- Hunter, R.F.; Garcia, L.; de Sa, T.H.; Zapata-Diomedi, B.; Millett, C.; Woodcock, J.; Pentland, A.S.; Moro, E. Effect of COVID-19 Response Policies on Walking Behavior in US Cities. Nat. Commun. 2021, 12, 3652. [Google Scholar] [CrossRef]
- Jones, N.R.; Qureshi, Z.U.; Temple, R.J.; Larwood, J.P.J.; Greenhalgh, T.; Bourouiba, L. Two Metres or One: What Is the Evidence for Physical Distancing in Covid-19? BMJ 2020, 370, m3223. [Google Scholar] [CrossRef]
- Sun, C.; Zhai, Z. The Efficacy of Social Distance and Ventilation Effectiveness in Preventing COVID-19 Transmission. Sustain. Cities Soc. 2020, 62, 102390. [Google Scholar] [CrossRef]
- Chu, D.K.; Akl, E.A.; Duda, S.; Solo, K.; Yaacoub, S.; Schünemann, H.J.; Chu, D.K.; Akl, E.A.; El-harakeh, A.; Bognanni, A.; et al. Physical Distancing, Face Masks, and Eye Protection to Prevent Person-to-Person Transmission of SARS-CoV-2 and COVID-19: A Systematic Review and Meta-Analysis. Lancet 2020, 395, 1973–1987. [Google Scholar] [CrossRef]
- WHO Advice for the Public on COVID-19. Available online: https://www.who.int/emergencies/diseases/novel-coronavirus-2019/advice-for-public (accessed on 21 December 2020).
- CDC COVID-19 and Your Health. Available online: https://www.cdc.gov/coronavirus/2019-ncov/prevent-getting-sick/social-distancing.html (accessed on 21 December 2020).
- Spanish Government La Moncloa. Uso de la Mascarilla en la Nueva Normalidad [COVID-19]. Available online: https://www.lamoncloa.gob.es/covid-19/Paginas/uso-mascarilla-nueva-normalidad.aspx (accessed on 16 February 2021).
- Córdoba-Hernández, R.; Fernández-Ramírez, C.; Hernández-Aja, A.; Salgado, G.S.-T.; Gómez-Giménez, J.M. Áreas Urbanas frente a Barrios. Análisis de las características urbanas ante el reto de la ciudad post-COVID19: El caso de Madrid. Ciudad Territ. Estud. Territ. CyTET 2020, 205, 665–684. [Google Scholar] [CrossRef]
- Spanish Government BOE.Es—BOE-A-2020-4767 Orden SND/380/2020, de 30 de Abril, Sobre Las Condiciones En Las Que Se Puede Realizar Actividad Física No Profesional al Aire Libre Durante La Situación de Crisis Sanitaria Ocasionada Por El COVID-19. Available online: https://www.boe.es/buscar/act.php?id=BOE-A-2020-4767 (accessed on 7 July 2021).
- Blocken, B.; Malizia, F.; van Druenen, T.; Marchal, T. Towards Aerodynamically Equivalent COVID19 1.5 m Social Distancing for Walking and Running. 2020. Available online: http://www.urbanphysics.net/Social%20Distancing%20v20_White_Paper.pdf (accessed on 7 July 2021).
- García-Palomares, J.C.; Gutiérrez, J.; Mínguez, C. Identification of Tourist Hot Spots Based on Social Networks: A Comparative Analysis of European Metropolises Using Photo-Sharing Services and GIS. Appl. Geogr. 2015, 63, 408–417. [Google Scholar] [CrossRef]
- Salas-Olmedo, M.H.; Moya-Gómez, B.; García-Palomares, J.C.; Gutiérrez, J. Tourists’ Digital Footprint in Cities: Comparing Big Data Sources. Tour. Manag. 2018, 66, 13–25. [Google Scholar] [CrossRef] [Green Version]
- Ayto. Madrid Portal de datos abiertos del Ayuntamiento de Madrid. Available online: https://datos.madrid.es/portal/site/egob (accessed on 14 July 2021).
- Google COVID-19 Community Mobility Report. Available online: https://www.google.com/covid19/mobility?hl=en (accessed on 14 July 2021).
- Ayuntamiento de Madrid Geoportal del Ayuntamiento de Madrid. Available online: https://wpgeoportal.madrid.es/ (accessed on 22 July 2021).
- Awad-Núñez, S.; Julio, R.; Gomez, J.; Moya-Gómez, B.; González, J.S. Post-COVID-19 Travel Behaviour Patterns: Impact on the Willingness to Pay of Users of Public Transport and Shared Mobility Services in Spain. Eur. Transp. Res. Rev. 2021, 13, 20. [Google Scholar] [CrossRef]
- Shokouhyar, S.; Shokoohyar, S.; Sobhani, A.; Gorizi, A.J. Shared Mobility in Post-COVID Era: New Challenges and Opportunities. Sustain. Cities Soc. 2021, 67, 102714. [Google Scholar] [CrossRef]
- Talavera-García, R.; Valenzuela-Montes, L.M. Aproximación a los entornos peatonales a través de una encuesta a la población: Aplicación a la ciudad de Granada. An. Geogr. Univ. Complut. 2018, 38, 239–262. [Google Scholar] [CrossRef]
- Rojas-Rueda, D.; Morales-Zamora, E. Built Environment, Transport, and COVID-19: A Review. Curr. Environ. Health Rep. 2021, 8, 138–145. [Google Scholar] [CrossRef]
- Combs, T.S.; Pardo, C.F. Shifting Streets COVID-19 Mobility Data: Findings from a Global Dataset and a Research Agenda for Transport Planning and Policy Shifting Streets COVID-19 Mobility Data. Transp. Res. Interdiscip. Perspect. 2021, 9, 100322. [Google Scholar] [CrossRef]
- Consorcio Regional de Transportes de Madrid Encuesta de Movilidad de la Comunidad de Madrid 2018. Documento Síntesis. Available online: https://www.crtm.es/media/712934/edm18_sintesis.pdf (accessed on 14 September 2021).


| Counter Name | Street | Building No. | Description | Pavement Width (m) |
|---|---|---|---|---|
| PERM_PEA02_PM01 | Calle Fuencarral | 22 | Pedestrian street | 9.5 |
| PERM_PEA03_PM01 | Calle San Bernardo | 36 | Even numbers | 3 |
| PERM_PEA04_PM01 | Calle Hortaleza | 18 | Even numbers | 3.6 |
| PERM_PEA05_PM01 | Carrera de San Jerónimo | 6 | Even numbers | 3 |
| PERM_PEA06_PM01 | Calle Atocha | 95 | Odd numbers | 5 |
| PERM_PEA07_PM01 | Calle Mayor | 13 | Odd numbers | 4.5 |
| PERM_PEA08_PM01 | Gran Vía | 34 | Even numbers | 14 |
| PERM_PEA08_PM02 | Gran Vía | 33 | Odd numbers | 14 |
| PERM_PEA09_PM01 | Paseo de Recoletos | 22 | Even numbers | 2 |
| PERM_PEA10_PM01 | Calle Génova | 12 | Even numbers | 4.5 |
| PERM_PEA11_PM01 | Calle Huertas | 29 | Pedestrian street | 7.5 |
| PERM_PEA12_PM01 | Madrid Río 1 | 1 | Pedestrian street | 7.5 |
| PERM_PEA13_PM01 | Calle Princesa | 1 | Odd numbers | 5 |
| PERM_PEA14_PM01 | Alberto Aguilera | 56 | Even numbers | 3.6 |
| PERM_PEA15_PM01 | Calle Toledo | 23 | Odd numbers | 6.3 |
| PERM_PEA16_PM01 | Plaza del Emperador Carlos V | 11 | Odd numbers | 6.5 |
| PERM_PEA17_PM01 | Ronda de Valencia | 16 | Even numbers | 3.6 |
| PERM_PEA18_PM01 | Calle Alcalá | 34 | Even numbers | 4.5 |
| PERM_PEA19_PM01 | Calle Bailén | 10 | Even numbers | 5.6 |
| Level of Service | PLOS (HCM, 2000) | P-PLOS | ||||
|---|---|---|---|---|---|---|
| Space (m2/p) | Flow Rate (p/min/m) | Speed (m/min) | Space (m2/p) | Flow Rate (p/min/m) | Speed (m/min) | |
| A | >5.6 | <16.40 | >77.72 | >8.8 | <7.6 | >83.3 |
| B | 5.6–3.7 | 16.40–22.97 | 77.72– 76.26 | 8.8–8.2 | 7.6–8.1 | 83.3–75.0 |
| C | 3.7–2.2 | 22.97–32.81 | 76.26– 73.15 | 8.2–7.5 | 8.1–8.9 | 75.0–66.7 |
| D | 2.2–1.4 | 32.81– 49.21 | 73.15–68.58 | 7.5–6.8 | 8.9–9.8 | 66.7–58.3 |
| E | 1.4–0.75 | 49.21–75.46 | 68.58– 45.72 | 6.8–5.5 | 9.8–12.1 | 58.3–41.67 |
| F | <0.75 | >75.46 | <45.72 | <5.5 | >12.1 | <41.67 |
Publisher’s Note: MDPI stays neutral with regard to jurisdictional claims in published maps and institutional affiliations. |
© 2021 by the authors. Licensee MDPI, Basel, Switzerland. This article is an open access article distributed under the terms and conditions of the Creative Commons Attribution (CC BY) license (https://creativecommons.org/licenses/by/4.0/).
Share and Cite
Talavera-Garcia, R.; Pérez-Campaña, R. Applying a Pedestrian Level of Service in the Context of Social Distancing: The Case of the City of Madrid. Int. J. Environ. Res. Public Health 2021, 18, 11037. https://doi.org/10.3390/ijerph182111037
Talavera-Garcia R, Pérez-Campaña R. Applying a Pedestrian Level of Service in the Context of Social Distancing: The Case of the City of Madrid. International Journal of Environmental Research and Public Health. 2021; 18(21):11037. https://doi.org/10.3390/ijerph182111037
Chicago/Turabian StyleTalavera-Garcia, Ruben, and Rocío Pérez-Campaña. 2021. "Applying a Pedestrian Level of Service in the Context of Social Distancing: The Case of the City of Madrid" International Journal of Environmental Research and Public Health 18, no. 21: 11037. https://doi.org/10.3390/ijerph182111037
APA StyleTalavera-Garcia, R., & Pérez-Campaña, R. (2021). Applying a Pedestrian Level of Service in the Context of Social Distancing: The Case of the City of Madrid. International Journal of Environmental Research and Public Health, 18(21), 11037. https://doi.org/10.3390/ijerph182111037