
Influencing Factors of Environmental Risk Perception during the COVID-19 Epidemic in China

 , ,
, ,
Abstract
:1. Introduction
2. Research Design and Model Method
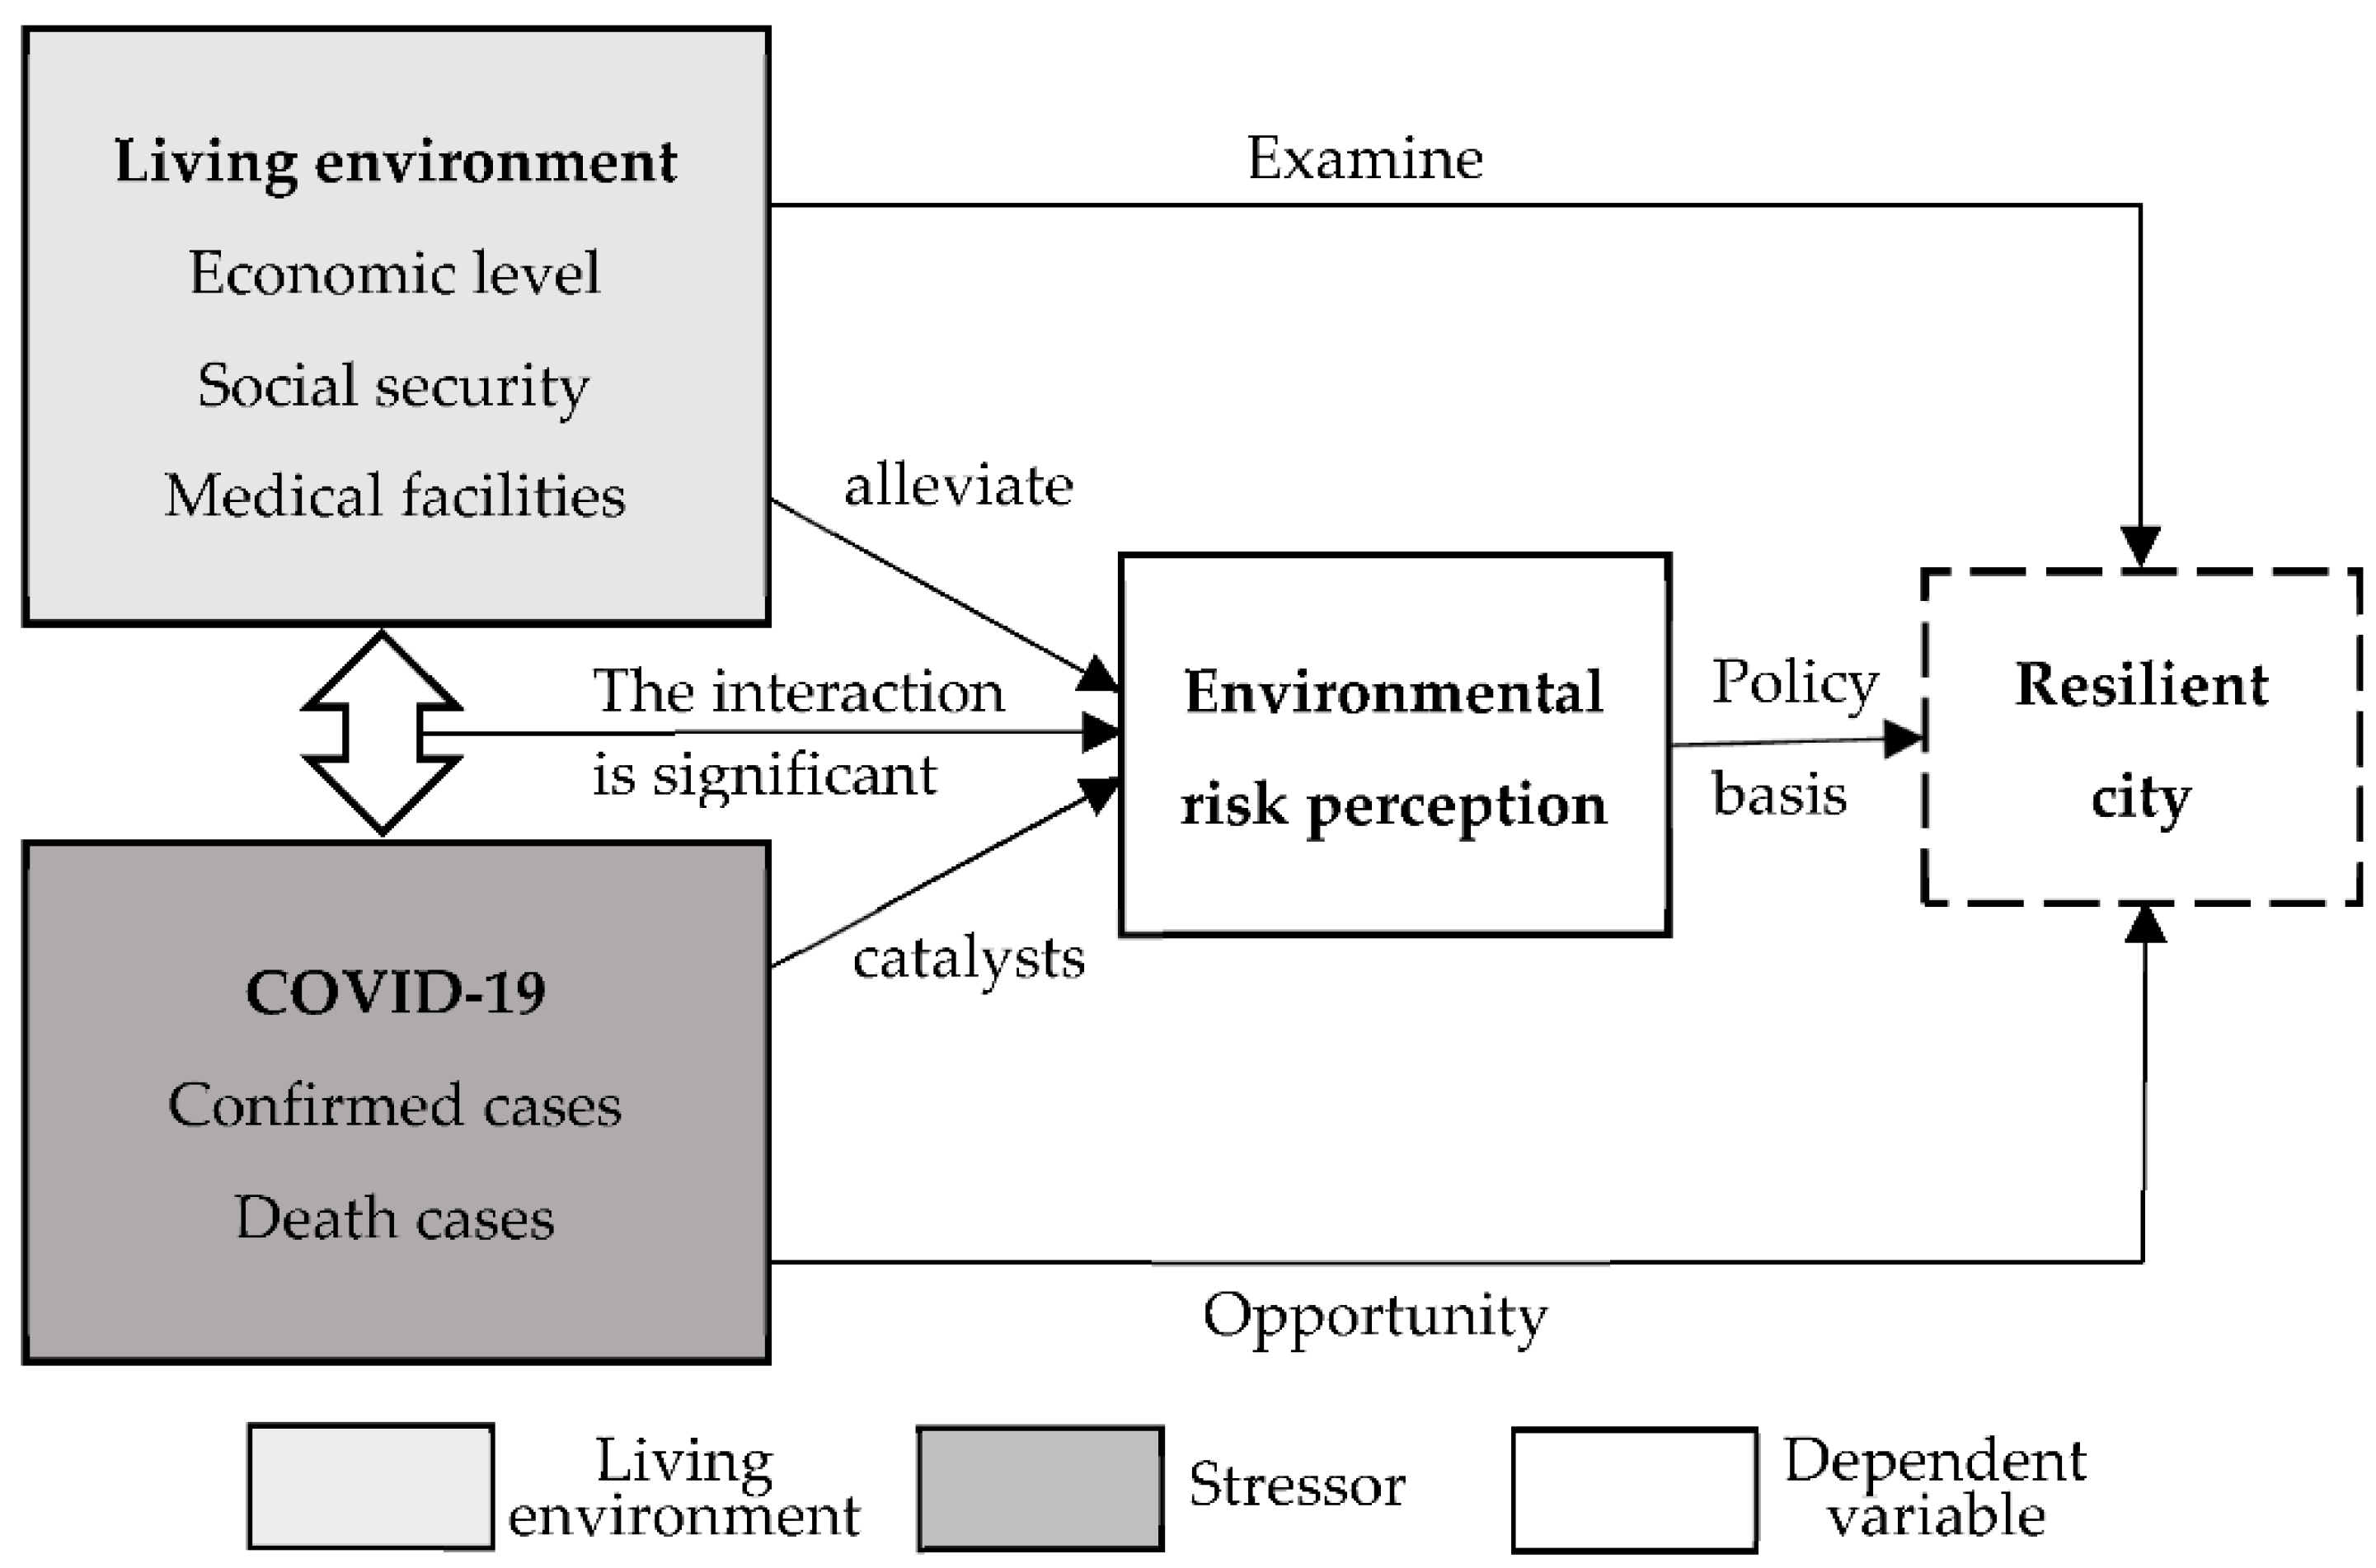
2.1. Research Design
2.2. Research Hypothesis
3. Data and Methods
3.1. Data
3.1.1. Weibo Comments Data
3.1.2. Statistical Data
3.2. Variable Selection
3.2.1. Dependent Variable
3.2.2. Independent Variable
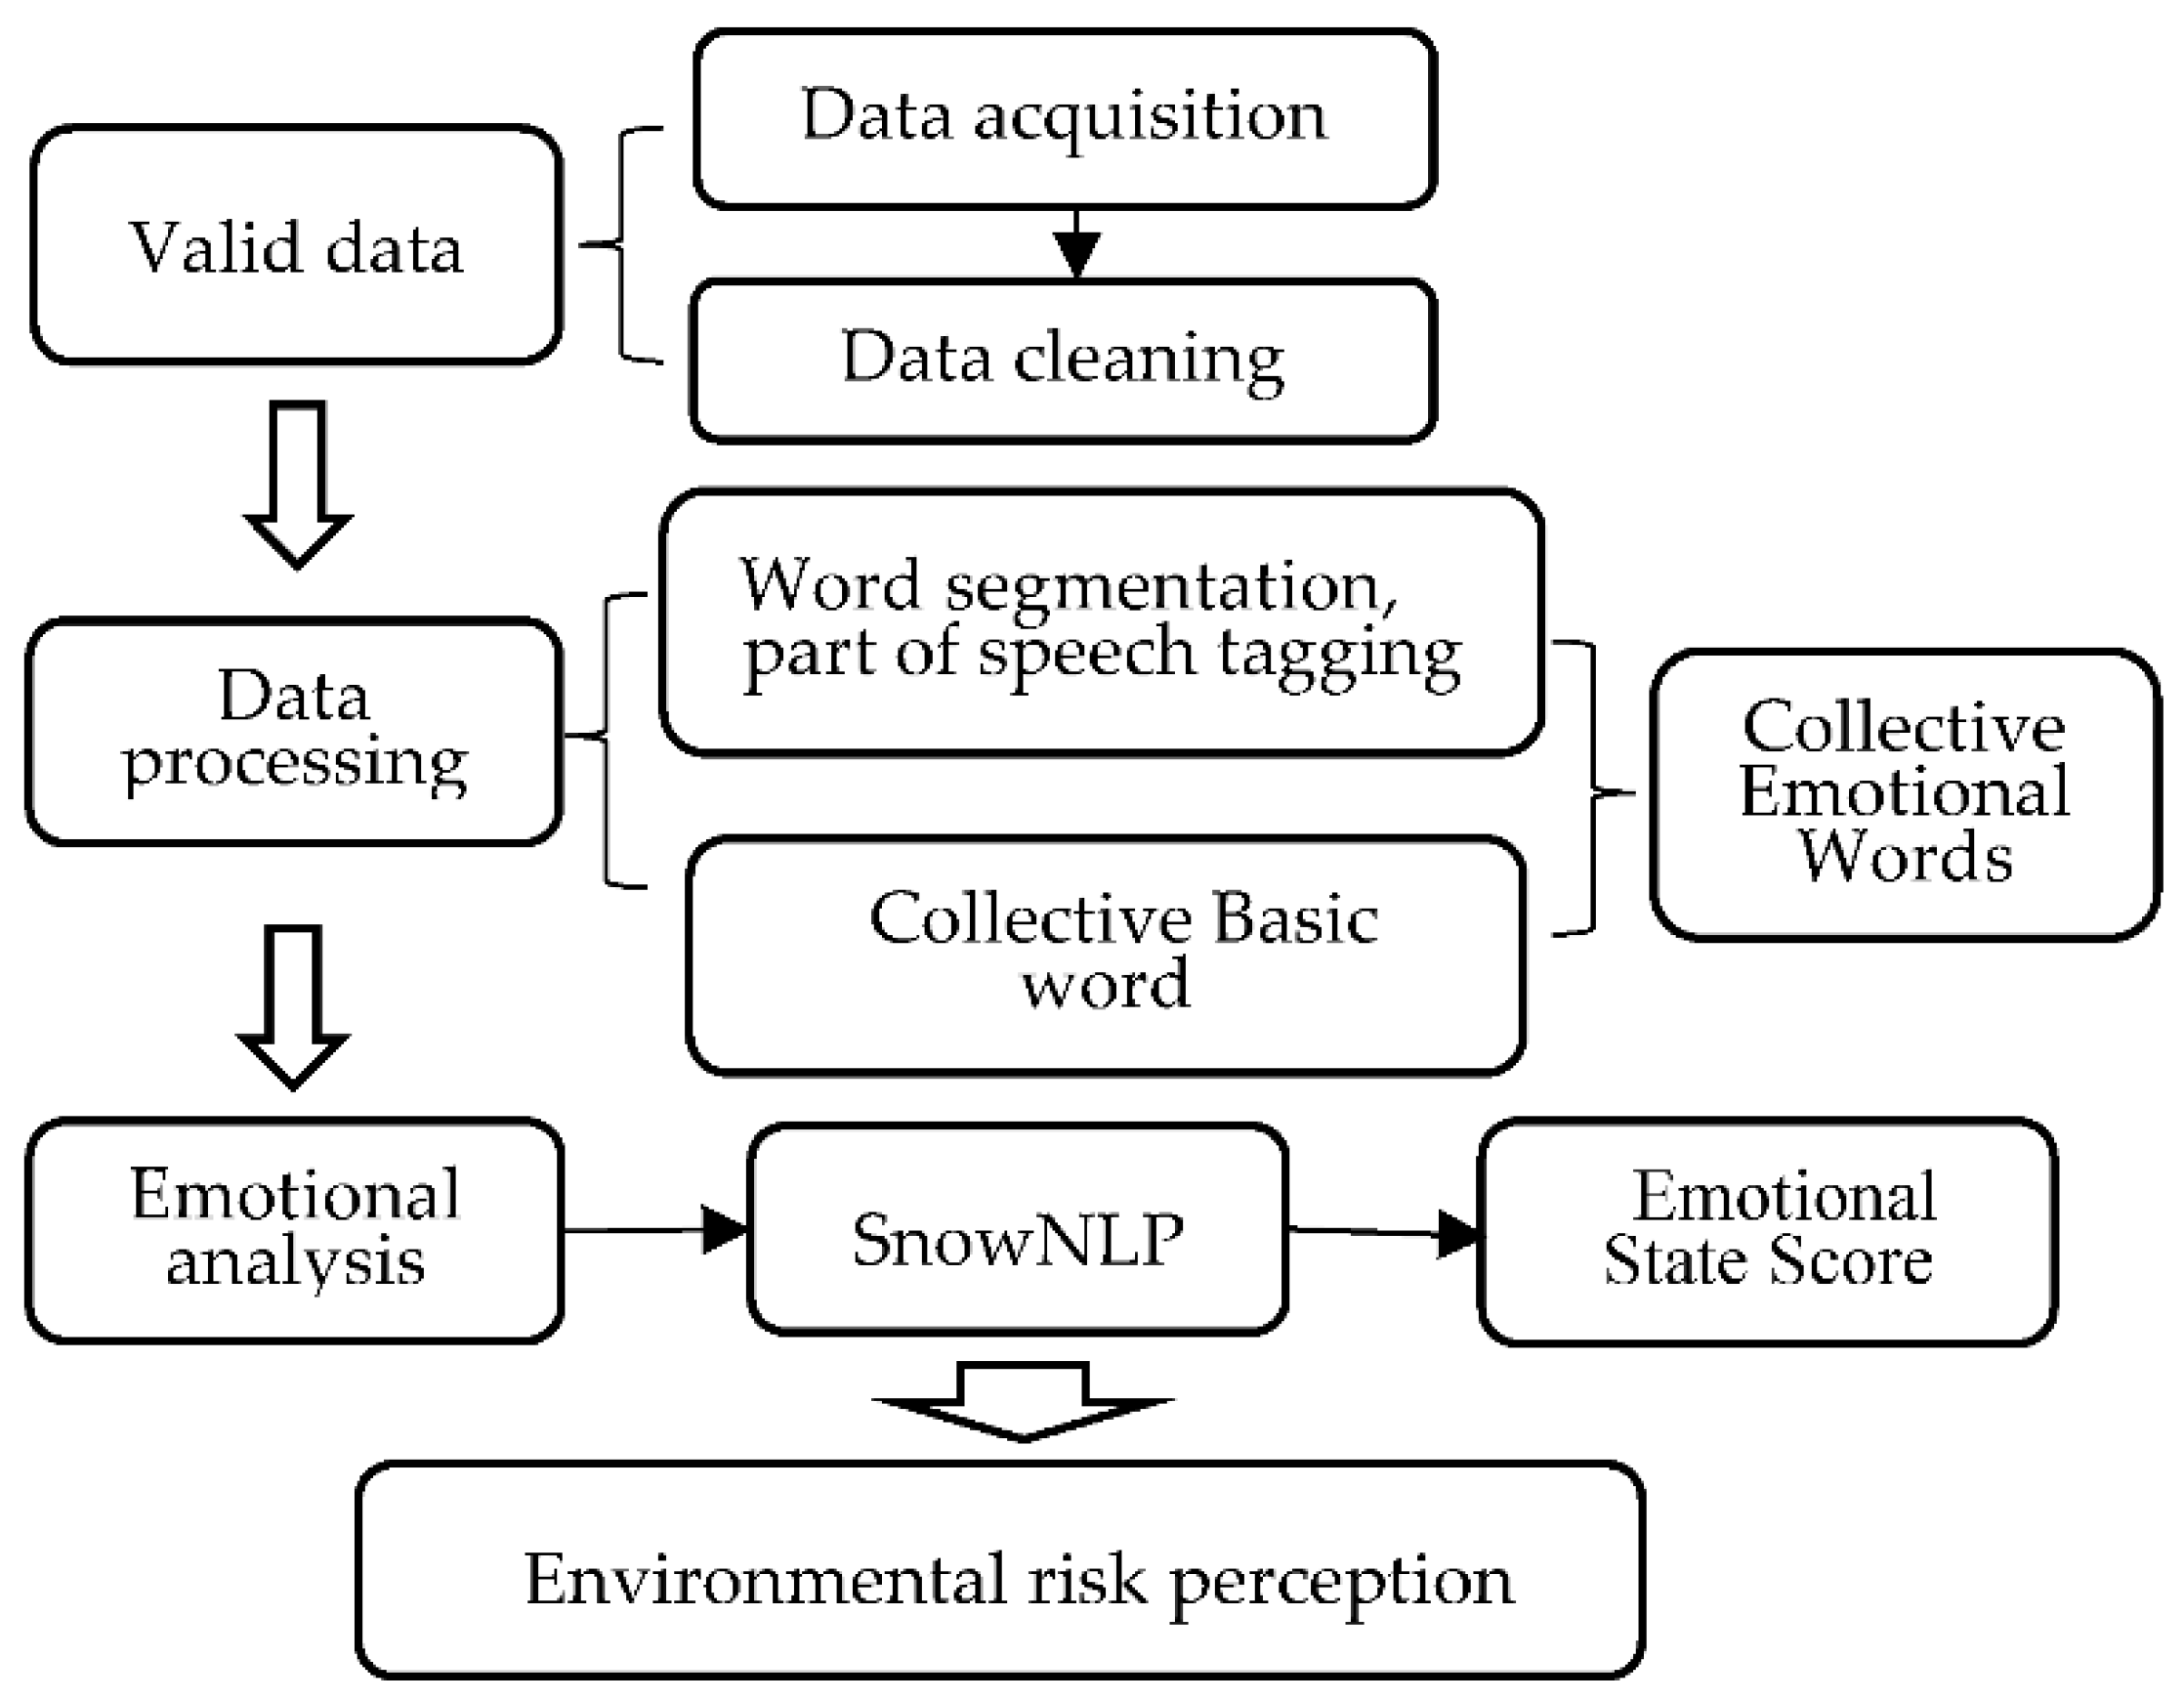
3.3. Methods
3.3.1. Exploratory Spatial Data Analysis
3.3.2. Order Logistic Regression Model
4. Results Analysis
4.1. Characteristic Analysis
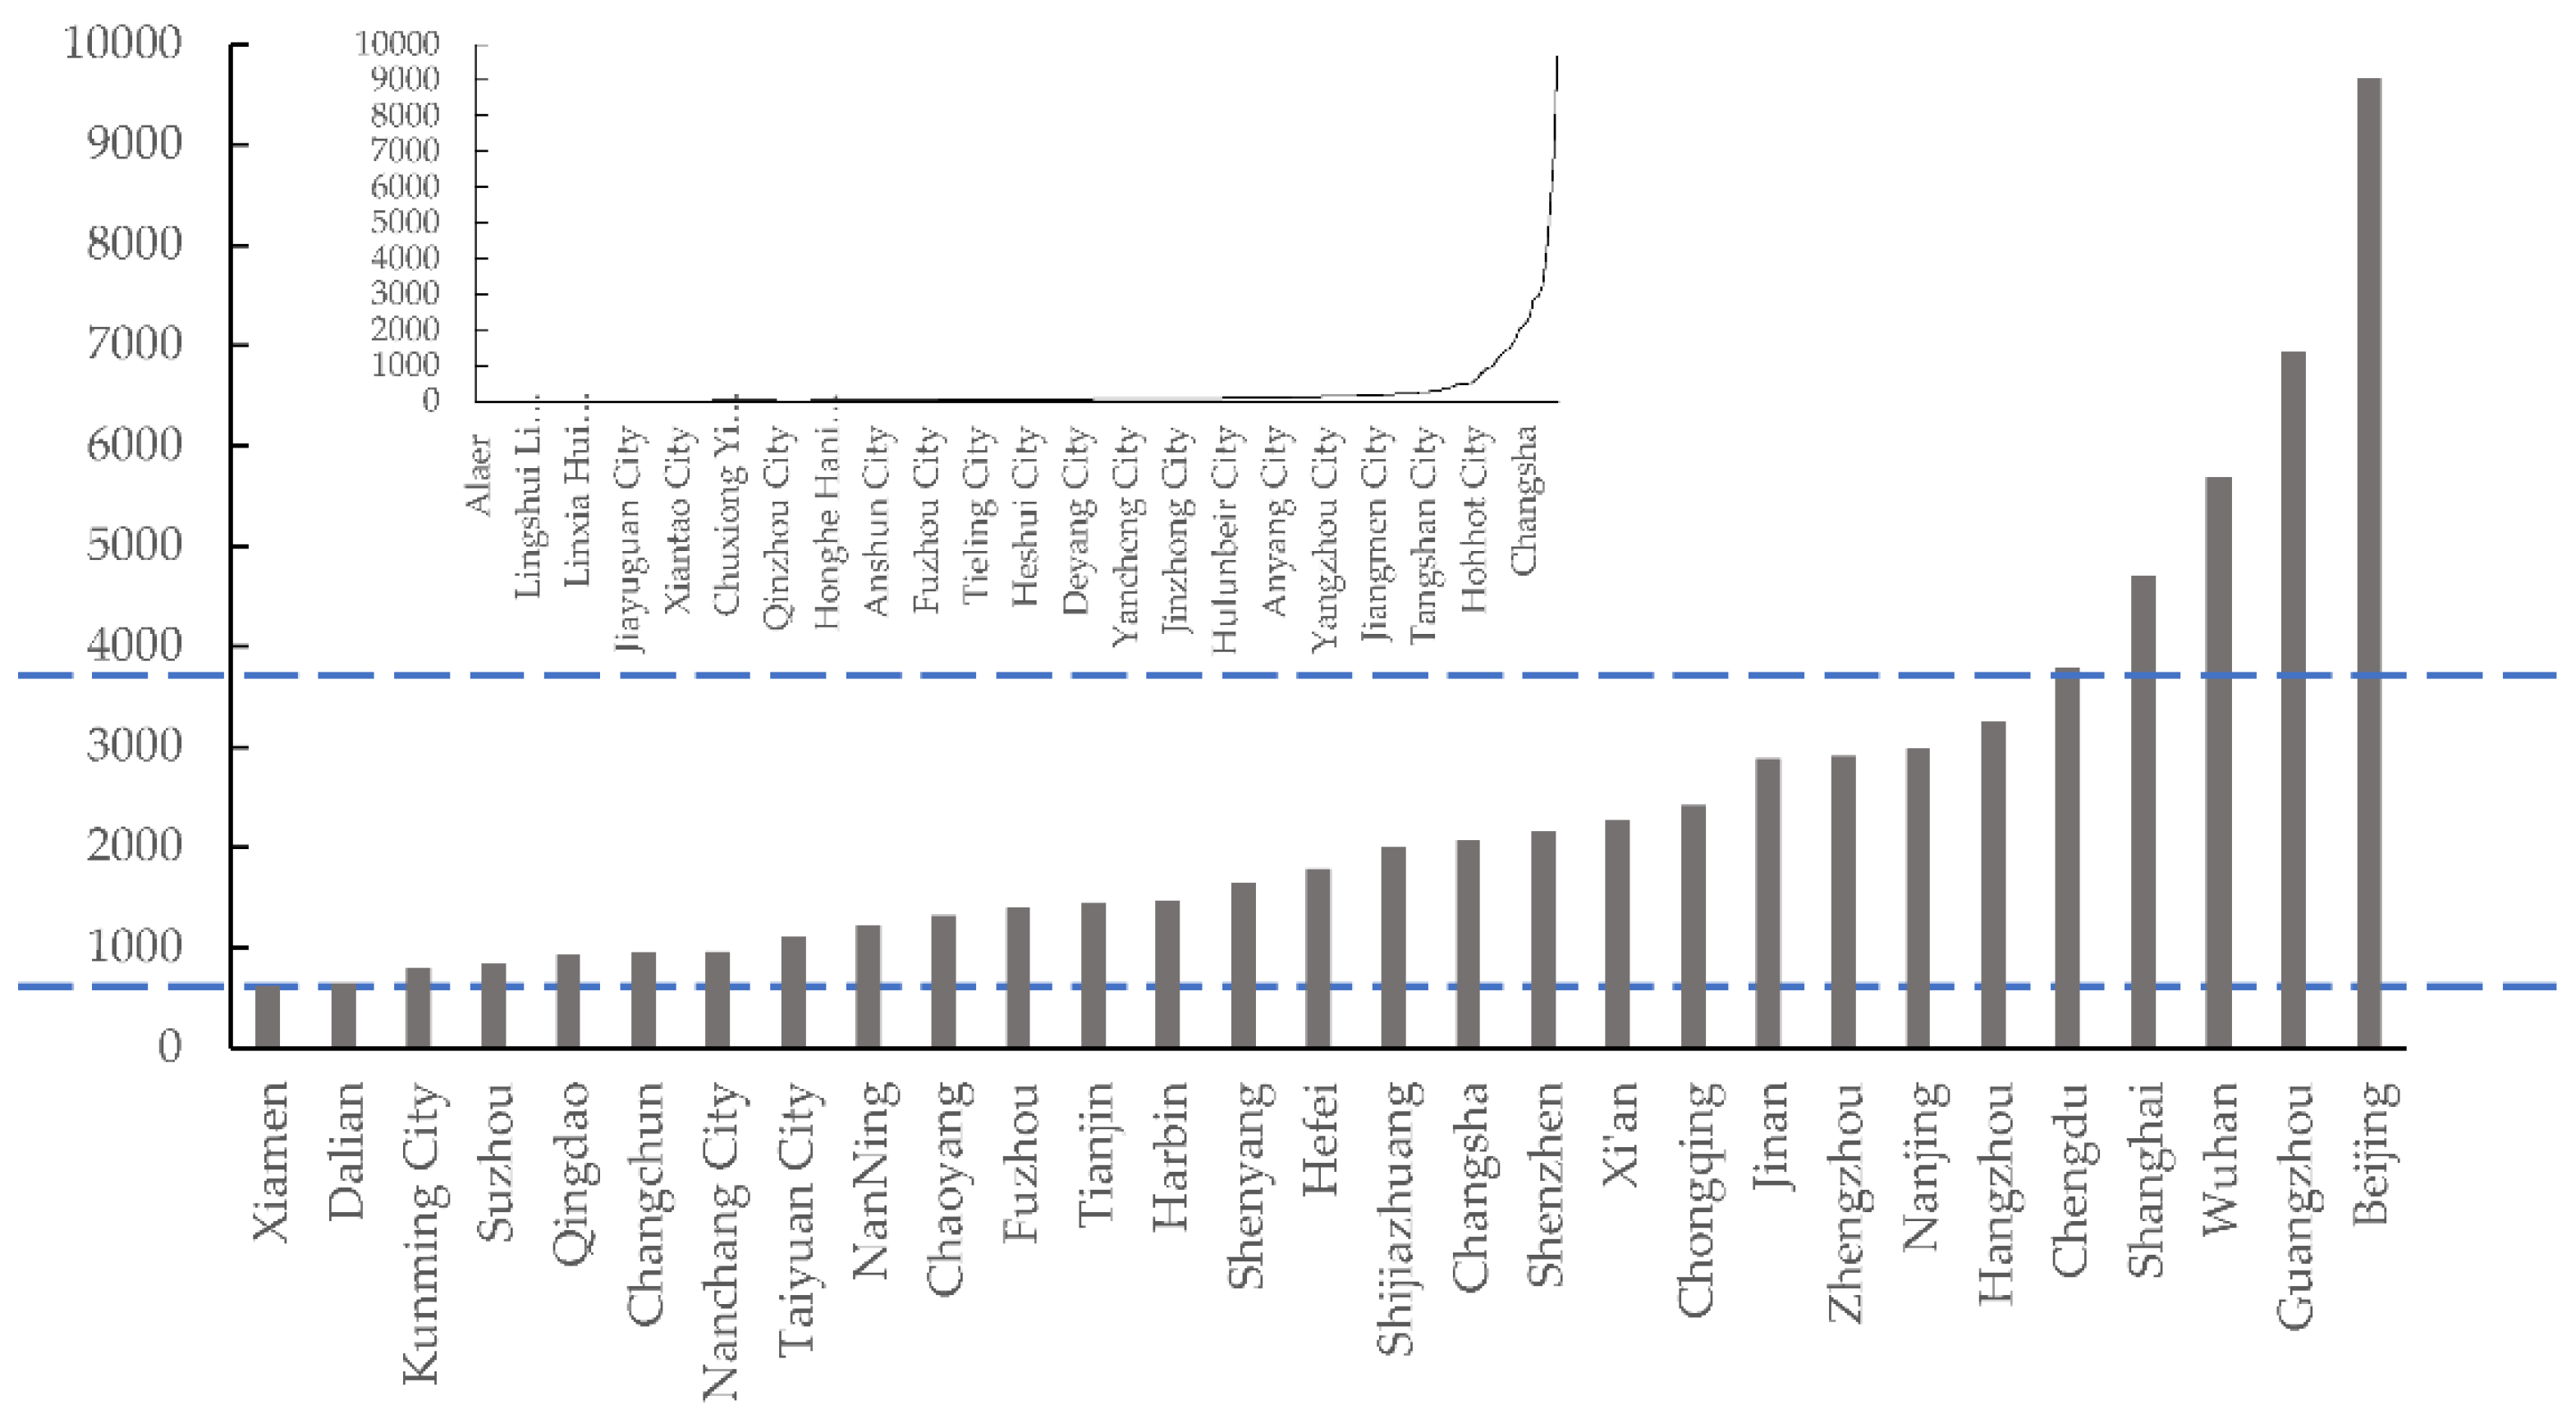
4.1.1. Structural Features
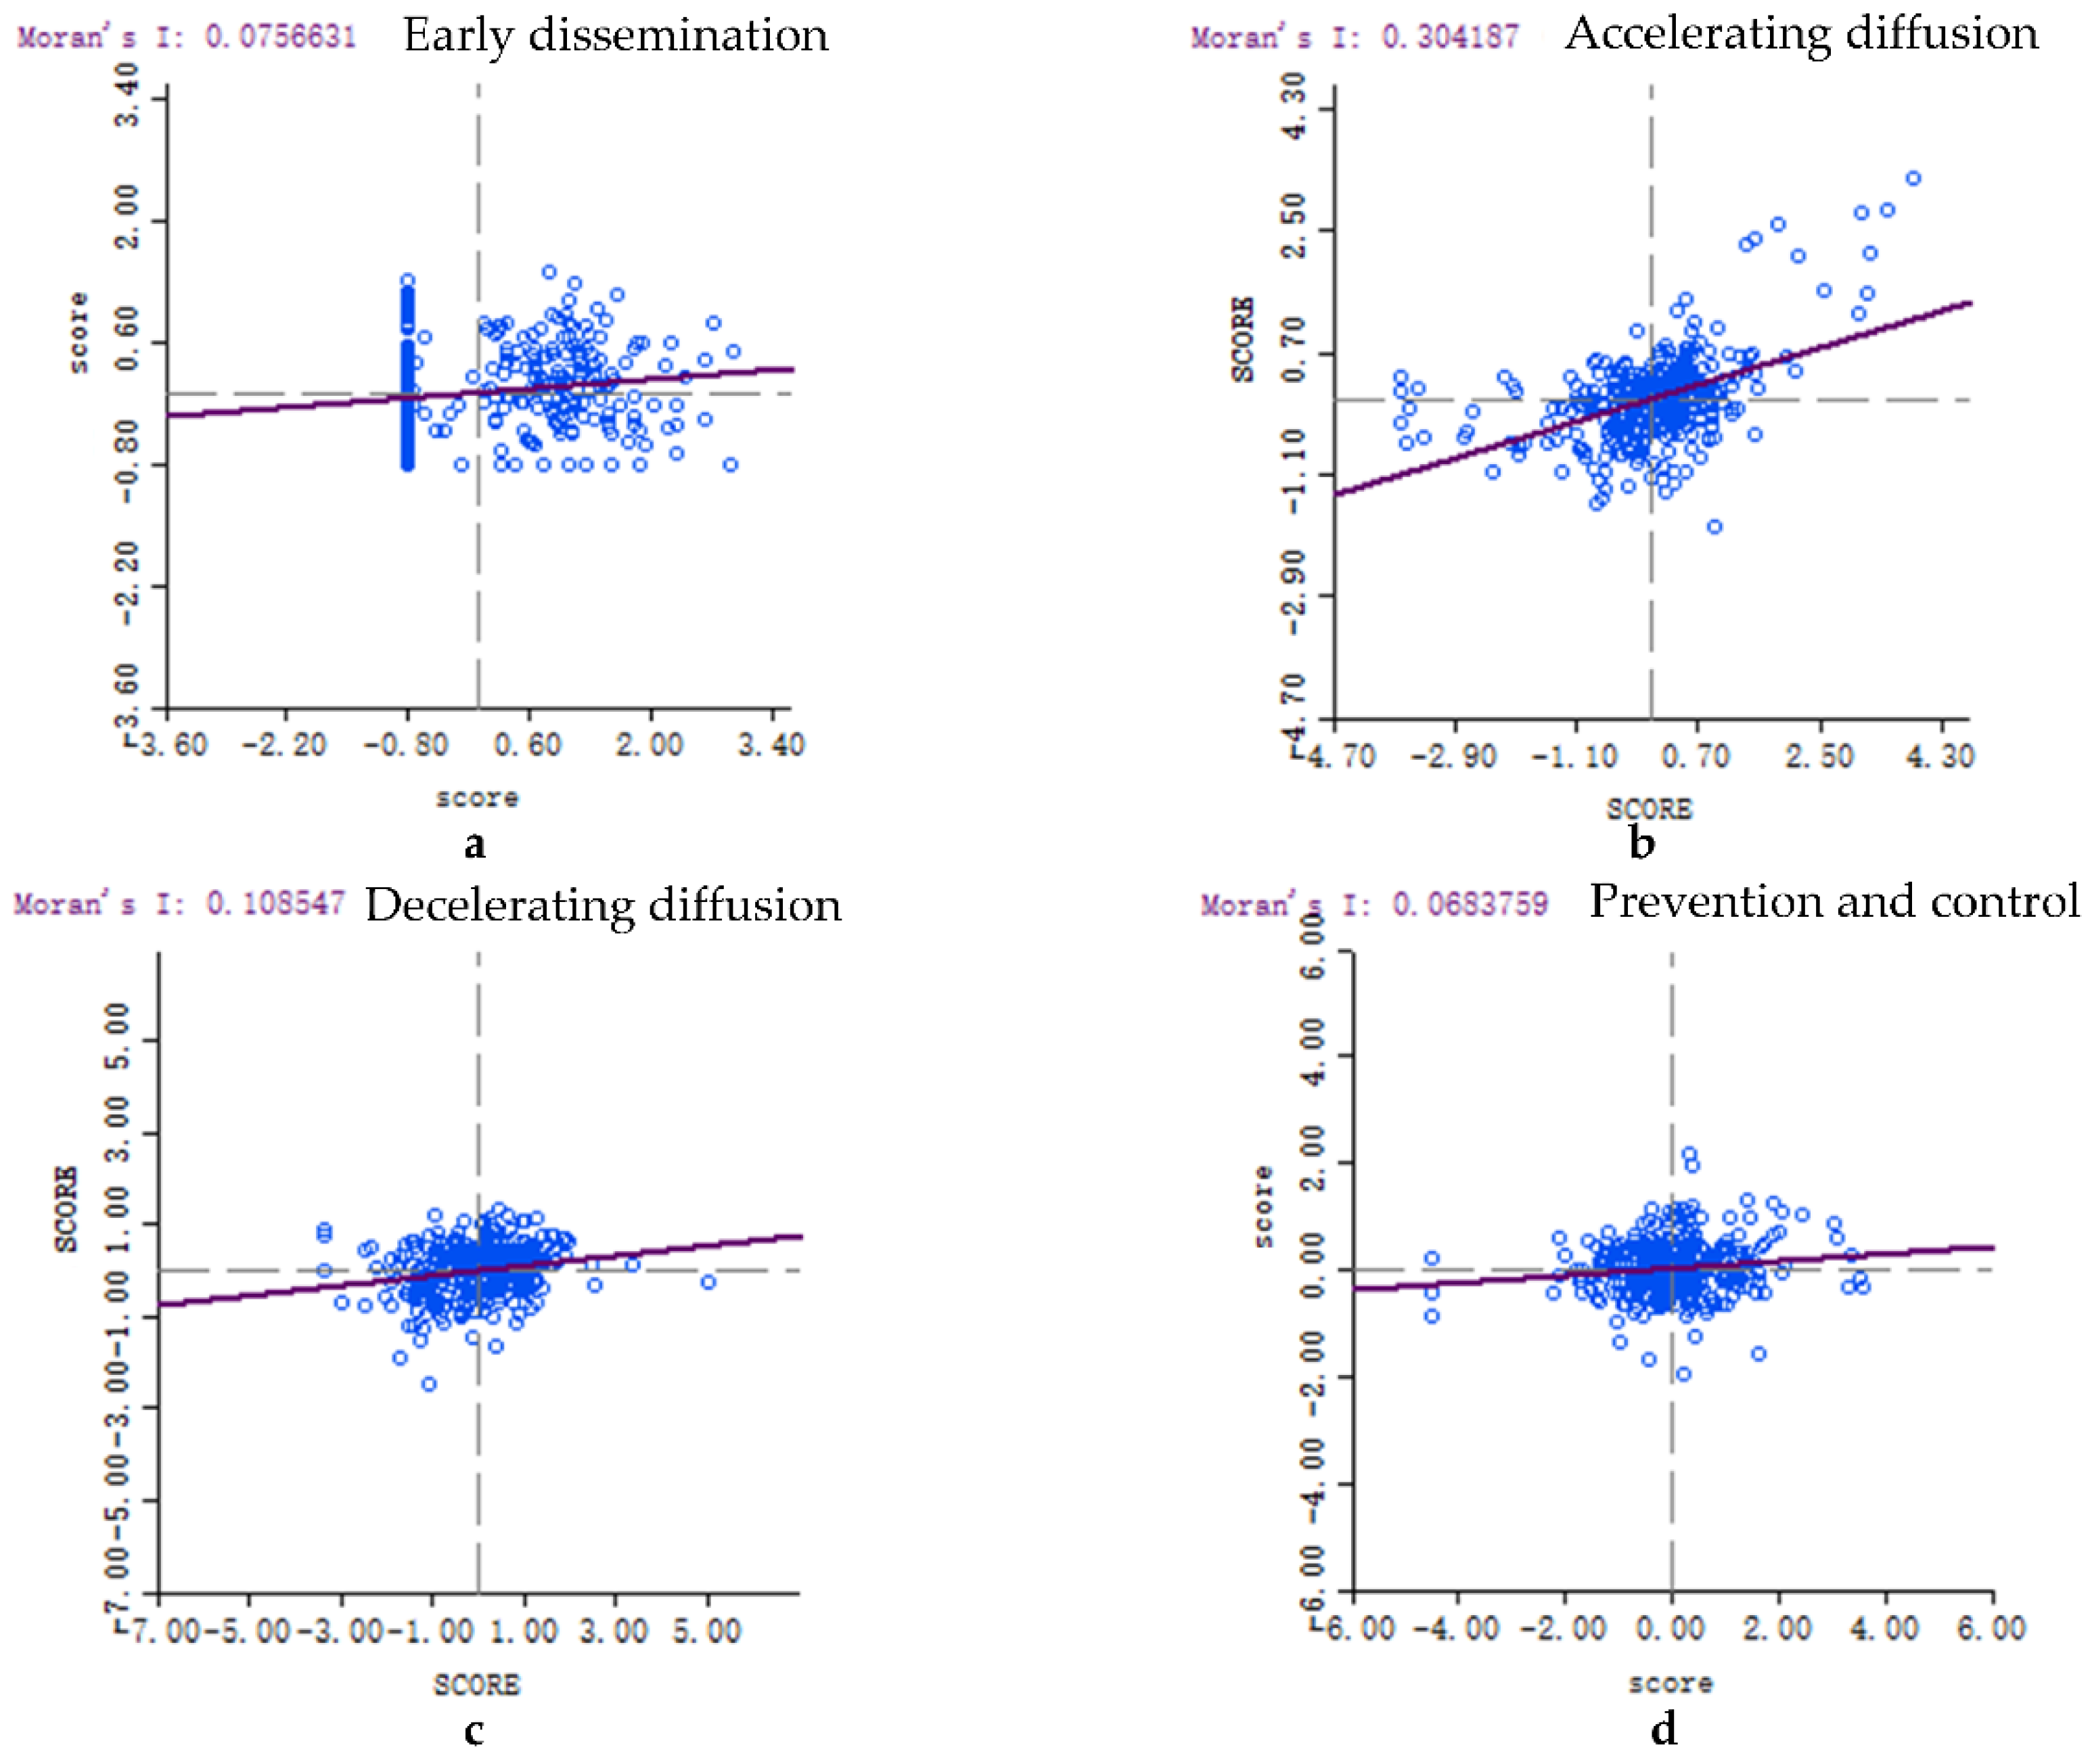
4.1.2. Spatial-Temporal Structure Characteristics
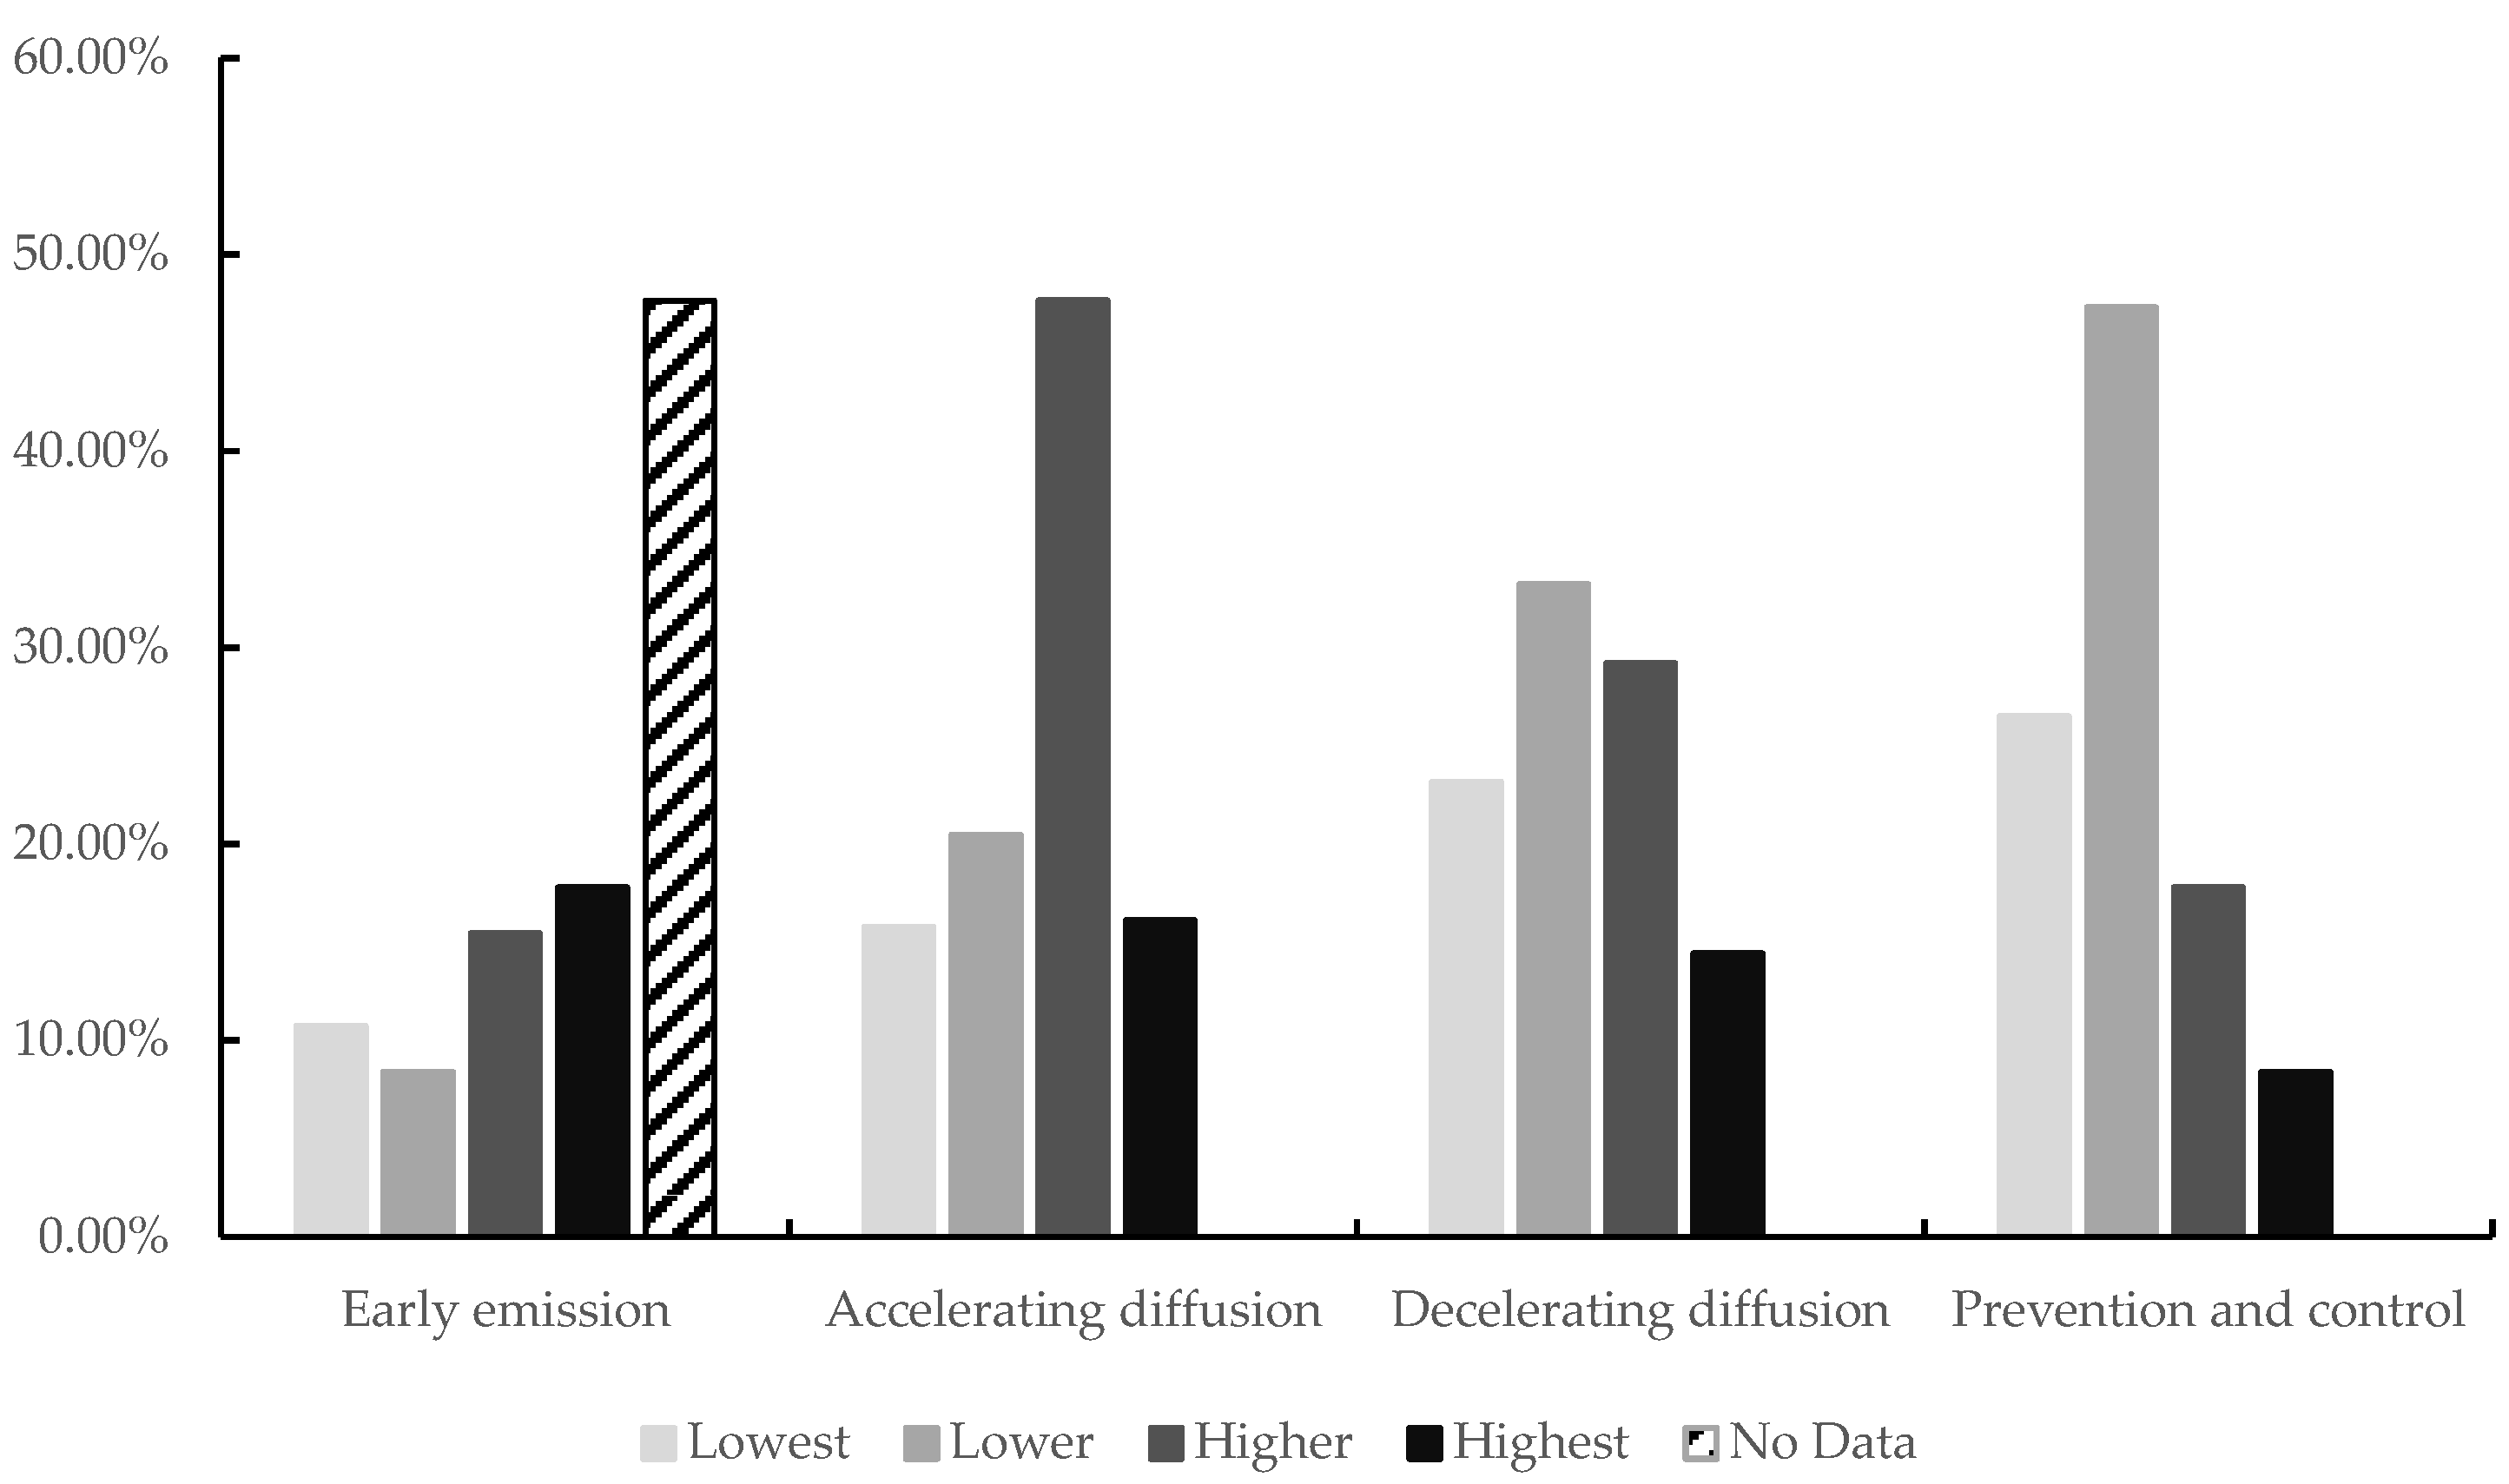
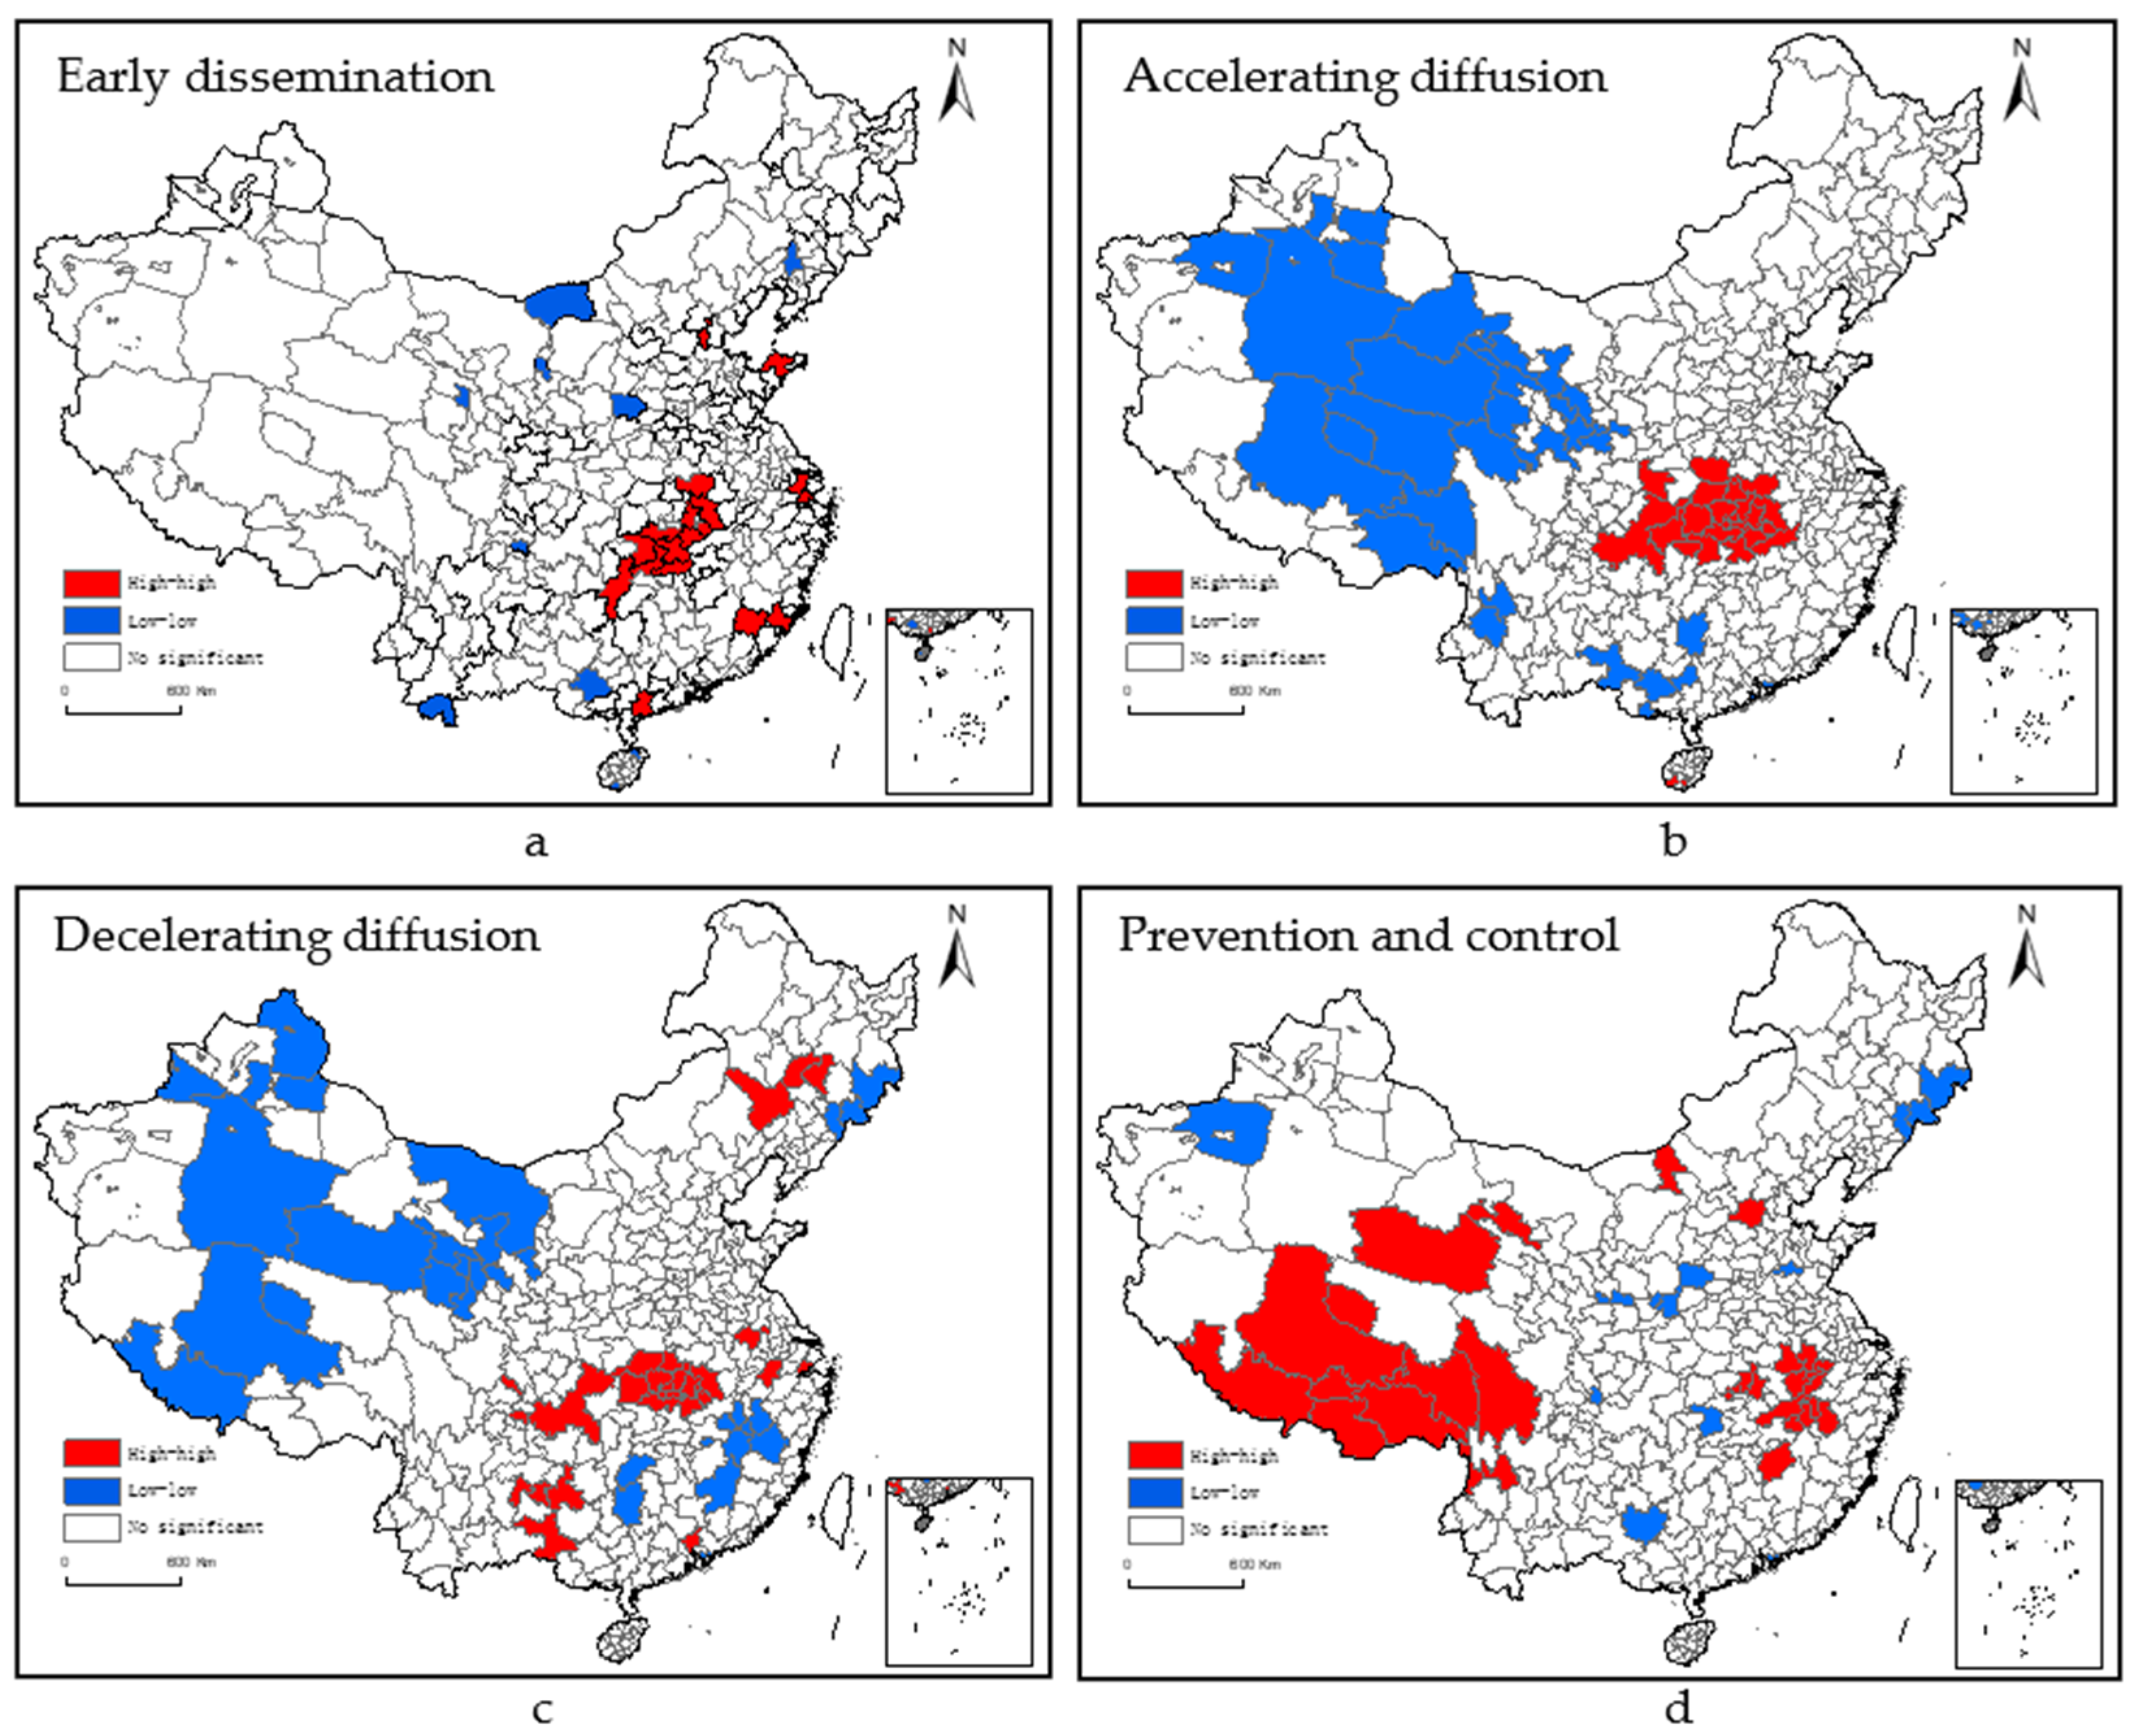
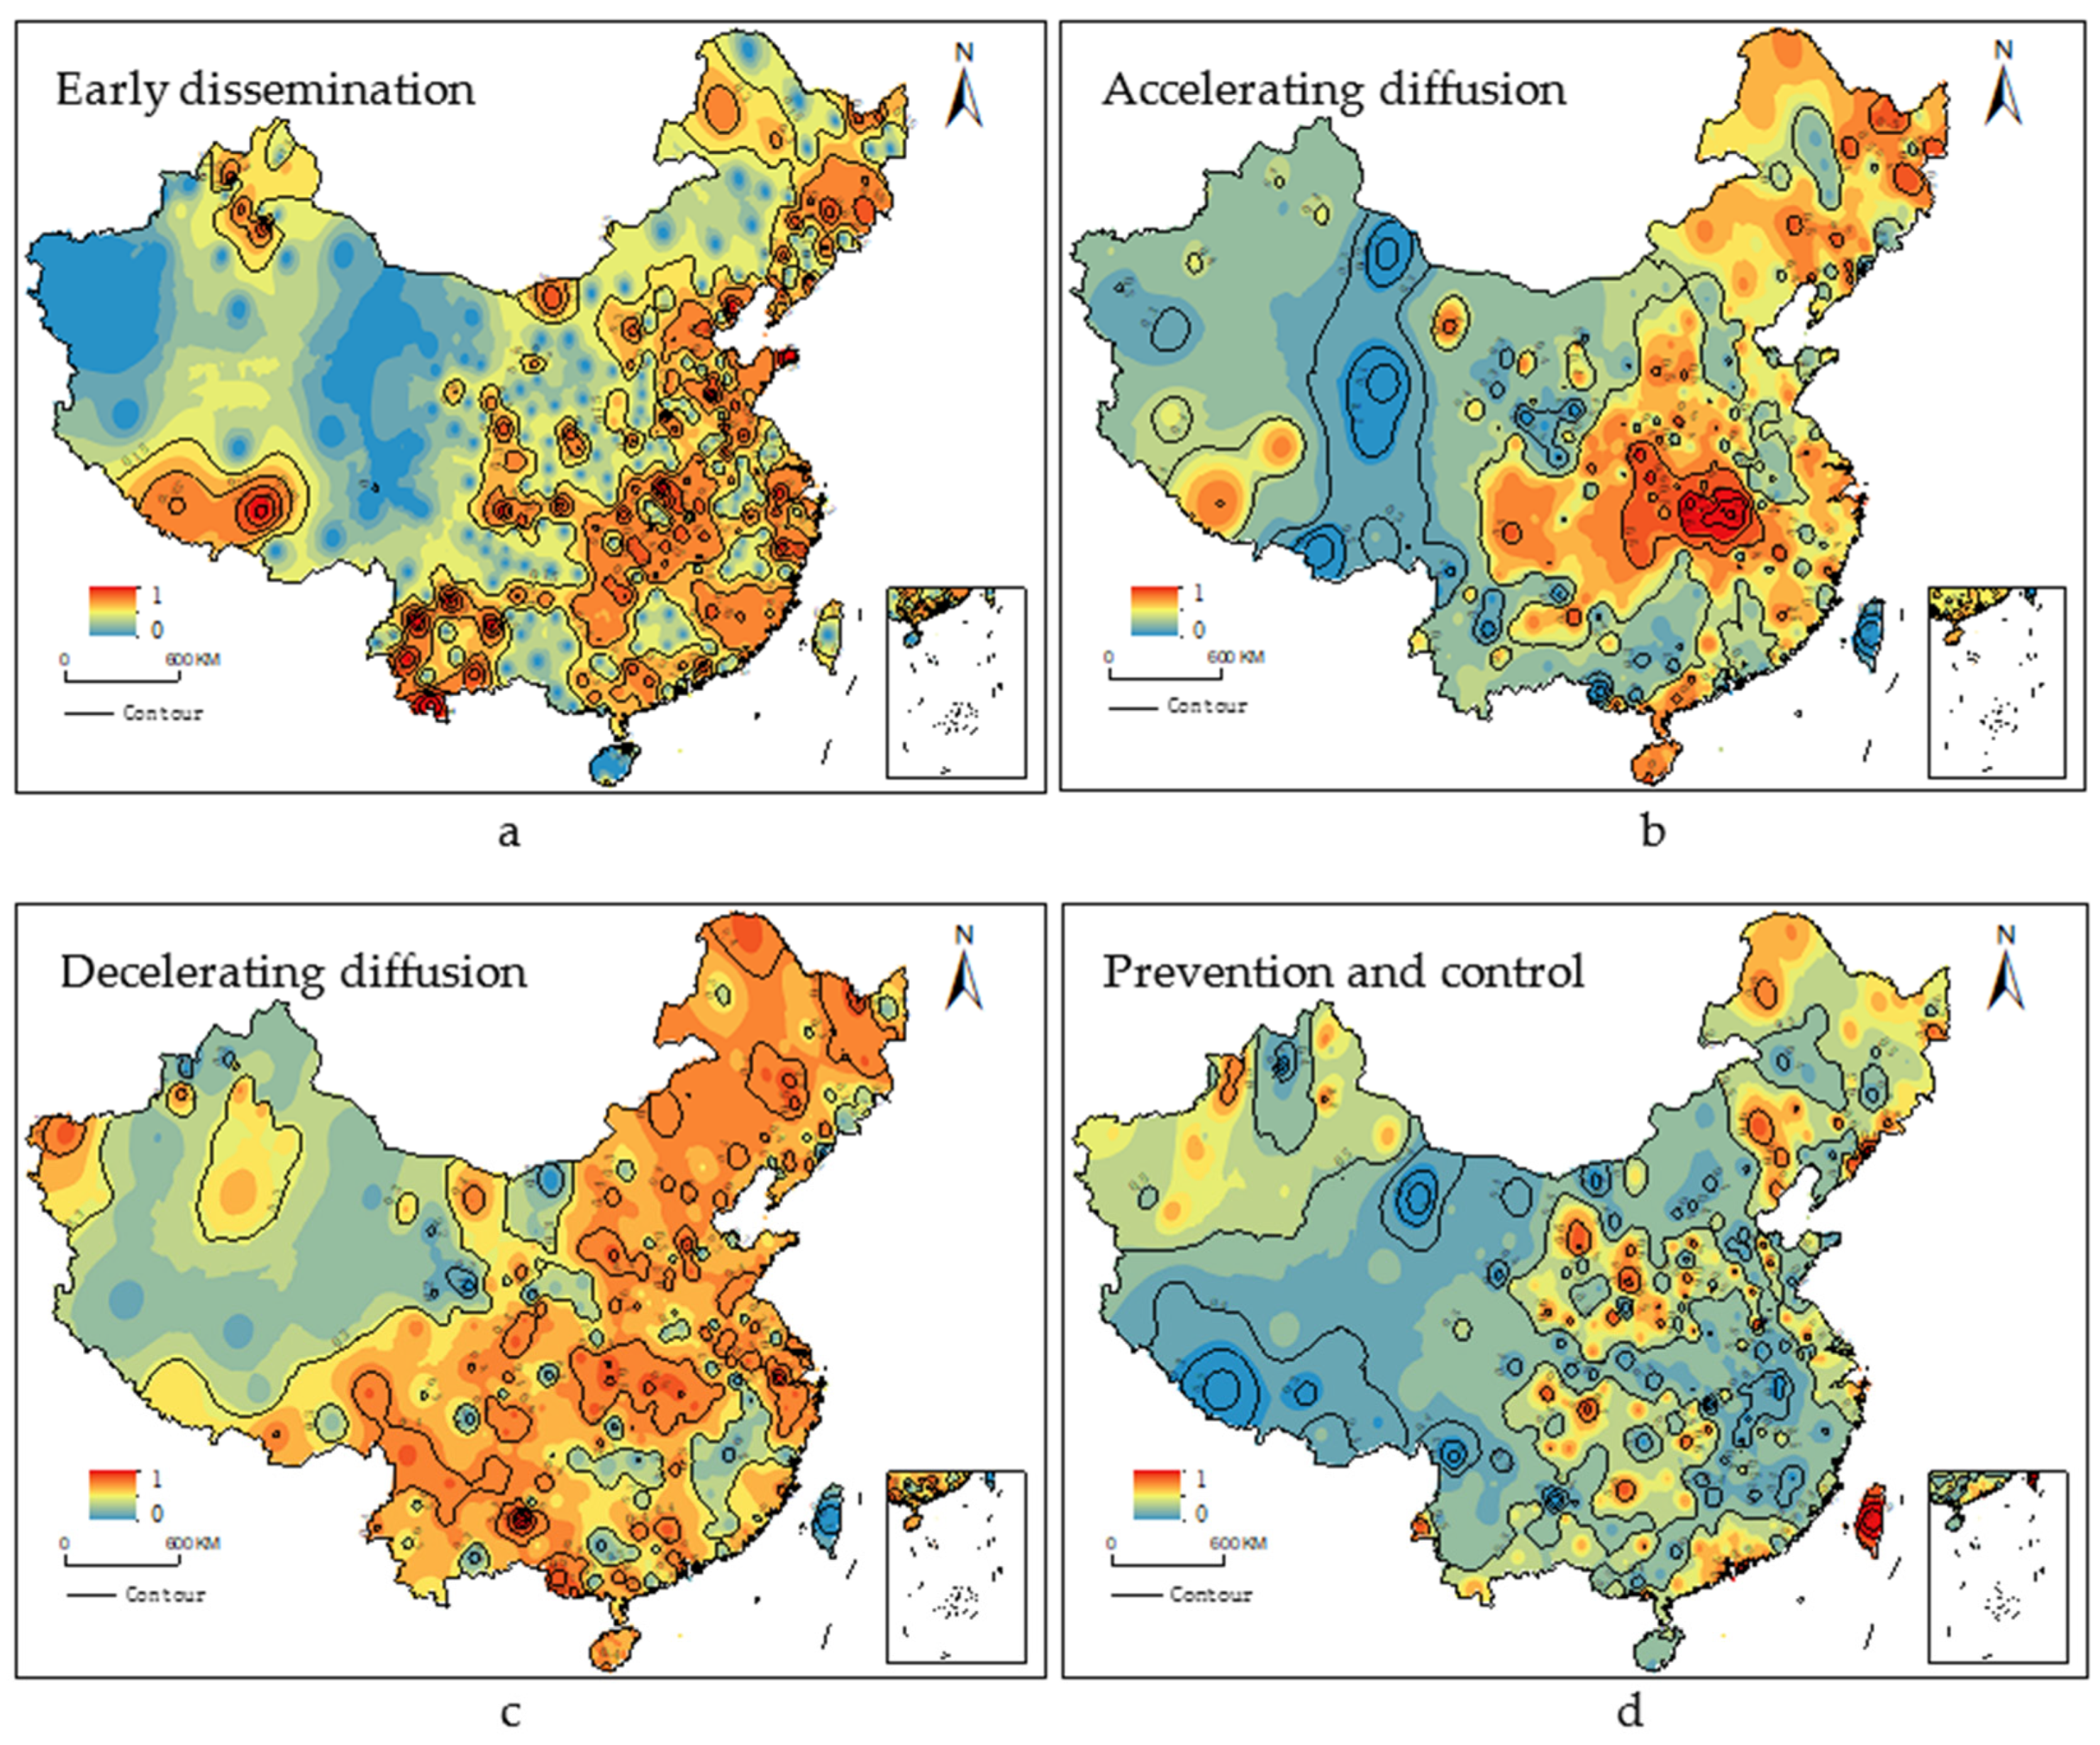
4.1.3. Spatial-Temporal Distribution Characteristics
4.2. Direct Influence
4.2.1. The Stage of Early Dissemination
4.2.2. The Stage of Accelerating Diffusion
4.2.3. The Stage of Decelerating Diffusion
4.2.4. The Stage of Prevention and Control
4.3. Interaction Influence
5. Discussion
6. Conclusions
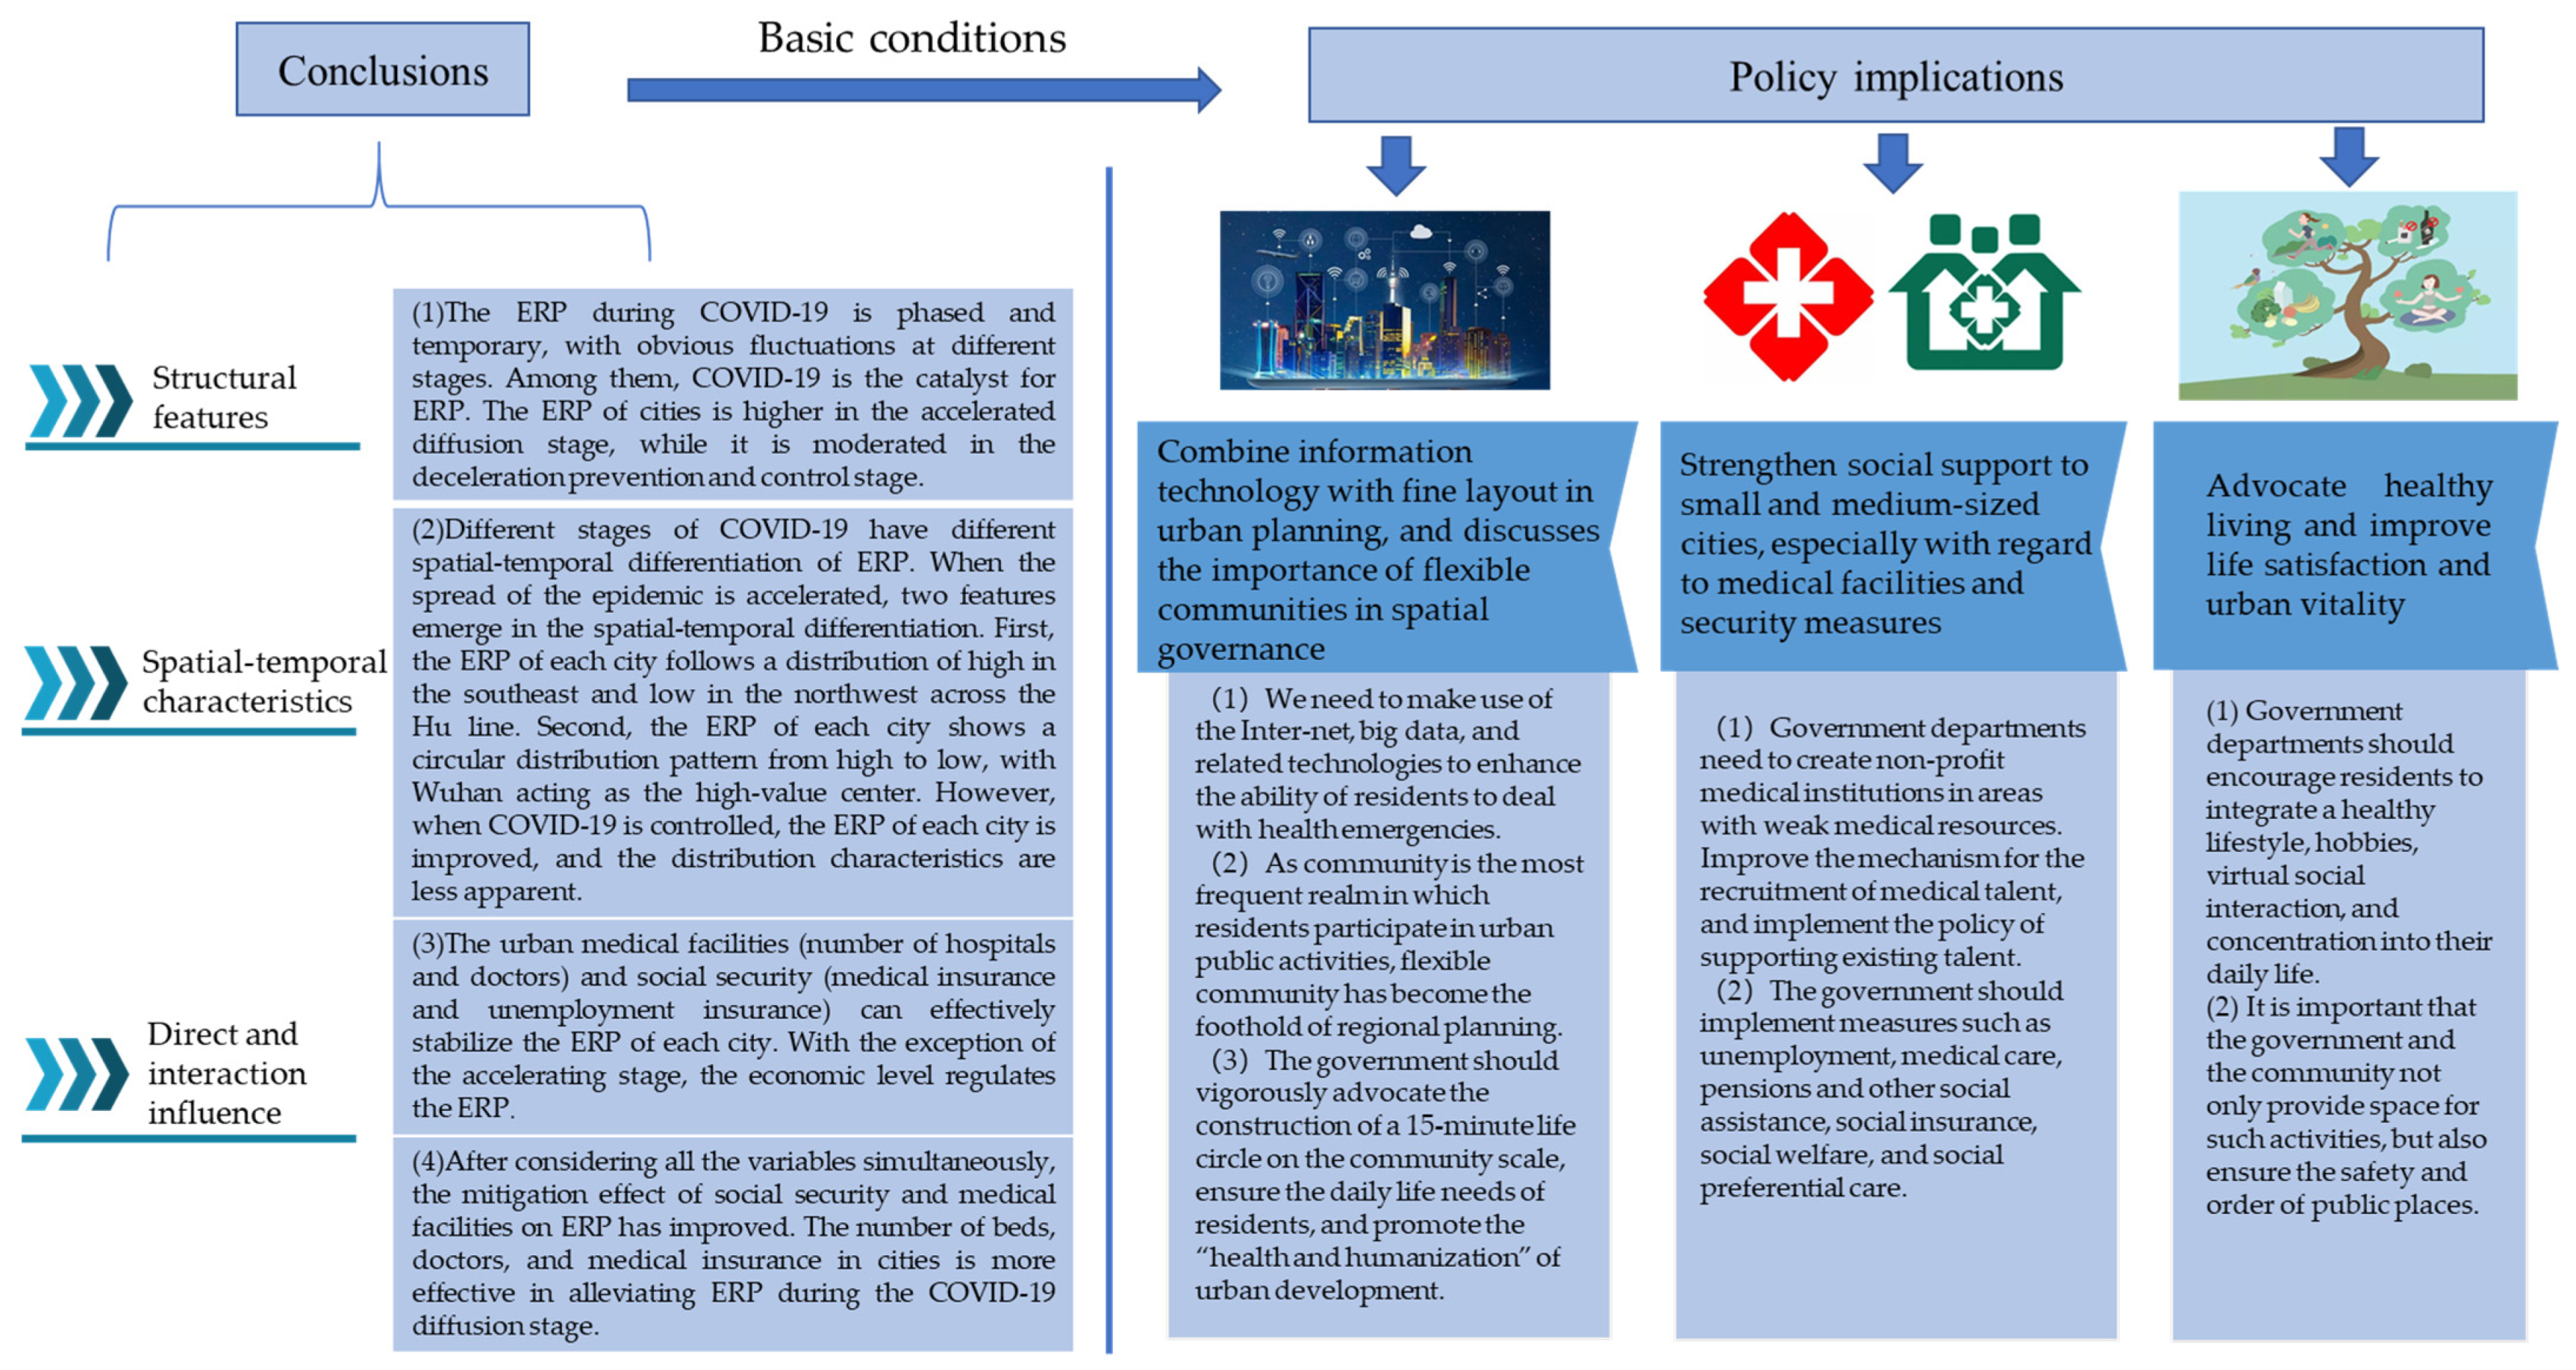
6.1. Conclusions
6.2. Policy Implications
Author Contributions
Funding
Institutional Review Board Statement
Informed Consent Statement
Data Availability Statement
Acknowledgments
Conflicts of Interest
References
- Liu, W.D. The impacts of COVID-19 pandemic on the development of economic globalization. Geogr. Res. 2020, 39, 1439–1449. [Google Scholar] [CrossRef]
- WHO (World Health Organization). A Timeline of WHO’s Response to the COVID-19 Outbreak. Available online: https://www.who.int/zh/news/item/29-06-2020-covidtimeline (accessed on 5 December 2020).
- Dlamini, W.M.; Dlamini, S.N.; Mabaso, S.D.; Simelane, S.P. Spatial risk assessment of an emerging pandemic under data scarcity: A case of COVID-19 in Eswatini. Appl. Geogr. 2020, 125, 102358–102367. [Google Scholar] [CrossRef]
- Chakraborty, I.; Maity, P. COVID-19 outbreak: Migration, effects on society, global environment and prevention. Sci. Total Environ. 2020, 728, 138882–138888. [Google Scholar] [CrossRef] [PubMed]
- Li, G.; Wang, J.B.; Xu, T.T.; Gao, X.; Jin, A.N.; Yu, Y. Spatio-temporal evolution process and integrated measures for prevention and control of COVID-19 epidemic in China. Acta Geogr. Sin. 2020, 75, 2475–2489. [Google Scholar] [CrossRef]
- Das, S.; Dutta, A. Characterizing public emotions and sentiments in COVID-19 environment: A case study of India. J. Hum. Behav. Soc. Environ. 2021, 31, 154–167. [Google Scholar] [CrossRef]
- Wang, J.L.; Zhang, M.; Han, X.H.; Wang, X.J. Spatio-temporal evolution and regional differences of the public opinion on the prevention and control of COVID-19 epidemic in China. Acta Geogr. Sin. 2020, 75, 2490–2504. [Google Scholar] [CrossRef]
- Yue, C.Y.; Liu, C.P.; Wang, J.; Zhang, M.; Wu, H.J.; Li, C.R.; Yang, X.L. Association between social support and anxiety among pregnant women in the third trimester during the coronavirus disease 2019 (COVID-19) epidemic in Qingdao, China: The mediating effect of risk perception. Int. J. Soc. Psychiatr. 2021, 67, 120. [Google Scholar] [CrossRef] [PubMed]
- Zambrano-Monserrate, M.A.; Ruano, M.A.; Sanchez-Alcalde, L. Indirect effects of COVID-19 on the environment. Sci. Total Environ. 2020, 728, 138813–138816. [Google Scholar] [CrossRef]
- McCartney, G.; Pinto, J.; Liu, M. City resilience and recovery from COVID-19: The case of Macao. Cities 2021, 112, 103130–103138. [Google Scholar] [CrossRef]
- McKenzie, G.; Adams, B. A country comparison of place-based activity response to COVID-19 policies. Appl. Geogr. 2020, 125, 102363–102383. [Google Scholar] [CrossRef]
- Tchetchik, A.; Kaplan, S.; Blass, V. Recycling and consumption reduction following the COVID-19 lockdown: The effect of threat and coping appraisal, past behavior and information. Resour. Conserv. Recycl. 2021, 167, 105370–105383. [Google Scholar] [CrossRef]
- Ding, Y.B.; Xu, J.L.; Huang, S.S.; Li, P.P.; Lu, C.Z.; Xie, S.H. Risk perception and depression in public health crises: Evidence from the COVID-19 crisis in China. Int. J. Environ. Res. Public Health. 2020, 17, 5728. [Google Scholar] [CrossRef]
- Curnock, M.I.; Marshall, N.A.; Thiault, L.; Heron, S.F.; Hoey, J.; Williams, G.; Taylor, B.; Pert, P.L.; Goldberg, J. Shifts in tourists’ sentiments and climate risk perceptions following mass coral bleaching of the Great Barrier Reef. Nat. Clim. Chang. 2019, 9, 535–541. [Google Scholar] [CrossRef]
- Sarah, M.; Paschal, S.; Sheina, O. Prediction and intervention in health-related behavior: A meta-analytic review of protection motivation theory. J. Appl. Soc. Psychol. 2020, 30, 106–143. [Google Scholar] [CrossRef]
- Chen, Y.; Li, Q.X.; Cao, Y.; Xu, Y.M. Impact of farmers’ dual risk perceptions on resettlement intentions and behaviors: A case study of former Caopo township in southwestern China. Scien. Geogr. Sin. 2020, 40, 2085–2093. [Google Scholar] [CrossRef]
- Slovic, P. Perception of risk. Science 1987, 236, 280–285. [Google Scholar] [CrossRef]
- Hatch, T.; Gardner, H. Finding Cognition in the classroom: An expanded view of human intelligence. In Distributed cognitions: Psychological and Educational Considerations; Salomon, G., Ed.; Cambridge University Press: Cambridge, UK, 1993; pp. 164–188. [Google Scholar]
- Zhang, J.F.; Zhang, L.J.; Qin, Y.C.; Wang, X.; Sun, Y.Y.; Rong, P.J. Influencing factors of low-carbon behaviors of residents in Zhengzhou City from the perspective of cognition-behavior gaps. Progr. Geogr. 2020, 39, 265–275. [Google Scholar] [CrossRef]
- Zhao, Y.H.; Lu, Z.; Bai, L. Psychological stress mechanism of air crash exposed population from the perspective of psychogeography and its theoretical extension. Human Geogr. 2018, 33, 20–26. [Google Scholar] [CrossRef]
- Shrestha, S.R.; Sliuzas, R.; Kuffer, M. Open spaces and risk perception in post-earthquake Kathmandu city. Appl. Geogr. 2018, 93, 81–91. [Google Scholar] [CrossRef]
- Xu, X.Q.; Zhou, Y.X.; Ning, Y.M. Urban Geography; Higher Education Press: Beijing, China, 2009; p. 348. [Google Scholar]
- Yan, J.Q.; Kim, S.; Zhang, S.X.; Foo, M.D.; Alvarez-Risco, A.; Del-Aguila-Arcentales, S.; Yáñez, J.A. Hospitality workers’ COVID-19 risk perception and depression: A contingent model based on transactional theory of stress model. Int. J. Hosp. Manag. 2021, 95, 102935–102945. [Google Scholar] [CrossRef]
- Hall, H. The effect of the COVID-19 pandemic on healthcare workers’ mental health. Jaapa Off. J. Am. Acad. Phys. Assist. 2020, 33, 45–48. [Google Scholar] [CrossRef] [PubMed]
- Hu, Y.Y.; Chen, Y.Y.; Zheng, Y.X.; You, C.P.; Tan, J.; Hu, L.; Zhang, Z.Q.; Ding, L.J. Factors related to mental health of inpatients with COVID-19 in Wuhan, China. Brain Behav. Immun. 2020, 89, 587–593. [Google Scholar] [CrossRef]
- Tanoue, Y.; Nomura, S.; Yoneoka, D.; Kawashima, T.; Eguchi, A.; Shi, S.; Harada, N.; Miyata, H. Mental health of family, friends, and co-workers of COVID-19 patients in Japan. Psychiatry Res. 2020, 291, 113067–113069. [Google Scholar] [CrossRef] [PubMed]
- Zanin, M.G.; Gentile, E.; Parisi, A.; Spasiano, D. A preliminary evaluation of the public risk perception related to the COVID-19 health emergency in Italy. Int. J. Environ. Res. Public Health. 2020, 17, 3024. [Google Scholar] [CrossRef] [PubMed]
- Roy, D.; Tripathy, S.; Kar, S.K.; Sharma, N.; Verma, S.K.; Kaushal, V. Study of knowledge, attitude, anxiety and perceived mental healthcare need in Indian population during COVID-19 pandemic. Asian J. Psychiatr. 2020, 51, 102083–102089. [Google Scholar] [CrossRef] [PubMed]
- Reginald, R.G.; Robert, J.S. Spatial Behavior: A Geographic Perspective; The Commercial Press: Beijing, China, 2013; pp. 162–163. [Google Scholar]
- Lin, L.Y.; Zhu, Y.; Xu, L.F. The environmental perception and its effect on settlement intention of the floating population: A case Study of Fuzhou. Human Geogr. 2016, 31, 65–72. [Google Scholar] [CrossRef]
- Wang, L.; Sun, W.Y.; Wu, Y. Study on the impact of subjective perception of urban environment on residents’ health: Based on a large sample survey of 60 counties and cities in China. Human Geogr. 2020, 35, 55–64. [Google Scholar] [CrossRef]
- Paul, A.B.; Thomas, C.C.; Jeffrey, D.F. Environmental Psychology; China Renmin University Press Co. LTD: Beijing, China, 2009. [Google Scholar]
- Li, Y. Explain the interaction between human and environment from the perspective of psychology—Analysis of "Environmental Psychology: Psychology, Behavior and Environment". Environ. Protect. 2021, 49, 76–78. [Google Scholar] [CrossRef]
- Barker, R.G.; Getzels, J.W. Ecological Psychology: Concepts and methods for studying the environment of human behavior. Psyccritiques 1969, 14, 1184–1186. [Google Scholar] [CrossRef]
- Shao, Y.W.; Xu, J. Understanding urban resilience: A conceptual analysis based on integrated international literature review. Urban Plan. Int. 2015, 30, 48–54. [Google Scholar]
- Zhao, R.D.; Fang, C.L.; Liu, H.M. Progress and prospect of urban resilience research. Progr. Geogr. 2020, 39, 1717–1731. [Google Scholar] [CrossRef]
- Xu, Y.; Zhang, L.L. The economic resilience of Chinese cities and its origin: From the perspective of diversification of industrial structure. Financ. Trade Econ. 2019, 40, 110–126. [Google Scholar]
- United Nations. COVID-19 in an Urban World. Available online: https://www.un.org/en/coronavirus/covid-19-urban-world (accessed on 1 October 2020).
- Banai, R. Pandemic and the planning of resilient cities and regions. Cities 2020, 106, 102929–102934. [Google Scholar] [CrossRef]
- CIKD (Canadian Institute for Knowledge Development); Center for International Knowledge on Development. Question 73: What Are the Stages of China’s Response to the Epidemic? [EB/OL]. Available online: http://www.cikd.org/chinese/detail?docId=1429&leafId=212 (accessed on 12 March 2021).
- Ben-David, A.; Soffer, O. User comments across platforms and journalistic genres. Inf. Commun. Soc. 2019, 22, 1810–1829. [Google Scholar] [CrossRef]
- Chen, X.S.; Chang, T.Y.; Wang, H.Z.; Zhao, Z.L.; Zhang, J. Spatial and temporal analysis on public opinion evolution of epidemic situation about novel coronavirus pneumonia based on micro-blog data. J. Sichuan Univ. 2020, 57, 409–416. [Google Scholar] [CrossRef]
- Xu, J.H. Quantitative Geography; Higher Education Press: Beijing, China, 2006. [Google Scholar]
- Zhang, X.Y.; Li, C.M.; Liang, S.; Qian, M.Z.; Zhang, X.L. University supervision group, comparative analysis of two faculties and students of classroom teaching quality evaluation. Med. Educ. Res. Pract. 2020, 28, 517–521. [Google Scholar] [CrossRef]
- Zhang, C.; Ma, X.Y.; Zhou, Y.; Guo, R.Z. Analysis of public opinion evolution in COVID-19 pandemic from a perspective of sentiment variation. J. Geo-Inf. Sci. 2021, 23, 341–350. [Google Scholar] [CrossRef]


| Types | Variable | Symbol | Indicator Description | |
|---|---|---|---|---|
| COVID-19 | Confirmed | Cumulative confirmed cases | CCC | Cumulative number of confirmed cases at a particular stage of the epidemic |
| Cases | Growth rate of confirmed cases | GRC | The average growth rate of confirmed cases at a particular stage of the epidemic | |
| Death | Cumulative death cases | CDC | Cumulative number of deaths at a particular stage of the epidemic | |
| Cases | Death rate | DR | The average mortality rate at a particular stage of the epidemic | |
| Urban | Economic | Resident deposit balance | RDB | The savings of a city resident over one year |
| Socio- | Level | Average wage | AW | The average wage of a city resident over a year |
| economic | Social | Population density | PD | The ratio of the population of a city to the built area |
| Security | Endowment insurance | EI | The number of participants with endowment insurance in a city | |
| Medical insurance | MI | The number of participants with medical insurance in a city | ||
| Unemployment insurance | UI | The number of participants with unemployment insurance in a city | ||
| Unemployment registration | UR | The number of registered unemployed in a city | ||
| Medical | Hospitals | H | The number of hospitals in a city | |
| Facilities | Hospital beds | HB | The number of hospital beds in a city | |
| Doctors | D | The number of doctors in a city |
| Variable | Early Dissemination | Accelerating Diffusion | Decelerating Diffusion | Prevention and Control | |||||
|---|---|---|---|---|---|---|---|---|---|
| B | VIF | B | VIF | B | VIF | B | VIF | ||
| 1 | 181.096 *** | 14.871 * | −3.582 * | −14.464 * | |||||
| 2 | 174.192 ** | 11.824 * | −5.626 * | −15.682 * | |||||
| 3 | 171.439 ** | 8.258 * | −7.546 * | −17.323 * | |||||
| COVID-19 | CCC | 0.048 *** | 3.596 | 0.002 *** | 4.287 | 0.013 | 2.051 | 0.006 * | 1.703 |
| GRC | −3.818 | 3.4 | 0.882 | 6.247 | −28.425 | 4.391 | 15.927 | 1.879 | |
| CDC | 0 | 2.025 | 0.045 *** | 4.555 | −0.077 | 4.906 | 0.001 | 2.058 | |
| DR | 0 | 3.234 | 10.532 | 1.721 | 37.089 ** | 2.159 | −2.387 | 2.195 | |
| Economic | RDB | −0.415 | 2.014 | −0.554 | 1.925 | 0.336 | 1.625 | −2.125 ** | 1.687 |
| Conditions | AW | 39.855 ** | 2.409 | 1.605 | 2.95 | −2.48 * | 2.228 | −2.793 * | 2.199 |
| Social | PD | −4.174 | 2.186 | 1.211 *** | 1.603 | 0.274 | 1.555 | −0.039 | 1.614 |
| Security | EI | 4.526 | 3.757 | 1.750 * | 4.721 | 0.199 | 4.641 | 1.04 * | 4.754 |
| MI | 2.271 | 1.812 | −1.976 *** | 6.636 | 0.535 | 6.856 | −0.198 | 1.636 | |
| UI | −4.631 | 4.425 | −0.162 | 0.044 | −0.403 | 2.497 | 1.353 * | 2.411 | |
| UR | −9.765 * | 4.452 | 1.265 ** | 3.603 | 0.368 | 4.415 | −0.403 | 2.848 | |
| Medical | H | −11.121 * | 2.209 | −1.198 * | 2.331 | 0.752 | 2.324 | 1.275 ** | 2.319 |
| Facilities | HB | −0.975 | 2.596 | 2.651 ** | 2.687 | −1.905 * | 2.88 | −0.145 | 2.772 |
| D | 10.523 | 3.24 | −2.102 ** | 3.291 | 1.281 * | 3.236 | 0.152 | 3.325 | |
| MFI | −2LogLikehood | 35.432 | 35.937 | 703.108 | 772.966 | ||||
| Chi-Square | 34.496 | 29.661 | 38.366 | 37.109 | |||||
| df | 12 | 11 | 14 | 14 | |||||
| Variable | RDB | AW | PD | H | HB | D | EI | MI | UI | UR | |
|---|---|---|---|---|---|---|---|---|---|---|---|
| early dissemination | CCC | ||||||||||
| CRI | |||||||||||
| CCD | |||||||||||
| MR | |||||||||||
| accelerating diffusion | CCC | −0.004 ** | −0.017 *** | 0.012 * | |||||||
| CRI | 9.48 *** | 40.9 *** | −25.79 ** | −12.899 ** | |||||||
| CCD | 0.79 ** | ||||||||||
| MR | −447.32 * | ||||||||||
| decelerating diffusion | CCC | −0.12 * | 0.257 ** | ||||||||
| CRI | |||||||||||
| CCD | |||||||||||
| MR | −139.65 ** | −330.6 ** | |||||||||
| Prevention And control | CCC | ||||||||||
| CRI | 221.7 ** | 397.3 * | |||||||||
| CCD | 2.52 * | −2.671 * | |||||||||
| MR | −47.15 ** |
Publisher’s Note: MDPI stays neutral with regard to jurisdictional claims in published maps and institutional affiliations. |
© 2021 by the authors. Licensee MDPI, Basel, Switzerland. This article is an open access article distributed under the terms and conditions of the Creative Commons Attribution (CC BY) license (https://creativecommons.org/licenses/by/4.0/).
Share and Cite
Zhang, J.; Zheng, Z.; Zhang, L.; Qin, Y.; Duan, J.; Zhang, A. Influencing Factors of Environmental Risk Perception during the COVID-19 Epidemic in China. Int. J. Environ. Res. Public Health 2021, 18, 9375. https://doi.org/10.3390/ijerph18179375
Zhang J, Zheng Z, Zhang L, Qin Y, Duan J, Zhang A. Influencing Factors of Environmental Risk Perception during the COVID-19 Epidemic in China. International Journal of Environmental Research and Public Health. 2021; 18(17):9375. https://doi.org/10.3390/ijerph18179375
Chicago/Turabian StyleZhang, Jingfei, Zhicheng Zheng, Lijun Zhang, Yaochen Qin, Jieran Duan, and Anyi Zhang. 2021. "Influencing Factors of Environmental Risk Perception during the COVID-19 Epidemic in China" International Journal of Environmental Research and Public Health 18, no. 17: 9375. https://doi.org/10.3390/ijerph18179375
APA StyleZhang, J., Zheng, Z., Zhang, L., Qin, Y., Duan, J., & Zhang, A. (2021). Influencing Factors of Environmental Risk Perception during the COVID-19 Epidemic in China. International Journal of Environmental Research and Public Health, 18(17), 9375. https://doi.org/10.3390/ijerph18179375