
Physiological and Psychological Assessments for the Establishment of Evidence-Based Forest Healing Programs


Abstract
1. Introduction
1.1. Research Background and Rationale
1.2. Research Purpose and Questions
2. Materials and Methods
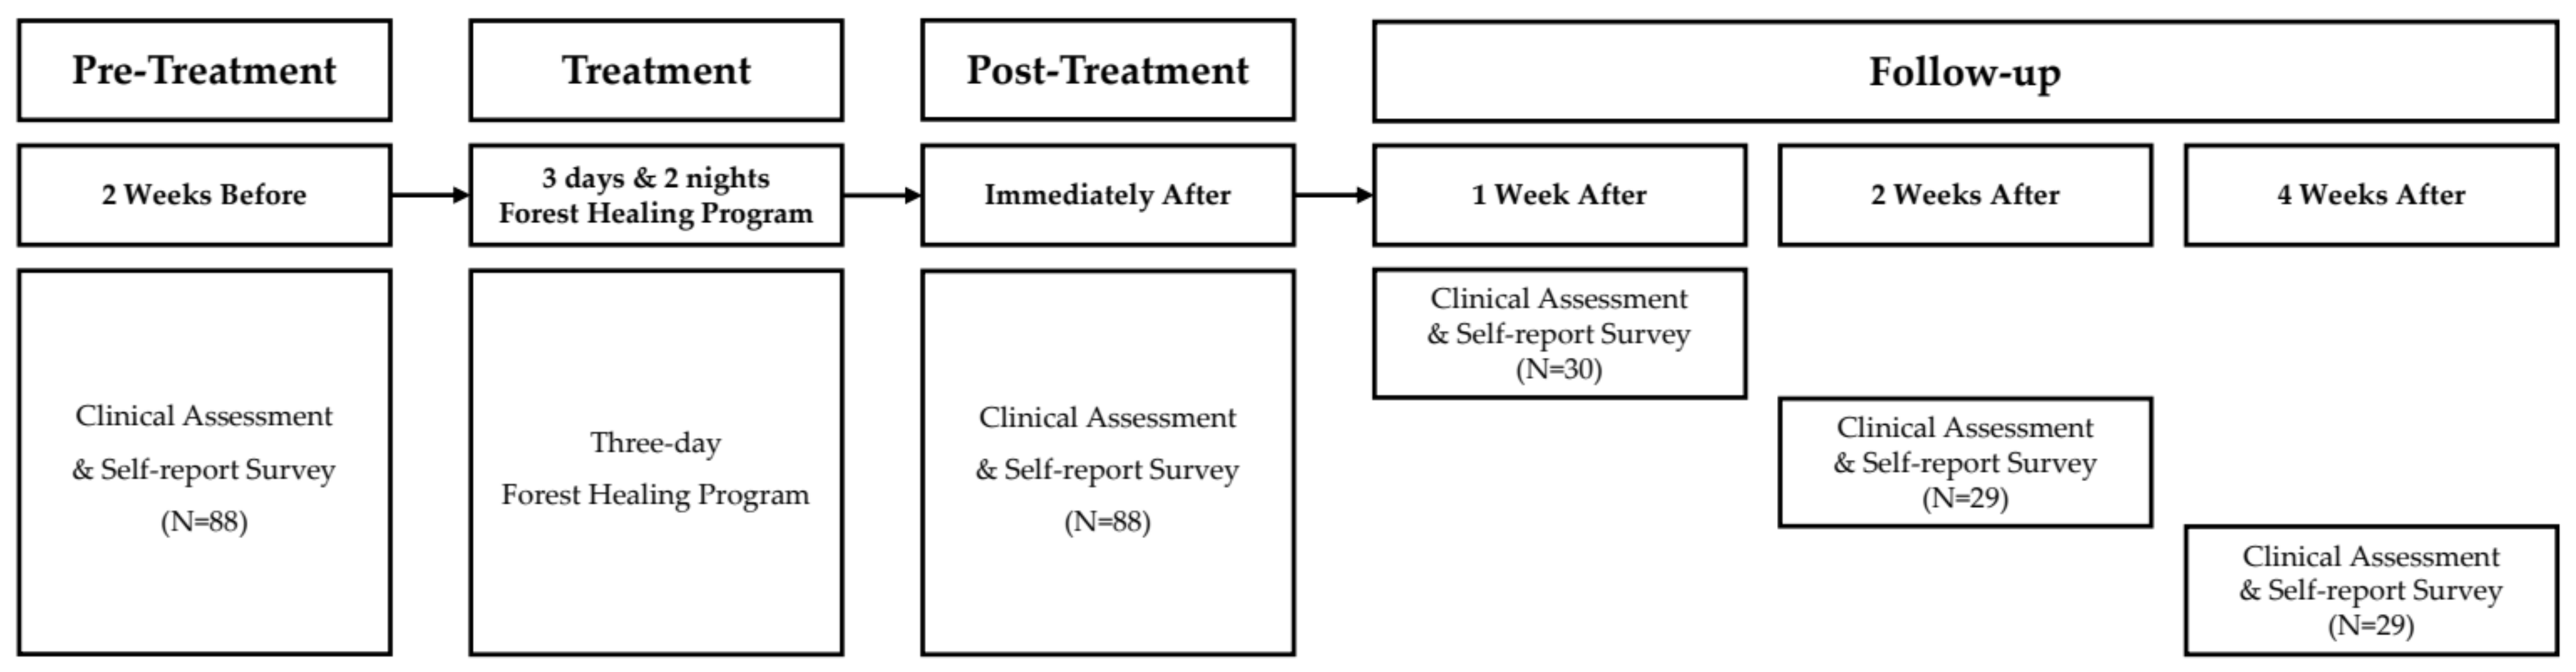
2.1. Research Design
2.2. Participants
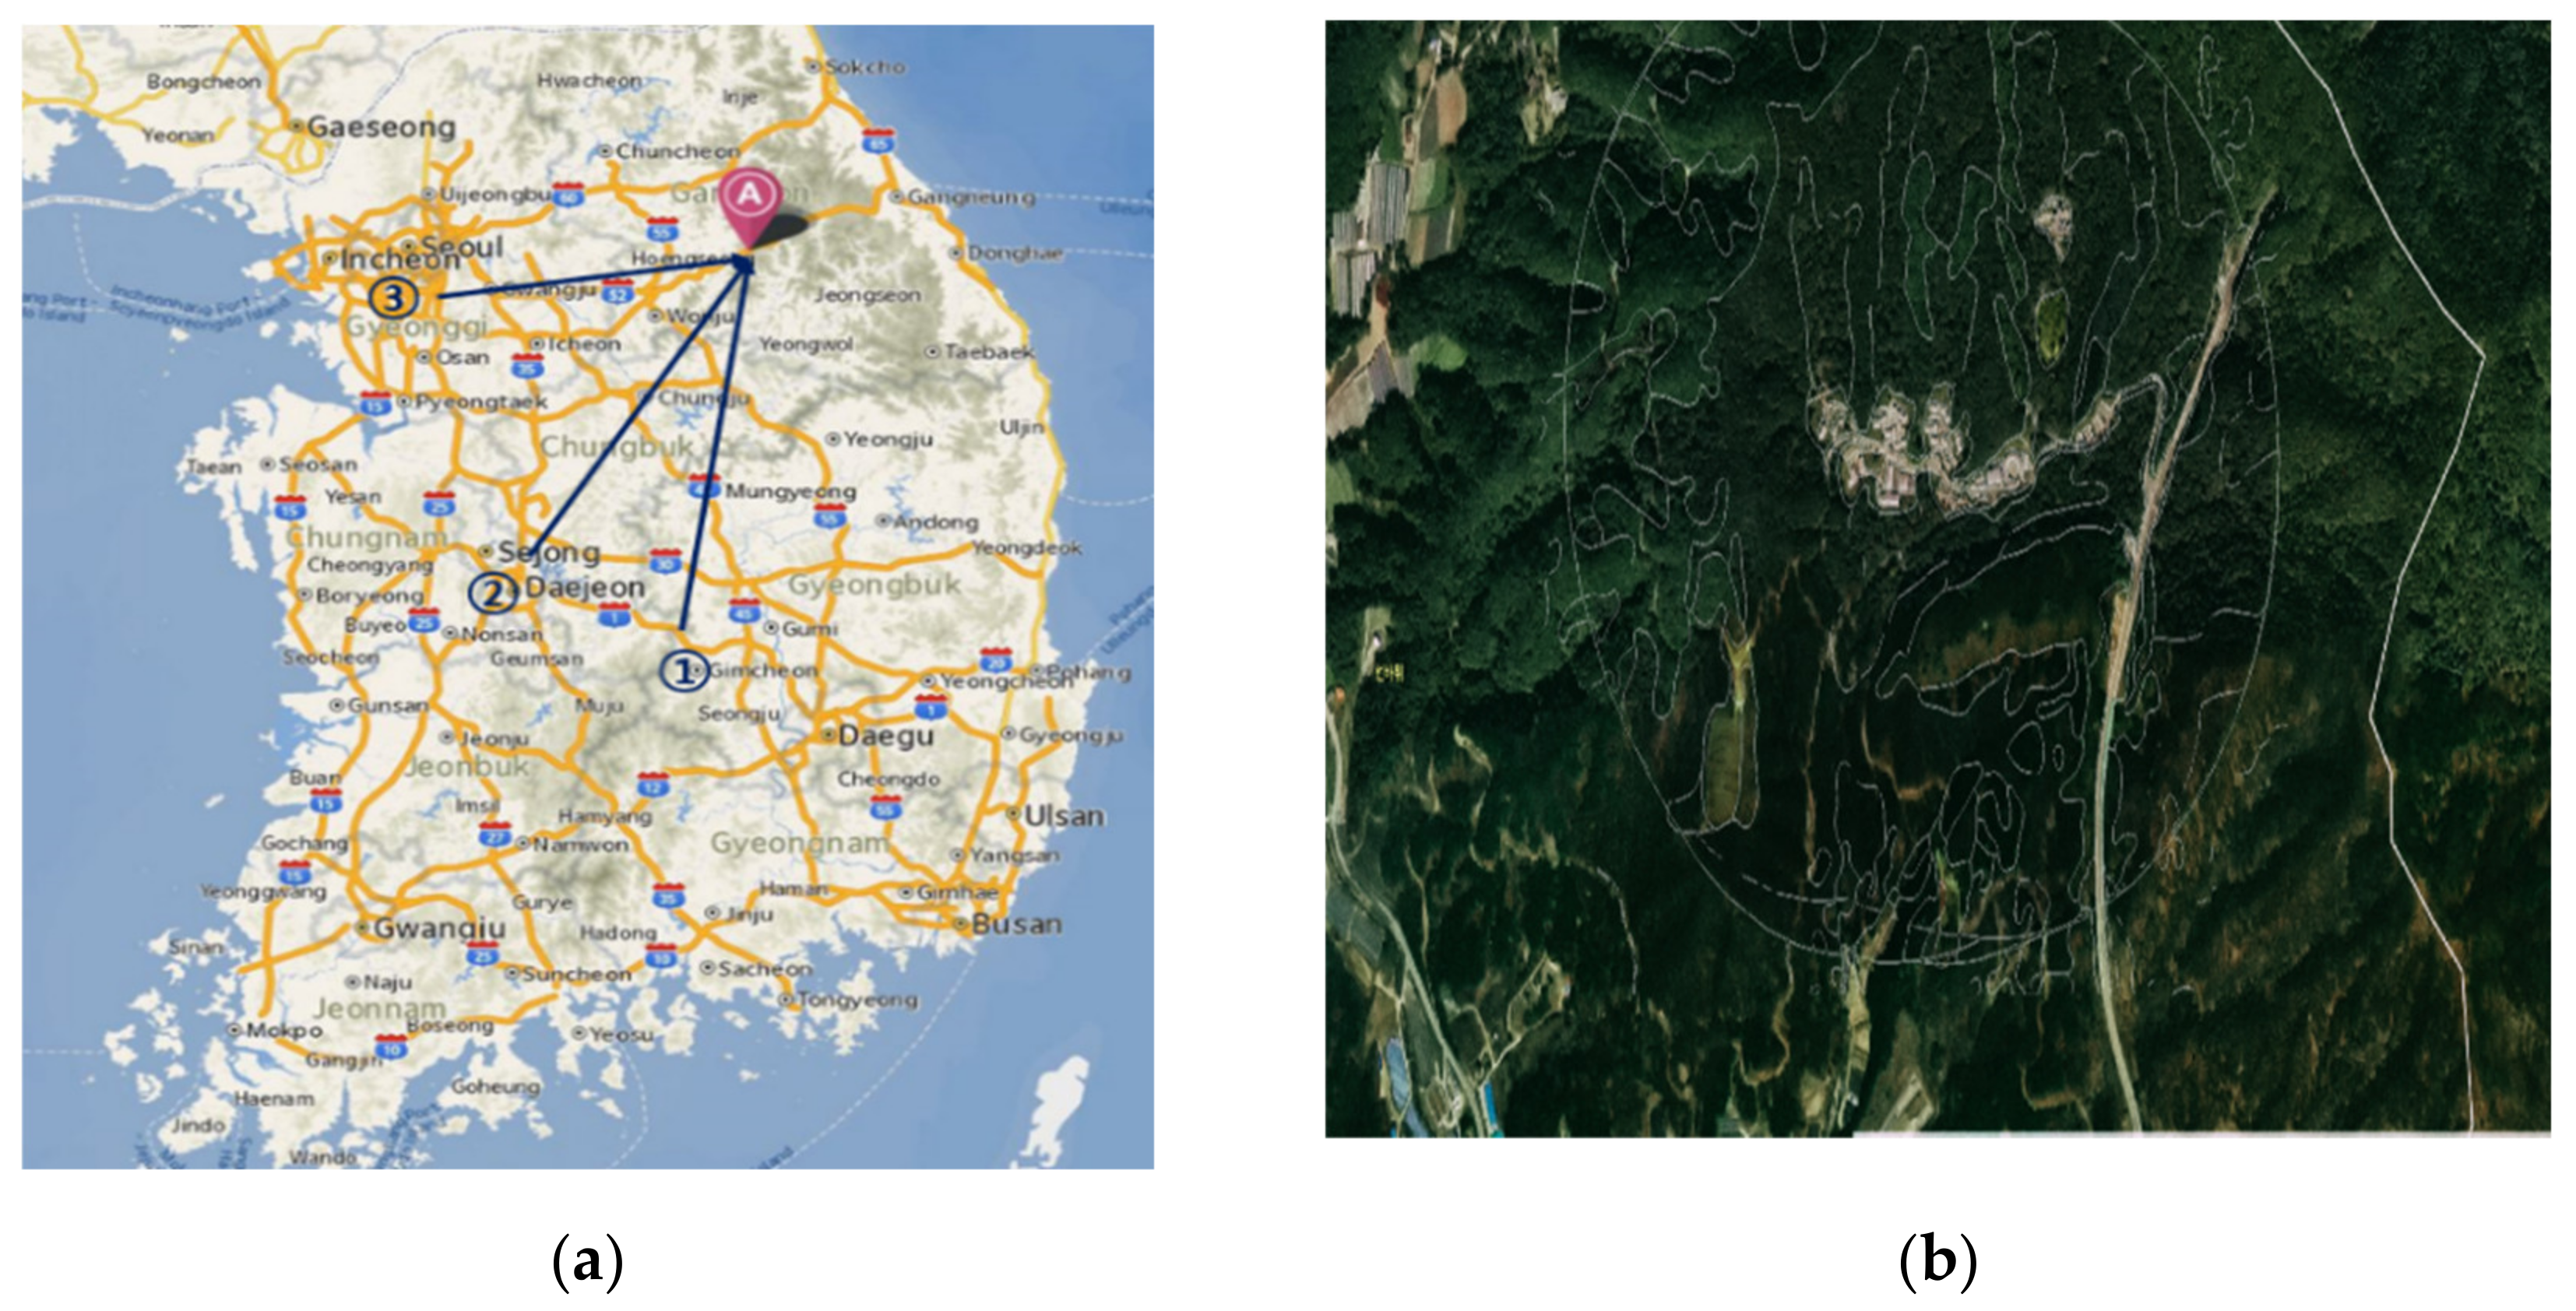
2.3. Sites
2.4. Treatment
2.5. Measurement
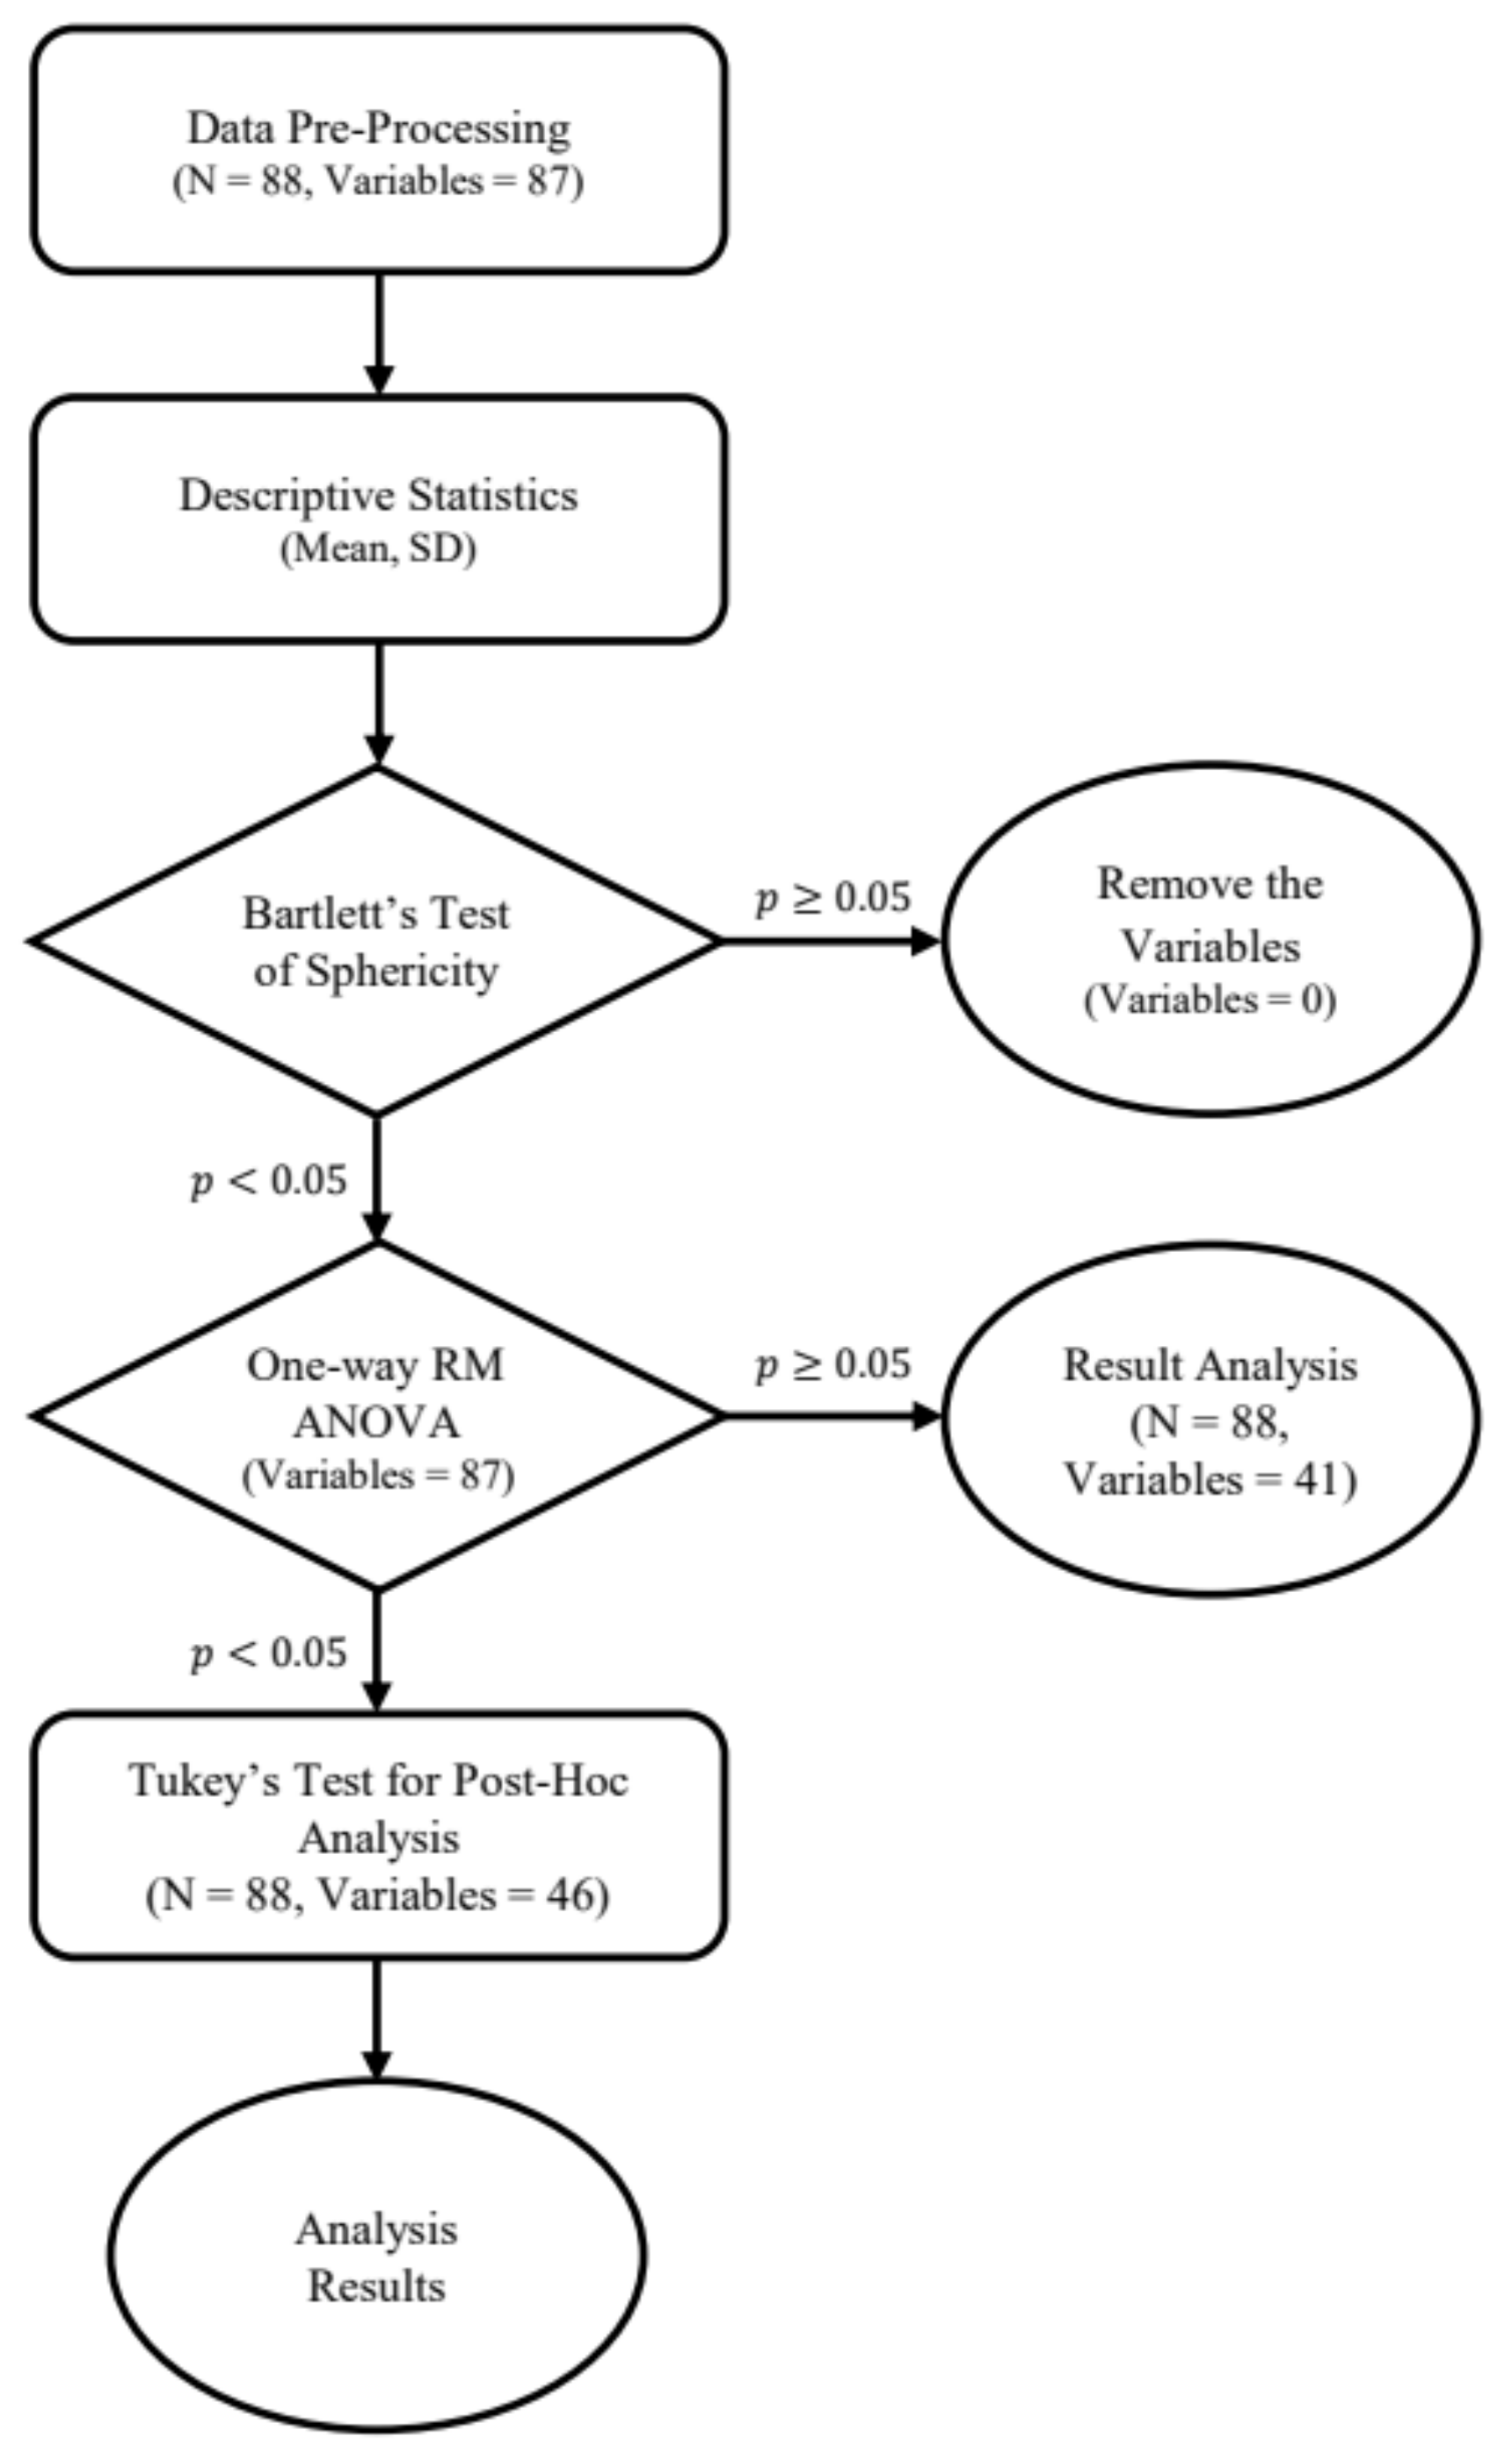
2.6. Analysis
3. Results
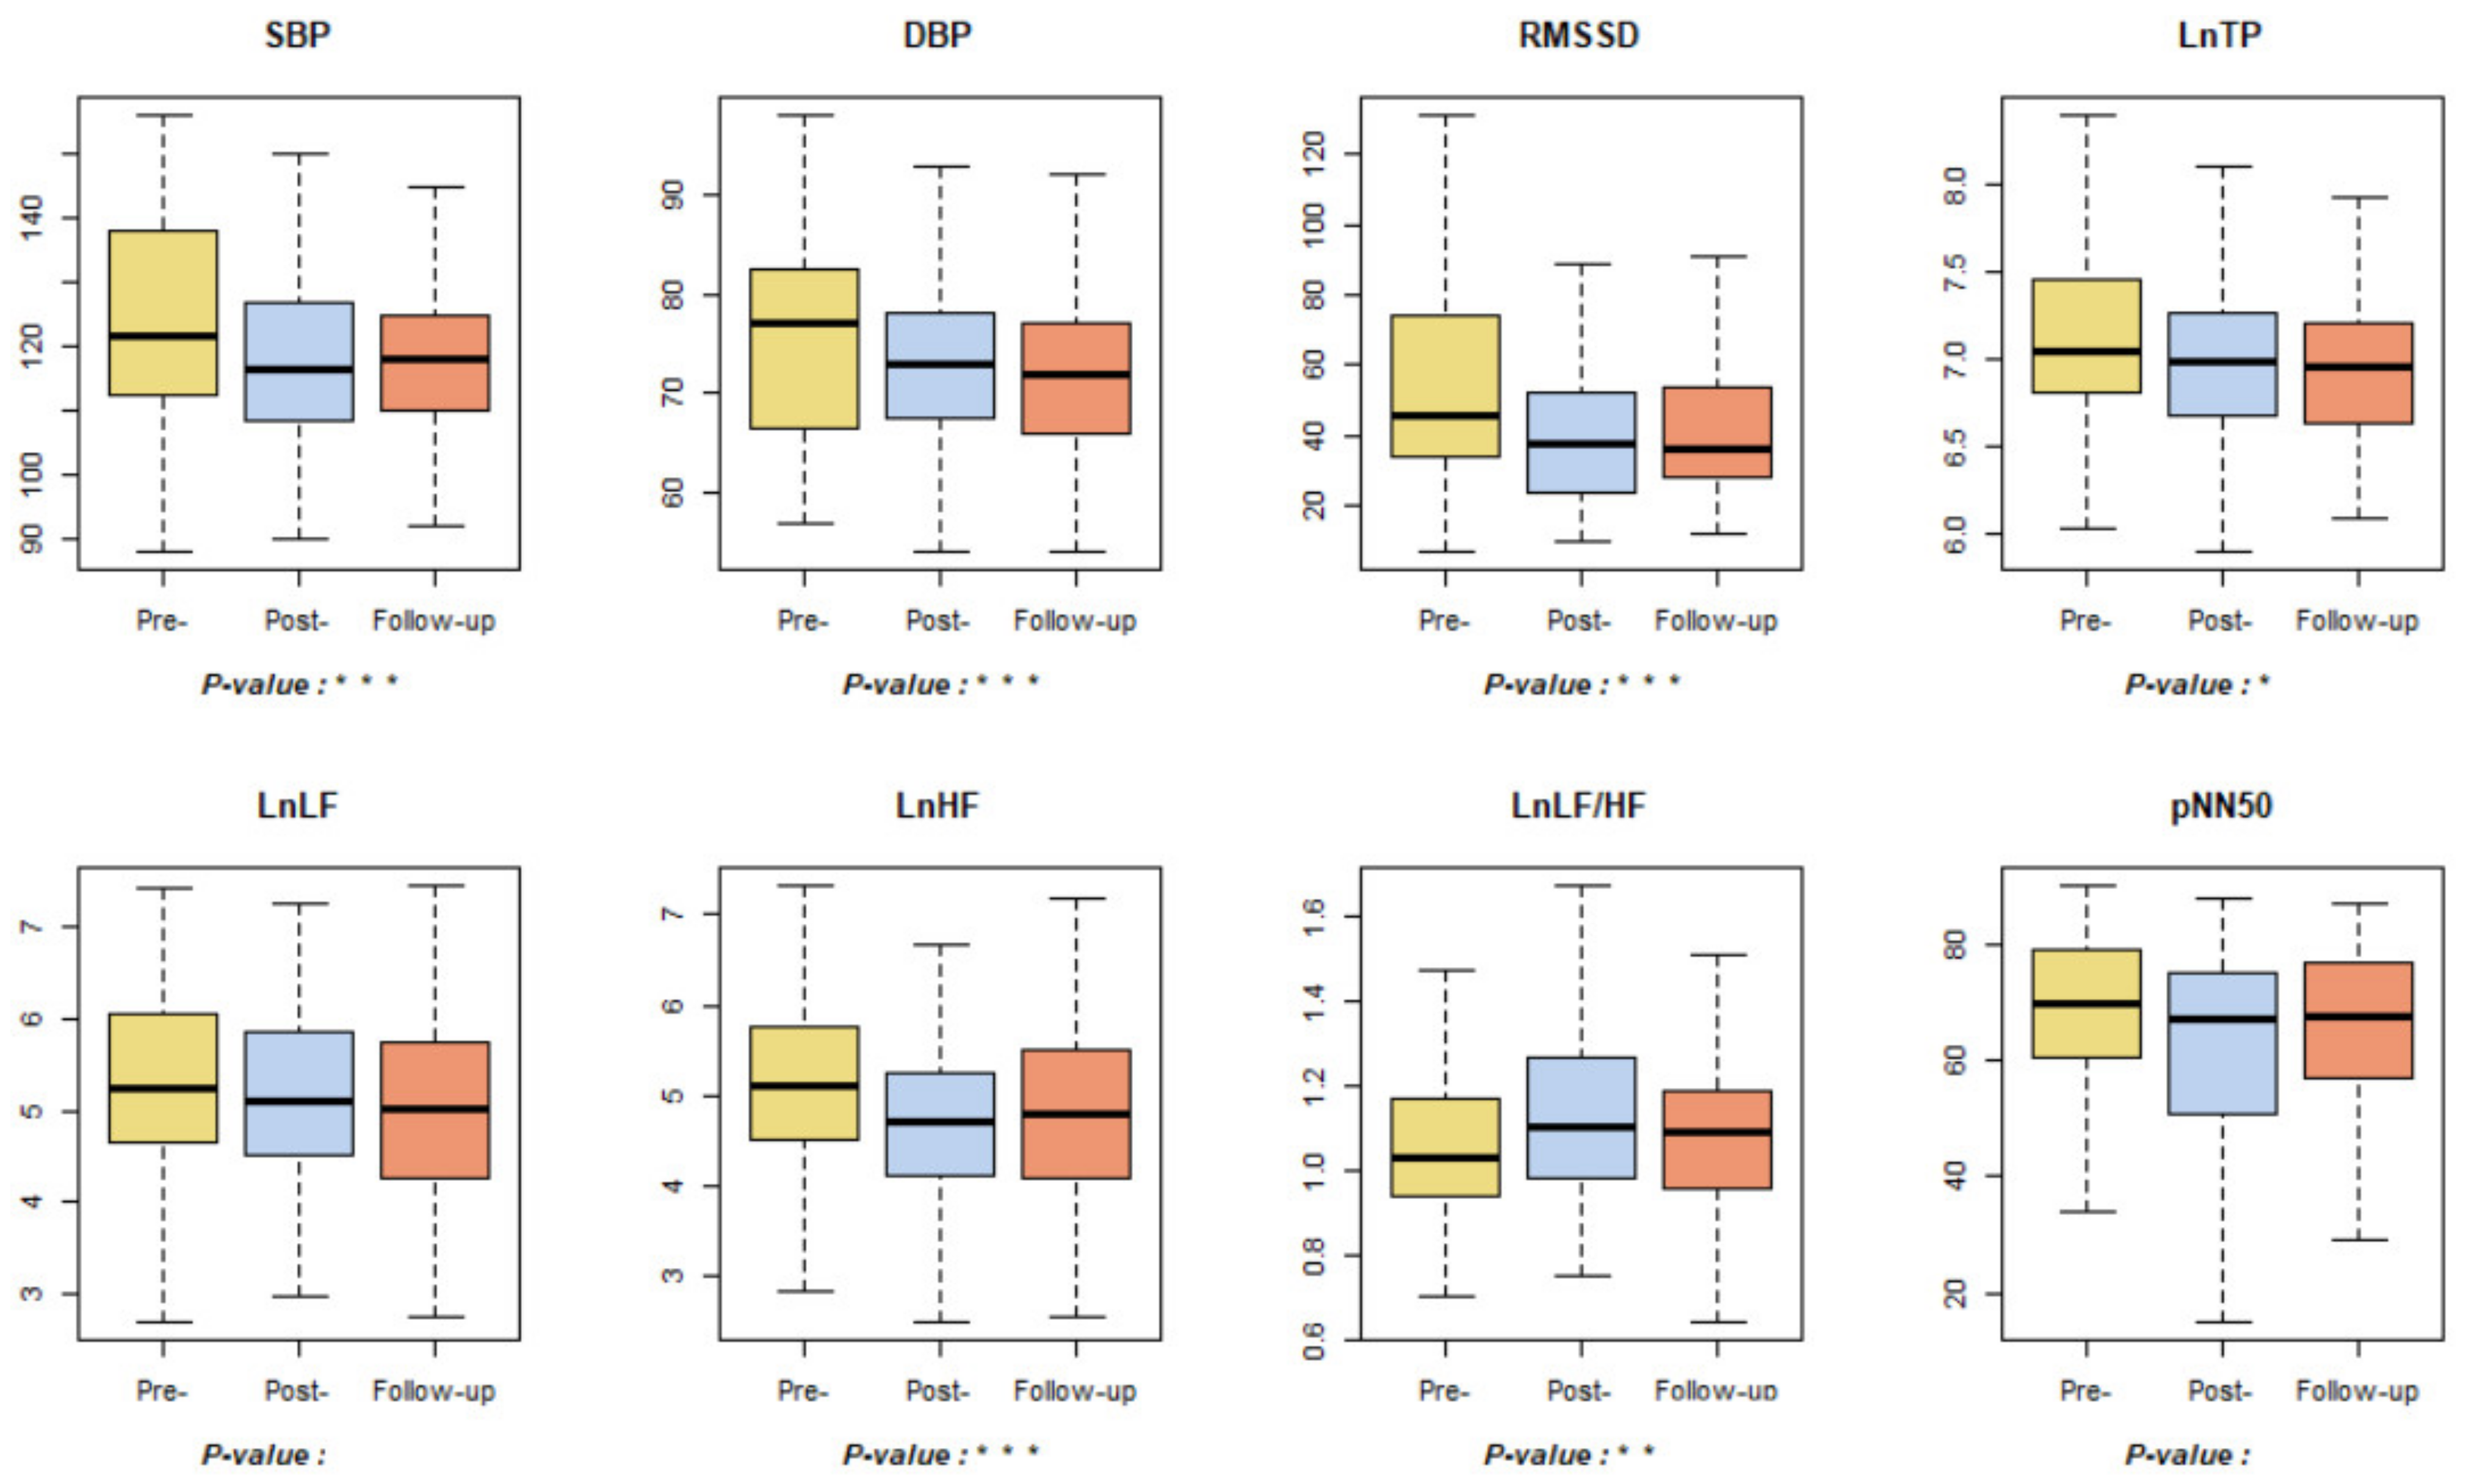
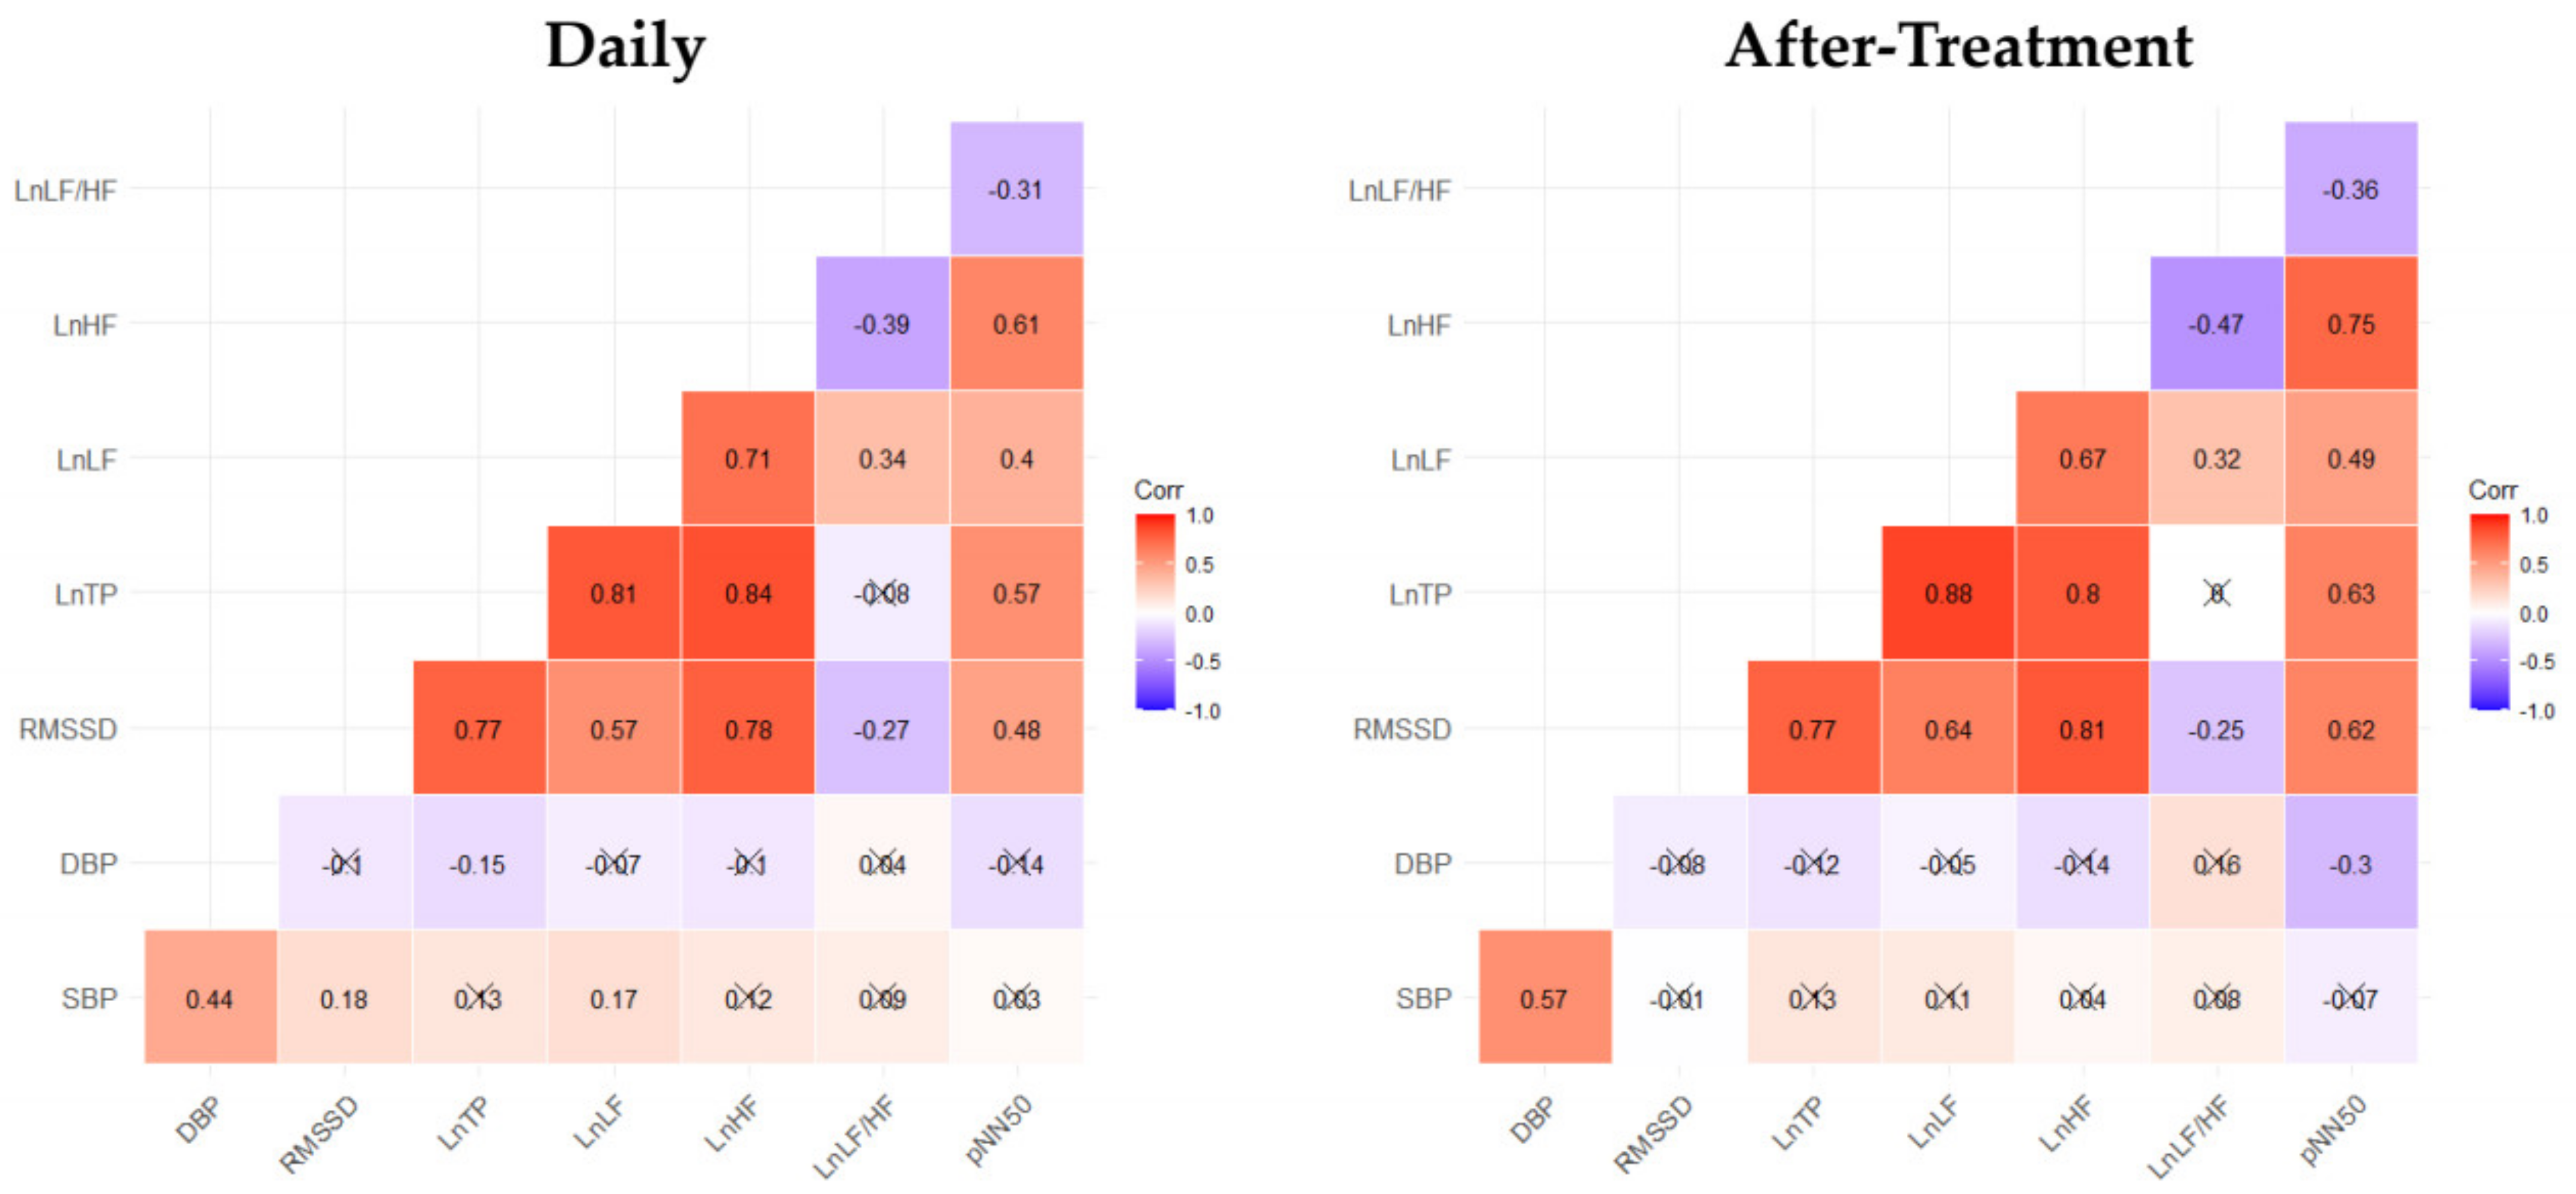
3.1. Blood Pressure and Autonomic Nervous System
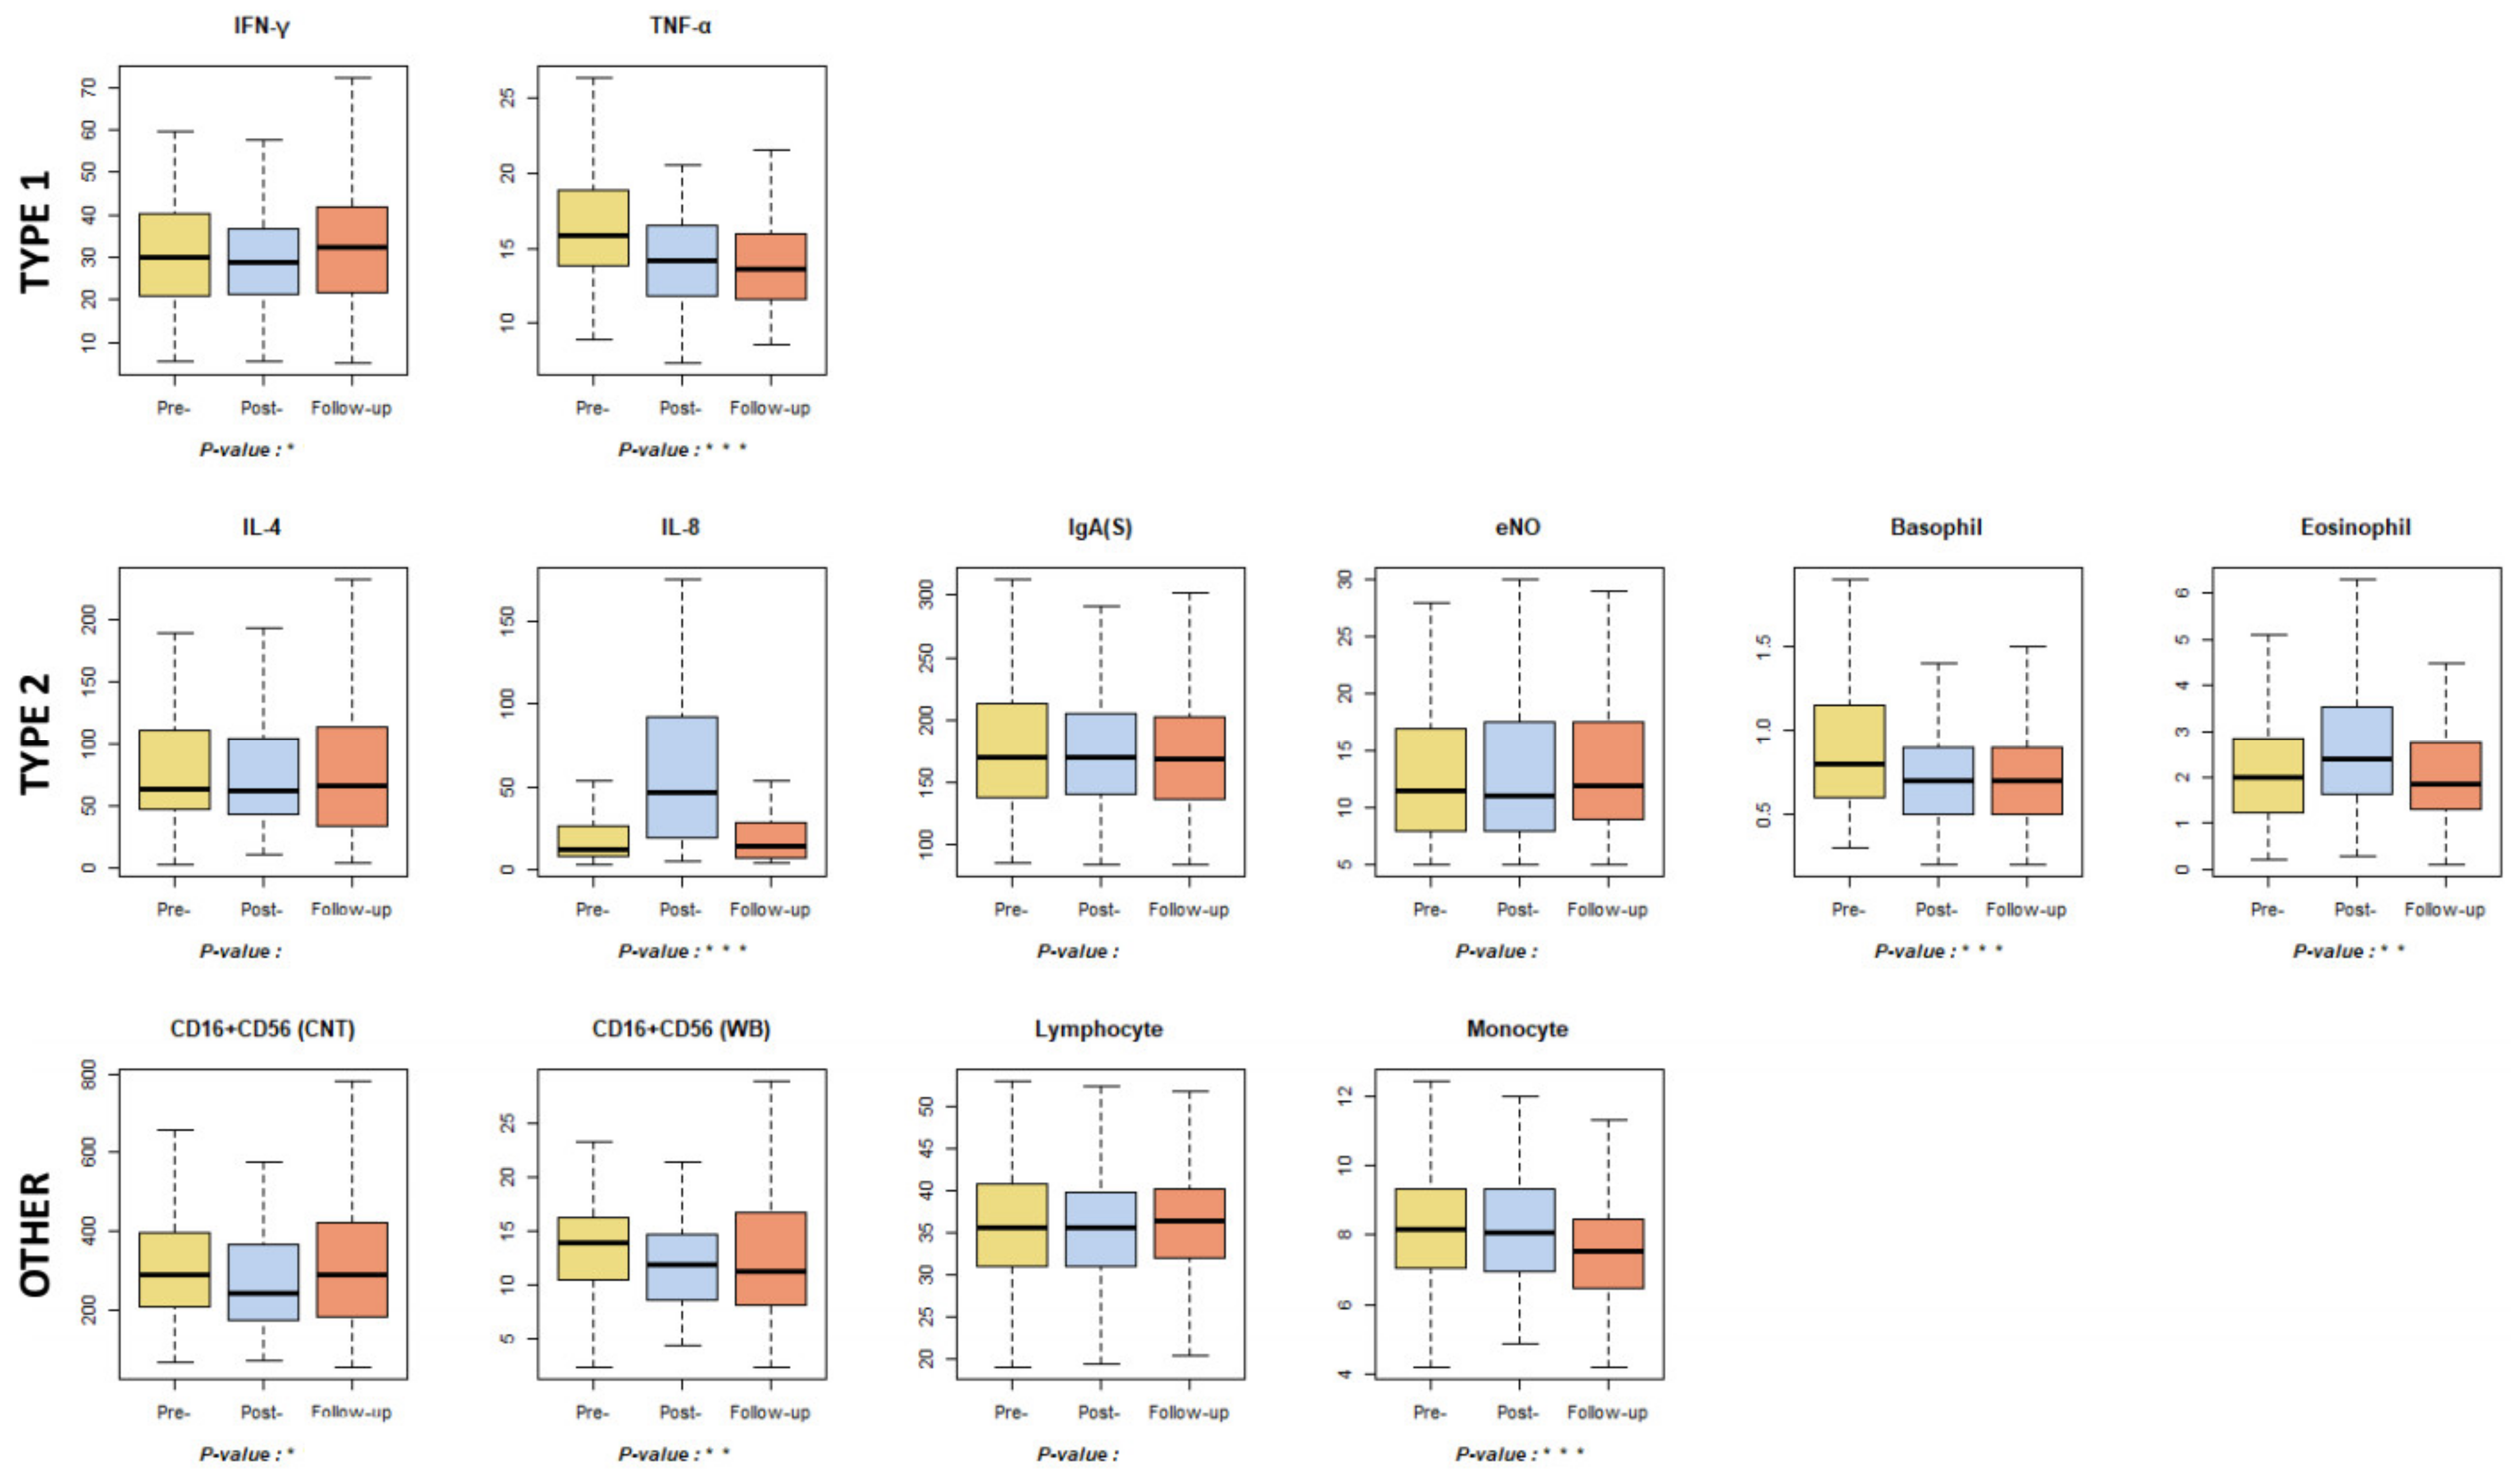
3.2. Immune Function and Inflammation
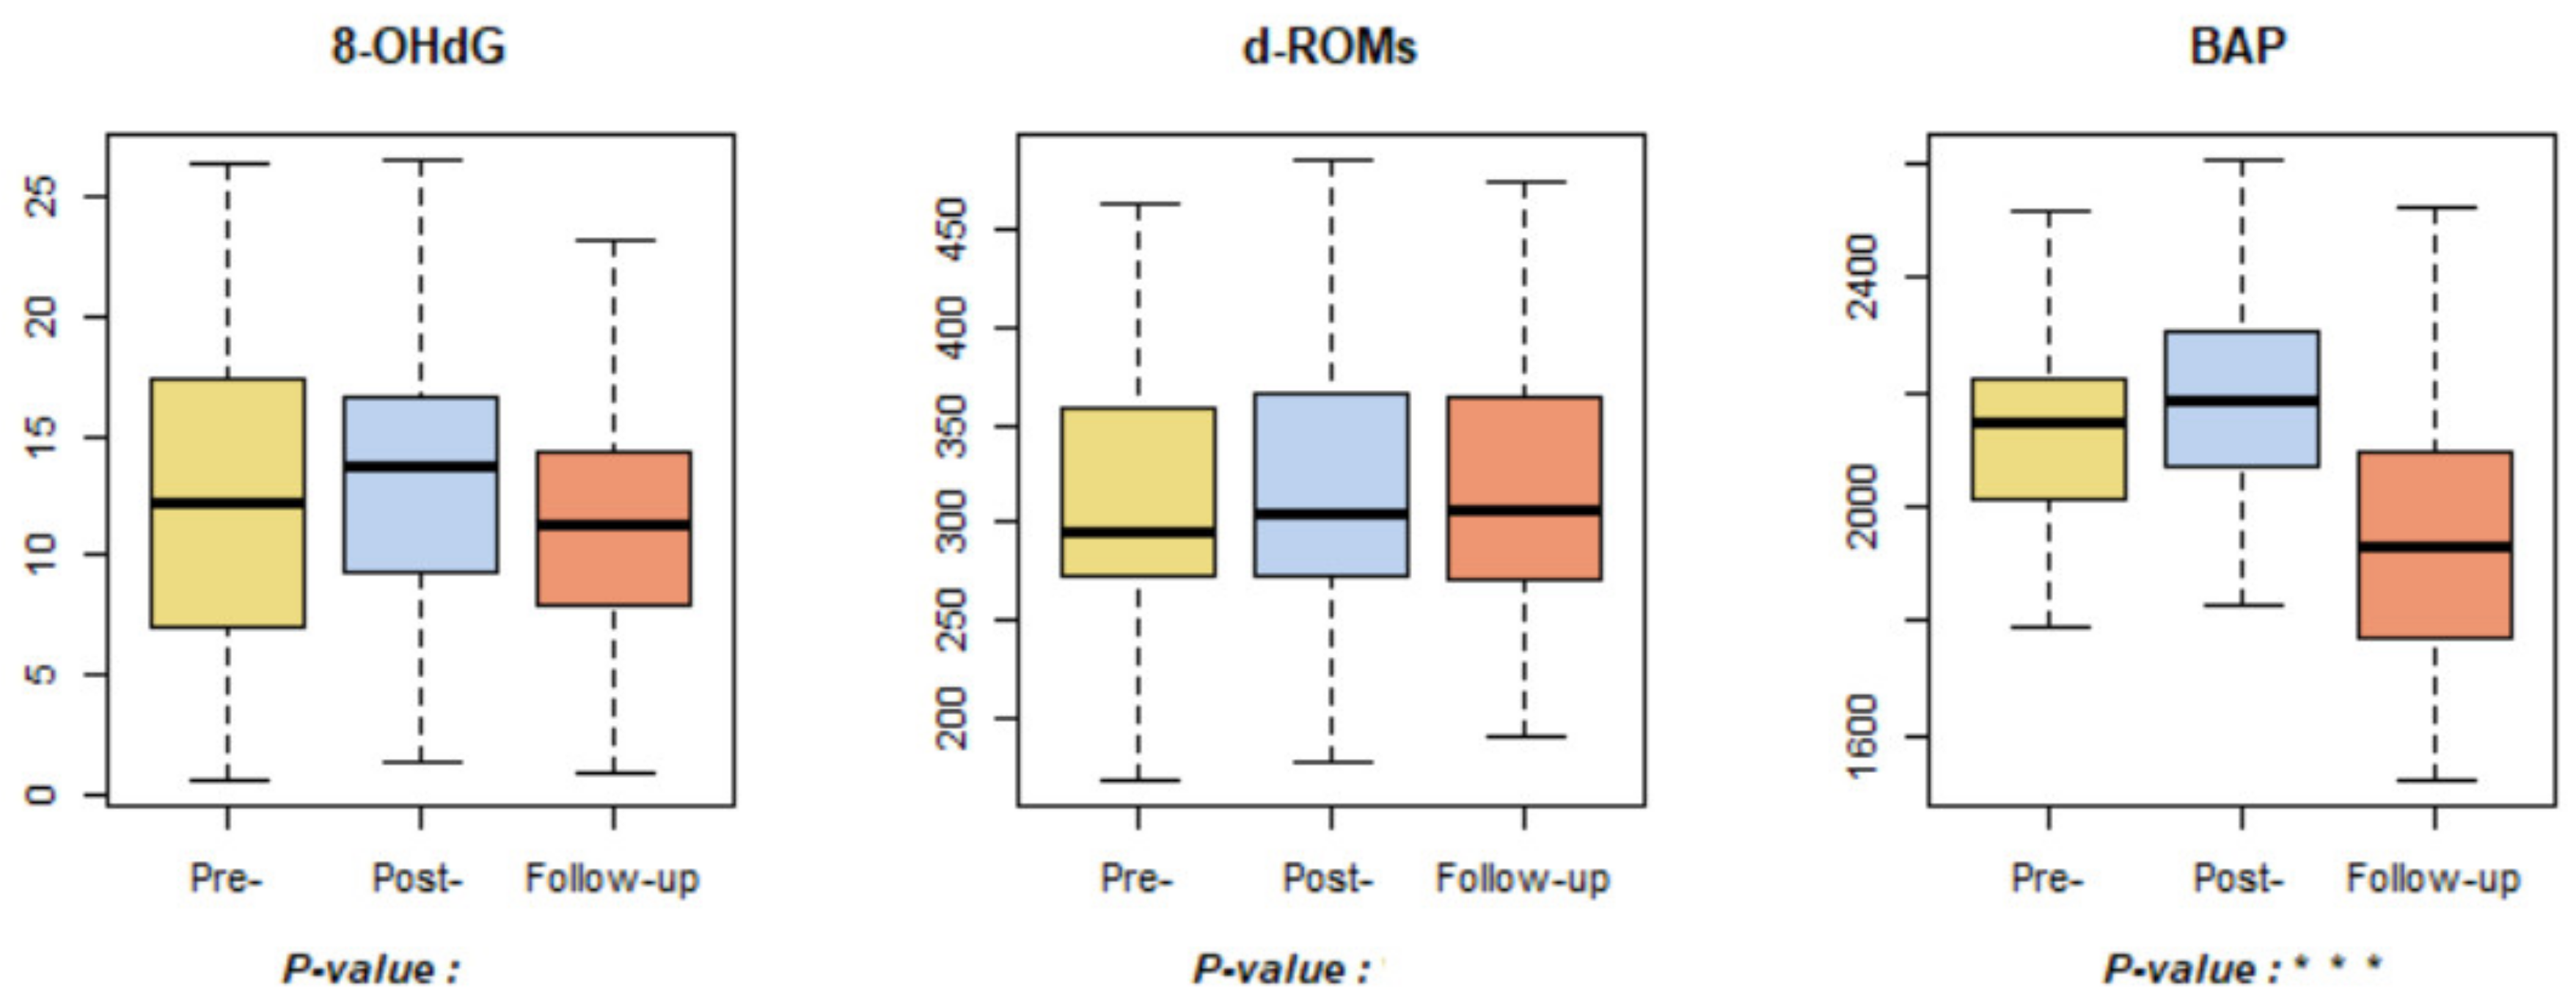
3.3. Oxidative Stress and Antioxidant
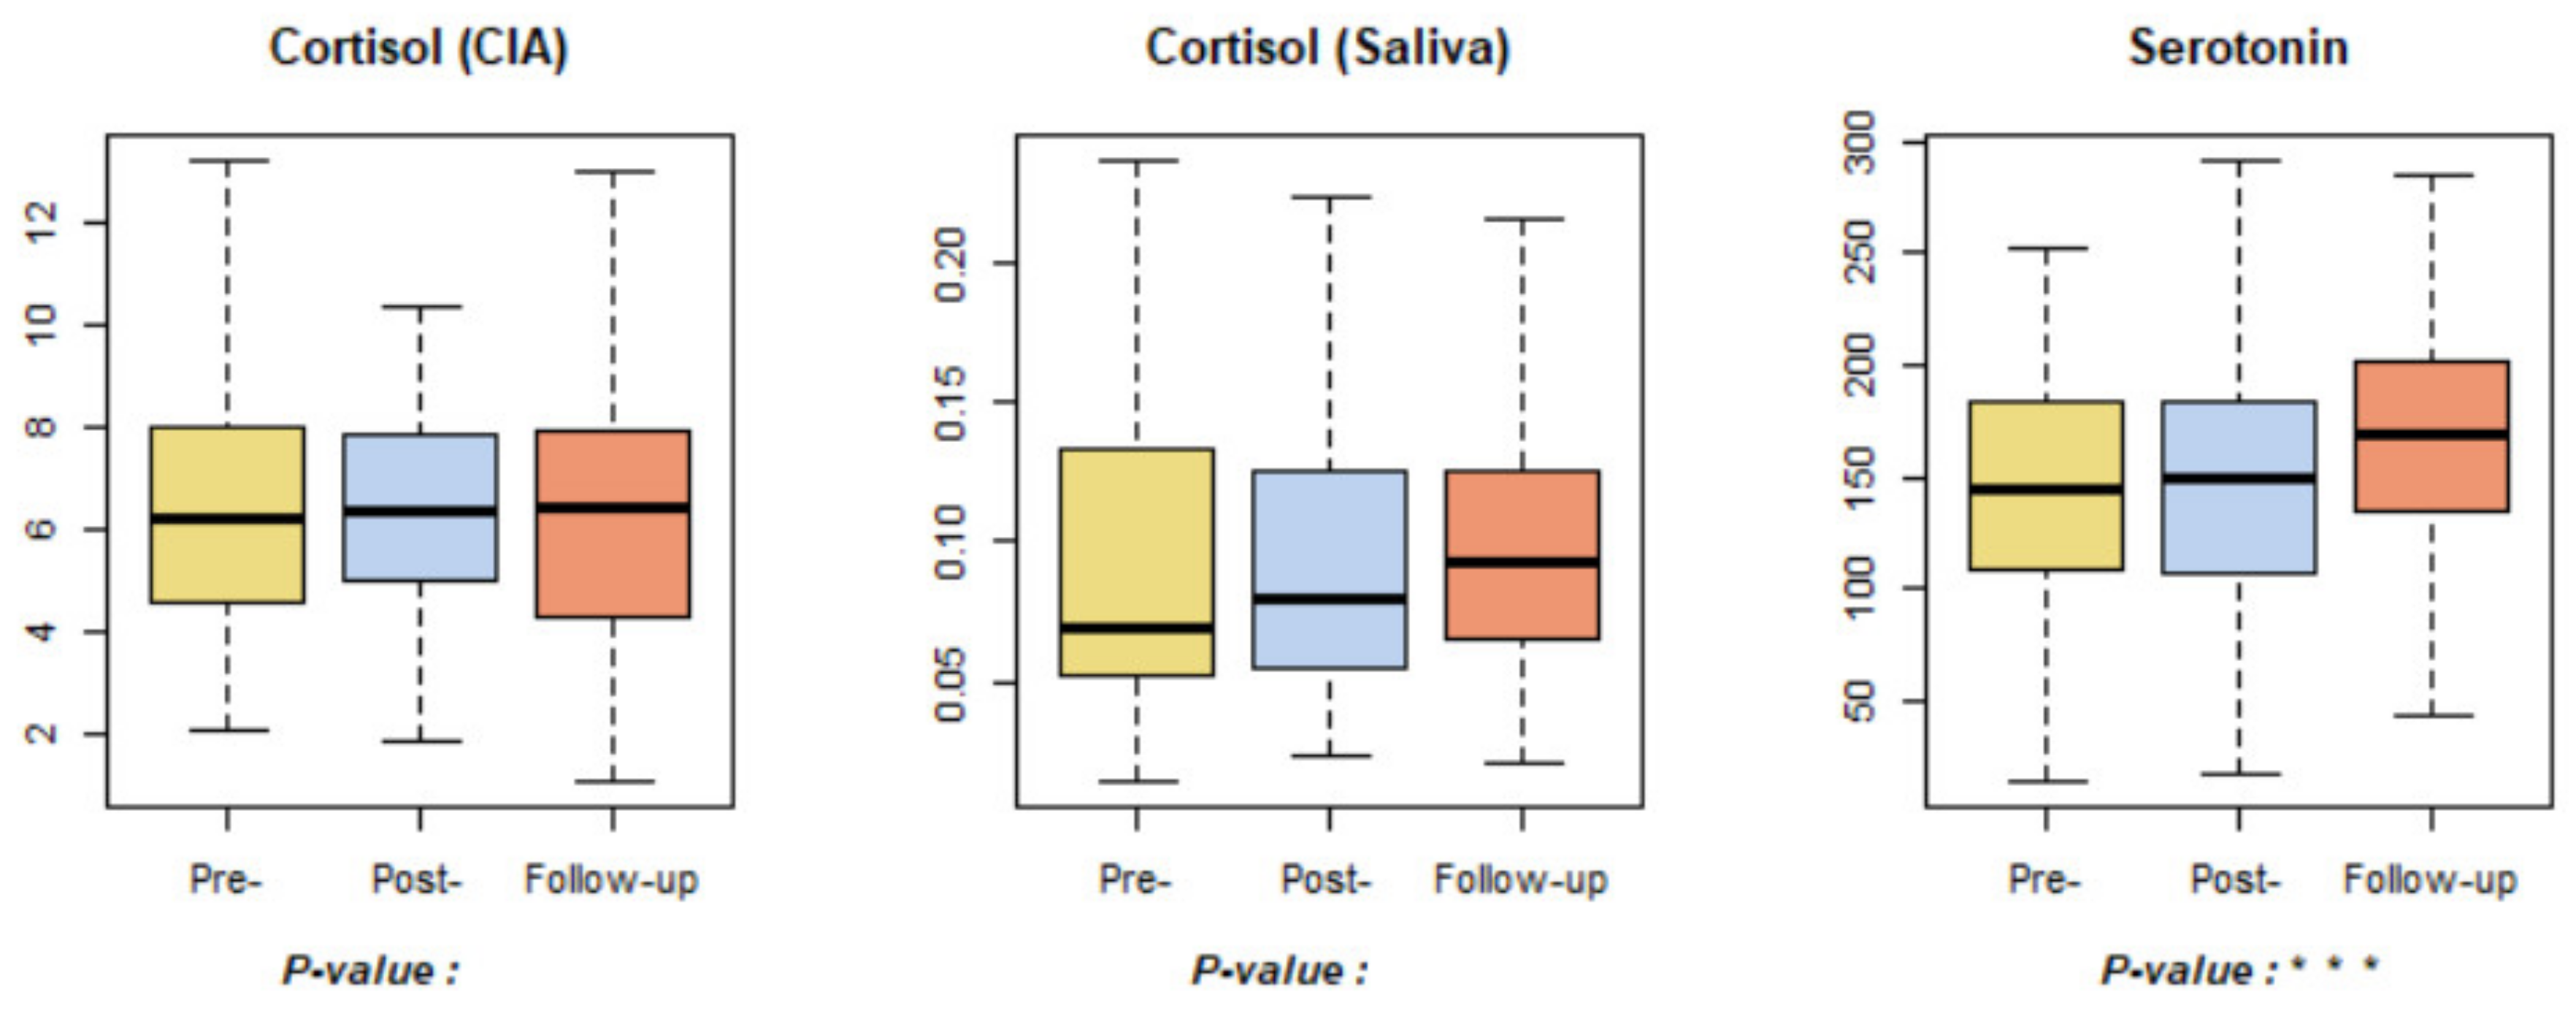
3.4. Stress (Hormone)
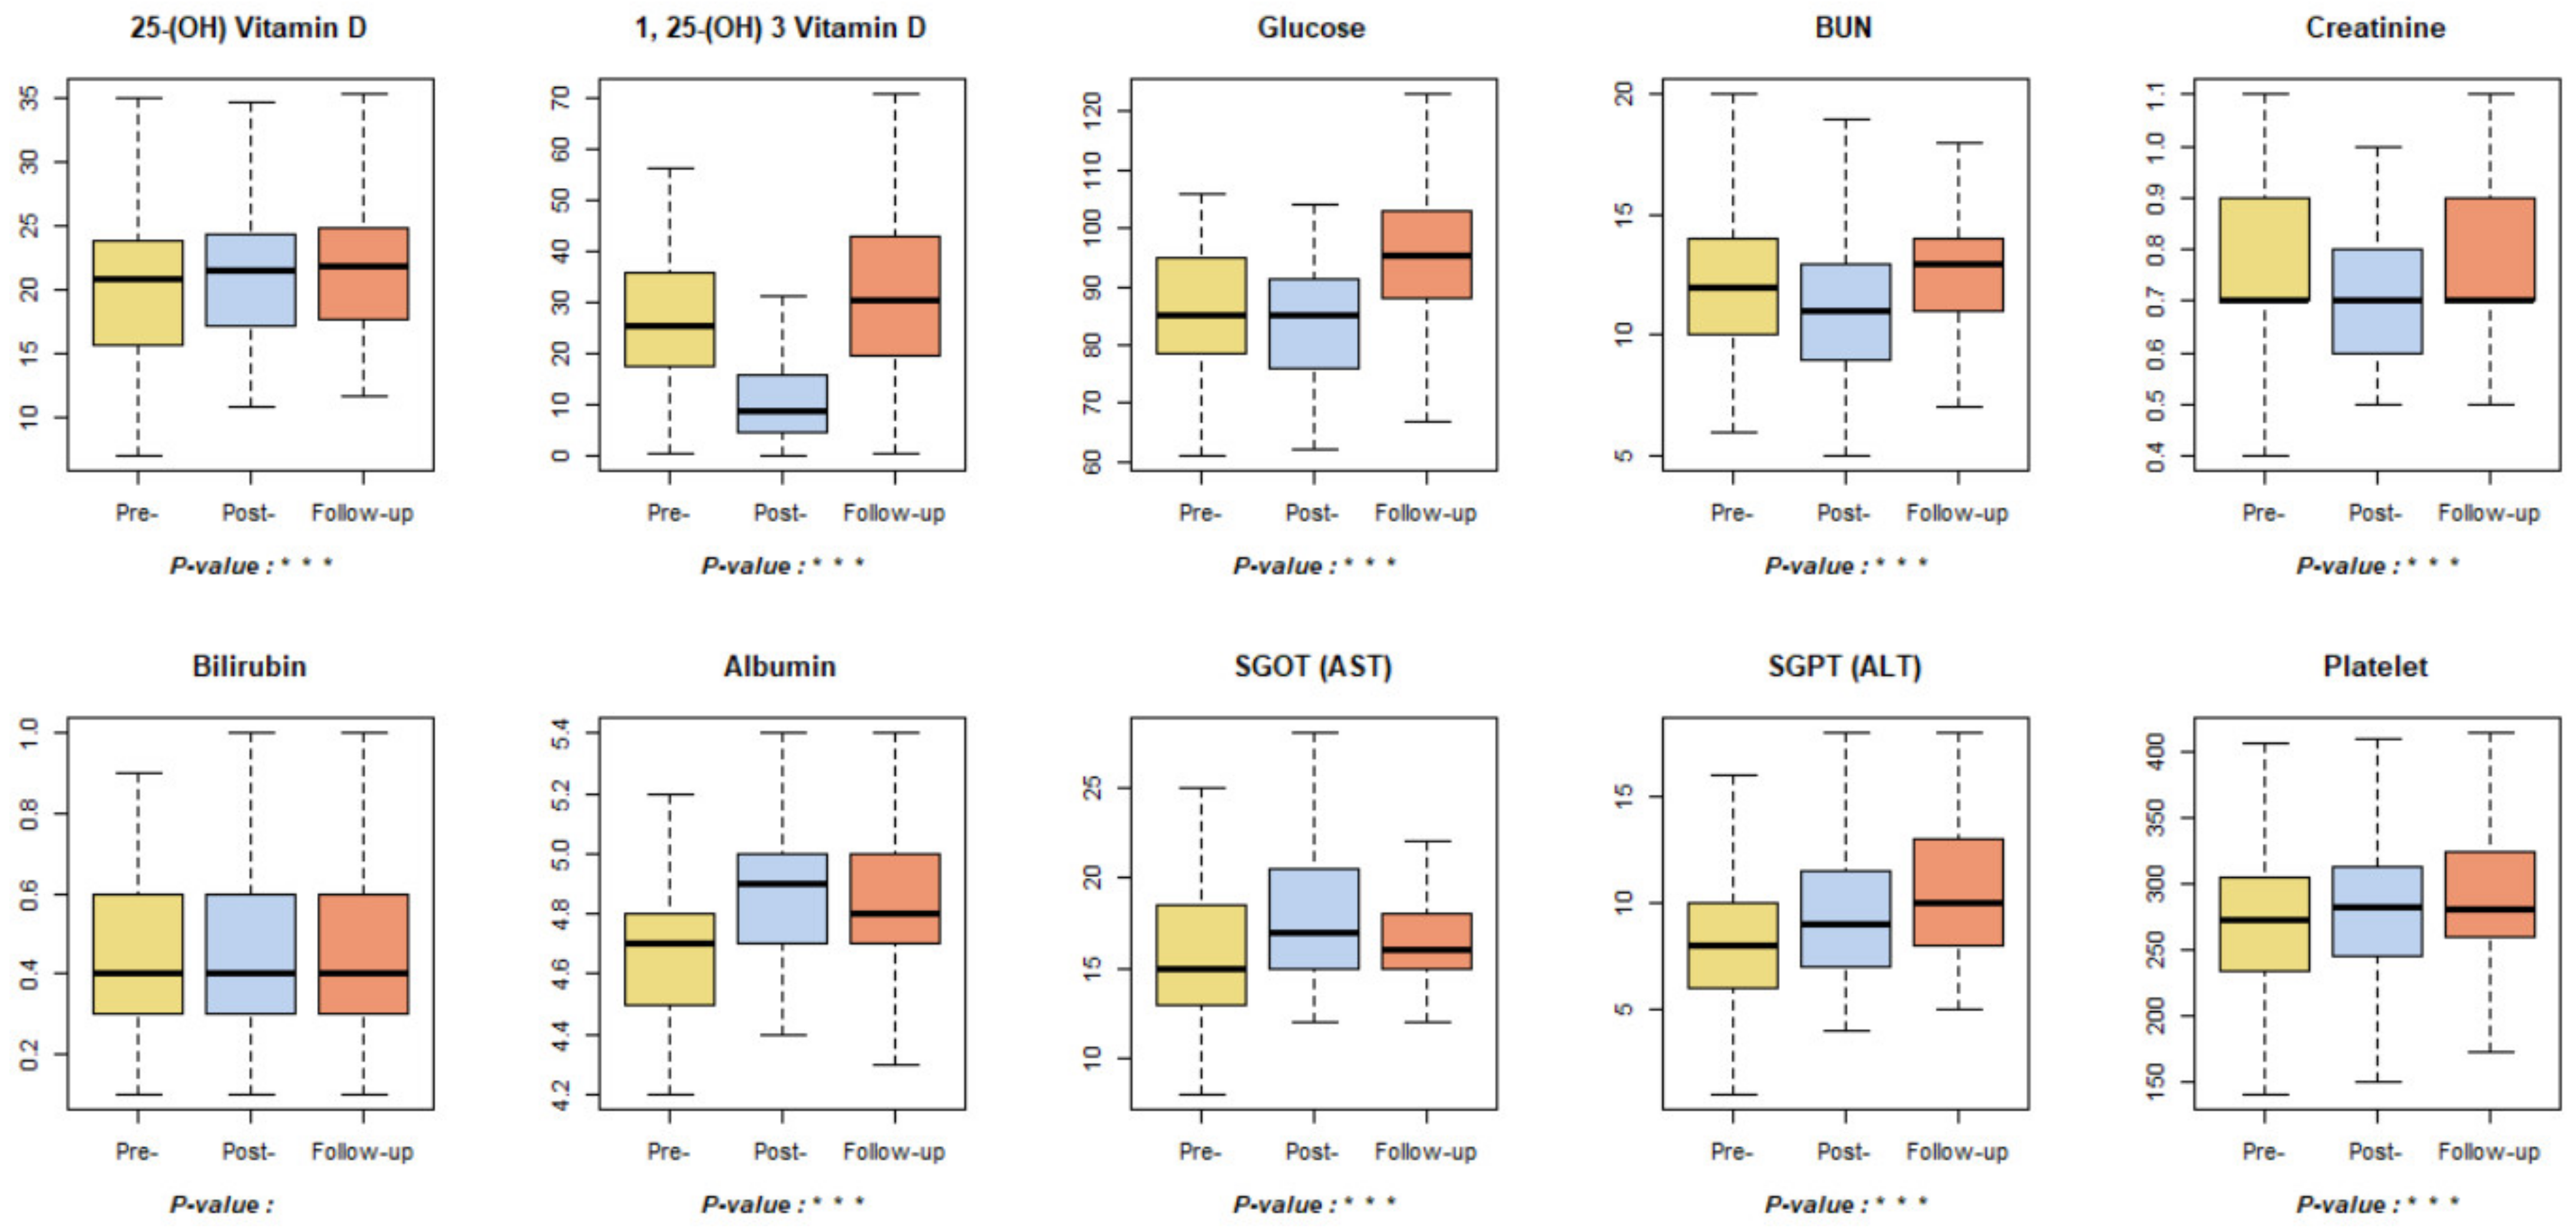
3.5. Health Screening Parameters
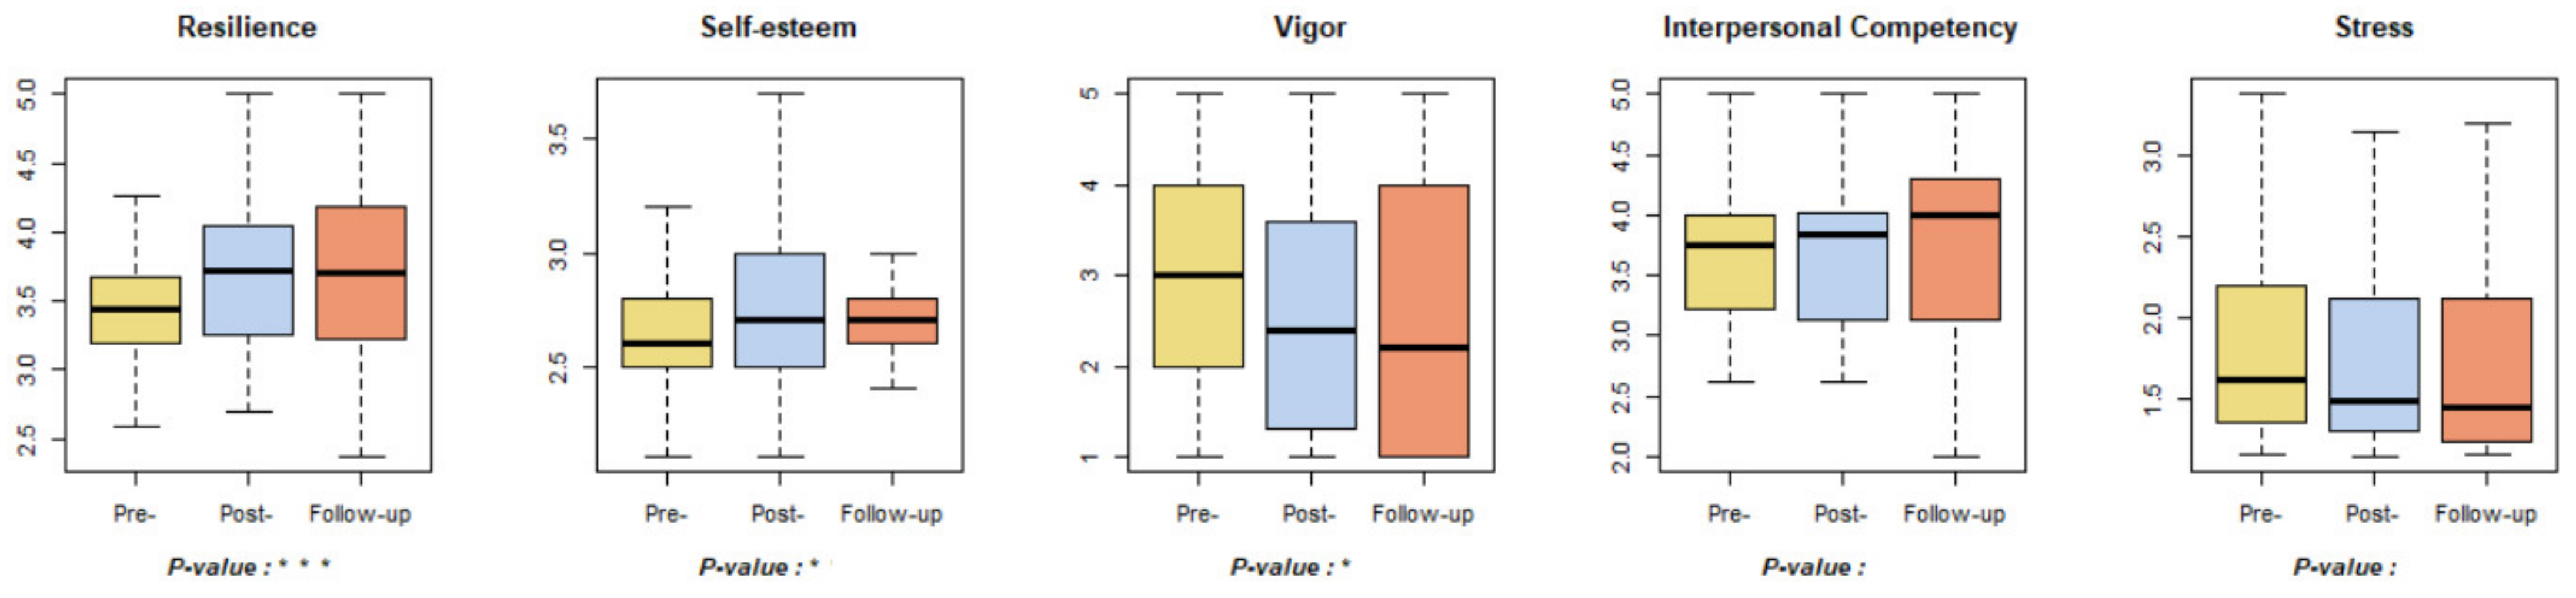
3.6. Mental Health
4. Discussion
5. Conclusions
Author Contributions
Funding
Institutional Review Board Statement
Informed Consent Statement
Data Availability Statement
Acknowledgments
Conflicts of Interest
Appendix A

| Classification | Indicators | Gender | Pre- | Post- | Follow-Up | p | Daily | Post- | p |
|---|---|---|---|---|---|---|---|---|---|
| M(SD) | M(SD) | M(SD) | M(SD) | M(SD) | |||||
| Blood Pressure and Autonomic Nervous System | Systolic BP | Total | 123.58(15.48) | 117.93(12.77) | 118.52(12.67) | *** | 121.05(14.33) | 117.93(12.77) | ** |
| Male | 127.49(15.58) | 120.04(13.66) | 122.78(13.45) | ** | 125.27(14.73) | 120.04(13.66) | ** | ||
| Female | 118.67(14.05) | 115.28(11.17) | 113.18(9.29) | * | 115.76(11.94) | 115.28(11.17) | |||
| Group 1 | 127.97(15.27) | 119.87(12.68) | 116.16(11.09) | *** | 121.92(14.73) | 119.87(12.68) | |||
| Group 2 | 129.00(15.26) | 116.45(14.30) | 125.21(12.93) | *** | 127.10(14.15) | 116.45(14.30) | *** | ||
| Group 3 | 113.62(10.41) | 117.48(11.14) | 114.59(11.52) | 114.10(10.90) | 117.48(11.14) | * | |||
| Diastolic BP | Total | 76.33(11.51) | 73.73(8.94) | 71.66(9.75) | *** | 73.99(10.89) | 73.73(8.94) | ||
| Male | 75.69(10.69) | 73.16(9.98) | 69.61(10.06) | *** | 72.74(10.82) | 73.16(9.98) | |||
| Female | 77.13(12.56) | 74.44(7.51) | 74.23(8.82) | 75.56(10.85) | 74.44(7.51) | ||||
| Group 1 | 74.84(13.72) | 72.87(7.64) | 70.06(11.61) | 72.23(12.83) | 72.87(7.64) | ||||
| Group 2 | 79.86(10.12) | 72.45(11.28) | 74.10(8.99) | *** | 76.98(9.93) | 72.45(11.28) | *** | ||
| Group 3 | 74.10(9.45) | 75.55(7.81) | 70.41(7.95) | ** | 72.83(9.03) | 75.55(7.81) | * | ||
| RMSSD | Total | 57.77(36.36) | 43.31(27.16) | 43.07(23.28) | *** | 50.42(31.32) | 43.31(27.16) | ** | |
| Male | 68.00(41.18) | 46.10(28.08) | 47.59(25.44) | *** | 57.86(35.54) | 46.10(28.08) | ** | ||
| Female | 44.92(24.09) | 39.79(25.90) | 37.38(19.07) | 41.08(21.90) | 39.79(25.90) | ||||
| Group 1 | 60.10(31.50) | 34.93(20.42) | 39.83(20.70) | *** | 49.97(28.33) | 34.93(20.42) | *** | ||
| Group 2 | 65.69(45.66) | 51.90(33.04) | 49.03(30.53) | 57.36(39.40) | 51.90(33.04) | ||||
| Group 3 | 47.45(28.53) | 43.38(24.85) | 40.45(15.91) | 43.95(23.16) | 43.38(24.85) | ||||
| LnTP | Total | 7.13(0.54) | 7.00(0.51) | 6.97(0.44) | * | 7.05(0.50) | 7.00(0.51) | ||
| Male | 7.33(0.56) | 7.10(0.48) | 7.07(0.42) | *** | 7.20(0.51) | 7.10(0.48) | * | ||
| Female | 6.87(0.41) | 6.87(0.53) | 6.84(0.43) | 6.85(0.41) | 6.87(0.53) | ||||
| Group 1 | 7.23(0.57) | 6.81(0.37) | 6.89(0.47) | *** | 7.06(0.55) | 6.81(0.37) | *** | ||
| Group 2 | 7.20(0.56) | 7.18(0.67) | 7.05(0.44) | 7.13(0.51) | 7.18(0.67) | ||||
| Group 3 | 6.93(0.45) | 7.01(0.39) | 6.98(0.39) | 6.96(0.42) | 7.01(0.39) | ||||
| LnLF | Total | 5.30(1.13) | 5.22(1.05) | 5.01(1.13) | 5.15(1.14) | 5.22(1.05) | |||
| Male | 5.69(1.04) | 5.42(1.01) | 5.27(1.05) | * | 5.48(1.06) | 5.42(1.01) | |||
| Female | 4.82(1.07) | 4.97(1.05) | 4.68(1.14) | 4.74(1.11) | 4.97(1.05) | ||||
| Group 1 | 5.35(1.09) | 4.78(0.82) | 4.92(1.15) | * | 5.14(1.13) | 4.78(0.82) | * | ||
| Group 2 | 5.52(1.19) | 5.53(1.33) | 5.11(1.18) | 5.31(1.19) | 5.53(1.33) | ||||
| Group 3 | 5.04(1.10) | 5.38(0.77) | 4.99(1.09) | 5.01(1.09) | 5.38(0.77) | ** | |||
| LnHF | Total | 5.12(1.15) | 4.72(0.98) | 4.76(1.02) | *** | 4.94(1.10) | 4.72(0.98) | ** | |
| Male | 5.45(1.04) | 4.83(0.97) | 4.95(1.00) | *** | 5.19(1.05) | 4.83(0.97) | *** | ||
| Female | 4.71(1.18) | 4.57(0.98) | 4.52(1.01) | 4.63(1.09) | 4.57(0.98) | ||||
| Group 1 | 5.41(1.04) | 4.47(0.81) | 4.60(1.04) | *** | 5.01(1.11) | 4.47(0.81) | *** | ||
| Group 2 | 5.14(1.23) | 4.96(1.18) | 4.86(1.16) | 5.00(1.19) | 4.96(1.18) | ||||
| Group 3 | 4.80(1.15) | 4.73(0.89) | 4.82(0.86) | 4.81(1.00) | 4.73(0.89) | ||||
| LnLF/LnHF | Total | 1.06(0.19) | 1.13(0.20) | 1.06(0.19) | ** | 1.06(0.19) | 1.13(0.20) | *** | |
| Male | 1.06(0.18) | 1.14(0.20) | 1.08(0.19) | * | 1.07(0.18) | 1.14(0.20) | ** | ||
| Female | 1.05(0.20) | 1.11(0.20) | 1.04(0.20) | 1.04(0.20) | 1.11(0.20) | ** | |||
| Group 1 | 1.00(0.17) | 1.09(0.22) | 1.08(0.14) | 1.04(0.16) | 1.09(0.22) | ||||
| Group 2 | 1.09(0.20) | 1.13(0.18) | 1.07(0.23) | 1.08(0.21) | 1.13(0.18) | ||||
| Group 3 | 1.07(0.19) | 1.16(0.18) | 1.05(0.21) | * | 1.06(0.20) | 1.16(0.18) | *** | ||
| pNN50 | Total | 67.10(15.87) | 62.84(16.84) | 64.27(17.08) | 65.69(16.50) | 62.84(16.84) | * | ||
| Male | 71.12(11.61) | 62.94(16.38) | 64.18(17.16) | *** | 67.74(15.05) | 62.94(16.38) | ** | ||
| Female | 62.05(18.96) | 62.72(17.60) | 64.38(17.19) | 63.10(17.93) | 62.72(17.60) | ||||
| Group 1 | 71.43(18.08) | 59.33(17.46) | 59.00(20.49) | ** | 65.22(20.16) | 59.33(17.46) | * | ||
| Group 2 | 65.55(16.32) | 67.03(16.92) | 64.24(16.36) | 64.90(16.21) | 67.03(16.92) | ||||
| Group 3 | 64.17(12.10) | 62.28(15.71) | 69.76(11.95) | * | 66.97(12.25) | 62.28(15.71) | * | ||
| Immune Function and Inflammation | CD16+CD56 (Count) | Total | 317.12(155.53) | 279.06(139.67) | 320.12(180.46) | * | 318.62(167.98) | 279.06(139.67) | *** |
| Male | 294.24(129.07) | 272.09(146.09) | 314.72(198.45) | 308.81(163.74) | 272.09(146.09) | * | |||
| Female | 345.85(181.14) | 287.81(132.51) | 326.92(157.24) | 330.94(173.42) | 287.81(132.51) | ** | |||
| Group 1 | 301.49(152.92) | 318.63(159.84) | 364.00(172.09) | ** | 332.74(164.45) | 318.63(159.84) | |||
| Group 2 | 284.50(155.22) | 250.83(108.97) | 268.57(204.46) | 276.53(180.10) | 250.83(108.97) | ||||
| Group 3 | 365.90(151.71) | 266.35(140.01) | 326.28(154.44) | ** | 346.09(153.04) | 266.35(140.01) | *** | ||
| CD16+CD56 (WB) | Total | 14.13(6.06) | 12.49(5.22) | 12.49(5.87) | ** | 13.31(6.00) | 12.49(5.22) | * | |
| Male | 13.61(5.23) | 12.35(5.63) | 12.56(6.82) | 13.28(5.94) | 12.35(5.63) | ||||
| Female | 14.79(6.97) | 12.67(4.70) | 12.40(4.48) | * | 13.36(6.12) | 12.67(4.70) | |||
| Group 1 | 13.53(6.24) | 14.66(6.35) | 15.01(5.97) | 14.27(6.10) | 14.66(6.35) | ||||
| Group 2 | 15.27(7.36) | 11.48(4.26) | 9.96(5.84) | *** | 12.61(7.11) | 11.48(4.26) | |||
| Group 3 | 13.62(4.18) | 11.25(4.12) | 12.42(4.73) | * | 13.02(4.47) | 11.25(4.12) | ** | ||
| IFN-γ HS M_Multiplex | Total | 31.81(15.90) | 32.52(21.35) | 34.86(18.51) | * | 33.33(17.27) | 32.52(21.35) | ||
| Male | 29.30(12.48) | 27.08(10.51) | 30.51(14.12) | * | 29.67(13.46) | 27.08(10.51) | *** | ||
| Female | 34.96(19.08) | 39.34(28.60) | 40.32(21.85) | 37.94(20.28) | 39.34(28.60) | ||||
| Group 1 | 28.44(11.72) | 29.47(13.63) | 36.11(15.70) | *** | 32.28(14.27) | 29.47(13.63) | ** | ||
| Group 2 | 32.47(12.38) | 26.74(9.21) | 33.75(16.38) | ** | 33.11(14.40) | 26.74(9.21) | *** | ||
| Group 3 | 34.64(21.67) | 41.45(31.81) | 34.67(23.20) | * | 34.66(22.25) | 41.45(31.81) | ** | ||
| TNF-α HS M_Multiplex | Total | 16.50(3.80) | 14.46(3.75) | 14.16(3.73) | *** | 15.33(3.93) | 14.46(3.75) | ** | |
| Male | 17.40(4.31) | 14.96(4.17) | 14.55(4.24) | *** | 16.08(4.46) | 14.96(4.17) | ** | ||
| Female | 15.36(2.68) | 13.84(3.09) | 13.67(2.96) | ** | 14.38(2.90) | 13.84(3.09) | |||
| Group 1 | 16.11(2.99) | 14.66(3.52) | 15.50(3.56) | * | 15.80(3.28) | 14.66(3.52) | ** | ||
| Group 2 | 17.66(3.81) | 12.84(3.36) | 13.22(2.57) | *** | 15.44(3.92) | 12.84(3.36) | *** | ||
| Group 3 | 15.74(4.34) | 15.88(3.83) | 13.71(4.52) | ** | 14.73(4.51) | 15.88(3.83) | * | ||
| IL-4 HS M_Multiplex | Total | 84.64(58.53) | 81.81(60.05) | 78.72(58.69) | 81.68(58.52) | 81.81(60.05) | |||
| Male | 80.06(50.30) | 74.46(44.46) | 74.56(48.07) | 76.71(49.46) | 74.46(44.46) | ||||
| Female | 90.40(67.71) | 91.04(74.84) | 83.95(70.12) | 87.93(68.04) | 91.04(74.84) | ||||
| Group 1 | 69.28(40.10) | 70.40(48.18) | 83.04(44.94) | ** | 76.16(42.80) | 70.40(48.18) | |||
| Group 2 | 100.70(67.04) | 77.72(48.14) | 88.74(60.56) | *** | 94.72(63.60) | 77.72(48.14) | *** | ||
| Group 3 | 84.48(62.96) | 97.70(77.87) | 64.24(67.84) | *** | 74.36(65.67) | 97.70(77.87) | *** | ||
| IL-8 M_Multiplex | Total | 20.52(24.31) | 73.70(81.42) | 20.94(27.62) | *** | 20.73(25.95) | 73.70(81.42) | *** | |
| Male | 20.71(26.97) | 80.70(77.90) | 22.80(34.68) | *** | 21.63(30.97) | 80.70(77.90) | *** | ||
| Female | 20.28(20.84) | 64.91(85.85) | 18.60(14.75) | *** | 19.60(17.87) | 64.91(85.85) | *** | ||
| Group 1 | 12.12(9.71) | 118.79(107.18) | 17.13(11.13) | *** | 14.73(10.68) | 118.79(107.18) | *** | ||
| Group 2 | 16.81(11.16) | 78.00(56.71) | 13.40(12.56) | *** | 15.11(11.90) | 78.00(56.71) | *** | ||
| Group 3 | 32.91(36.96) | 22.76(24.52) | 32.21(43.37) | * | 32.56(39.94) | 22.76(24.52) | ** | ||
| IgA(S) | Total | 183.66(65.05) | 183.11(62.12) | 179.10(59.99) | 181.38(62.43) | 183.11(62.12) | |||
| Male | 185.88(52.14) | 186.89(51.90) | 181.27(49.37) | ** | 183.04(50.69) | 186.89(51.90) | * | ||
| Female | 180.87(78.99) | 178.37(73.42) | 176.38(71.75) | 179.29(74.92) | 178.37(73.42) | ||||
| Group 1 | 178.43(54.04) | 180.78(52.18) | 178.06(52.73) | 178.25(52.94) | 180.78(52.18) | * | |||
| Group 2 | 182.48(57.38) | 181.32(54.42) | 175.86(53.26) | ** | 179.17(54.97) | 181.32(54.42) | |||
| Group 3 | 190.25(82.18) | 187.31(78.61) | 183.42(73.72) | 186.84(77.46) | 187.31(78.61) | ||||
| eNO | Total | 15.93(18.53) | 17.33(19.62) | 16.10(16.12) | 16.02(17.32) | 17.33(19.62) | * | ||
| Male | 18.41(22.09) | 20.39(24.06) | 19.10(19.77) | 18.40(20.88) | 20.39(24.06) | ||||
| Female | 12.82(12.33) | 13.49(11.09) | 12.41(8.70) | 13.03(10.78) | 13.49(11.09) | ||||
| Group 1 | 13.42(8.66) | 16.23(12.12) | 13.52(8.23) | * | 13.05(8.15) | 16.23(12.12) | * | ||
| Group 2 | 22.21(29.68) | 22.43(29.44) | 18.68(22.15) | * | 20.23(25.58) | 22.43(29.44) | * | ||
| Group 3 | 13.17(9.48) | 15.14(14.92) | 16.59(15.77) | 14.88(13.01) | 15.14(14.92) | ||||
| Basophil | Total | 0.90(0.39) | 0.71(0.29) | 0.76(0.32) | *** | 0.83(0.37) | 0.71(0.29) | *** | |
| Male | 0.95(0.39) | 0.76(0.25) | 0.78(0.36) | *** | 0.88(0.38) | 0.76(0.25) | * | ||
| Female | 0.85(0.39) | 0.64(0.32) | 0.74(0.28) | ** | 0.77(0.34) | 0.64(0.32) | *** | ||
| Group 1 | 0.74(0.33) | 0.74(0.33) | 0.75(0.35) | 0.74(0.34) | 0.74(0.33) | ||||
| Group 2 | 1.22(0.37) | 0.69(0.25) | 0.83(0.32) | *** | 1.03(0.39) | 0.69(0.25) | *** | ||
| Group 3 | 0.76(0.27) | 0.69(0.29) | 0.70(0.30) | 0.73(0.28) | 0.69(0.29) | ||||
| Lymphocyte | Total | 36.14(9.08) | 36.14(8.80) | 35.75(8.13) | 35.95(8.60) | 36.14(8.80) | |||
| Male | 36.83(9.35) | 37.15(8.10) | 36.64(8.52) | 37.03(8.79) | 37.15(8.10) | ||||
| Female | 35.28(8.77) | 34.87(9.57) | 34.63(7.58) | 34.59(8.20) | 34.87(9.57) | ||||
| Group 1 | 32.66(8.34) | 37.59(8.77) | 35.82(7.12) | ** | 34.24(7.85) | 37.59(8.77) | ** | ||
| Group 2 | 39.41(10.74) | 36.59(9.01) | 35.98(9.58) | * | 37.69(10.24) | 36.59(9.01) | |||
| Group 3 | 36.48(6.68) | 34.19(8.58) | 35.44(7.81) | 35.96(7.22) | 34.19(8.58) | ||||
| Eosinophil | Total | 2.34(1.84) | 3.03(2.27) | 2.52(2.61) | ** | 2.43(2.25) | 3.03(2.27) | *** | |
| Male | 2.53(1.92) | 3.21(2.37) | 2.79(3.25) | 2.67(2.66) | 3.21(2.37) | * | |||
| Female | 2.10(1.73) | 2.79(2.14) | 2.17(1.41) | ** | 2.12(1.56) | 2.79(2.14) | *** | ||
| Group 1 | 1.88(1.74) | 3.11(2.52) | 2.48(1.89) | *** | 2.18(1.82) | 3.11(2.52) | *** | ||
| Group 2 | 2.90(2.17) | 3.14(2.13) | 2.30(1.55) | ** | 2.60(1.89) | 3.14(2.13) | ** | ||
| Group 3 | 2.27(1.46) | 2.82(2.19) | 2.77(3.86) | 2.52(2.90) | 2.82(2.19) | ||||
| Monocyte | Total | 8.45(2.14) | 8.22(1.82) | 7.57(1.63) | *** | 8.01(1.95) | 8.22(1.82) | ||
| Male | 8.61(2.07) | 8.79(1.83) | 7.88(1.70) | ** | 8.32(1.92) | 8.79(1.83) | * | ||
| Female | 8.25(2.23) | 7.51(1.55) | 7.17(1.47) | *** | 7.62(1.92) | 7.51(1.55) | |||
| Group 1 | 7.81(1.82) | 8.32(1.88) | 7.26(1.43) | * | 7.54(1.65) | 8.32(1.88) | ** | ||
| Group 2 | 9.61(2.28) | 8.12(1.82) | 7.64(1.36) | *** | 8.63(2.11) | 8.12(1.82) | |||
| Group 3 | 7.96(1.86) | 8.22(1.82) | 7.81(2.03) | 7.88(1.93) | 8.22(1.82) | ||||
| Oxidative Stress and Antioxidant | 8-OHdG | Total | 12.31(6.96) | 13.14(5.89) | 11.92(5.93) | 12.11(6.45) | 13.14(5.89) | ||
| Male | 12.75(6.37) | 12.98(5.95) | 11.70(6.16) | 12.13(6.25) | 12.98(5.95) | ||||
| Female | 11.75(7.69) | 13.35(5.89) | 11.90(5.99) | 12.09(6.73) | 13.35(5.89) | * | |||
| Group 1 | 11.73(5.95) | 14.69(6.59) | 12.47(6.52) | 12.10(6.20) | 14.69(6.59) | * | |||
| Group 2 | 11.60(6.78) | 12.95(6.56) | 11.43(5.87) | 11.52(6.29) | 12.95(6.56) | ||||
| Group 3 | 13.61(8.08) | 11.73(3.91) | 11.42(5.91) | 12.72(6.90) | 11.73(3.91) | ||||
| d-ROMs | Total | 311.01(64.73) | 312.82(64.74) | 314.88(64.92) | 312.94(64.67) | 312.82(64.74) | |||
| Male | 299.88(57.26) | 297.33(61.65) | 299.24(58.55) | 296.56(54.35) | 297.33(61.65) | ||||
| Female | 325.00(71.34) | 332.28(64.01) | 334.51(67.89) | 333.53(70.80) | 332.28(64.01) | ||||
| Group 1 | 314.60(62.27) | 320.30(66.39) | 319.83(65.82) | 317.22(63.58) | 320.30(66.39) | ||||
| Group 2 | 314.24(72.53) | 314.90(68.87) | 307.45(73.36) | 310.84(72.38) | 314.90(68.87) | ||||
| Group 3 | 304.07(60.55) | 303.00(59.59) | 317.17(56.02) | * | 310.62(58.19) | 303.00(59.59) | |||
| BAP | Total | 2133.88(156.87) | 2182.43(162.15) | 1944.57(229.48) | *** | 2039.22(217.77) | 2182.43(162.15) | *** | |
| Male | 2180.98(146.73) | 2227.69(158.84) | 1973.63(231.93) | *** | 2078.82(220.65) | 2227.69(158.84) | *** | ||
| Female | 2074.69(150.63) | 2125.56(149.55) | 1908.05(223.96) | *** | 1989.47(204.82) | 2125.56(149.55) | *** | ||
| Group 1 | 2138.30(140.26) | 2171.33(166.45) | 1840.37(131.38) | *** | 1989.33(201.80) | 2171.33(166.45) | *** | ||
| Group 2 | 2130.21(173.30) | 2176.17(148.53) | 1850.76(204.81) | *** | 1990.48(235.00) | 2176.17(148.53) | *** | ||
| Group 3 | 2132.97(161.29) | 2200.17(174.47) | 2146.17(202.37) | 2139.57(181.50) | 2200.17(174.47) | ** | |||
| Stress (Hormone) | Cortisol (CIA) | Total | 6.43(2.47) | 6.62(2.64) | 6.59(2.91) | 6.51(2.69) | 6.62(2.64) | ||
| Male | 6.41(2.51) | 6.62(2.81) | 6.59(3.38) | 6.50(2.99) | 6.62(2.81) | ||||
| Female | 6.33(2.60) | 6.61(2.44) | 6.59(2.21) | 6.54(2.29) | 6.61(2.44) | ||||
| Group 1 | 5.81(2.78) | 6.23(2.54) | 5.55(1.96) | 5.79(2.27) | 6.23(2.54) | ||||
| Group 2 | 6.74(2.26) | 6.34(2.78) | 7.32(3.20) | 7.03(2.76) | 6.34(2.78) | ||||
| Group 3 | 6.55(2.61) | 7.30(2.55) | 6.94(3.19) | 6.74(2.90) | 7.30(2.55) | ||||
| Cortisol (Saliva) | Total | 0.10(0.08) | 0.10(0.06) | 0.11(0.07) | - | 0.11(0.07) | 0.10(0.06) | ||
| Male | 0.09(0.07) | 0.10(0.05) | 0.11(0.07) | - | 0.10(0.07) | 0.10(0.05) | |||
| Female | 0.11(0.09) | 0.09(0.06) | 0.11(0.06) | - | 0.11(0.07) | 0.09(0.06) | |||
| Group 1 | 0.09(0.09) | 0.10(0.03) | 0.10(0.05) | - | 0.09(0.06) | 0.10(0.03) | |||
| Group 2 | 0.09(0.05) | 0.07(0.04) | 0.15(0.09) | - | 0.12(0.08) | 0.07(0.04) | ** | ||
| Group 3 | 0.10(0.09) | 0.11(0.07) | 0.10(0.05) | - | 0.10(0.07) | 0.11(0.07) | |||
| Serotonin | Total | 145.97(48.27) | 150.45(62.59) | 168.88(62.81) | *** | 157.42(57.02) | 150.45(62.59) | * | |
| Male | 145.72(45.27) | 150.61(62.41) | 175.00(67.87) | *** | 161.04(58.94) | 150.61(62.41) | * | ||
| Female | 146.28(52.39) | 150.25(63.63) | 161.18(55.70) | 152.87(54.55) | 150.25(63.63) | ||||
| Group 1 | 152.26(44.52) | 138.55(41.34) | 177.58(50.76) | *** | 164.92(49.03) | 138.55(41.34) | *** | ||
| Group 2 | 155.76(52.38) | 186.54(79.57) | 192.77(74.88) | *** | 174.26(66.71) | 186.54(79.57) | |||
| Group 3 | 129.68(45.01) | 126.67(44.53) | 135.98(46.78) | * | 132.83(45.61) | 126.67(44.53) | |||
| Health Screening Parameters | 25-(OH) Vitamin D | Total | 20.03(6.10) | 21.11(5.60) | 21.72(5.38) | *** | 20.88(5.79) | 21.11(5.60) | |
| Male | 21.86(6.03) | 22.98(5.51) | 23.48(4.87) | *** | 22.74(5.39) | 22.98(5.51) | |||
| Female | 17.74(5.43) | 18.76(4.82) | 19.52(5.23) | ** | 18.54(5.45) | 18.76(4.82) | |||
| Group 1 | 21.89(7.08) | 21.31(6.59) | 21.72(6.53) | 21.81(6.75) | 21.31(6.59) | * | |||
| Group 2 | 19.62(4.47) | 21.15(5.02) | 21.63(4.59) | *** | 20.63(4.60) | 21.15(5.02) | |||
| Group 3 | 18.52(6.11) | 20.86(5.21) | 21.81(4.97) | *** | 20.17(5.76) | 20.86(5.21) | |||
| 1, 25-(OH) 3 Vitamin D | Total | 27.60(15.72) | 13.81(15.64) | 32.06(19.26) | *** | 29.83(17.67) | 13.81(15.64) | *** | |
| Male | 29.64(15.68) | 16.74(18.36) | 33.38(19.46) | *** | 31.63(17.54) | 16.74(18.36) | *** | ||
| Female | 25.03(15.59) | 10.13(10.45) | 30.42(19.13) | *** | 27.57(17.69) | 10.13(10.45) | *** | ||
| Group 1 | 29.18(16.63) | 8.53(7.23) | 23.37(16.7) | *** | 26.28(16.48) | 8.53(7.23) | *** | ||
| Group 2 | 27.86(14.34) | 23.16(22.31) | 22.97(12.12) | 25.41(13.39) | 23.16(22.31) | ||||
| Group 3 | 25.69(16.41) | 9.93(8.49) | 50.16(15.25) | *** | 37.93(19.97) | 9.93(8.49) | *** | ||
| Glucose | Total | 86.40(11.97) | 83.77(9.75) | 96.59(13.74) | *** | 91.49(13.83) | 83.77(9.75) | *** | |
| Male | 86.04(11.33) | 85.24(9.88) | 97.67(13.96) | *** | 91.47(13.82) | 85.24(9.88) | *** | ||
| Female | 86.85(12.86) | 81.92(9.38) | 95.23(13.51) | *** | 91.53(13.92) | 81.92(9.38) | *** | ||
| Group 1 | 83.77(12.40) | 80.80(9.48) | 97.63(13.27) | *** | 90.70(14.53) | 80.80(9.48) | *** | ||
| Group 2 | 88.62(9.33) | 87.76(8.96) | 98.93(10.60) | *** | 93.78(11.18) | 87.76(8.96) | ** | ||
| Group 3 | 86.90(13.63) | 82.86(9.76) | 93.17(16.51) | * | 90.03(15.34) | 82.86(9.76) | ** | ||
| BUN | Total | 12.17(3.06) | 11.03(2.68) | 12.53(2.60) | *** | 12.35(2.84) | 11.03(2.68) | *** | |
| Male | 12.65(2.88) | 11.29(2.18) | 12.92(2.52) | *** | 12.82(2.68) | 11.29(2.18) | *** | ||
| Female | 11.56(3.21) | 10.72(3.19) | 12.05(2.67) | * | 11.77(2.94) | 10.72(3.19) | *** | ||
| Group 1 | 11.23(2.86) | 9.97(2.85) | 13.27(3.05) | *** | 12.25(3.11) | 9.97(2.85) | *** | ||
| Group 2 | 11.90(3.02) | 10.93(2.51) | 11.62(2.51) | 11.76(2.75) | 10.93(2.51) | * | |||
| Group 3 | 13.41(2.98) | 12.24(2.20) | 12.69(1.91) | 13.05(2.51) | 12.24(2.20) | * | |||
| Creatinine | Total | 0.76(0.15) | 0.73(0.14) | 0.77(0.14) | *** | 0.77(0.15) | 0.73(0.14) | *** | |
| Male | 0.82(0.15) | 0.78(0.14) | 0.82(0.14) | ** | 0.83(0.14) | 0.78(0.14) | *** | ||
| Female | 0.69(0.13) | 0.66(0.10) | 0.70(0.12) | * | 0.69(0.11) | 0.66(0.10) | *** | ||
| Group 1 | 0.73(0.16) | 0.73(0.15) | 0.76(0.16) | 0.75(0.16) | 0.73(0.15) | ||||
| Group 2 | 0.78(0.15) | 0.75(0.12) | 0.79(0.13) | * | 0.79(0.14) | 0.75(0.12) | ** | ||
| Group 3 | 0.78(0.15) | 0.70(0.13) | 0.76(0.14) | *** | 0.77(0.15) | 0.70(0.13) | *** | ||
| Bilirubin | Total | 0.46(0.24) | 0.47(0.24) | 0.49(0.29) | 0.47(0.27) | 0.47(0.24) | |||
| Male | 0.51(0.23) | 0.51(0.25) | 0.53(0.29) | 0.52(0.26) | 0.51(0.25) | ||||
| Female | 0.39(0.23) | 0.43(0.22) | 0.43(0.29) | 0.41(0.26) | 0.43(0.22) | ||||
| Group 1 | 0.47(0.26) | 0.51(0.25) | 0.52(0.28) | 0.49(0.27) | 0.51(0.25) | ||||
| Group 2 | 0.54(0.24) | 0.48(0.20) | 0.51(0.28) | 0.52(0.26) | 0.48(0.20) | ||||
| Group 3 | 0.36(0.17) | 0.44(0.26) | 0.43(0.32) | 0.40(0.26) | 0.44(0.26) | ||||
| Albumin | Total | 4.65(0.23) | 4.87(0.23) | 4.86(0.28) | *** | 4.76(0.28) | 4.87(0.23) | *** | |
| Male | 4.67(0.24) | 4.91(0.23) | 4.88(0.27) | *** | 4.78(0.28) | 4.91(0.23) | *** | ||
| Female | 4.63(0.22) | 4.82(0.21) | 4.84(0.29) | *** | 4.72(0.27) | 4.82(0.21) | ** | ||
| Group 1 | 4.63(0.27) | 4.79(0.22) | 4.80(0.23) | *** | 4.71(0.27) | 4.79(0.22) | ** | ||
| Group 2 | 4.59(0.19) | 4.90(0.20) | 4.75(0.24) | *** | 4.67(0.23) | 4.90(0.20) | *** | ||
| Group 3 | 4.74(0.20) | 4.92(0.24) | 5.03(0.29) | *** | 4.89(0.29) | 4.92(0.24) | |||
| SGOT (AST) | Total | 15.72(3.57) | 18.58(5.17) | 17.59(5.11) | *** | 16.65(4.49) | 18.58(5.17) | *** | |
| Male | 16.35(3.45) | 19.51(5.25) | 18.43(5.34) | *** | 17.62(4.85) | 19.51(5.25) | *** | ||
| Female | 14.92(3.59) | 17.41(4.89) | 16.54(4.65) | ** | 15.44(3.67) | 17.41(4.89) | ** | ||
| Group 1 | 16.60(3.63) | 19.53(6.28) | 17.97(5.82) | ** | 17.28(4.86) | 19.53(6.28) | *** | ||
| Group 2 | 15.38(3.20) | 19.24(5.06) | 17.10(4.47) | *** | 16.24(3.95) | 19.24(5.06) | *** | ||
| Group 3 | 15.14(3.79) | 16.93(3.51) | 17.69(5.06) | ** | 16.41(4.61) | 16.93(3.51) | |||
| SGPT (ALT) | Total | 8.49(4.48) | 11.00(7.86) | 11.90(7.32) | *** | 10.19(6.29) | 11.00(7.86) | ||
| Male | 9.04(4.71) | 12.02(8.12) | 12.31(6.83) | *** | 11.16(6.94) | 12.02(8.12) | * | ||
| Female | 7.79(4.14) | 9.72(7.43) | 11.38(7.96) | *** | 8.97(5.16) | 9.72(7.43) | |||
| Group 1 | 8.90(4.57) | 11.23(10.26) | 10.30(6.93) | 9.60(5.86) | 11.23(10.26) | * | |||
| Group 2 | 9.28(5.16) | 12.45(7.92) | 13.69(8.34) | ** | 11.48(7.22) | 12.45(7.92) | |||
| Group 3 | 7.28(3.45) | 9.31(3.87) | 11.76(6.42) | *** | 9.52(5.59) | 9.31(3.87) | |||
| Platelet | Total | 272.75(67.65) | 282.78(68.62) | 288.07(65.45) | *** | 280.41(66.81) | 282.78(68.62) | ||
| Male | 262.27(61.68) | 281.53(68.36) | 284.35(60.26) | ** | 275.21(61.04) | 281.53(68.36) | |||
| Female | 279.64(74.74) | 284.36(69.81) | 292.74(71.97) | 286.94(73.31) | 284.36(69.81) | ||||
| Group 1 | 287.10(73.99) | 285.37(74.17) | 282.43(73.81) | 284.77(73.31) | 285.37(74.17) | ||||
| Group 2 | 245.38(53.63) | 270.31(57.19) | 279.66(58.92) | *** | 262.52(58.46) | 270.31(57.19) | * | ||
| Group 3 | 285.28(67.19) | 292.59(73.44) | 302.31(62.27) | 293.79(64.78) | 292.59(73.44) | ||||
| Mental Health | Resilience | Total | 3.45(0.42) | 3.72(0.55) | 3.72(0.61) | *** | 3.59(0.54) | 3.72(0.55) | *** |
| Male | 3.51(0.41) | 3.81(0.56) | 3.72(0.58) | *** | 3.62(0.51) | 3.81(0.56) | *** | ||
| Female | 3.38(0.42) | 3.62(0.53) | 3.71(0.65) | *** | 3.55(0.57) | 3.62(0.53) | |||
| Group 1 | 3.30(0.31) | 3.26(0.36) | 3.26(0.49) | 3.56(0.55) | 3.26(0.36) | ||||
| Group 2 | 3.29(0.38) | 3.44(0.39) | 3.37(0.47) | 3.54(0.52) | 3.44(0.39) | *** | |||
| Group 3 | 3.27(0.37) | 3.40(0.40) | 3.52(0.46) | ** | 3.65(0.54) | 3.40(0.40) | ** | ||
| Self-esteem | Total | 2.64(0.33) | 2.73(0.32) | 2.74(0.34) | * | 2.69(0.34) | 2.73(0.32) | ||
| Male | 2.71(0.33) | 2.80(0.34) | 2.77(0.36) | 2.74(0.34) | 2.80(0.34) | ||||
| Female | 2.55(0.32) | 2.64(0.28) | 2.69(0.32) | * | 2.62(0.33) | 2.64(0.28) | |||
| Group 1 | 2.83(0.47) | 2.85(0.54) | 2.86(0.54) | 2.73(0.32) | 2.85(0.54) | ||||
| Group 2 | 3.01(0.45) | 2.96(0.43) | 2.99(0.46) | 2.64(0.37) | 2.96(0.43) | *** | |||
| Group 3 | 2.97(0.38) | 2.98(0.34) | 2.99(0.44) | 2.70(0.34) | 2.98(0.34) | ||||
| Vigor | Total | 3.05(1.28) | 2.67(1.39) | 2.63(1.47) | * | 2.84(1.39) | 2.67(1.39) | ||
| Male | 3.02(1.30) | 2.79(1.43) | 2.75(1.51) | 2.88(1.41) | 2.79(1.43) | ||||
| Female | 3.09(1.26) | 2.51(1.33) | 2.47(1.42) | ** | 2.78(1.37) | 2.51(1.33) | |||
| Group 1 | 2.87(1.32) | 2.50(1.28) | 2.65(1.37) | 2.76(1.34) | 2.50(1.28) | ||||
| Group 2 | 3.06(1.21) | 3.08(1.56) | 2.66(1.59) | 2.86(1.42) | 3.08(1.56) | ||||
| Group 3 | 3.22(1.31) | 2.42(1.24) | 2.57(1.49) | 2.90(1.43) | 2.42(1.24) | * | |||
| Interpersonal Competency | Total | 3.74(0.63) | 3.79(0.70) | 3.84(0.75) | 3.79(0.69) | 3.79(0.70) | |||
| Male | 3.83(0.58) | 3.86(0.68) | 3.86(0.75) | 3.84(0.67) | 3.86(0.68) | ||||
| Female | 3.63(0.68) | 3.70(0.73) | 3.83(0.76) | 3.73(0.73) | 3.70(0.73) | ||||
| Group 1 | 3.69(0.59) | 3.69(0.82) | 3.69(0.82) | 3.68(0.71) | 3.69(0.82) | ||||
| Group 2 | 3.83(0.69) | 3.80(0.67) | 3.81(0.80) | 3.81(0.74) | 3.80(0.67) | ||||
| Group 3 | 3.71(0.62) | 3.90(0.68) | 4.05(0.60) | ** | 3.88(0.63) | 3.90(0.68) | |||
| Stress | Total | 1.87(0.68) | 1.82(0.70) | 1.80(0.74) | 1.84(0.71) | 1.82(0.70) | |||
| Male | 1.84(0.69) | 1.84(0.68) | 1.80(0.68) | 1.82(0.68) | 1.84(0.68) | ||||
| Female | 1.91(0.67) | 1.80(0.73) | 1.81(0.81) | 1.86(0.74) | 1.80(0.73) | ||||
| Group 1 | 1.95(0.91) | 2.01(0.90) | 1.81(0.87) | 1.98(0.75) | 2.01(0.90) | ||||
| Group 2 | 1.68(0.72) | 1.48(0.71) | 1.62(0.96) | 1.77(0.74) | 1.48(0.71) | ||||
| Group 3 | 1.67(0.72) | 1.59(0.69) | 1.58(0.69) | 1.76(0.61) | 1.59(0.69) |
Appendix B
| Indicators | Group | Difference | Lower CI | Upper CI | p | ||
|---|---|---|---|---|---|---|---|
| Physical Examination | Systolic BP | 2–1 | −5.6477 | −10.5174 | −0.7781 | 0.0183 | * |
| 3–1 | −5.0568 | −9.9265 | −0.1872 | 0.0398 | * | ||
| 3–2 | 0.5909 | −4.2788 | 5.4606 | 0.9559 | |||
| Diastolic BP | 2–1 | −2.6023 | −6.2004 | 0.9958 | 0.2053 | ||
| 3–1 | −4.6705 | −8.2686 | −1.0723 | 0.0069 | ** | ||
| 3–2 | −2.0682 | −5.6663 | 1.5299 | 0.3663 | |||
| Heart Rate Variability | FATIGUE | 2–1 | 0.1932 | −0.2527 | 0.6390 | 0.5641 | |
| 3–1 | 0.3864 | −0.0595 | 0.8322 | 0.1042 | |||
| 3–2 | 0.1932 | −0.2527 | 0.6390 | 0.5641 | |||
| LnTP | 2–1 | −0.1298 | −0.3071 | 0.0475 | 0.1977 | ||
| 3–1 | −0.1560 | −0.3333 | 0.0213 | 0.0972 | |||
| 3–2 | −0.0263 | −0.2036 | 0.1511 | 0.9351 | |||
| LnHF | 2–1 | −0.4049 | −0.7795 | −0.0303 | 0.0306 | * | |
| 3–1 | −0.3605 | −0.7350 | 0.0141 | 0.0621 | |||
| 3–2 | 0.0444 | −0.3301 | 0.4190 | 0.9578 | |||
| Norm LF | 2–1 | 6.8182 | 0.3605 | 13.2758 | 0.0357 | * | |
| 3–1 | 1.5909 | −4.8667 | 8.0486 | 0.8306 | |||
| 3–2 | −5.2273 | −11.6849 | 1.2304 | 0.1384 | |||
| Norm HF | 2–1 | −6.8182 | −13.2758 | −0.3605 | 0.0357 | * | |
| 3–1 | −1.5909 | −8.0486 | 4.8667 | 0.8306 | |||
| 3–2 | 5.2273 | −1.2304 | 11.6849 | 0.1384 | |||
| LnLF/HF | 2–1 | 0.0711 | 0.0026 | 0.1397 | 0.0400 | * | |
| 3–1 | 0.0088 | −0.0598 | 0.0773 | 0.9514 | |||
| 3–2 | −0.0624 | −0.1310 | 0.0062 | 0.0831 | |||
| RMSSD | 2–1 | −14.4659 | −24.9313 | −4.0005 | 0.0036 | ** | |
| 3–1 | −14.7045 | −25.1700 | −4.2391 | 0.0030 | ** | ||
| 3–2 | −0.2386 | −10.7040 | 10.2268 | 0.9984 | |||
| Complete Blood Count | RBC | 2–1 | 0.0095 | −0.1582 | 0.1773 | 0.9901 | |
| 3–1 | −0.0797 | −0.2474 | 0.0881 | 0.5030 | |||
| 3–2 | −0.0892 | −0.2570 | 0.0785 | 0.4229 | |||
| Hemoglobin | 2–1 | −0.1341 | −0.6838 | 0.4156 | 0.8336 | ||
| 3–1 | −0.3205 | −0.8702 | 0.2292 | 0.3560 | |||
| 3–2 | −0.1864 | −0.7361 | 0.3633 | 0.7039 | |||
| Hematocrit | 2–1 | 0.2500 | −1.2020 | 1.7020 | 0.9133 | ||
| 3–1 | −1.2080 | −2.6600 | 0.2441 | 0.1241 | |||
| 3–2 | −1.4580 | −2.9100 | −0.0059 | 0.0488 | * | ||
| Platelet | 2–1 | 10.0341 | −13.8645 | 33.9327 | 0.5840 | ||
| 3–1 | 15.3182 | −8.5804 | 39.2168 | 0.2875 | |||
| 3–2 | 5.2841 | −18.6145 | 29.1827 | 0.8611 | |||
| WBC (Total) | 2–1 | −0.1445 | −0.7572 | 0.4681 | 0.8434 | ||
| 3–1 | 0.8806 | 0.2679 | 1.4932 | 0.0023 | ** | ||
| 3–2 | 1.0251 | 0.4125 | 1.6377 | 0.0003 | *** | ||
| Monocytes | 2–1 | −0.2341 | −0.9002 | 0.4320 | 0.6857 | ||
| 3–1 | −0.8864 | −1.5525 | −0.2203 | 0.0054 | ** | ||
| 3–2 | −0.6523 | −1.3184 | 0.0138 | 0.0564 | |||
| Eosinophils | 2–1 | 0.6852 | −0.1179 | 1.4883 | 0.1115 | ||
| 3–1 | 0.1750 | −0.6281 | 0.9781 | 0.8648 | |||
| 3–2 | −0.5102 | −1.3133 | 0.2929 | 0.2938 | |||
| Basophils | 2–1 | −0.1966 | −0.3168 | −0.0764 | 0.0004 | *** | |
| 3–1 | −0.1443 | −0.2645 | −0.0241 | 0.0138 | * | ||
| 3–2 | 0.0523 | −0.0679 | 0.1725 | 0.5616 | |||
| Biochemical Examination | Serotonin | 2–1 | 4.4818 | −16.2303 | 25.1939 | 0.8665 | |
| 3–1 | 22.9057 | 2.1936 | 43.6178 | 0.0261 | * | ||
| 3–2 | 18.4239 | −2.2882 | 39.1360 | 0.0925 | |||
| 25-(OH) Vitamin D | 2–1 | 1.0739 | −0.9514 | 3.0991 | 0.4250 | ||
| 3–1 | 1.6886 | −0.3366 | 3.7139 | 0.1229 | |||
| 3–2 | 0.6148 | −1.4105 | 2.6400 | 0.7545 | |||
| 1,25-(OH)3 Vitamin D | 2–1 | −13.7830 | −19.8088 | −7.7571 | 0.0000 | *** | |
| 3–1 | 4.4682 | −1.5577 | 10.4940 | 0.1895 | |||
| 3–2 | 18.2511 | 12.2253 | 24.2770 | 0.0000 | *** | ||
| BAP | 2–1 | 48.5568 | −17.4669 | 114.5806 | 0.1947 | ||
| 3–1 | −189.3068 | −255.3306 | −123.2831 | 0.0000 | *** | ||
| 3–2 | −237.8636 | −303.8874 | −171.8399 | 0.0000 | *** | ||
| Amylase | 2–1 | −0.8523 | −9.7808 | 8.0763 | 0.9725 | ||
| 3–1 | 3.1136 | −5.8149 | 12.0422 | 0.6897 | |||
| 3–2 | 3.9659 | −4.9626 | 12.8945 | 0.5479 | |||
| Protein | 2–1 | 0.1443 | 0.0324 | 0.2562 | 0.0073 | ** | |
| 3–1 | 0.1523 | 0.0404 | 0.2641 | 0.0043 | ** | ||
| 3–2 | 0.0080 | −0.1039 | 0.1198 | 0.9846 | |||
| Albumin | 2–1 | 0.2205 | 0.1325 | 0.3084 | 0.0000 | *** | |
| 3–1 | 0.2114 | 0.1235 | 0.2993 | 0.0000 | *** | ||
| 3–2 | −0.0091 | −0.0970 | 0.0788 | 0.9678 | |||
| Creatinine | 2–1 | −0.0352 | −0.0868 | 0.0163 | 0.2429 | ||
| 3–1 | 0.0045 | −0.0470 | 0.0561 | 0.9765 | |||
| 3–2 | 0.0398 | −0.0118 | 0.0913 | 0.1655 | |||
| BUN | 2–1 | −1.1365 | −2.1267 | −0.1460 | 0.0199 | * | |
| 3–1 | 0.3636 | −0.6267 | 1.3540 | 0.6625 | |||
| 3–2 | 1.5000 | 0.5096 | 2.4904 | 0.0012 | ** | ||
| SGOT (AST) | 2–1 | 2.8636 | 1.2026 | 4.5247 | 0.0002 | *** | |
| 3–1 | 1.8750 | 0.2140 | 3.5360 | 0.0225 | * | ||
| 3–2 | −0.9886 | −2.6497 | 0.6724 | 0.3408 | |||
| SGPT (ALT) | 2–1 | 2.5114 | 0.1228 | 4.8999 | 0.0367 | * | |
| 3–1 | 3.4091 | 1.0205 | 5.7977 | 0.0025 | ** | ||
| 3–2 | 0.8977 | −1.4908 | 3.2863 | 0.6497 | |||
| Uric Acid | 2–1 | −0.0511 | −0.4302 | 0.3279 | 0.9458 | ||
| 3–1 | 0.2818 | −0.0972 | 0.6609 | 0.1878 | |||
| 3–2 | 0.3330 | −0.0461 | 0.7120 | 0.0980 | |||
| Cholesterol (Total) | 2–1 | −4.1705 | −12.4234 | 4.0825 | 0.4595 | ||
| 3–1 | 0.3750 | −7.8780 | 8.6280 | 0.9937 | |||
| 3–2 | 4.5455 | −3.7075 | 12.7984 | 0.3974 | |||
| Glucose | 2–1 | −2.6250 | −6.8645 | 1.6145 | 0.3122 | ||
| 3–1 | 10.1932 | 5.9537 | 14.4326 | 0.0000 | *** | ||
| 3–2 | 12.8182 | 8.5787 | 17.0576 | 0.0000 | *** | ||
| Ca | 2–1 | 0.2114 | 0.1073 | 0.3155 | 0.0000 | *** | |
| 3–1 | 0.1125 | 0.0084 | 0.2166 | 0.0306 | * | ||
| 3–2 | −0.0989 | −0.2030 | 0.0052 | 0.0667 | |||
| Na | 2–1 | −1.3295 | −1.9576 | −0.7015 | 0.0000 | *** | |
| 3–1 | 0.2273 | −0.4008 | 0.8554 | 0.6704 | |||
| 3–2 | 1.5568 | 0.9287 | 2.1849 | 0.0000 | *** | ||
| Cl | 2–1 | 0.0455 | −0.6537 | 0.7446 | 0.9871 | ||
| 3–1 | 0.5455 | −0.1537 | 1.2446 | 0.1590 | |||
| 3–2 | 0.5000 | −0.1992 | 1.1992 | 0.2126 | |||
| Immuno- serological Examination | CD16+CD56 (count) | 2–1 | −38.0581 | −94.7144 | 18.5982 | 0.2546 | |
| 3–1 | 3.0067 | −53.6497 | 59.6630 | 0.9914 | |||
| 3–2 | 41.0648 | −15.5916 | 97.7211 | 0.2039 | |||
| CD16+CD56 (WB) | 2–1 | −1.6455 | −3.6798 | 0.3889 | 0.1388 | ||
| 3–1 | −1.6432 | −3.6775 | 0.3911 | 0.1396 | |||
| 3–2 | 0.0023 | −2.0320 | 2.0366 | 1.0000 | |||
| IL-8 M_Multiplex | 2–1 | 53.1813 | 34.8497 | 71.5129 | 0.0000 | *** | |
| 3–1 | 0.4193 | −17.9123 | 18.7509 | 0.9984 | |||
| 3–2 | −52.7620 | −71.0937 | −34.4304 | 0.0000 | *** | ||
| TNF-α HS M_Multiplex | 2–1 | −2.0337 | −3.3696 | −0.6977 | 0.0012 | ** | |
| 3–1 | −2.3386 | −3.6745 | −1.0026 | 0.0001 | *** | ||
| 3–2 | −0.3049 | −1.6408 | 1.0311 | 0.8527 | |||
| IFN-γ HS M_Multiplex | 2–1 | 0.7074 | −5.9449 | 7.3597 | 0.9660 | ||
| 3–1 | 3.0468 | −3.6054 | 9.6991 | 0.5276 | |||
| 3–2 | 2.3394 | −4.3129 | 8.9917 | 0.6854 | |||
| CRP | 2–1 | 0.0730 | −0.0068 | 0.1527 | 0.0806 | ||
| 3–1 | 0.0223 | −0.0574 | 0.1020 | 0.7877 | |||
| 3–2 | −0.0507 | −0.1304 | 0.0290 | 0.2933 | |||
| Urine | pH (RU) | 2–1 | 0.0682 | −0.2054 | 0.3418 | 0.8270 | |
| 3–1 | 0.3409 | 0.0673 | 0.6145 | 0.0101 | * | ||
| 3–2 | 0.2727 | −0.0009 | 0.5463 | 0.0510 | |||
| Flow cytometry | 2–1 | 0.0114 | −0.0834 | 0.1061 | 0.9569 | ||
| (E.P. CELL) | 3–1 | 0.1136 | 0.0189 | 0.2084 | 0.0140 | * | |
| 3–2 | 0.1023 | 0.0075 | 0.1971 | 0.0309 | * | ||
| Flow cytometry | 2–1 | 0.1477 | 0.0475 | 0.2480 | 0.0017 | ** | |
| (OTHER) | 3–1 | −0.0114 | −0.1116 | 0.0889 | 0.9614 | ||
| 3–2 | −0.1591 | −0.2593 | −0.0589 | 0.0007 | *** | ||
| Psychological Examination | Resilience | 2–1 | 0.2710 | 0.0822 | 0.4598 | 0.0024 | ** |
| 3–1 | 0.2660 | 0.0772 | 0.4548 | 0.0029 | ** | ||
| 3–2 | −0.0051 | −0.1939 | 0.1838 | 0.9978 | |||
| Self-esteem | 2–1 | 0.0920 | −0.0261 | 0.2102 | 0.1597 | ||
| 3–1 | 0.0955 | −0.0227 | 0.2136 | 0.1394 | |||
| 3–2 | 0.0034 | −0.1147 | 0.1215 | 0.9975 | |||
| Vigor | 2–1 | −0.3818 | −0.8718 | 0.1082 | 0.1597 | ||
| 3–1 | −0.4205 | −0.9105 | 0.0696 | 0.1088 | |||
| 3–2 | −0.0386 | −0.5287 | 0.4514 | 0.9811 | |||
Appendix C
| Indices | Group | N | Pre-Treatment Assessment | Post- Treatment Assessment | Follow-Up Assessment | F | p | ||
|---|---|---|---|---|---|---|---|---|---|
| M(SD) | M(SD) | M(SD) | |||||||
| Physiological | Systolic BP | 1 | 30 | 127.97(15.27) | 119.87(12.68) | 116.16(11.09) | 14.619 | 0.000 | *** |
| Indices | 2 | 29 | 129.00(15.26) | 116.45(14.30) | 125.21(12.93) | 100.612 | 0.000 | *** | |
| 3 | 29 | 113.62(10.41) | 117.48(11.14) | 114.59(11.52) | 1.857 | 0.166 | |||
| Diastolic BP | 1 | 30 | 74.84(13.72) | 72.87(7.64) | 70.06(11.61) | 2.209 | 0.119 | ||
| 2 | 29 | 79.86(10.12) | 72.45(11.28) | 74.10(8.99) | 9.897 | 0.000 | *** | ||
| 3 | 29 | 74.10(9.45) | 75.55(7.81) | 70.41(7.95) | 6.362 | 0.003 | ** | ||
| Pulse | 1 | 30 | 74.94(12.46) | 78.84(10.65) | 80.03(9.53) | 3.118 | 0.051 | ||
| 2 | 29 | 74.17(9.24) | 72.24(11.39) | 75.83(10.59) | 2.153 | 0.126 | |||
| 3 | 29 | 81.86(11.03) | 75.76(9.09) | 78.33(12.26) | 3.563 | 0.035 | * | ||
| Body | 1 | 30 | 36.69(0.30) | 36.61(0.35) | 36.70(0.31) | 1.224 | 0.301 | ||
| Temperature | 2 | 29 | 36.67(0.28) | 36.66(0.26) | 36.64(0.36) | 0.104 | 0.902 | ||
| 3 | 29 | 36.83(0.37) | 36.73(0.28) | 36.72(0.45) | 1.443 | 0.245 | |||
| eNO | 1 | 30 | 13.42(8.66) | 16.23(12.12) | 13.52(8.23) | 3.245 | 0.046 | * | |
| 2 | 29 | 22.21(29.68) | 22.43(29.44) | 18.68(22.15) | 3.244 | 0.047 | * | ||
| 3 | 29 | 13.17(9.48) | 15.14(14.92) | 16.59(15.77) | 2.064 | 0.136 | |||
| HR | 1 | 30 | 75.77(12.89) | 83.33(10.74) | 83.73(10.85) | 9.542 | 0.000 | *** | |
| 2 | 29 | 77.72(10.65) | 78.52(10.86) | 79.03(10.68) | 0.276 | 0.760 | |||
| 3 | 29 | 84.00(8.90) | 79.97(7.79) | 79.55(7.77) | 3.851 | 0.027 | * | ||
| SDNN | 1 | 30 | 61.90(29.48) | 49.70(26.06) | 53.13(24.22) | 3.357 | 0.042 | * | |
| 2 | 29 | 71.14(34.35) | 68.45(45.17) | 59.45(29.91) | 1.139 | 0.327 | |||
| 3 | 29 | 55.10(27.26) | 58.83(27.98) | 49.14(17.31) | 1.442 | 0.245 | |||
| RMSSD | 1 | 30 | 60.10(31.50) | 34.93(20.42) | 39.83(20.70) | 14.921 | 0.000 | *** | |
| 2 | 29 | 65.69(45.66) | 51.90(33.04) | 49.03(30.53) | 3.113 | 0.052 | |||
| 3 | 29 | 47.45(28.53) | 43.38(24.85) | 40.45(15.91) | 0.694 | 0.504 | |||
| HRV Index | 1 | 30 | 11.81(3.16) | 10.58(2.83) | 10.31(3.23) | 4.989 | 0.010 | * | |
| 2 | 29 | 12.02(3.72) | 12.23(3.73) | 11.62(4.03) | 0.355 | 0.703 | |||
| 3 | 29 | 11.01(3.74) | 11.60(3.22) | 11.24(3.35) | 0.347 | 0.708 | |||
| pNN50 | 1 | 30 | 71.43(18.08) | 59.33(17.46) | 59.00(20.49) | 8.216 | 0.001 | ** | |
| 2 | 29 | 65.55(16.32) | 67.03(16.92) | 64.24(16.36) | 0.649 | 0.527 | |||
| 3 | 29 | 64.17(12.10) | 62.28(15.71) | 69.76(11.95) | 3.338 | 0.043 | * | ||
| LnTP | 1 | 30 | 7.23(0.57) | 6.81(0.37) | 6.89(0.47) | 11.107 | 0.000 | *** | |
| 2 | 29 | 7.20(0.56) | 7.18(0.67) | 7.05(0.44) | 1.203 | 0.308 | |||
| 3 | 29 | 6.93(0.45) | 7.01(0.39) | 6.98(0.39) | 0.405 | 0.669 | |||
| LnVLF | 1 | 30 | 6.70(0.39) | 6.47(0.33) | 6.49(0.30) | 7.181 | 0.002 | ** | |
| 2 | 29 | 6.63(0.37) | 6.33(0.31) | 6.59(0.28) | 0.226 | 0.799 | |||
| 3 | 29 | 6.48(0.24) | 6.57(0.27) | 6.57(0.22) | 1.704 | 0.191 | |||
| LnLF | 1 | 30 | 5.35(1.09) | 4.78(0.82) | 4.92(1.15) | 3.624 | 0.033 | * | |
| 2 | 29 | 5.52(1.19) | 5.53(1.33) | 5.11(1.18) | 1.571 | 0.217 | |||
| 3 | 29 | 5.04(1.10) | 5.38(0.77) | 4.99(1.09) | 2.486 | 0.092 | |||
| LnHF | 1 | 30 | 5.41(1.04) | 4.47(0.81) | 4.60(1.04) | 14.700 | 0.000 | *** | |
| 2 | 29 | 5.14(1.23) | 4.96(1.18) | 4.86(1.16) | 0.988 | 0.379 | |||
| 3 | 29 | 4.80(1.15) | 4.73(0.89) | 4.82(0.86) | 0.138 | 0.871 | |||
| Norm LF | 1 | 30 | 48.57(18.60) | 56.07(18.96) | 57.43(14.11) | 3.226 | 0.047 | * | |
| 2 | 29 | 58.21(19.97) | 62.31(17.56) | 55.38(21.00) | 1.496 | 0.233 | |||
| 3 | 29 | 55.28(16.24) | 64.10(14.40) | 53.76(20.65) | 5.262 | 0.008 | ** | ||
| Norm HF | 1 | 30 | 51.43(18.60) | 43.93(18.96) | 42.57(14.11) | 3.226 | 0.047 | * | |
| 2 | 29 | 41.79(19.97) | 37.69(17.56) | 44.62(21.00) | 1.496 | 0.233 | |||
| 3 | 29 | 44.72(16.24) | 35.90(14.40) | 46.24(20.65) | 5.262 | 0.008 | ** | ||
| LnLF/HF | 1 | 30 | 1.00(0.17) | 1.09(0.22) | 1.08(0.14) | 2.978 | 0.059 | ||
| 2 | 29 | 1.09(0.20) | 1.13(0.18) | 1.07(0.23) | 1.153 | 0.323 | |||
| 3 | 29 | 1.07(0.19) | 1.16(0.18) | 1.05(0.21) | 4.302 | 0.018 | * | ||
| PSI | 1 | 30 | 4.83(0.63) | 5.03(0.62) | 5.00(0.67) | 2.090 | 0.133 | ||
| 2 | 29 | 4.67(0.80) | 4.72(0.70) | 4.85(0.80) | 0.674 | 0.514 | |||
| 3 | 29 | 4.92(0.72) | 4.82(0.62) | 4.98(0.52) | 0.749 | 0.478 | |||
| STRESS | 1 | 30 | 4.43(2.30) | 5.70(1.74) | 5.60(2.42) | 4.667 | 0.013 | * | |
| 2 | 29 | 4.10(2.54) | 4.17(2.42) | 4.72(2.39) | 0.946 | 0.394 | |||
| 3 | 29 | 5.24(2.43) | 4.52(1.99) | 5.24(2.36) | 1.886 | 0.161 | |||
| HEALTH | 1 | 30 | 78.87(6.49) | 76.00(6.92) | 75.13(9.24) | 2.573 | 0.085 | ||
| 2 | 29 | 80.03(8.49) | 79.14(7.93) | 77.5(8.73) | 1.501 | 0.230 | |||
| 3 | 29 | 77.59(9.23) | 80.34(6.56) | 77.55(7.59) | 2.145 | 0.127 | |||
| FATIGUE | 1 | 30 | 2.30(1.02) | 2.97(1.03) | 2.97(1.40) | 4.411 | 0.016 | * | |
| 2 | 29 | 2.10(1.37) | 2.34(1.20) | 2.52(1.45) | 1.295 | 0.282 | |||
| 3 | 29 | 2.66(1.34) | 2.31(1.04) | 2.72(1.25) | 2.188 | 0.122 | |||
| RBC | 1 | 30 | 4.80(0.41) | 4.88(0.43) | 4.76(0.40) | 9.513 | 0.000 | *** | |
| 2 | 29 | 4.95(0.55) | 4.91(0.50) | 4.84(0.50) | 4.633 | 0.014 | * | ||
| 3 | 29 | 4.78(0.49) | 4.78(0.48) | 4.69(0.47) | 3.719 | 0.030 | * | ||
| Hb | 1 | 30 | 13.40(1.55) | 13.46(1.54) | 13.17(1.54) | 8.489 | 0.001 | ** | |
| 2 | 29 | 14.32(1.59) | 13.99(1.44) | 13.86(1.54) | 9.834 | 0.000 | *** | ||
| 3 | 29 | 13.80(1.57) | 13.66(1.57) | 13.52(1.47) | 4.202 | 0.020 | * | ||
| Hct | 1 | 30 | 42.31(3.97) | 43.09(4.06) | 40.89(3.91) | 36.392 | 0.000 | *** | |
| 2 | 29 | 44.47(4.24) | 44.21(4.00) | 41.85(3.92) | 33.646 | 0.000 | *** | ||
| 3 | 29 | 41.44(4.08) | 41.65(3.84) | 41.86(4.07) | 1.135 | 0.329 | |||
| Platelet | 1 | 30 | 287.10(73.99) | 285.37(74.17) | 282.43(73.81) | 0.308 | 0.736 | ||
| 2 | 29 | 245.38(53.63) | 270.31(57.19) | 279.66(58.92) | 38.796 | 0.000 | *** | ||
| 3 | 29 | 285.28(67.19) | 292.59(73.44) | 302.31(62.27) | 2.886 | 0.064 | |||
| WBC | 1 | 30 | 7.08(1.39) | 6.00(1.59) | 6.89(1.73) | 8.786 | 0.000 | *** | |
| 2 | 29 | 5.00(1.40) | 6.10(1.34) | 7.69(1.78) | 56.835 | 0.000 | *** | ||
| 3 | 29 | 7.36(1.48) | 6.94(1.86) | 7.54(1.73) | 3.472 | 0.038 | * | ||
| Neutrophil | 1 | 30 | 56.92(9.55) | 50.24(9.54) | 53.68(8.69) | 10.437 | 0.000 | *** | |
| Seg. | 2 | 29 | 46.86(12.17) | 51.46(9.88) | 53.25(9.87) | 7.835 | 0.001 | ** | |
| 3 | 29 | 52.53(6.88) | 54.09(9.12) | 53.28(8.36) | 0.436 | 0.649 | |||
| Lymphocyte | 1 | 30 | 32.66(8.34) | 37.59(8.77) | 35.82(7.12) | 6.755 | 0.002 | ** | |
| 2 | 29 | 39.41(10.74) | 36.59(9.01) | 35.98(9.58) | 3.283 | 0.045 | * | ||
| 3 | 29 | 36.48(6.68) | 34.19(8.58) | 35.44(7.81) | 1.181 | 0.315 | |||
| Monocyte | 1 | 30 | 7.81(1.82) | 8.32(1.88) | 7.26(1.43) | 4.921 | 0.011 | * | |
| 2 | 29 | 9.61(2.28) | 8.12(1.82) | 7.64(1.36) | 14.476 | 0.000 | *** | ||
| 3 | 29 | 7.96(1.86) | 8.22(1.82) | 7.81(2.03) | 1.070 | 0.350 | |||
| Eosinophil | 1 | 30 | 1.88(1.74) | 3.11(2.52) | 2.48(1.89) | 10.419 | 0.000 | *** | |
| 2 | 29 | 2.90(2.17) | 3.14(2.13) | 2.30(1.55) | 6.426 | 0.003 | ** | ||
| 3 | 29 | 2.27(1.46) | 2.82(2.19) | 2.77(3.86) | 0.823 | 0.444 | |||
| Basophil | 1 | 30 | 0.74(0.33) | 0.74(0.33) | 0.75(0.35) | 0.036 | 0.965 | ||
| 2 | 29 | 1.22(0.37) | 0.69(0.25) | 0.83(0.32) | 26.099 | 0.000 | *** | ||
| 3 | 29 | 0.76(0.27) | 0.69(0.29) | 0.70(0.30) | 1.817 | 0.172 | |||
| IL-4 HS | 1 | 30 | 69.28(40.10) | 70.40(48.18) | 83.04(44.94) | 6.215 | 0.004 | ** | |
| M_Multiplex | 2 | 29 | 100.70(67.04) | 77.72(48.14) | 88.74(60.56) | 10.753 | 0.000 | *** | |
| 3 | 29 | 84.48(62.96) | 97.70(77.87) | 64.24(67.84) | 32.681 | 0.000 | *** | ||
| IL-8 | 1 | 30 | 12.12(9.71) | 118.79(107.18) | 17.33(11.13) | 31.546 | 0.000 | *** | |
| M Multiplex | 2 | 29 | 16.81(11.16) | 78.00(56.71) | 13.40(12.56) | 39.377 | 0.000 | *** | |
| 3 | 29 | 32.91(36.96) | 22.76(24.52) | 32.21(43.37) | 3.194 | 0.049 | * | ||
| TNF-α HS | 1 | 30 | 16.11(2.99) | 14.66(3.52) | 15.50(3.56) | 3.988 | 0.024 | * | |
| M Multiplex | 2 | 29 | 17.66(3.81) | 12.84(3.36) | 13.22(2.57) | 66.652 | 0.000 | *** | |
| 3 | 29 | 15.74(4.34) | 15.88(3.83) | 13.71(4.52) | 6.699 | 0.002 | ** | ||
| IFN-γ HS | 1 | 30 | 28.44(11.72) | 29.47(13.63) | 36.11(15.70) | 19.251 | 0.000 | *** | |
| M Multiplex | 2 | 29 | 32.47(12.38) | 26.74(9.21) | 33.75(16.38) | 8.188 | 0.001 | ** | |
| 3 | 29 | 34.64(21.67) | 41.45(31.81) | 34.67(23.20) | 4.495 | 0.015 | * | ||
| CD16+ | 1 | 30 | 301.49(152.92) | 318.63(159.84) | 364.00(172.09) | 5.228 | 0.008 | ** | |
| CD56 (count) | 2 | 29 | 284.50(155.22) | 250.83(108.97) | 268.57(204.46) | 0.441 | 0.645 | ||
| 3 | 29 | 365.90(151.71) | 266.35(140.01) | 326.28(154.44) | 6.856 | 0.002 | ** | ||
| CD16+ | 1 | 30 | 13.53(6.24) | 14.66(6.35) | 15.01(5.97) | 2.034 | 0.140 | ||
| CD56 (WB) | 2 | 29 | 15.27(7.36) | 11.48(4.26) | 9.96(5.84) | 12.399 | 0.000 | *** | |
| 3 | 29 | 13.62(4.18) | 11.25(4.12) | 12.42(4.73) | 4.265 | 0.019 | * | ||
| CRP | 1 | 30 | 0.08(0.18) | 0.16(0.35) | 0.14(0.36) | 0.996 | 0.375 | ||
| 2 | 29 | 0.04(0.07) | 0.09(0.22) | 0.04(0.09) | 1.984 | 0.147 | |||
| 3 | 29 | 0.06(0.11) | 0.14(0.29) | 0.06(0.10) | 2.803 | 0.069 | |||
| IgA (S) | 1 | 30 | 178.43(54.04) | 180.78(52.18) | 178.06(52.73) | 1.366 | 0.263 | ||
| 2 | 29 | 182.48(57.38) | 181.32(54.42) | 175.86(53.26) | 5.108 | 0.009 | ** | ||
| 3 | 29 | 190.25(82.18) | 187.31(78.61) | 183.42(73.72) | 0.120 | 0.887 | |||
| Protein, | 1 | 30 | 7.21(0.29) | 7.29(0.28) | 7.25(0.26) | 1.767 | 0.180 | ||
| total | 2 | 29 | 7.08(0.29) | 7.31(0.34) | 7.27(0.34) | 11.232 | 0.000 | *** | |
| 3 | 29 | 7.32(0.25) | 7.44(0.29) | 7.54(0.35) | 6.811 | 0.002 | ** | ||
| Albumin | 1 | 30 | 4.63(0.27) | 4.79(0.22) | 4.80(0.23) | 14.911 | 0.000 | *** | |
| 2 | 29 | 4.59(0.19) | 4.90(0.20) | 4.75(0.24) | 33.338 | 0.000 | *** | ||
| 3 | 29 | 4.74(0.20) | 4.92(0.24) | 5.03(0.29) | 20.248 | 0.000 | *** | ||
| Creatinine | 1 | 30 | 0.73(0.16) | 0.73(0.15) | 0.76(0.16) | 2.027 | 0.141 | ||
| 2 | 29 | 0.78(0.15) | 0.75(0.12) | 0.79(0.13) | 4.039 | 0.023 | * | ||
| 3 | 29 | 0.78(0.15) | 0.70(0.13) | 0.76(0.14) | 8.790 | 0.000 | *** | ||
| BUN | 1 | 30 | 11.23(2.86) | 9.97(2.85) | 13.27(3.05) | 27.655 | 0.000 | *** | |
| 2 | 29 | 11.90(3.02) | 10.93(2.51) | 11.62(2.51) | 1.985 | 0.147 | |||
| 3 | 29 | 13.41(2.98) | 12.24(2.20) | 12.69(1.91) | 2.736 | 0.073 | |||
| Bilirubin, | 1 | 30 | 0.47(0.26) | 0.51(0.25) | 0.52(0.28) | 0.546 | 0.582 | ||
| total | 2 | 29 | 0.54(0.24) | 0.48(0.20) | 0.51(0.28) | 1.304 | 0.280 | ||
| 3 | 29 | 0.36(0.17) | 0.44(0.26) | 0.43(0.32) | 3.031 | 0.056 | |||
| AST (SGOT) | 1 | 30 | 16.60(3.63) | 19.53(6.28) | 17.97(5.82) | 5.443 | 0.007 | ** | |
| 2 | 29 | 15.38(3.20) | 19.24(5.06) | 17.10(4.47) | 11.640 | 0.000 | *** | ||
| 3 | 29 | 15.14(3.79) | 16.93(3.51) | 17.69(5.06) | 5.602 | 0.006 | ** | ||
| ALT (SGPT) | 1 | 30 | 8.90(4.57) | 11.23(10.26) | 10.30(6.93) | 2.808 | 0.069 | ||
| 2 | 29 | 9.28(5.16) | 12.45(7.92) | 13.69(8.34) | 6.618 | 0.003 | ** | ||
| 3 | 29 | 7.28(3.45) | 9.31(3.87) | 11.76(6.42) | 17.924 | 0.000 | *** | ||
| ALP | 1 | 30 | 154.87(113.04) | 156.83(117.04) | 152.83(112.45) | 1.148 | 0.324 | ||
| 2 | 29 | 133.55(92.53) | 136.41(94.25) | 128.17(86.82) | 7.051 | 0.002 | ** | ||
| 3 | 29 | 118.76(67.82) | 116.83(64.60) | 115.41(60.99) | 0.229 | 0.796 | |||
| Uric Acid | 1 | 30 | 5.20(1.09) | 5.34(1.11) | 5.92(1.08) | 19.052 | 0.000 | *** | |
| 2 | 29 | 5.60(1.10) | 5.45(1.14) | 5.83(1.02) | 5.567 | 0.006 | ** | ||
| 3 | 29 | 5.51(0.91) | 5.36(1.04) | 5.39(1.08) | 0.893 | 0.415 | |||
| Cholesterol, | 1 | 30 | 144.20(20.05) | 137.60(20.94) | 141.27(20.82) | 5.042 | 0.010 | * | |
| total | 2 | 29 | 148.10(26.69) | 148.90(28.00) | 153.21(26.17) | 2.237 | 0.116 | ||
| 3 | 29 | 151.03(18.96) | 144.41(20.26) | 150.10(24.15) | 4.130 | 0.021 | * | ||
| Glucose (S) | 1 | 30 | 83.77(12.40) | 80.80(9.48) | 97.63(13.27) | 25.270 | 0.000 | *** | |
| 2 | 29 | 88.62(9.33) | 87.76(8.96) | 98.93(10.60) | 12.857 | 0.000 | *** | ||
| 3 | 29 | 86.90(13.63) | 82.86(9.76) | 93.17(16.51) | 4.105 | 0.022 | * | ||
| Inorganic- | 1 | 30 | 4.13(0.84) | 3.99(0.69) | 4.35(0.62) | 8.244 | 0.001 | ** | |
| phosphorus | 2 | 29 | 3.81(0.42) | 4.16(0.59) | 4.00(0.51) | 8.020 | 0.001 | ** | |
| 3 | 29 | 4.38(0.58) | 4.30(0.46) | 4.28(0.48) | 0.499 | 0.610 | |||
| Calcium | 1 | 30 | 9.54(0.28) | 9.79(0.24) | 9.54(0.20) | 19.572 | 0.000 | *** | |
| 2 | 29 | 9.76(0.27) | 9.88(0.37) | 9.87(0.24) | 2.626 | 0.081 | |||
| 3 | 29 | 9.56(0.25) | 9.83(0.31) | 9.79(0.30) | 14.308 | 0.000 | *** | ||
| Na (Sodium) | 1 | 30 | 141.33(1.99) | 140.60(1.81) | 141.53(1.55) | 4.592 | 0.014 | * | |
| 2 | 29 | 141.76(1.41) | 139.48(1.12) | 140.45(1.53) | 30.133 | 0.000 | *** | ||
| 3 | 29 | 141.34(1.70) | 140.34(1.90) | 143.14(1.57) | 26.990 | 0.000 | *** | ||
| K | 1 | 30 | 4.22(0.36) | 4.04(0.37) | 4.12(0.35) | 4.374 | 0.017 | * | |
| (Potassium) | 2 | 29 | 4.34(0.25) | 4.27(0.28) | 4.29(0.26) | 1.183 | 0.314 | ||
| 3 | 29 | 4.07(0.31) | 4.16(0.30) | 4.28(0.24) | 7.040 | 0.002 | ** | ||
| Cl (Chlorine) | 1 | 30 | 100.97(2.51) | 101.17(2.29) | 101.60(2.44) | 1.576 | 0.215 | ||
| 2 | 29 | 101.52(1.64) | 100.93(1.41) | 100.31(1.28) | 9.509 | 0.000 | *** | ||
| 3 | 29 | 100.66(1.49) | 101.17(1.69) | 102.86(1.64) | 23.843 | 0.000 | *** | ||
| Cortisol | 1 | 30 | 5.81(2.78) | 6.23(2.54) | 5.55(1.96) | 0.730 | 0.486 | ||
| (CIA) | 2 | 29 | 6.74(2.26) | 6.34(2.78) | 7.32(3.20) | 1.412 | 0.252 | ||
| 3 | 29 | 6.55(2.61) | 7.30(2.55) | 6.94(3.19) | 0.667 | 0.517 | |||
| Serotonin | 1 | 30 | 152.26(44.52) | 138.55(41.34) | 177.58(50.76) | 29.350 | 0.000 | *** | |
| (HPLC) | 2 | 29 | 155.76(52.38) | 186.54(79.57) | 192.77(74.88) | 9.905 | 0.000 | *** | |
| 3 | 29 | 129.68(45.01) | 126.67(44.53) | 135.98(46.78) | 0.737 | 0.483 | * | ||
| 1,25-(OH)2 | 1 | 30 | 29.18(16.63) | 8.53(7.23) | 23.37(16.07) | 31.386 | 0.000 | *** | |
| vitamin D | 2 | 29 | 27.86(14.34) | 23.16(22.31) | 22.97(12.12) | 1.314 | 0.277 | ||
| 3 | 29 | 25.69(16.41) | 9.93(8.49) | 50.16(15.25) | 79.349 | 0.000 | *** | ||
| 25-(OH) | 1 | 30 | 21.89(7.08) | 21.31(6.59) | 21.72(6.53) | 1.931 | 0.154 | ||
| vitamin D | 2 | 29 | 19.62(4.47) | 21.15(5.02) | 21.63(4.59) | 16.818 | 0.000 | *** | |
| 3 | 29 | 18.52(6.11) | 20.86(5.21) | 21.81(4.97) | 15.277 | 0.000 | *** | ||
| d-ROMs | 1 | 30 | 314.60(62.27) | 320.30(66.39) | 319.83(65.82) | 0.640 | 0.531 | ||
| 2 | 29 | 314.24(72.53) | 314.90(68.87) | 307.45(73.36) | 1.054 | 0.355 | |||
| 3 | 29 | 304.07(60.55) | 303.00(59.59) | 317.17(56.02) | 3.484 | 0.037 | * | ||
| BAP | 1 | 30 | 2138.30(140.26) | 2171.33(166.45) | 1840.37(131.38) | 139.420 | 0.000 | *** | |
| 2 | 29 | 2130.21(173.30) | 2176.17(148.53) | 1850.76(204.81) | 85.761 | 0.000 | *** | ||
| 3 | 29 | 2132.97(161.29) | 2200.17(174.47) | 2146.17(202.37) | 2.739 | 0.073 | |||
| Amylase (S) | 1 | 30 | 74.23(31.09) | 72.50(26.43) | 75.70(31.16) | 0.624 | 0.539 | ||
| 2 | 29 | 62.00(20.77) | 62.14(15.72) | 66.28(27.20) | 2.009 | 0.144 | |||
| 3 | 29 | 64.93(20.30) | 64.00(20.80) | 68.59(26.25) | 3.143 | 0.051 | |||
| α-Amylase | 1 | 30 | 16.87(13.41) | 12.34(10.65) | 24.57(15.83) | 3.261 | 0.056 | ||
| (Saliva) | 2 | 29 | 8.90(9.64) | 8.85(7.69) | 7.56(7.08) | 0.121 | 0.887 | ||
| 3 | 29 | 18.44(13.25) | 8.55(5.71) | 7.51(7.47) | 10.077 | 0.000 | *** | ||
| Secretory | 1 | 30 | 19.75(16.11) | 117.79(102.80) | 70.54(55.36) | 7.401 | 0.004 | ** | |
| IgA (Saliva) | 2 | 29 | 34.25(30.46) | 65.83(51.01) | 91.33(64.76) | 12.037 | 0.000 | *** | |
| 3 | 29 | 78.76(66.31) | 87.63(84.92) | 115.48(57.67) | 3.110 | 0.054 | |||
| Cortisol | 1 | 30 | 0.09(0.09) | 0.10(0.03) | 0.10(0.05) | 0.086 | 0.918 | ||
| (Saliva) | 2 | 29 | 0.09(0.05) | 0.07(0.04) | 0.15(0.09) | 8.906 | 0.001 | ** | |
| 3 | 29 | 0.10(0.09) | 0.11(0.07) | 0.10(0.05) | 0.071 | 0.931 | |||
| Creatinine | 1 | 30 | 145.86(70.55) | 166.46(64.90) | 174.75(53.43) | 1.891 | 0.160 | ||
| (RU) | 2 | 29 | 152.81(91.06) | 177.76(89.02) | 139.09(70.60) | 2.869 | 0.065 | ||
| 3 | 29 | 178.62(85.26) | 181.72(60.52) | 181.18(86.84) | 0.018 | 0.982 | |||
| pH | 1 | 30 | 6.15(0.87) | 6.15(0.72) | 6.63(0.63) | 4.517 | 0.015 | * | |
| (RU) | 2 | 29 | 5.88(0.88) | 6.12(0.66) | 6.16(0.90) | 1.358 | 0.266 | ||
| 3 | 29 | 6.12(0.82) | 6.09(0.58) | 6.38(0.76) | 1.968 | 0.149 | |||
| Specific | 1 | 30 | 1.02(0.01) | 1.02(0.01) | 1.03(0.00) | 5.286 | 0.008 | ** | |
| Gravity (RU) | 2 | 29 | 1.02(0.01) | 1.02(0.01) | 1.02(0.01) | 1.638 | 0.203 | ||
| 3 | 29 | 1.02(0.01) | 1.03(0.01) | 1.02(0.01) | 1.933 | 0.154 | |||
| 8-OHdG (U) | 1 | 30 | 11.73(5.95) | 14.69(6.59) | 12.47(6.52) | 2.467 | 0.094 | ||
| 2 | 29 | 11.60(6.78) | 12.95(6.56) | 11.43(5.87) | 0.794 | 0.457 | |||
| 3 | 29 | 13.61(8.08) | 11.73(3.91) | 11.42(5.91) | 1.336 | 0.271 | |||
| Psychological | Resilience | 1 | 30 | 3.30(0.31) | 3.26(0.36) | 3.26(0.49) | 0.244 | 0.784 | |
| Indices | 2 | 29 | 3.29(0.38) | 3.44(0.39) | 3.37(0.47) | 2.212 | 0.119 | ||
| 3 | 29 | 3.27(0.37) | 3.40(0.40) | 3.52(0.46) | 6.630 | 0.003 | ** | ||
| Interpersonal | 1 | 30 | 3.69(0.59) | 3.69(0.82) | 3.69(0.82) | 0.000 | 1.000 | ||
| Competency | 2 | 29 | 3.83(0.69) | 3.80(0.67) | 3.81(0.80) | 0.046 | 0.956 | ||
| 3 | 29 | 3.71(0.62) | 3.90(0.68) | 4.05(0.60) | 5.216 | 0.008 | ** | ||
| Self-esteem | 1 | 30 | 2.83(0.47) | 2.85(0.54) | 2.86(0.54) | 0.121 | 0.886 | ||
| 2 | 29 | 3.01(0.45) | 2.96(0.43) | 2.99(0.46) | 0.240 | 0.787 | |||
| 3 | 29 | 2.97(0.38) | 2.98(0.34) | 2.99(0.44) | 0.044 | 0.957 | |||
| Stress | 1 | 30 | 1.95(0.91) | 2.01(0.90) | 1.81(0.87) | 2.015 | 0.143 | ||
| 2 | 29 | 1.68(0.72) | 1.48(0.71) | 1.62(0.96) | 1.067 | 0.351 | |||
| 3 | 29 | 1.67(0.72) | 1.59(0.69) | 1.58(0.69) | 0.314 | 0.732 | |||
| Vigor | 1 | 30 | 2.87(1.32) | 2.50(1.28) | 2.65(1.37) | 0.953 | 0.392 | ||
| 2 | 29 | 3.06(1.21) | 3.08(1.56) | 2.66(1.59) | 1.008 | 0.371 | |||
| 3 | 29 | 3.22(1.31) | 2.42(1.24) | 2.57(1.49) | 5.930 | 0.005 | |||
Appendix D
| Classification | Allergens | Results | Groups | Total | ||
|---|---|---|---|---|---|---|
| Group 1 | Group 2 | Group 3 | ||||
| Plants | Grass | Negative | 31 | 26 | 28 | 85 |
| Positive | 2 | 3 | 1 | 6 | ||
| Tree 1 (bloom in early spring) | Negative | 28 | 28 | 28 | 84 | |
| Positive | 5 | 1 | 0 | 6 | ||
| Tree 2 (bloom in late spring) | Negative | 28 | 27 | 28 | 83 | |
| Positive | 5 | 2 | 0 | 7 | ||
| Mugwort | Negative | 31 | 29 | 29 | 89 | |
| Positive | 2 | 0 | 0 | 2 | ||
| Birch | Negative | 28 | 27 | 28 | 83 | |
| Positive | 4 | 2 | 0 | 6 | ||
| Nettle | Negative | 31 | 27 | 28 | 86 | |
| Positive | 2 | 2 | 0 | 4 | ||
| Oak | Negative | 28 | 27 | 28 | 83 | |
| Positive | 5 | 1 | 0 | 6 | ||
| Alder | Negative | 29 | 28 | 28 | 85 | |
| Positive | 4 | 1 | 0 | 5 | ||
| Humulus Japonicus | Negative | 28 | 28 | 28 | 84 | |
| Positive | 5 | 1 | 0 | 6 | ||
| Bermuda grass | Negative | 30 | 28 | 29 | 87 | |
| Positive | 3 | 1 | 0 | 4 | ||
| Orchard grass | Negative | 30 | 27 | 29 | 86 | |
| Positive | 3 | 2 | 0 | 5 | ||
| Poplar | Negative | 30 | 29 | 29 | 88 | |
| Positive | 3 | 0 | 0 | 3 | ||
| Ragweed | Negative | 31 | 29 | 29 | 89 | |
| Positive | 2 | 0 | 0 | 2 | ||
| Engl. Plantain | Negative | 28 | 28 | 29 | 85 | |
| Positive | 5 | 1 | 0 | 6 | ||
| Timothy grass | Negative | 32 | 26 | 29 | 87 | |
| Positive | 1 | 3 | 0 | 4 | ||
| Meadow Fescue | Negative | 31 | 27 | 29 | 87 | |
| Positive | 2 | 2 | 0 | 4 | ||
| Total Allergy Reaction Counts | 53 | 22 | 1 | 76 | ||
| Molds | Mold 1 | Negative | 33 | 28 | 29 | 90 |
| Positive | 0 | 1 | 0 | 1 | ||
| Mold 2 | Negative | 32 | 27 | 29 | 88 | |
| Positive | 1 | 2 | 0 | 3 | ||
| Alternaria | Negative | 31 | 26 | 25 | 82 | |
| Positive | 2 | 3 | 3 | 8 | ||
| Aspergillus | Negative | 31 | 28 | 29 | 88 | |
| Positive | 2 | 1 | 0 | 3 | ||
| Candida | Negative | 33 | 29 | 29 | 91 | |
| Positive | 0 | 0 | 0 | 0 | ||
| Cladosporium | Negative | 32 | 27 | 29 | 88 | |
| Positive | 1 | 2 | 0 | 3 | ||
| Penicillium | Negative | 32 | 27 | 29 | 88 | |
| Positive | 1 | 2 | 0 | 3 | ||
| Total Allergy Reaction Counts | 7 | 11 | 3 | 21 | ||
| Animals, Pests, and Dust Mites | Dog | Negative | 31 | 29 | 29 | 89 |
| Positive | 2 | 0 | 0 | 2 | ||
| Cat | Negative | 28 | 28 | 27 | 83 | |
| Positive | 5 | 1 | 2 | 8 | ||
| D. Farinae | Negative | 24 | 19 | 26 | 69 | |
| Positive | 9 | 10 | 3 | 22 | ||
| D. pteronys | Negative | 21 | 19 | 24 | 64 | |
| Positive | 12 | 10 | 5 | 27 | ||
| Tyrophagus | Negative | 28 | 24 | 29 | 81 | |
| Positive | 5 | 5 | 0 | 10 | ||
| Cockroach | Negative | 31 | 24 | 28 | 83 | |
| Positive | 2 | 4 | 1 | 7 | ||
| Total Allergy Reaction Counts | 35 | 30 | 11 | 76 | ||
References
- Ma, B.; Zhou, T.; Lei, S.; Wen, Y.; Htun, T.T. Effects of urban green spaces on residents’ well-being. Environ. Dev. Sustain. 2019, 21, 2793–2809. [Google Scholar] [CrossRef]
- Shanahan, D.F.; Bush, R.; Gaston, K.J.; Lin, B.B.; Dean, J.; Barber, E.; Fuller, R.A. Health benefits from nature experiences depend on dose. Sci. Rep. 2016, 6, 1–10. [Google Scholar] [CrossRef]
- Dadvand, P.; Villanueva, C.M.; Font-Ribera, L.; Martinez, D.; Basagaña, X.; Belmonte, J.; Vrijheid, M.; Gražulevičienė, R.; Kogevinas, M.; Nieuwenhuijsen, M.J. Risks and benefits of green spaces for children: A cross-sectional study of associations with sedentary behavior, obesity, asthma, and allergy. Environ. Health Perspect. 2014, 122, 1329–1335. [Google Scholar] [CrossRef] [PubMed]
- Bell, J.F.; Wilson, J.S.; Liu, G.C. Neighborhood greenness and 2-year changes in body mass index of children and youth. Am. J. Prev. Med. 2008, 35, 547–553. [Google Scholar] [CrossRef]
- Lee, A.C.; Maheswaran, R. The health benefits of urban green spaces: A review of the evidence. J. Public Health 2011, 33, 212–222. [Google Scholar] [CrossRef]
- Richardson, E.A.; Pearce, J.; Mitchell, R.; Kingham, S. Role of physical activity in the relationship between urban green space and health. Public Health 2013, 127, 318–324. [Google Scholar] [CrossRef]
- Ochiai, H.; Ikei, H.; Song, C.; Kobayashi, M.; Takamatsu, A.; Miura, T.; Kagawa, T.; Li, Q.; Kumeda, S.; Imai, M. Physiological and psychological effects of forest therapy on middle-aged males with high-normal blood pressure. Int. J. Environ. Res. Public Health 2015, 12, 2532–2542. [Google Scholar] [CrossRef] [PubMed]
- Barton, J.; Griffin, M.; Pretty, J. Exercise-, nature-and socially interactive-based initiatives improve mood and self-esteem in the clinical population. Perspect. Public Health 2012, 132, 89–96. [Google Scholar] [CrossRef] [PubMed]
- Barton, J.; Pretty, J. What is the best dose of nature and green exercise for improving mental health? A multi-study analysis. Environ. Sci. Technol. 2010, 44, 3947–3955. [Google Scholar] [CrossRef]
- Lee, J.; Tsunetsugu, Y.; Takayama, N.; Park, B.-J.; Li, Q.; Song, C.; Komatsu, M.; Ikei, H.; Tyrväinen, L.; Kagawa, T. Influence of forest therapy on cardiovascular relaxation in young adults. Evid.-Based Complement. Altern. Med. 2014, 2014. [Google Scholar] [CrossRef]
- Li, Q.; Kawada, T. Effect of forest therapy on the human psycho-neuro-endocrino-immune network. Nihon Eiseigaku Zasshi Jpn. J. Hyg. 2011, 66, 645–650. [Google Scholar] [CrossRef] [PubMed]
- Han, J.-W.; Choi, H.; Jeon, Y.-H.; Yoon, C.-H.; Woo, J.-M.; Kim, W. The effects of forest therapy on coping with chronic widespread pain: Physiological and psychological differences between participants in a forest therapy program and a control group. Int. J. Environ. Res. Public Health 2016, 13, 255. [Google Scholar] [CrossRef] [PubMed]
- Sung, J.; Woo, J.-M.; Kim, W.; Lim, S.-K.; Chung, E.-J. The Effect of Cognitive Behavior Therapy-based “Forest Therapy” Program on blood pressure, salivary cortisol level, and quality of life in elderly hypertensive patients. Clin. Exp. Hypertens. 2012, 34, 1–7. [Google Scholar] [CrossRef]
- Park, B.-J.; Shin, C.-S.; Shin, W.-S.; Chung, C.-Y.; Lee, S.-H.; Kim, D.-J.; Kim, Y.-H.; Park, C.-E. Effects of forest therapy on health promotion among middle-aged women: Focusing on physiological indicators. Int. J. Environ. Res. Public Health 2020, 17, 4348. [Google Scholar] [CrossRef] [PubMed]
- Bielinis, E.; Bielinis, L.; Krupińska-Szeluga, S.; Łukowski, A.; Takayama, N. The effects of a short forest recreation program on physiological and psychological relaxation in young polish adults. Forests 2019, 10, 34. [Google Scholar] [CrossRef]
- Twohig-Bennett, C.; Jones, A. The health benefits of the great outdoors: A systematic review and meta-analysis of greenspace exposure and health outcomes. Environ. Res. 2018, 166, 628–637. [Google Scholar] [CrossRef] [PubMed]
- Lyu, B.; Zeng, C.; Xie, S.; Li, D.; Lin, W.; Li, N.; Jiang, M.; Liu, S.; Chen, Q. Benefits of a three-day bamboo forest therapy session on the psychophysiology and immune system responses of male college students. Int. J. Environ. Res. Public Health 2019, 16, 4991. [Google Scholar] [CrossRef]
- Lee, I.; Choi, H.; Bang, K.-S.; Kim, S.; Song, M.; Lee, B. Effects of forest therapy on depressive symptoms among adults: A systematic review. Int. J. Environ. Res. Public Health 2017, 14, 321. [Google Scholar] [CrossRef]
- Chun, M.H.; Chang, M.C.; Lee, S.-J. The effects of forest therapy on depression and anxiety in patients with chronic stroke. Int. J. Neurosci. 2017, 127, 199–203. [Google Scholar] [CrossRef] [PubMed]
- Ohe, Y.; Ikei, H.; Song, C.; Miyazaki, Y. Evaluating the relaxation effects of emerging forest-therapy tourism: A multidisciplinary approach. Tour. Manag. 2017, 62, 322–334. [Google Scholar] [CrossRef]
- Song, C.; Ikei, H.; Lee, J.; Park, B.-J.; Kagawa, T.; Miyazaki, Y. Individual differences in the physiological effects of forest therapy based on Type A and Type B behavior patterns. J. Physiol. Anthropol. 2013, 32, 1–7. [Google Scholar] [CrossRef]
- Shin, W.S.; Shin, C.S.; Yeoun, P.S. The influence of forest therapy camp on depression in alcoholics. Environ. Health Prev. Med. 2012, 17, 73–76. [Google Scholar] [CrossRef] [PubMed]
- Tsunetsugu, Y.; Park, B.-J.; Lee, J.; Kagawa, T.; Miyazaki, Y. Psychological relaxation effect of forest therapy: Results of field experiments in 19 forests in Japan involving 228 participants. Nihon Eiseigaku Zasshi Jpn. J. Hyg. 2011, 66, 670–676. [Google Scholar] [CrossRef] [PubMed]
- Poulsen, D.V.; Stigsdotter, U.K.; Djernis, D.; Sidenius, U. ‘Everything just seems much more right in nature’: How veterans with Post-Traumatic Stress Disorder experience nature-based activities in a forest therapy garden. Health Psychol. Open 2016, 3. [Google Scholar] [CrossRef]
- Shin, W.S.; Yeoun, P.S.; Yoo, R.W.; Shin, C.S. Forest experience and psychological health benefits: The state of the art and future prospect in Korea. Environ. Health Prev. Med. 2010, 15, 38–47. [Google Scholar] [CrossRef] [PubMed]
- Lee, H.J.; Son, Y.-H.; Kim, S.; Lee, D.K. Healing experiences of middle-aged women through an urban forest therapy program. Urban For. Urban Green. 2019, 38, 383–391. [Google Scholar] [CrossRef]
- Fong, K.C.; Hart, J.E.; James, P. A review of epidemiologic studies on greenness and health: Updated literature through 2017. Curr. Environ. Health Rep. 2018, 5, 77–87. [Google Scholar] [CrossRef] [PubMed]
- Antonelli, M.; Donelli, D.; Barbieri, G.; Valussi, M.; Maggini, V.; Firenzuoli, F. Forest volatile organic compounds and their effects on human health: A state-of-the-art review. Int. J. Environ. Res. Public Health 2020, 17, 6506. [Google Scholar] [CrossRef]
- Woo, J.; Lee, C.J. Sleep-enhancing effects of phytoncide via behavioral, electrophysiological, and molecular modeling approaches. Exp. Neurobiol. 2020, 29, 120–129. [Google Scholar] [CrossRef] [PubMed]
- Matsuo, A.L.; Figueiredo, C.R.; Arruda, D.C.; Pereira, F.V.; Scutti, J.A.B.; Massaoka, M.H.; Travassos, L.R.; Sartorelli, P.; Lago, J.H. α-Pinene isolated from Schinus Terebinthifolius Raddi (Anacardiaceae) induces Apoptosis and Confers Antimetastatic Protection in a Melanoma Model. Biochem. Biophys. Res. Commun. 2011, 411, 449–454. [Google Scholar] [CrossRef] [PubMed]
- Kim, T.; Song, B.; Cho, K.S.; Lee, I.-S. Therapeutic potential of volatile terpenes and terpenoids from forests for inflammatory diseases. Int. J. Mol. Sci. 2020, 21, 2187. [Google Scholar] [CrossRef] [PubMed]
- Rufino, A.T.; Ribeiro, M.; Sousa, C.; Judas, F.; Salgueiro, L.; Cavaleiro, C.; Mendes, A.F. Evaluation of the anti-inflammatory, anti-catabolic and pro-anabolic effects of E-Caryophyllene, Myrcene and Limonene in a cell model of osteoarthritis. Eur. J. Pharmacol. 2015, 750, 141–150. [Google Scholar] [CrossRef] [PubMed]
- Souto-Maior, F.N.; de Carvalho, F.L.; de Morais, L.C.S.L.; Netto, S.M.; de Sousa, D.P.; de Almeida, R.N. Anxiolytic-like effects of inhaled linalool oxide in experimental mouse anxiety models. Pharmacol. Biochem. Behav. 2011, 100, 259–263. [Google Scholar] [CrossRef]
- Hirota, R.; Nakamura, H.; Bhatti, S.A.; Ngatu, N.R.; Muzembo, B.A.; Dumavibhat, N.; Eitoku, M.; Sawamura, M.; Suganuma, N. Limonene inhalation reduces allergic airway inflammation in dermatophagoides farinae-treated mice. Inhal. Toxicol. 2012, 24, 373–381. [Google Scholar] [CrossRef]
- Yun, J. Limonene inhibits methamphetamine-induced locomotor activity via regulation of 5-HT neuronal function and dopamine release. Phytomedicine 2014, 21, 883–887. [Google Scholar] [CrossRef]
- Yoshida, N.; Takada, T.; Yamamura, Y.; Adachi, I.; Suzuki, H.; Kawakami, J. Inhibitory effects of terpenoids on multidrug resistance-associated protein 2-and breast cancer resistance protein-mediated transport. Drug Metab. Dispos. 2008, 36, 1206–1211. [Google Scholar] [CrossRef] [PubMed]
- Chen, W.; Liu, Y.; Li, M.; Mao, J.; Zhang, L.; Huang, R.; Jin, X.; Ye, L. Anti-tumor effect of α-Pinene on human hepatoma cell lines through inducing G2/M cell cycle arrest. J. Pharmacol. Sci. 2015, 127, 332–338. [Google Scholar] [CrossRef]
- Aydin, Y.M.; Yaman, B.; Koca, H.; Altiok, H.; Dumanoglu, Y.; Kara, M.; Bayram, A.; Tolunay, D.; Odabasi, M.; Elbir, T. Comparison of Biogenic Volatile Organic Compound Emissions from Broad Leaved and Coniferous Trees in Turkey. WIT Trans. Ecol. Environ. 2014, 181, 647–658. [Google Scholar]
- Guenther, A.B.; Zimmerman, P.R.; Harley, P.C.; Monson, R.K.; Fall, R. Isoprene and Monoterpene Emission Rate Variability: Model Evaluations and Sensitivity Analyses. J. Geophys. Res. 1993, 98, 12609. [Google Scholar] [CrossRef]
- Lee, K.-H.; Kim, H.-C.; Hu, C.-G. A Study on the Estimation of BVOCs Emission in Jeju Island: Emission Characteristic and Situation. J. Environ. Sci. Int. 2015, 24, 207–219. [Google Scholar] [CrossRef]
- Choi, Y.; Kim, G.; Park, S.; Kim, E.; Kim, S. Prediction of Natural Volatile Organic Compounds Emitted by Bamboo Groves in Urban Forests. Forests 2021, 12, 543. [Google Scholar] [CrossRef]
- Valtchanov, D.; Barton, K.R.; Ellard, C. Restorative Effects of Virtual Nature Settings. Cyberpsychol. Behav. Soc. Netw. 2010, 13, 503–512. [Google Scholar] [CrossRef]
- Yu, C.-P.; Lee, H.-Y.; Luo, X.-Y. The Effect of Virtual Reality Forest and Urban Environments on Physiological and Psychological Responses. Urban For. Urban Green. 2018, 35, 106–114. [Google Scholar] [CrossRef]
- Hedblom, M.; Gunnarsson, B.; Iravani, B.; Knez, I.; Schaefer, M.; Thorsson, P.; Lundström, J.N. Reduction of Physiological Stress by Urban Green Space in a Multisensory Virtual Experiment. Sci. Rep. 2019, 9, 1–11. [Google Scholar] [CrossRef]
- Chiang, Y.-C.; Li, D.; Jane, H.-A. Wild or Tended Nature? The Effects of Landscape Location and Vegetation Density on Physiological and Psychological Responses. Landsc. Urban Plan. 2017, 167, 72–83. [Google Scholar] [CrossRef]
- Ulrich, R.S. Natural versus urban scenes: Some psychophysiological effects. Environ. Behav. 1981, 13, 523–556. [Google Scholar] [CrossRef]
- James, P.; Hart, J.E.; Banay, R.F.; Laden, F. Exposure to greenness and mortality in a nationwide prospective cohort study of women. Environ. Health Perspect. 2016, 124, 1344–1352. [Google Scholar] [CrossRef] [PubMed]
- James, P.; Banay, R.F.; Hart, J.E.; Laden, F. A review of the health benefits of greenness. Curr. Epidemiol. Rep. 2015, 2, 131–142. [Google Scholar] [CrossRef]
- Browning, M.; Lee, K. Within what distance does “greenness” best predict physical health? A systematic review of articles with GIS buffer analyses across the lifespan. Int. J. Environ. Res. Public Health 2017, 14, 675. [Google Scholar] [CrossRef]
- Rajoo, K.S.; Karam, D.S.; Aziz, N.A.A. Developing an effective forest therapy program to manage academic stress in conservative societies: A multi-disciplinary approach. Urban For. Urban Green. 2019, 43, 126353. [Google Scholar] [CrossRef]
- Song, C.; Ikei, H.; Miyazaki, Y. Sustained effects of a forest therapy program on the blood pressure of office workers. Urban For. Urban Green. 2017, 27, 246–252. [Google Scholar] [CrossRef]
- Kim, B.J.; Jeong, H.; Park, S.; Lee, S. Forest adjuvant anti-cancer therapy to enhance natural cytotoxicity in urban women with breast cancer: A preliminary prospective interventional study. Eur. J. Integr. Med. 2015, 7, 474–478. [Google Scholar] [CrossRef]
- Mori, H.; Saito, I.; Eguchi, E.; Maruyama, K.; Kato, T.; Tanigawa, T. Heart rate variability and blood pressure among Japanese men and women: A community-based cross-sectional study. Hypertens. Res. 2014, 37, 779–784. [Google Scholar] [CrossRef]
- Lutfi, M.F.; Sukkar, M.Y. Effect of blood pressure on heart rate variability. Khartoum Med. J. 2011, 4, 548–553. [Google Scholar]
- Lee, I.S.; Bang, K.S.; Kim, S.J.; Choi, H.S.; Lee, B.H.; Song, M.K. Effect of forest program on atopic dermatitis in children-a systematic review. J. Korean Inst. For. Recreat. 2016, 20, 1–13. [Google Scholar] [CrossRef][Green Version]
- Daig, R.; Andus, T.; Aschenbrenner, E.; Falk, W.; Schölmerich, J.; Gross, V. Increased interleukin 8 expression in the colon mucosa of patients with inflammatory bowel disease. Gut 1996, 38, 216–222. [Google Scholar] [CrossRef] [PubMed]
- Lovasi, G.S.; O’Neil-Dunne, J.P.; Lu, J.W.; Sheehan, D.; Perzanowski, M.S.; MacFaden, S.W.; King, K.L.; Matte, T.; Miller, R.L.; Hoepner, L.A. Urban tree canopy and asthma, wheeze, rhinitis, and allergic sensitization to tree pollen in a New York City birth cohort. Environ. Health Perspect. 2013, 121, 494–500. [Google Scholar] [CrossRef]
- Keddem, S.; Barg, F.K.; Glanz, K.; Jackson, T.; Green, S.; George, M. Mapping the urban asthma experience: Using qualitative GIS to understand contextual factors affecting asthma control. Soc. Sci. Med. 2015, 140, 9–17. [Google Scholar] [CrossRef]
- Mukaida, N.; Harada, A.; Matsushima, K. Interleukin-8 (IL-8) and monocyte chemotactic and activating factor (MCAF/MCP-1), chemokines essentially involved in inflammatory and immune reactions. Cytokine Growth Factor Rev. 1998, 9, 9–23. [Google Scholar] [CrossRef]
- Sethi, G.; Sung, B.; Aggarwal, B.B. TNF: A master switch for inflammation to cancer. Front. Biosci. 2008, 13, 5094–5107. [Google Scholar] [CrossRef]
- Li, Q.; Morimoto, K.; Nakadai, A.; Inagaki, H.; Katsumata, M.; Shimizu, T.; Hirata, Y.; Hirata, K.; Suzuki, H.; Miyazaki, Y. Forest bathing enhances human natural killer activity and expression of anti-cancer proteins. Int. J. Immunopathol. Pharmacol. 2007, 20 (Suppl. 2), 3–8. [Google Scholar] [CrossRef] [PubMed]
- Li, Q.; Morimoto, K.; Kobayashi, M.; Inagaki, H.; Katsumata, M.; Hirata, Y.; Hirata, K.; Shimizu, T.; Li, Y.J.; Wakayama, Y. A forest bathing trip increases human natural killer activity and expression of anti-cancer proteins in female subjects. J. Biol. Regul. Homeost. Agents 2008, 22, 45–55. [Google Scholar]
- Wen, Y.; Yan, Q.; Pan, Y.; Gu, X.; Liu, Y. Medical empirical research on forest bathing (Shinrin-Yoku): A systematic review. Environ. Health Prev. Med. 2019, 24, 1–21. [Google Scholar] [CrossRef] [PubMed]
- Yamanishi, Y.; Miyake, K.; Iki, M.; Tsutsui, H.; Karasuyama, H. Recent advances in understanding Basophil-Mediated Th2 immune responses. Immunol. Rev. 2017, 278, 237–245. [Google Scholar] [CrossRef]
- Romagnani, S. Induction of TH1 and TH2 responses: A key role for the “natural” immune response? Immunol. Today 1992, 13, 379–381. [Google Scholar] [CrossRef]
- Ebihara, I.; Hirayama, K.; Yamamoto, S.; Muro, K.; Yamagata, K.; Koyama, A. Th2 predominance at the single-cell level in patients with IgA nephropathy. Nephrol. Dial. Transplant. 2001, 16, 1783–1789. [Google Scholar] [CrossRef][Green Version]
- Kisuya, J.; Chemtai, A.; Raballah, E.; Keter, A.; Ouma, C. The diagnostic accuracy of Th1 (IFN-γ, TNF-α, and IL-2) and Th2 (IL-4, IL-6 and IL-10) cytokines response in AFB microscopy smear negative PTB- HIV co-infected patients. Sci. Rep. 2019, 9, 2966. [Google Scholar] [CrossRef]
- Bickel, M. The role of interleukin-8 in inflammation and mechanisms of regulation. J. Periodontol. 1993, 64 (Suppl. S5), 456–460. [Google Scholar]
- Truyen, E.; Coteur, L.; Dilissen, E.; Overbergh, L.; Dupont, L.; Ceuppens, J.; Bullens, D. Evaluation of airway inflammation by quantitative Th1/Th2 Cytokine MRNA measurement in sputum of asthma patients. Thorax 2006, 61, 202–208. [Google Scholar] [CrossRef]
- Farrow, M.R.; Washburn, K. A review of field experiments on the effect of forest bathing on anxiety and heart rate variability. Glob. Adv. Health Med. 2019, 8. [Google Scholar] [CrossRef] [PubMed]
- Rajoo, K.S.; Karam, D.S.; Abdullah, M.Z. The physiological and psychosocial effects of forest therapy: A systematic review. Urban For. Urban Green. 2020, 126744. [Google Scholar] [CrossRef]
- Ohtsuka, Y.; Yabunaka, N.; Takayama, S. Significance of “Shinrin-Yoku (forest-air bathing and walking)” as an exercise therapy for elderly patients with diabetes mellitus. Jpn. Soc. Balneol. Climatol. Phys. Med. 1998, 61, 101–105. [Google Scholar]
- Stier-Jarmer, M.; Throner, V.; Kirschneck, M.; Immich, G.; Frisch, D.; Schuh, A. The psychological and physical effects of forests on human health: A systematic review of systematic reviews and meta-analyses. Int. J. Environ. Res. Public Health 2021, 18, 1770. [Google Scholar] [CrossRef] [PubMed]
- Araruna, M.E.; Serafim, C.; Alves Júnior, E.; Hiruma-Lima, C.; Diniz, M.; Batista, L. Intestinal anti-inflammatory activity of terpenes in experimental models (2010–2020): A review. Molecules 2020, 25, 5430. [Google Scholar] [CrossRef]
- Li, Q. Effect of forest bathing trips on human immune function. Environ. Health. Prev. Med. 2010, 15, 9–17. [Google Scholar] [CrossRef]
- Hartig, T.; van den Berg, A.E.; Hagerhall, C.M.; Tomalak, M.; Bauer, N.; Hansmann, R.; Ojala, A.; Syngollitou, E.; Carrus, G.; van Herzele, A.; et al. Health benefits of nature experience: Psychological, social and cultural processes. In Forests, Trees and Human Health; Nilsson, K., Sangster, M., Gallis, C., Hartig, T., de Vries, S., Seeland, K., Schipperijn, J., Eds.; Springer: Dordrecht, The Netherlands, 2011; pp. 127–168. [Google Scholar] [CrossRef]
- Kaplan, S. The restorative benefits of nature: Toward an integrative framework. J. Environ. Psychol. 1995, 15, 169–182. [Google Scholar] [CrossRef]
- Song, C.; Ikei, H.; Miyazaki, Y. Physiological effects of nature therapy: A review of the research in Japan. Int. J. Environ. Res. Public Health 2016, 13, 781. [Google Scholar] [CrossRef]
- Chang, D.H.F.; Jiang, B.; Wong, N.H.L.; Wong, J.J.; Webster, C.; Lee, T.M.C. The human posterior cingulate and the stress-response benefits of viewing green urban landscapes. NeuroImage 2021, 226, 117555. [Google Scholar] [CrossRef]
- Van Praag, C.D.G.; Garfinkel, S.N.; Sparasci, O.; Mees, A.; Philippides, A.O.; Ware, M.; Ottaviani, C.; Critchley, H.D. Mind-wandering and alterations to default mode network connectivity when listening to naturalistic versus artificial sounds. Sci. Rep. 2017, 7, 1–12. [Google Scholar] [CrossRef] [PubMed]


| Indicators | Total | Male | Female | |
|---|---|---|---|---|
| Gender | 88 (100) | 49 (55.7) | 39 (44.3) | |
| Age (years) | 15 and below | 46 (52.3) | 27 (55.1) | 19 (48.7) |
| 16 and above | 42 (47.7) | 22 (44.9) | 20 (51.3) | |
| Region | Gimcheon | 30 (34.0) | 18 (36.7) | 12 (30.8) |
| Daejeon | 29 (33.0) | 18 (36.7) | 11 (28.2) | |
| Incheon | 29 (33.0) | 13 (26.6) | 16 (41.0) | |
| Forest Healing Experience | None | 60 (68.2) | 35 (71.4) | 25 (64.1) |
| Once | 26 (29.5) | 12 (24.5) | 14 (35.9) | |
| Twice | 2 (2.3) | 2 (4.1) | 0 (0.0) | |
| Health Examination Indicators | ||||
| Health Examination | Height(cm) | 165.14 ± 7.64 | 169.10 ± 5.99 | 160.08 ± 6.49 |
| Weight(kg) | 58.54 ± 10.44 | 59.95 ± 9.38 | 56.76 ± 11.52 | |
| BMI | 21.44 ± 3.45 | 20.91 ± 2.76 | 22.12 ± 4.12 | |
| Total Body Water | 33.31 ± 6.07 | 36.73 ± 4.57 | 28.94 ± 4.82 | |
| Protein | 8.90 ± 1.81 | 9.90 ± 1.28 | 7.63 ± 1.57 | |
| Mineral | 3.20 ± 0.54 | 3.45 ± 0.45 | 2.87 ± 0.47 | |
| Body Fat Mass | 13.08 ± 7.28 | 9.86 ± 5.47 | 17.19 ± 7.29 | |
| Soft Lean Mass | 42.68 ± 8.07 | 47.23 ± 5.91 | 36.89 ± 6.64 | |
| Fat Free Mass | 45.35 ± 8.47 | 50.08 ± 6.28 | 39.32 ± 6.94 | |
| Region | Classification | Mean | SD | Median |
|---|---|---|---|---|
| Gimcheon | Living Area (500 m) | 0.2646 | 0.1043 | 0.2577 |
| Walking Distance Area (1000 m) | 0.2736 | 0.1102 | 0.2724 | |
| Daejeon | Living Area (500 m) | 0.0560 | 0.0670 | 0.2699 |
| Walking Distance Area (1000 m) | 0.2436 | 0.0771 | 0.2435 | |
| Incheon | Living Area (500 m) | 0.2330 | 0.1124 | 0.2478 |
| Walking Distance Area (1000 m) | 0.2077 | 0.1137 | 0.1645 |
| % of Forest Area | 91.24% |
| Crown Density | 79.20% |
| NDVI | 0.392 |
| Vegetation Community | |
| Larix kaempferi | 69.37 |
| Quercus aliena | 16.29 |
| Deciduous broad-leaved | 3.23 |
| Pinus densiflora | 3.05 |
| Abies holophylla | 1.74 |
| Betula platyphylla | 1.73 |
| Pinus koraiensis | 1.63 |
| Quercus-Pinus mixed | 1.46 |
| Day | Time | Program |
|---|---|---|
| Day 1 | 14:00–15:00 | Orientation and safety education |
| 16:00–17:30 | Forest trail walking and do-it-yourself glass bottle crafts | |
| 19:00–20:30 | Building structures with wood blocks in forests | |
| 20:30 | Night forest walking | |
| Day 2 | 9:30–12:00 | Group forest trekking with hidden missions |
| 14:00–15:30 | Making a wooden clock | |
| 15:30–16:00 | ||
| 16:00–17:00 | Lecture on encouraging independence | |
| 19:00–20:30 | Listening to music in forests | |
| 20:30 | Night forest walking | |
| Day 3 | 9:30–11:30 | Lecture from seniors Post-treatment measurement |
| Methods | Indicators | |
|---|---|---|
| Physiological Indicator | Physical Examination | Systolic BP; Diastolic BP |
| eNO | ||
| LnTP; LnLF; LnHF; LnLF/HF; RMSDD; pNN50 | ||
| Complete Blood Count | RBC | |
| Platelet | ||
| Total WBC; Lymphocytes; Monocytes; Eosinophils; Basophils | ||
| Biochemical Examination | Cortisol; Serotonin | |
| d-ROMs | ||
| BAP (Biological Antioxidant Potential) | ||
| 25-(OH) Vitamin D; 1,25-(OH)3 Vitamin D | ||
| SGOT(AST); SGPT(ALT) | ||
| Total protein; Albumin; Bilirubin; BUN (Blood Urea Nitrogen); Creatinine; Glucose | ||
| Immuno- serological Examination | IL-4 HS Multiplex; IL-8 Multiplex | |
| TNF-α HS Multiplex | ||
| IFN-γ HS Multiplex | ||
| CD16+CD56 (count); CD16+CD56 (WB) | ||
| IgA | ||
| Saliva test | Secretory IgA (Saliva) | |
| Cortisol (Saliva) | ||
| Urine test | 8-OHdG | |
| Psychological Indicator | Self-report Survey | Resilience |
| Interpersonal competency | ||
| Self-esteem | ||
| Stress response | ||
| Vigor |
Publisher’s Note: MDPI stays neutral with regard to jurisdictional claims in published maps and institutional affiliations. |
© 2021 by the authors. Licensee MDPI, Basel, Switzerland. This article is an open access article distributed under the terms and conditions of the Creative Commons Attribution (CC BY) license (https://creativecommons.org/licenses/by/4.0/).
Share and Cite
Park, S.; Choi, Y.; Kim, G.; Kim, E.; Kim, S.; Paek, D. Physiological and Psychological Assessments for the Establishment of Evidence-Based Forest Healing Programs. Int. J. Environ. Res. Public Health 2021, 18, 9283. https://doi.org/10.3390/ijerph18179283
Park S, Choi Y, Kim G, Kim E, Kim S, Paek D. Physiological and Psychological Assessments for the Establishment of Evidence-Based Forest Healing Programs. International Journal of Environmental Research and Public Health. 2021; 18(17):9283. https://doi.org/10.3390/ijerph18179283
Chicago/Turabian StylePark, Sujin, Yeji Choi, Geonwoo Kim, Eunsoo Kim, Soojin Kim, and Domyung Paek. 2021. "Physiological and Psychological Assessments for the Establishment of Evidence-Based Forest Healing Programs" International Journal of Environmental Research and Public Health 18, no. 17: 9283. https://doi.org/10.3390/ijerph18179283
APA StylePark, S., Choi, Y., Kim, G., Kim, E., Kim, S., & Paek, D. (2021). Physiological and Psychological Assessments for the Establishment of Evidence-Based Forest Healing Programs. International Journal of Environmental Research and Public Health, 18(17), 9283. https://doi.org/10.3390/ijerph18179283