
Pediatric Traffic Injuries on Halloween in the United Kingdom: Prevalence and Injury Severity


 ,
, 
Abstract
:1. Introduction
2. Materials and Methods
2.1. Study Design and Setting
2.2. Casualties
2.3. Outcome and Variable Definitions
2.4. Statistical Analysis
3. Results
4. Discussion
5. Limitations
6. Conclusions
Author Contributions
Funding
Institutional Review Board Statement
Informed Consent Statement
Data Availability Statement
Acknowledgments
Conflicts of Interest
References
- Hughes, K.; McHale, P.; Wyke, S.; Lowey, H.; Bellis, M.A. Child injury: Using national emergency department monitoring systems to identify temporal and demographic risk factors. Inj. Prev. J. Int. Soc. Child Adolesc. Inj. Prev. 2014, 20, 74–80. [Google Scholar] [CrossRef] [PubMed]
- Chakravarthy, B.; Vaca, F.E.; Lotfipour, S.; Bradley, D. Pediatric pedestrian injuries: Emergency care considerations. Pediatric Emerg. Care 2007, 23, 738–744. [Google Scholar] [CrossRef] [PubMed]
- Kahn, C.A. Commentary: It’s the little things that matter. Ann. Emerg. Med. 2014, 63, 243–246. [Google Scholar] [CrossRef] [PubMed]
- Donahue, M.; Dukehart, J. Latest Trends in Child Pedestrian Safety: A Five Year Review; Safe Kids Worldwide: Washington, DC, USA, 2008. [Google Scholar]
- D’Ippolito, A.; Collins, C.L.; Comstock, R.D. Epidemiology of pediatric holiday-related injuries presenting to US emergency departments. Pediatrics 2010, 125, 931–937. [Google Scholar] [CrossRef] [PubMed] [Green Version]
- Kratz, A.; Petrov, A.; Polyakov, P.; Levy, J.; Lifshitz, T. Ocular injuries related to Independence Day celebrations. Harefuah 2006, 145, 254–256. [Google Scholar] [PubMed]
- Witsaman, R.J.; Comstock, R.D.; Smith, G.A. Pediatric fireworks-related injuries in the United States: 1990–2003. Pediatrics 2006, 118, 296–303. [Google Scholar] [CrossRef] [PubMed]
- Hankin, F.M.; Noellert, R.C.; Wilson, M.R. Hazards of pumpkin carving. Am. Fam. Phys. 1988, 38, 221–222. [Google Scholar]
- Brazier, D.J. Eye damage from Christmas trees. Lancet 1984, 2, 1335. [Google Scholar] [CrossRef]
- Philip, J.; Bresnihan, M.; Chambers, N. A Christmas tree in the larynx. Paediatr. Anaesth. 2004, 14, 1016–1020. [Google Scholar] [CrossRef] [PubMed]
- Schieber, R.A.; Thompson, N.J. Developmental risk factors for childhood pedestrian injuries. Inj. Prev. J. Int. Soc. Child Adolesc. Inj. Prev. 1996, 2, 228–236. [Google Scholar] [CrossRef] [PubMed] [Green Version]
- Schwebel, D.C.; Davis, A.L.; O’Neal, E.E. Child Pedestrian Injury: A Review of Behavioral Risks and Preventive Strategies. Am. J. Lifestyle Med. 2012, 6, 292–302. [Google Scholar] [CrossRef] [PubMed] [Green Version]
- Zhang, H.; Khan, A. Risk of preventable injuries associated with Halloween. Public Health 2020, 189, 94–96. [Google Scholar] [CrossRef] [PubMed]
- Centers for Disease Control and Prevention. Childhood pedestrian deaths during Halloween--United States, 1975-1996. In MMWR. Morbidity and Mortality Weekly Report; Centers for Disease Control and Prevention: Atlanta, GA, USA, 1997. [Google Scholar]
- Staples, J.A.; Yip, C.; Redelmeier, D.A. Pedestrian Fatalities Associated With Halloween in the United States. JAMA Pediatrics 2019, 173, 101–103. [Google Scholar] [CrossRef] [PubMed]
- Wynne, K. Trick or Treat Times 2020: When Does Halloween Night Start and End for Kids? Available online: https://www.google.com.hk/url?sa=t&rct=j&q=&esrc=s&source=web&cd=&ved=2ahUKEwimzuqi8NLyAhVXc3AKHYLNDHcQtwJ6BAgEEAM&url=https%3A%2F%2Fwww.newsweek.com%2Ftrick-treat-times-2020-when-does-halloween-night-start-end-kids-1543369&usg=AOvVaw2iVTjaivcD9Zag3ZzVLpvy (accessed on 24 August 2021).
- BV, T.I. London Traffic 2020. Available online: https://www.tomtom.com/en_gb/traffic-index/london-traffic/ (accessed on 24 August 2021).
- Wazana, A.; Krueger, P.; Raina, P.; Chambers, L. A review of risk factors for child pedestrian injuries: Are they modifiable? Inj. Prev. J. Int. Soc. Child Adolesc. Inj. Prev. 1997, 3, 295–304. [Google Scholar] [CrossRef] [PubMed] [Green Version]
- Hatfield, J.; Murphy, S. The effects of mobile phone use on pedestrian crossing behaviour at signalized and unsignalized intersections. Accid. Anal. Prev. 2007, 39, 197–205. [Google Scholar] [CrossRef] [PubMed]
- Nasar, J.; Hecht, P.; Wener, R. Mobile telephones, distracted attention, and pedestrian safety. Accid. Anal. Prev. 2008, 40, 69–75. [Google Scholar] [CrossRef] [PubMed]
- Bungum, T.J.; Day, C.; Henry, L.J. The association of distraction and caution displayed by pedestrians at a lighted crosswalk. J. Community Health 2005, 30, 269–279. [Google Scholar] [CrossRef] [PubMed]
- Aarts, L.T.; Commandeur, J.J.F.; Welsh, R.; Niesen, S.; Lerner, M.; Thomas, P.; Bos, N.; Davidse, R.J. Study on Serious Road Traffic Injuries in the EU; European Commission: Brussels, Belgium, 2016. [Google Scholar]
- World Health Organization. Manifesto for Safe Communities. Safety—A Universal Concern and Responsibility for All. In Proceedings of the First World Conference on Accident and Injury Prevention, Stockholm, Sweden, 17–20 September 1989. [Google Scholar]
- Zhou, Y.; Jiang, X.; Fu, C.; Liu, H. Operational factor analysis of the aggressive taxi speeders using random parameters Bayesian LASSO modeling approach. Accid. Anal. Prev. 2021, 157, 106183. [Google Scholar] [CrossRef] [PubMed]


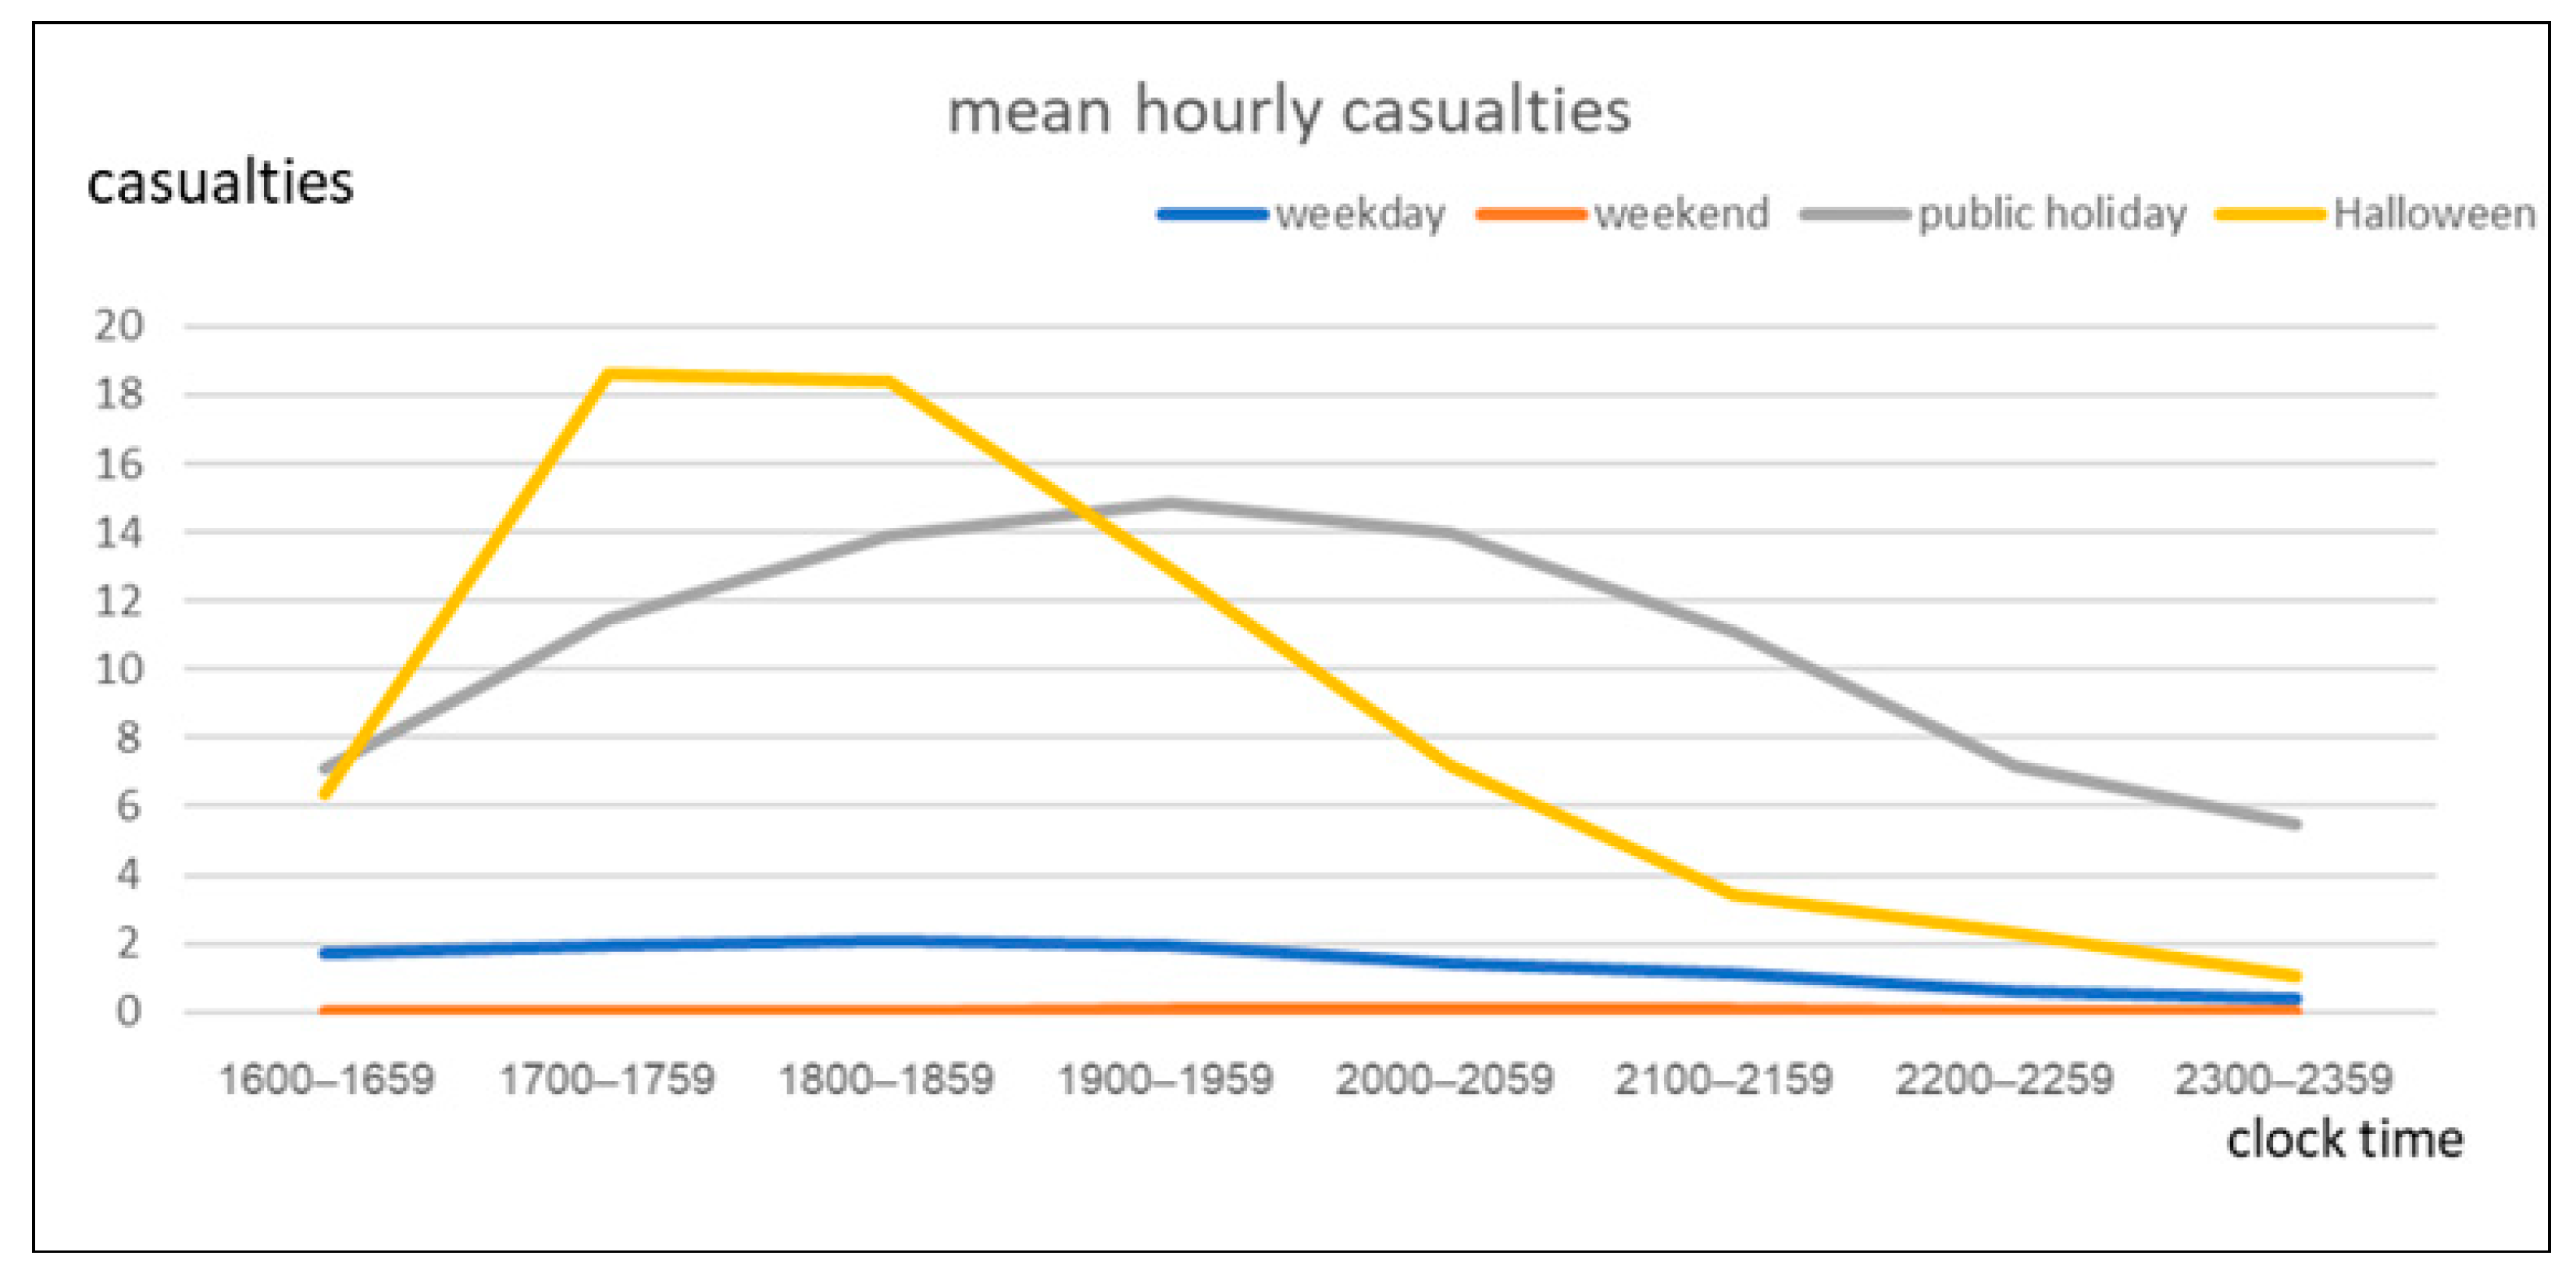
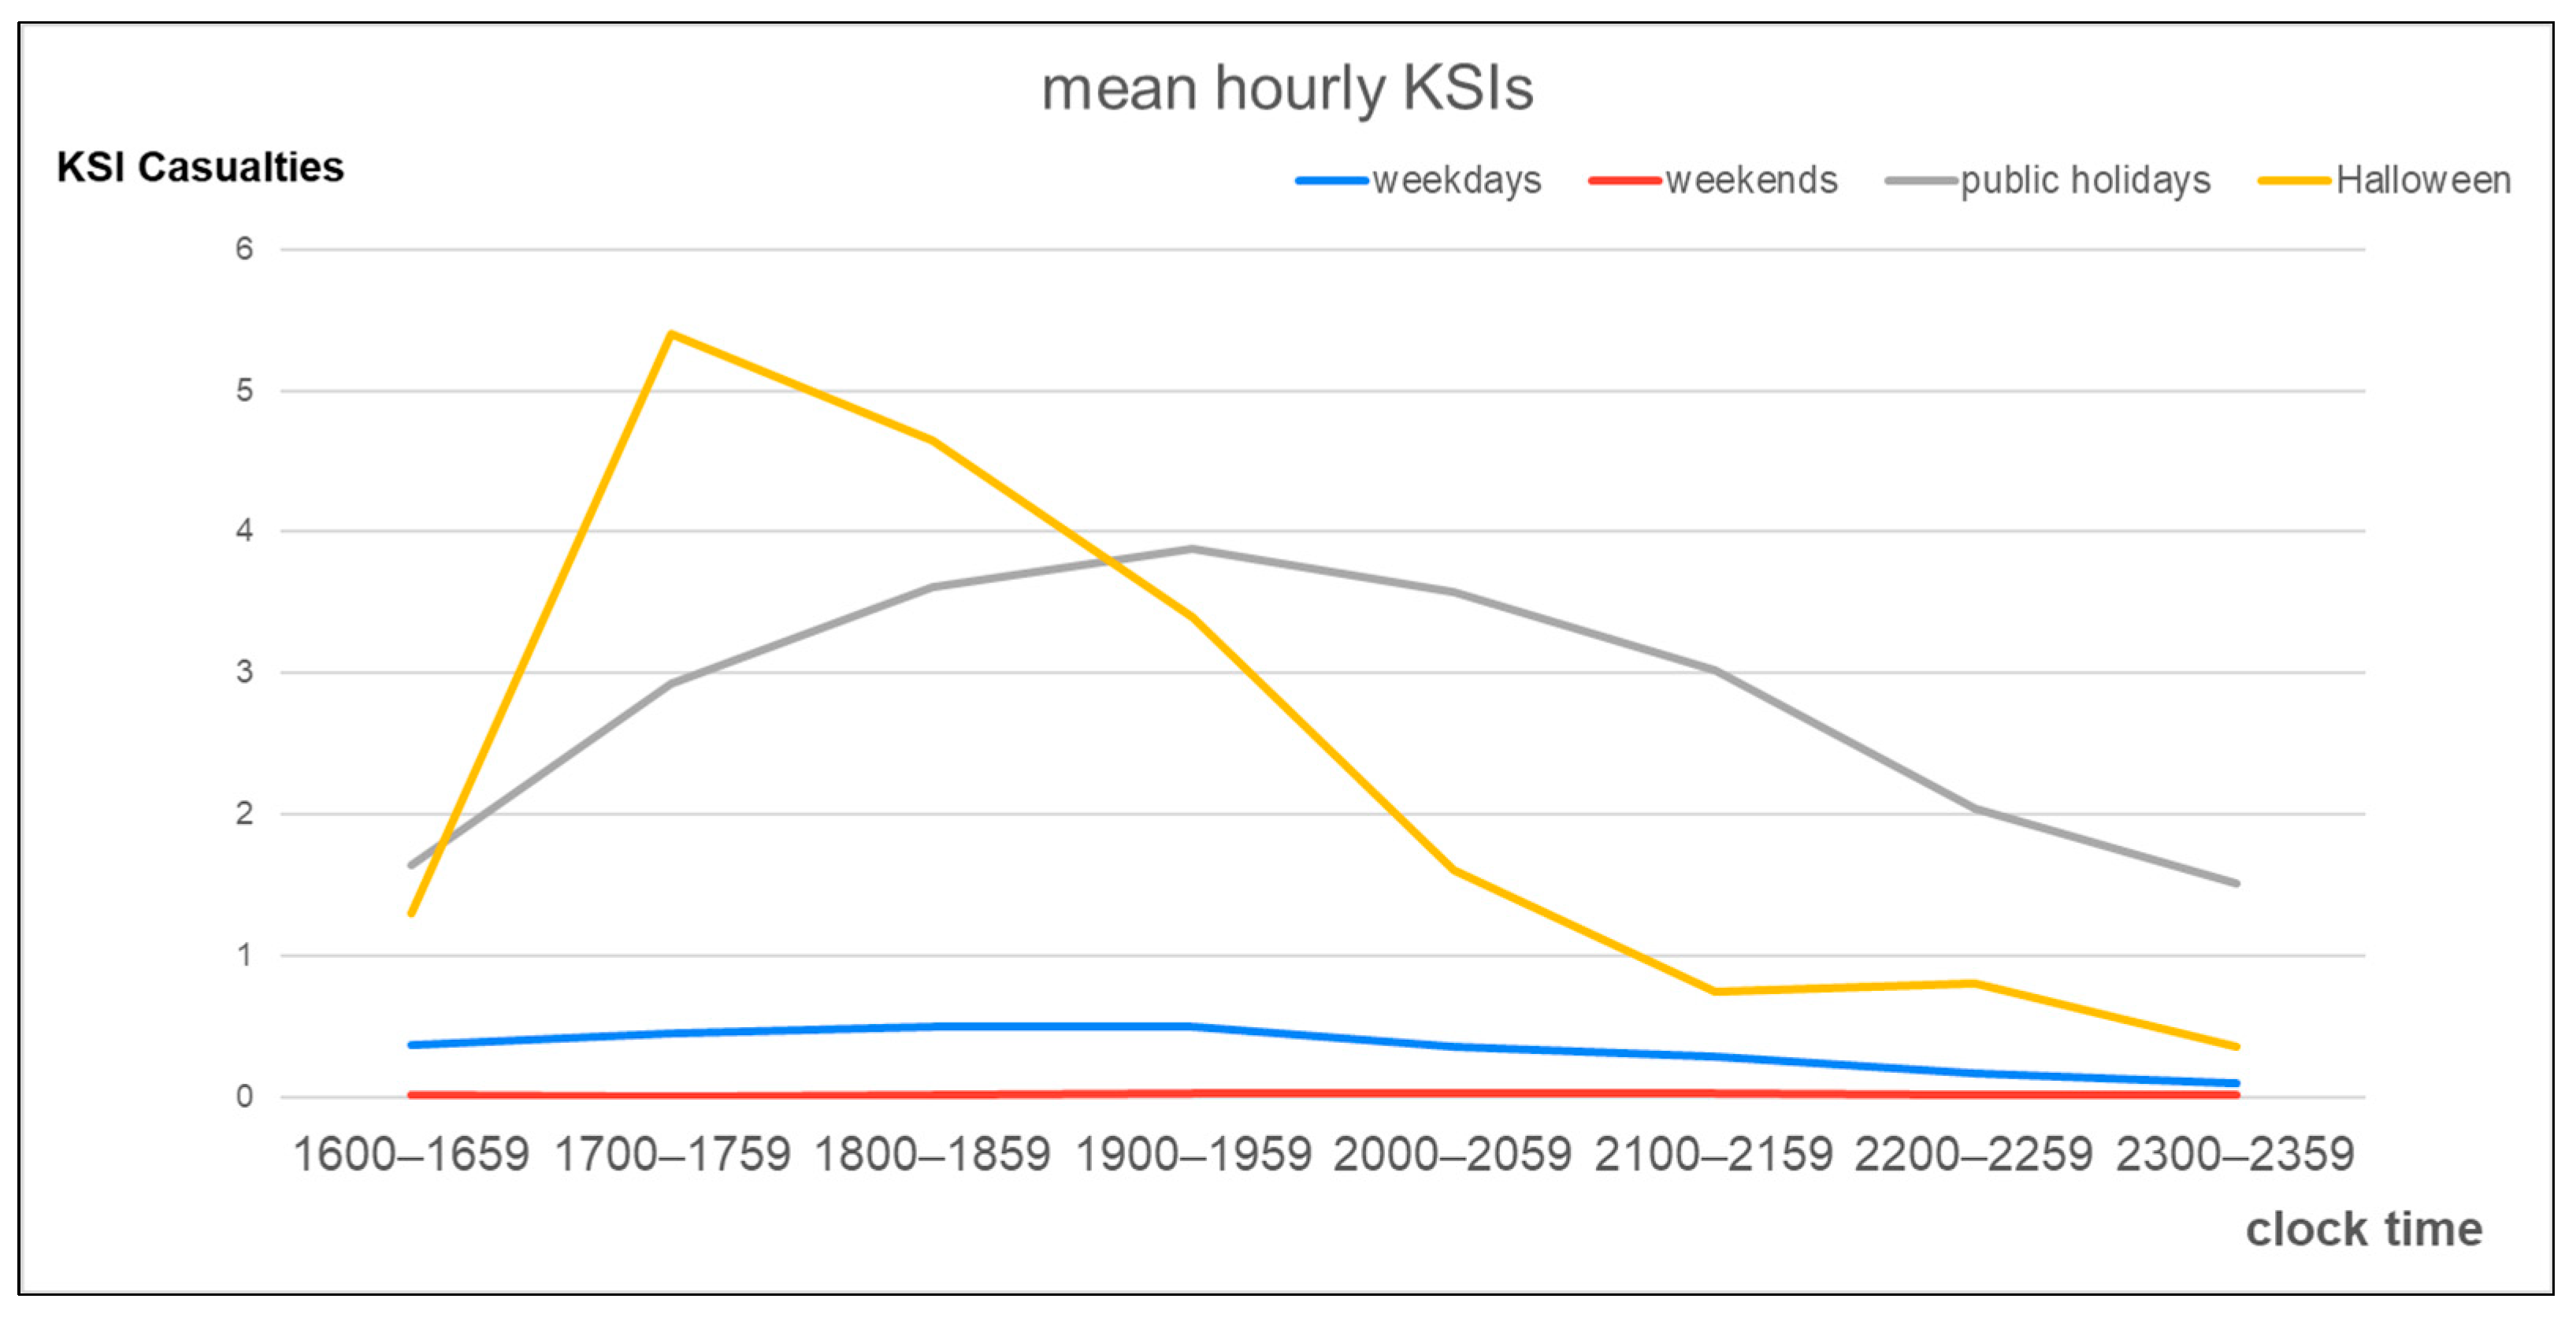
| Characteristic | Number of Casualties | Percentage (%) |
|---|---|---|
| Sex | ||
| Female | 43,625 | 59.28 |
| Male | 29,962 | 40.72 |
| Road type | ||
| Rural | 6504 | 8.84 |
| Urban | 67,083 | 91.16 |
| Weather | ||
| Fine | 59,076 | 80.28 |
| Adverse | 14,511 | 19.72 |
| Road condition | ||
| Dry | 46,753 | 63.53 |
| Not dry | 26,834 | 36.47 |
| Period of 16:00 to 00:00 | ||
| Weekday | 56,041 | 71.16 |
| Weekend day | 831 | 1.13 |
| Public holiday | 15,308 | 20.80 |
| Halloween | 1407 | 1.91 |
| Period of 16:00 to 17:00 | ||
| Weekday | 8508 | 85.27 |
| Weekend day | 59 | 0.59 |
| Public holiday | 1283 | 12.86 |
| Halloween | 128 | 1.28 |
| Period of 17:00 to 18:00 | ||
| Weekday | 9645 | 79.56 |
| Weekend day | 43 | 0.35 |
| Public holiday | 2062 | 17.01 |
| Halloween | 373 | 3.08 |
| Period of 18:00 to 19:00 | ||
| Weekday | 10,284 | 77.90 |
| Weekend day | 49 | 0.37 |
| Public holiday | 2500 | 18.94 |
| Halloween | 368 | 2.79 |
| Period of 19:00 to 20:00 | ||
| Weekday | 9679 | 75.81 |
| Weekend day | 160 | 1.25 |
| Public holiday | 2670 | 20.91 |
| Halloween | 259 | 2.03 |
| Period of 20:00 to 21:00 | ||
| Weekday | 7269 | 71.58 |
| Weekend day | 233 | 2.29 |
| Public holiday | 2509 | 24.71 |
| Halloween | 144 | 1.42 |
| Period of 21:00 to 22:00 | ||
| Weekday | 5828 | 72.45 |
| Weekend day | 153 | 1.90 |
| Public holiday | 1995 | 24.80 |
| Halloween | 68 | 0.85 |
| Period of 22:00 to 23:00 | ||
| Weekday | 3073 | 68.36 |
| Weekend day | 78 | 1.74 |
| Public holiday | 1298 | 28.88 |
| Halloween | 46 | 1.02 |
| Period of 23:00 to 00:00 | ||
| Weekday | 1755 | 62.17 |
| Weekend day | 56 | 1.98 |
| Public holiday | 991 | 35.10 |
| Halloween | 21 | 0.74 |
| Type of vehicle involved | ||
| Automobile | 66,926 | 90.95 |
| Large vehicle | 4215 | 5.73 |
| Motorcycle | 2105 | 2.86 |
| Bicycle | 341 | 0.46 |
| Injury severity | ||
| Slight injury | 55,358 | 75.23 |
| KSI | 18,229 | 24.77 |
| Total | 73,587 | 100.00 |
| Characteristics | KSI n (%) | Slight Injury n (%) | p-Value |
|---|---|---|---|
| Sex | <0.001 | ||
| Female | 6943 (23.17%) | 23,019 (76.83%) | |
| Male | 11,286 (25.87%) | 32,339 (74.13%) | |
| Road type | <0.001 | ||
| Rural | 2649 (40.73%) | 3855 (59.27%) | |
| Urban | 15,580 (23.22%) | 51,503 (76.78%) | |
| Weather | <0.001 | ||
| Fine | 14,912 (25.24%) | 44,164 (74.76%) | |
| Adverse | 3317 (22.86%) | 11,194 (77.14%) | |
| Road condition | 0.662 | ||
| Dry | 11,557 (24.72%) | 35,196 (75.28%) | |
| Not dry | 6672 (24.86%) | 20,162 (75.14%) | |
| Period of 16:00 to 17:00 | 0.450 | ||
| Weekday | 1865 (21.92%) | 6643 (78.08%) | |
| Weekend day | 17 (28.81%) | 42 (71.19%) | |
| Public holiday | 296 (23.07%) | 987 (76.93%) | |
| Halloween | 26 (20.31%) | 102 (79.69%) | |
| Period of 17:00 to 18:00 | 0.021 | ||
| Weekday | 2267 (23.50%) | 7378 (76.50%) | |
| Weekend day | 8 (18.60%) | 35 (81.40%) | |
| Public holiday | 527 (25.56%) | 1535 (74.44%) | |
| Halloween | 108 (28.95%) | 265 (71.05%) | |
| Period of 18:00 to 19:00 | 0.304 | ||
| Weekday | 2487 (24.18%) | 7797 (75.82%) | |
| Weekend day | 13 (26.53%) | 36 (73.47%) | |
| Public holiday | 649 (25.96%) | 1851 (74.04%) | |
| Halloween | 93 (25.27%) | 275 (74.73%) | |
| Period of 19:00 to 20:00 | 0.576 | ||
| Weekday | 2490 (25.73%) | 7189 (74.27%) | |
| Weekend day | 34 (21.25%) | 126 (78.75%) | |
| Public holiday | 699 (26.18%) | 1971 (73.82%) | |
| Halloween | 68 (26.25%) | 191 (73.75%) | |
| Period of 20:00 to 21:00 | 0.705 | ||
| Weekday | 1825 (25.11%) | 5444 (74.89%) | |
| Weekend day | 54 (23.18%) | 179 (76.82%) | |
| Public holiday | 642 (25.59%) | 1867 (74.41%) | |
| Halloween | 32 (22.22%) | 112 (77.78%) | |
| Period of 21:00 to 22:00 | 0.040 | ||
| Weekday | 1404 (24.09%) | 4424 (75.91%) | |
| Weekend day | 38 (24.84%) | 115 (75.16%) | |
| Public holiday | 544 (27.27%) | 1451 (72.73%) | |
| Halloween | 15 (22.06%) | 53 (77.94%) | |
| Period of 22:00 to 23:00 | 0.342 | ||
| Weekday | 851 (27.69%) | 2222 (72.31%) | |
| Weekend day | 16 (20.51%) | 62 (79.49%) | |
| Public holiday | 367 (28.27%) | 931 (71.73%) | |
| Halloween | 16 (34.78%) | 30 (65.22%) | |
| Period of 23:00 to 00:00 | 0.903 | ||
| Weekday | 486 (27.69%) | 1269 (72.31) | |
| Weekend day | 14 (25.00%) | 42 (75.00%) | |
| Public holiday | 271 (27.35%) | 720 (72.65%) | |
| Halloween | 7 (33.33%) | 14 (66.67%) | |
| Type of vehicle involved | <0.001 | ||
| Automobile | 16,383 (24.48%) | 50,543 (75.52%) | |
| Large vehicle | 1292 (30.65%) | 2933 (69.35%) | |
| Motorcycle | 477 (22.66%) | 1628 (77.34%) | |
| Bicycle | 77 (22.58%) | 264 (77.42%) |
| Variables | β | Standard Error | AOR (95% CI) | p-Value |
|---|---|---|---|---|
| Sex | ||||
| Male | 0.145 | 0.018 | 1.156 (1.117–1.197) | <0.001 |
| Female (ref) | - | |||
| Road type | ||||
| Rural | 0.816 | 0.027 | 2.261 (2.144–2.385) | <0.001 |
| Urban (ref) | - | |||
| Weather | ||||
| Fine | 0.190 | 0.027 | 1.209 (1.148–1.274) | <0.001 |
| Adverse (ref) | - | |||
| Road condition | ||||
| Not dry | 0.092 | 0.022 | 1.100 (1.051–1.143) | <0.001 |
| Dry (ref) | - | |||
| Type of vehicle involved | ||||
| Motorcycle | −0.027 | 0.141 | 0.974 (0.739–1.283) | 0.850 |
| Automobile | 0.367 | 0.135 | 1.443 (1.108–1.879) | 0.006 |
| Large vehicle | 0.065 | 0.131 | 1.067 (0.826–1.378) | 0.621 |
| Bicycle (ref) | - | |||
| Period of 16:00 to 17:00 | ||||
| Halloween | −0.032 | 0.222 | 0.969 (0.626–1.498) | 0.886 |
| Public holiday | 0.092 | 0.072 | 1.096 (0.952–1.262) | 0.203 |
| Weekend day | 0.406 | 0.291 | 1.501 (0.849–2.652) | 0.162 |
| Weekday (ref) | - | - | ||
| Period of 17:00 to 18:00 | ||||
| Halloween | 0.294 | 0.118 | 1.342 (1.065–1.692) | 0.013 |
| Public holiday | −0.108 | 0.056 | 1.114 (0.997–1.244) | 0.057 |
| Weekend day | −0.356 | 0.396 | 0.701 (0.322–1.524) | 0.369 |
| Weekday (ref) | - | - | ||
| Period of 18:00 to 19:00 | ||||
| Halloween | 0.078 | 0.123 | 1.081 (0.849–1.376) | 0.527 |
| Public holiday | 0.095 | 0.052 | 1.100 (0.994–1.216) | 0.066 |
| Weekend day | 0.119 | 0.327 | 1.127 (0.593–2.140) | 0.716 |
| Weekday (ref) | - | - | ||
| Period of 19:00 to 20:00 | ||||
| Halloween | 0.053 | 0.144 | 1.054 (0.795–1.398) | 0.714 |
| Public holiday | 0.026 | 0.050 | 1.027 (0.931–1.133) | 0.599 |
| Weekend day | −0.199 | 0.195 | 0.820 (0.559–1.202) | 0.309 |
| Weekday (ref) | - | - | ||
| Period of 20:00 to 21:00 | ||||
| Halloween | −0.159 | 0.204 | 0.853 (0.572–1.271) | 0.434 |
| Public holiday | 0.009 | 0.054 | 1.010 (0.908–1.121) | 0.867 |
| Weekend day | −0.125 | 0.159 | 0.883 (0.647–1.206) | 0.433 |
| Weekday (ref) | - | - | ||
| Period of 21:00 to 22:00 | ||||
| Halloween | −0.125 | 0.296 | 0.882 (0.493–1.577) | 0.672 |
| Public holiday | 0.156 | 0.060 | 1.170 (1.040–1.314) | 0.009 |
| Weekend day | 0.071 | 0.191 | 1.073 (0.738–1.560) | 0.712 |
| Weekday (ref) | - | - | ||
| Period of 22:00 to 23:00 | ||||
| Halloween | 0.212 | 0.319 | 1.237 (0.662–2.311) | 0.506 |
| Public holiday | 0.013 | 0.075 | 1.013 (0.875–1.173) | 0.862 |
| Weekend day | −0.389 | 0.286 | 0.678 (0.387–1.188) | 0.174 |
| Weekday (ref) | - | - | ||
| Period of 23:00 to 00:00 | ||||
| Halloween | 0.257 | 0.474 | 1.293 (0.511–3.272) | 0.588 |
| Public holiday | −0.023 | 0.091 | 0.977 (0.818–1.168) | 0.799 |
| Weekend day | −0.054 | 0.320 | 0.947 (0.506–1.773) | 0.865 |
| Weekday (ref) | - | - |
Publisher’s Note: MDPI stays neutral with regard to jurisdictional claims in published maps and institutional affiliations. |
© 2021 by the authors. Licensee MDPI, Basel, Switzerland. This article is an open access article distributed under the terms and conditions of the Creative Commons Attribution (CC BY) license (https://creativecommons.org/licenses/by/4.0/).
Share and Cite
Hsu, L.-M.; Wiratama, B.S.; Chen, P.-L.; Saleh, W.; Lin, H.-A.; Pai, C.-W. Pediatric Traffic Injuries on Halloween in the United Kingdom: Prevalence and Injury Severity. Int. J. Environ. Res. Public Health 2021, 18, 9093. https://doi.org/10.3390/ijerph18179093
Hsu L-M, Wiratama BS, Chen P-L, Saleh W, Lin H-A, Pai C-W. Pediatric Traffic Injuries on Halloween in the United Kingdom: Prevalence and Injury Severity. International Journal of Environmental Research and Public Health. 2021; 18(17):9093. https://doi.org/10.3390/ijerph18179093
Chicago/Turabian StyleHsu, Li-Min, Bayu Satria Wiratama, Ping-Ling Chen, Wafaa Saleh, Hui-An Lin, and Chih-Wei Pai. 2021. "Pediatric Traffic Injuries on Halloween in the United Kingdom: Prevalence and Injury Severity" International Journal of Environmental Research and Public Health 18, no. 17: 9093. https://doi.org/10.3390/ijerph18179093
APA StyleHsu, L.-M., Wiratama, B. S., Chen, P.-L., Saleh, W., Lin, H.-A., & Pai, C.-W. (2021). Pediatric Traffic Injuries on Halloween in the United Kingdom: Prevalence and Injury Severity. International Journal of Environmental Research and Public Health, 18(17), 9093. https://doi.org/10.3390/ijerph18179093