
Municipality Data as a Rapid and Effective Tool to Analyse Spatial and Temporal Variations of All-Cause Mortality by Town District: The Experience in Genoa (Italy)

 , , , ,
Abstract
:1. Introduction
2. Materials and Methods
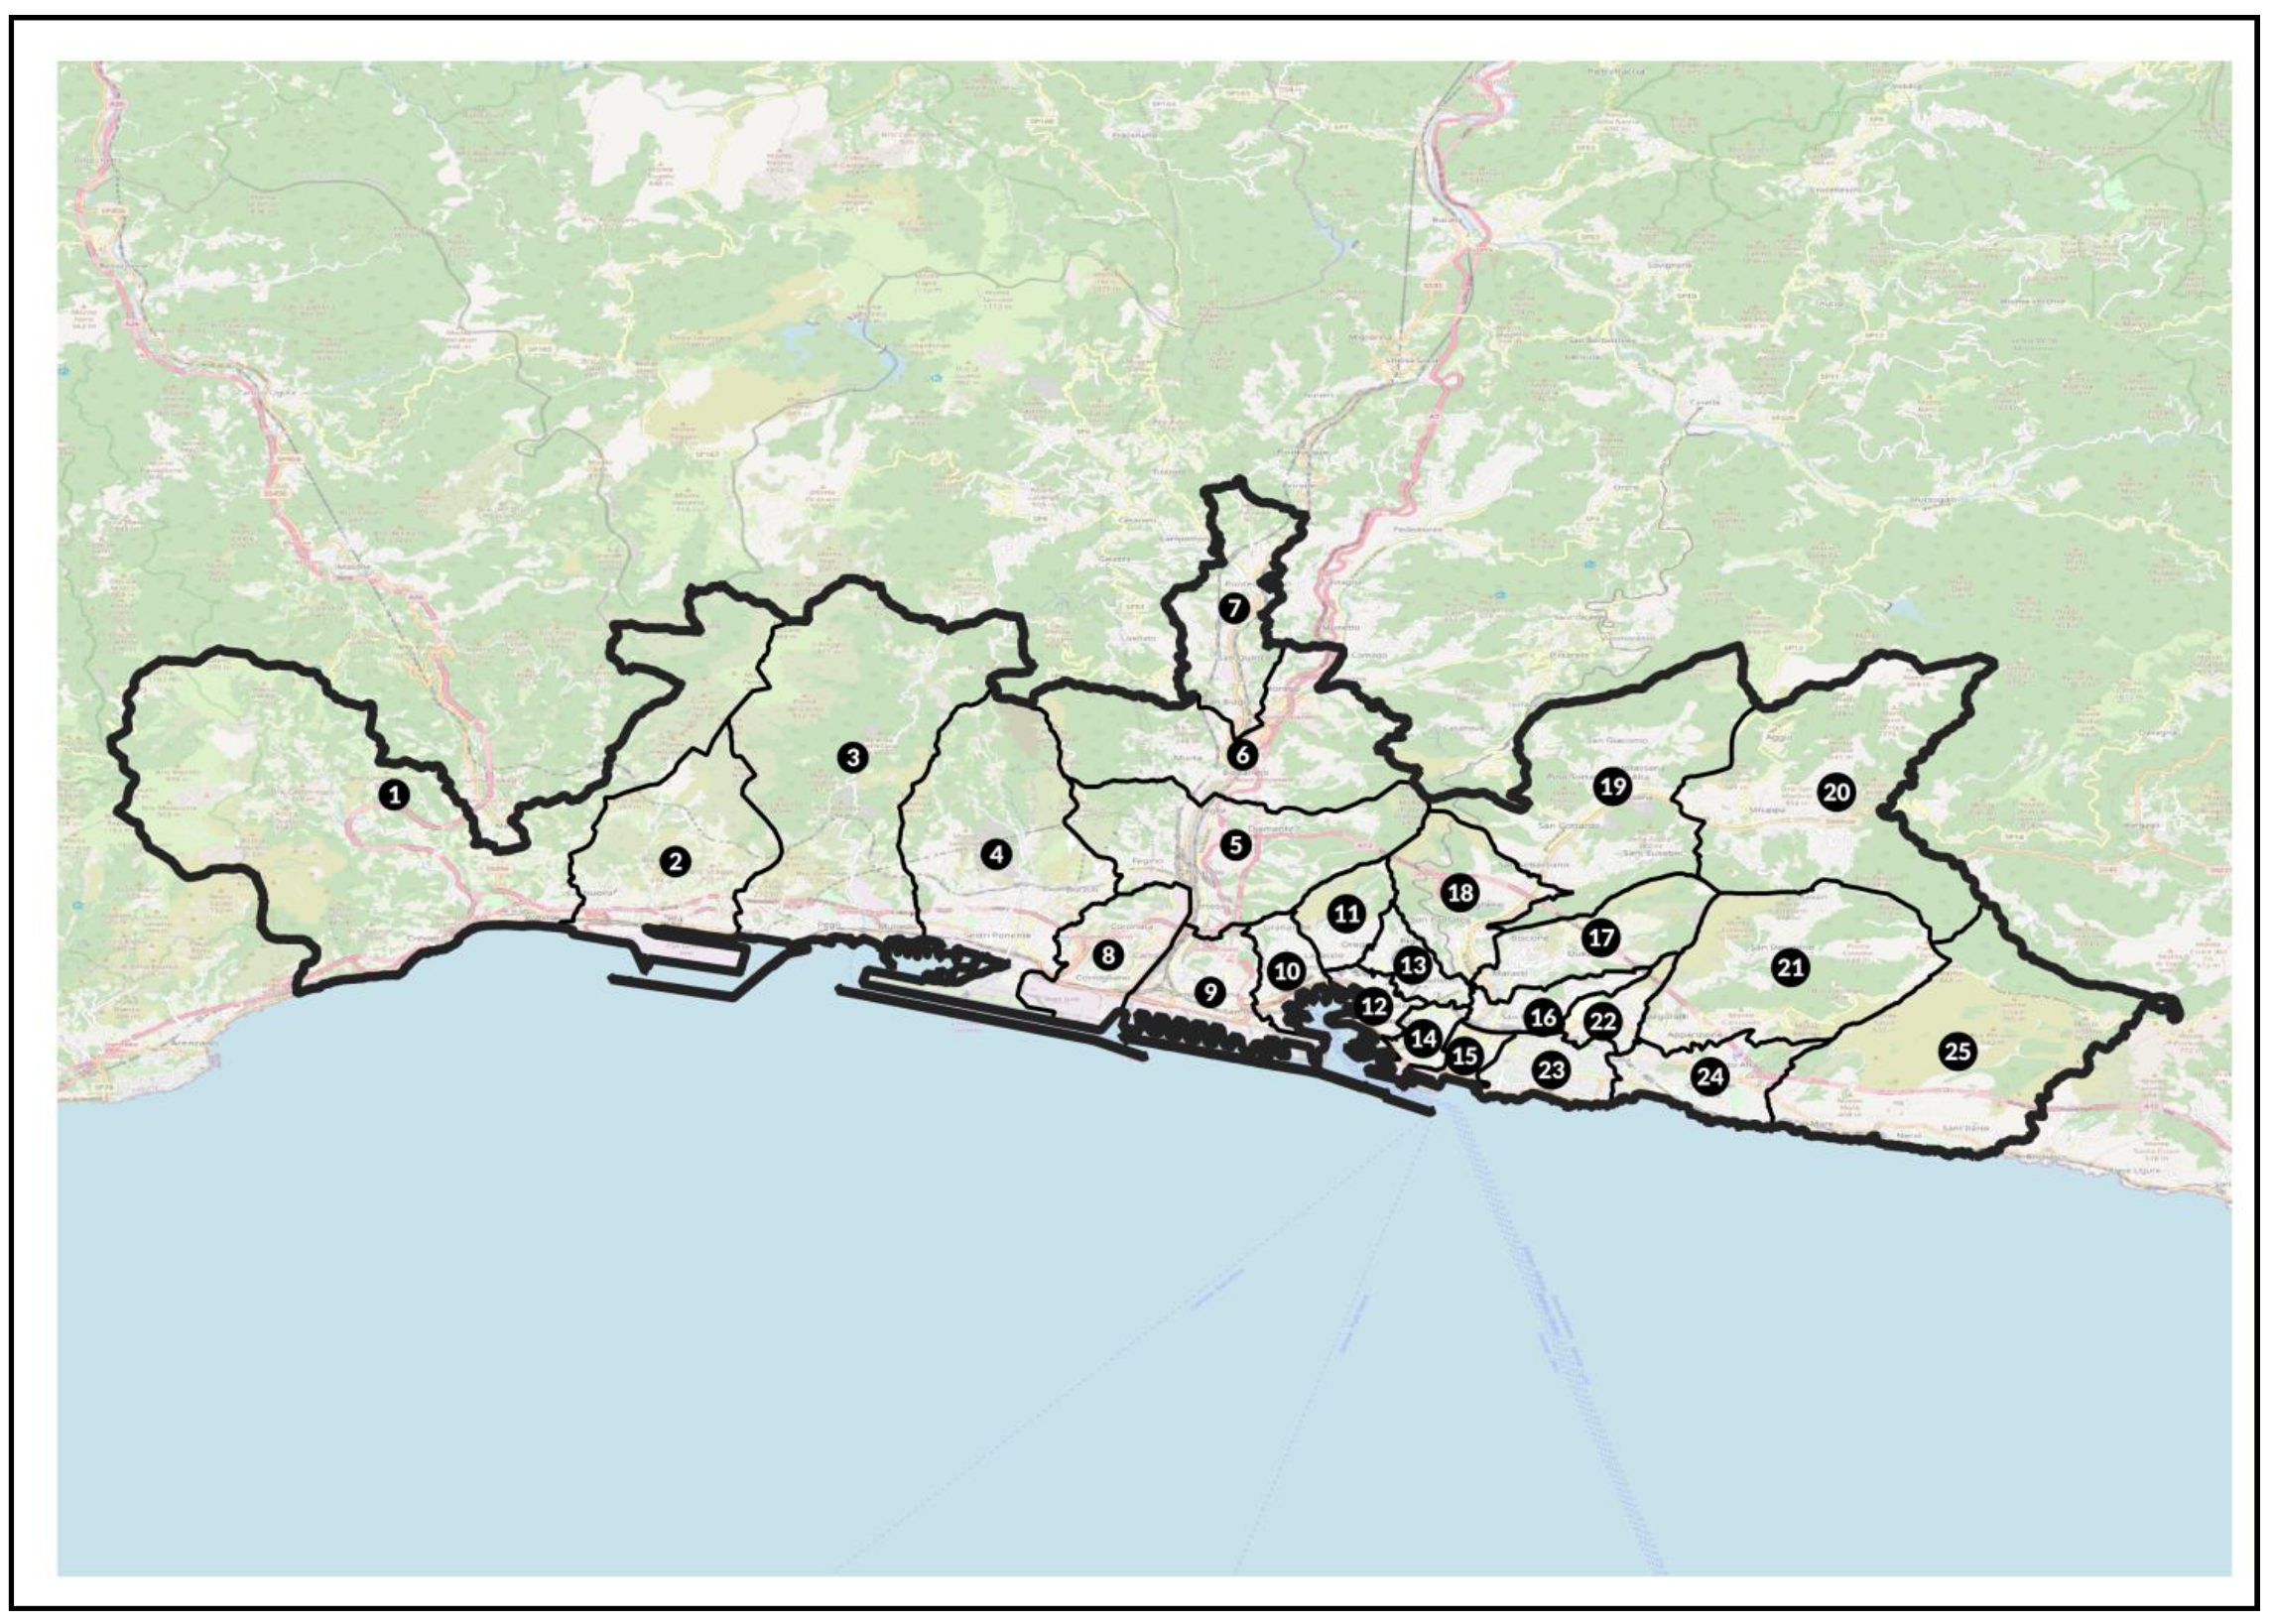
2.1. Population under Study
2.2. Study Design and Statistical Analysis
2.2.1. SMR
2.2.2. SDR
3. Results
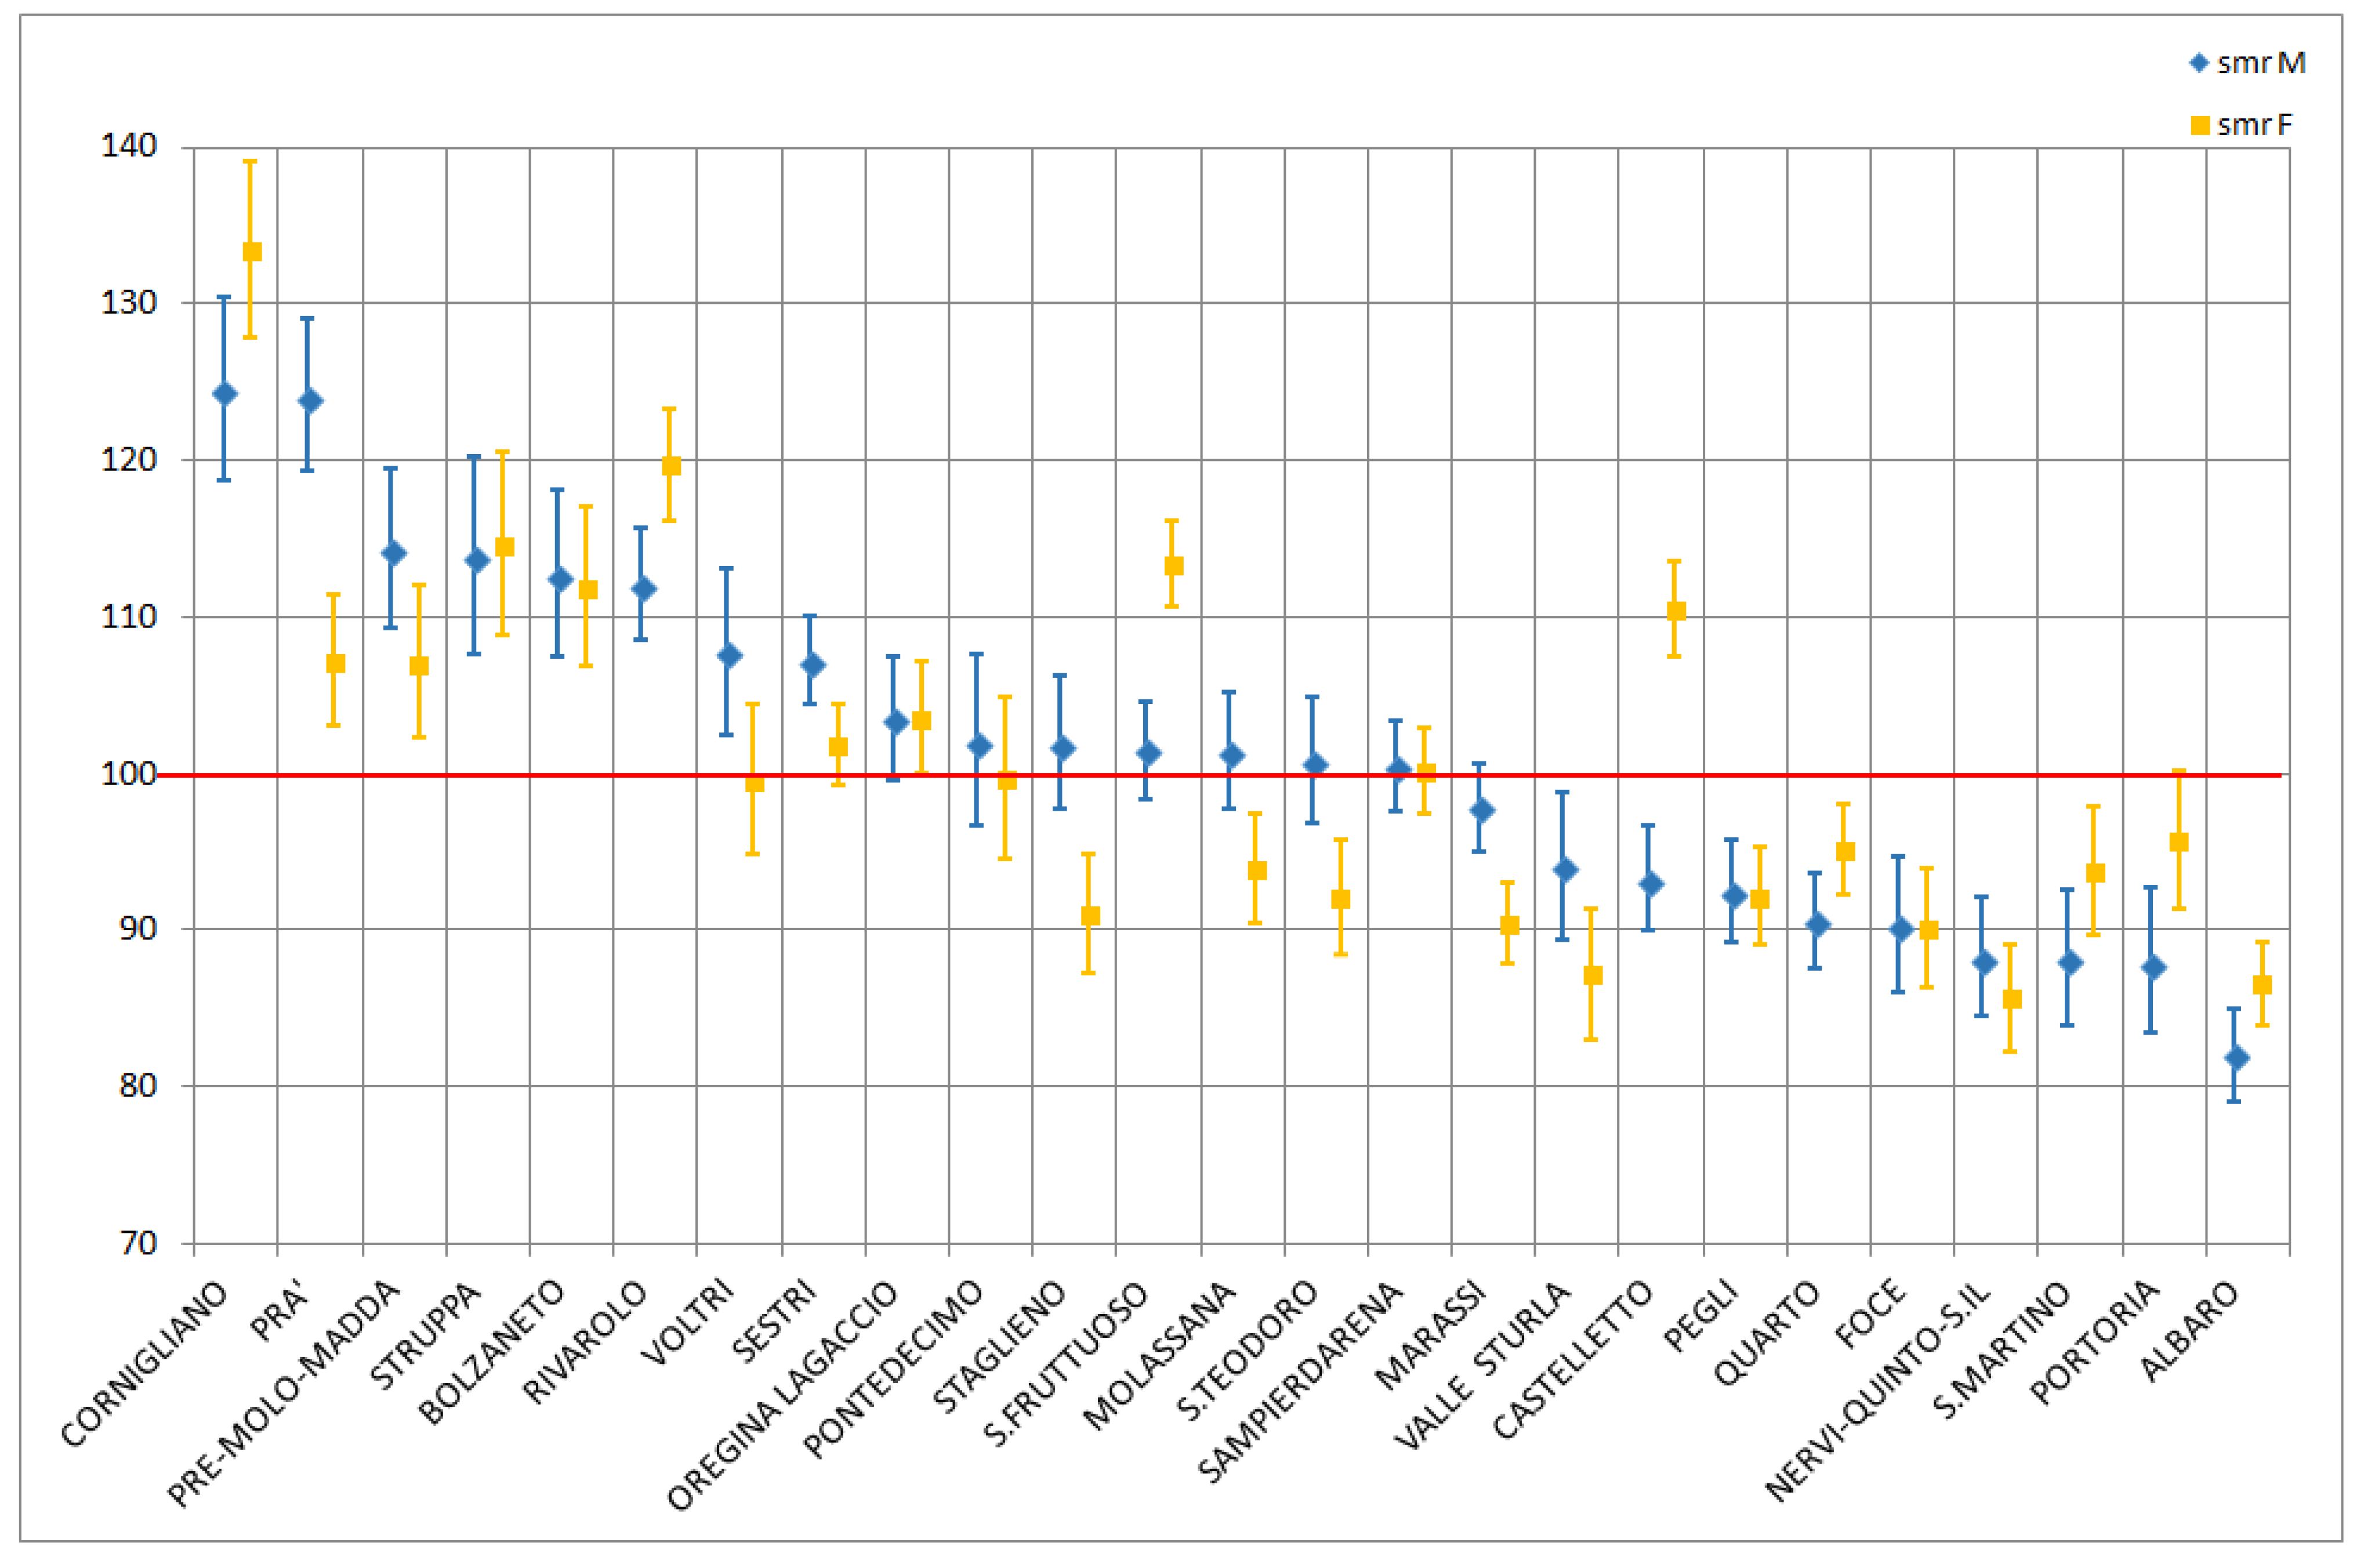
3.1. SMR Analysis
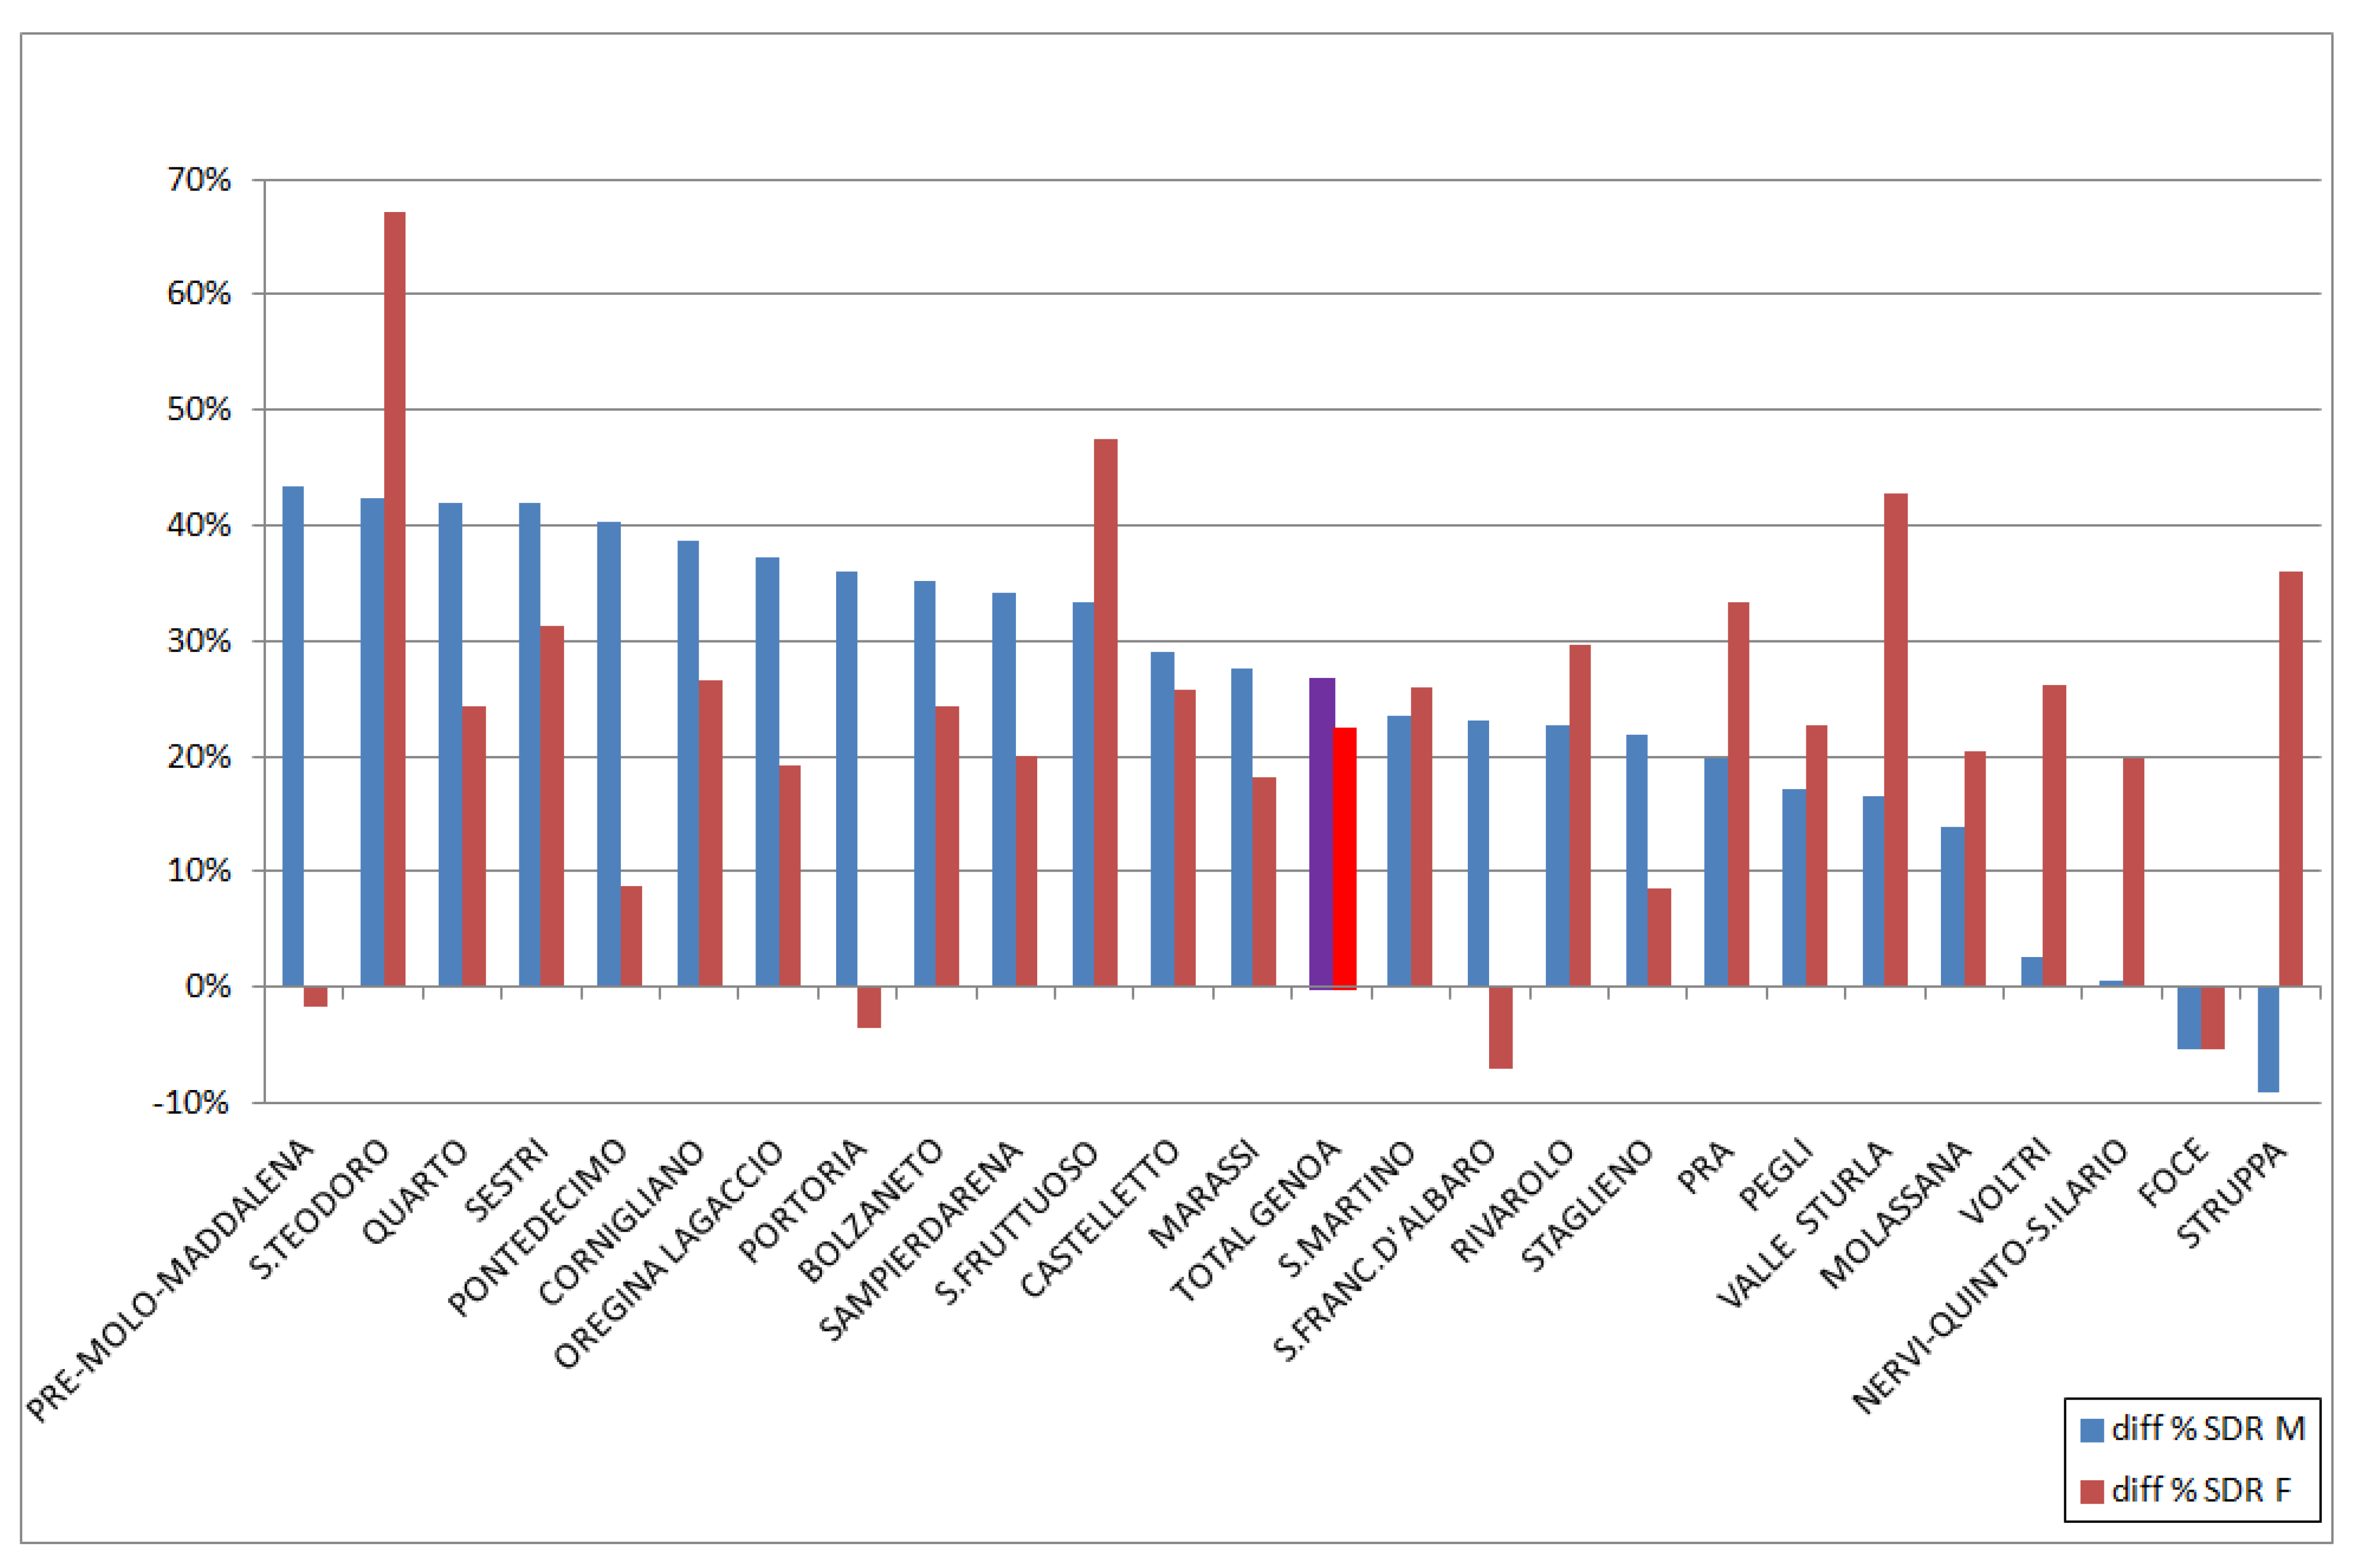
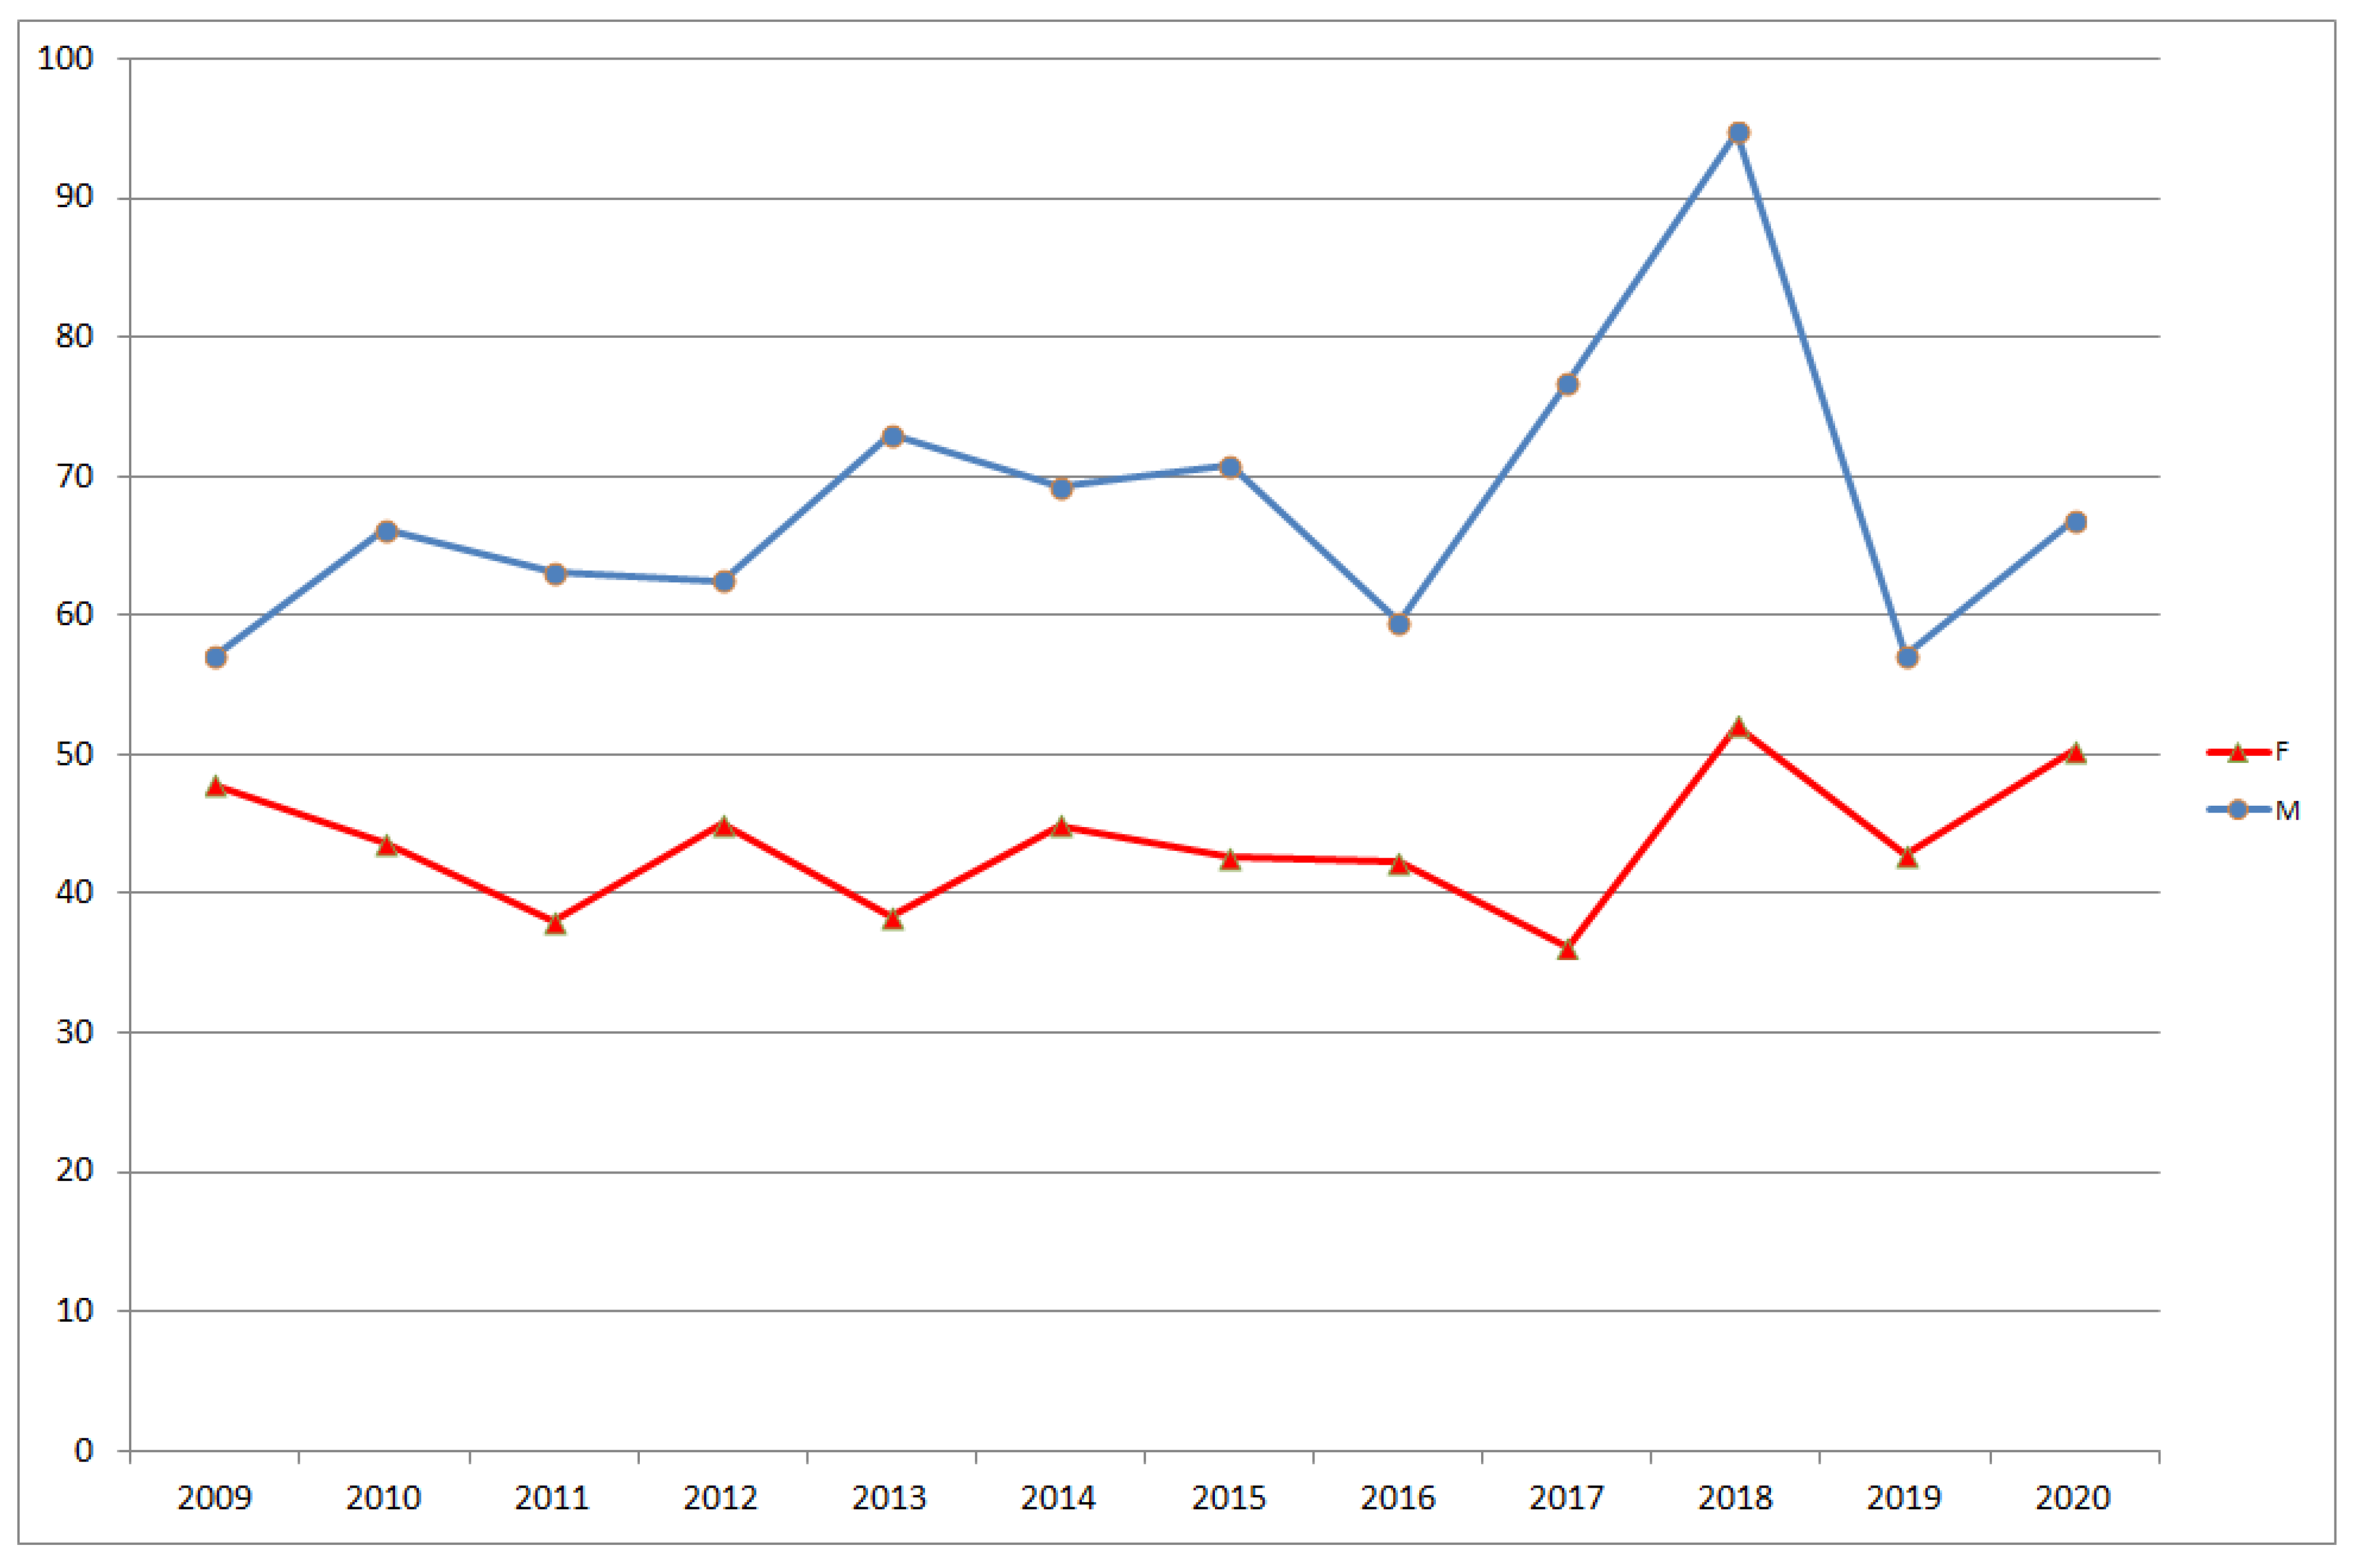
3.2. SDR Analysis
4. Discussion
5. Conclusions
Supplementary Materials
Author Contributions
Funding
Institutional Review Board Statement
Informed Consent Statement
Data Availability Statement
Acknowledgments
Conflicts of Interest
References
- Biganzoli, E.; Vaglienti, F.; Boracchi, P.; Luconi, E.; Castaldi, S.; Ferrara, A.; Panella, C.; Galli, M. The Milano Sforza Registers. MedRxiv 2021. [Google Scholar] [CrossRef]
- Bills of Mortality. Available online: https://billsofmortality.org/category/bills-of-mortality/ (accessed on 30 June 2021).
- Mccord, C.; Freeman, H.P. Excess Mortality in Harlem. N. Engl. J. Med. 1990, 322, 173–177. [Google Scholar] [CrossRef] [PubMed]
- Marmot, M.; Bell, R. Social inequalities in health: A proper concern of epidemiology. Ann. Epidemiol. 2016, 26, 238–240. [Google Scholar] [CrossRef]
- Indici demografici e Struttura di Genova. Available online: https://www.tuttitalia.it/liguria/45-genova/statistiche/indici-demografici-struttura-popolazione/ (accessed on 30 June 2021).
- ISTAT. STATBASE. Available online: https://www.istat.it/it/dati-analisi-e-prodotti/banche-dati/statbase (accessed on 30 June 2021).
- Esteve, J.; Benhamou, E.; Raymond, L. Statistical Methods in Cancer Research Volume IV: Descriptive Epidemiology; IARC Scientific Publication No. 128; WHO: Lyon, France, 1994; pp. 49–105. ISBN 978-92-832-2128-9. [Google Scholar]
- R Core Team. R: A Language and Environment for Statistical Computing; R foundation for Statistical Computing: Vienna, Austria, 2020; Available online: https://www.R-project.org/ (accessed on 30 June 2021).
- Aragon, T.J. Epitools: Epidemiology Tools. R Package Version 0.5–10.1, 2020. Available online: https://CRAN.R-project.org/package=epitool (accessed on 30 June 2021).
- Fay, M.P.; Feuer, E.J. Confidence intervals for directly standardized rates: A method based on the gamma distribution. Stat. Med. 1997, 16, 791–801. [Google Scholar] [CrossRef]
- Eurostat. Revision of the European Standard Population. Available online: https://ec.europa.eu/eurostat/web/products-manuals-and-guidelines/-/ks-ra-13-028 (accessed on 30 June 2021).
- ISTAT. Health For All-Italia. Available online: https://www.istat.it/it/archivio/14562 (accessed on 30 June 2021).
- ISTAT. Grafici Interattivi sui Decessi. Available online: https://www.istat.it/it/archivio/241428 (accessed on 30 June 2021).
- Raleigh, V.S. Tackling UK’s mortality problem: COVID-19 and other causes. BMJ 2020, 369, m2295. [Google Scholar] [CrossRef] [PubMed]
- Borrell, C.; Arias, A. Socioeconomic factors and mortality in urban settings: The case of Barcelona, Spain. J. Epidemiol. Community Health 1995, 49, 460–465. [Google Scholar] [CrossRef] [PubMed] [Green Version]
- Borrell, C.; Azlor, E.; Rodriguez-Sanz, M.; Puigpinos-Riera, R.; Cano-Serral, G.; I Pasarin, M.; Martinez, J.M.; Benach, J.; Muntaner, C. Trends in socioeconomic mortality inequalities in a southern European urban setting at the turn of the 21st century. J. Epidemiol. Community Health 2008, 62, 258–266. [Google Scholar] [CrossRef] [PubMed]
- Karpati, A.M.; Bassett, M.T.; Mccord, C. Neighbourhood mortality inequalities in New York City, 1989–1991 and 1999–2001. J. Epidemiol. Community Health 2006, 60, 1060–1064. [Google Scholar] [CrossRef] [Green Version]
- Casella, C.; Garrone, E.; Gennaro, V.; Orengo, M.A.; Puppo, A.; Stagnaro, E.; Viarengo, P.; Vercelli, M. Stato di salute dei residenti nei pressi di un’acciaieria [Health conditions of the general population living near a steel plant. Epidemiol. Prev. 2005, 29 (Suppl. 5–6), 77–86. (In Italian) [Google Scholar]
- Tosca, M.; Ruffoni, S.; Canonica, G.W.; Ciprandi, G. Asthma exacerbation in children: Relationship among pollens, weather, and air pollution. Allergol. Immunopathol. 2014, 42, 362–368. [Google Scholar] [CrossRef]
- Parodi, S.; Vercelli, M.; Garrone, E.; Fontana, V.; Izzotti, A. Ozone air pollution and daily mortality in Genoa, Italy between 1993 and 1996. Public Health 2005, 119, 844–850. [Google Scholar] [CrossRef]
- Parodi, S.; Stagnaro, E.; Casella, C.; Puppo, A.; Daminelli, E.; Fontana, V.; Valerio, F.; Vercelli, M. Lung cancer in an urban area in Northern Italy near a coke oven plant. Lung Cancer 2005, 47, 155–164. [Google Scholar] [CrossRef]
- Malaspina, P.; Tixi, S.; Brunialti, G.; Frati, L.; Paoli, L.; Giordani, P.; Modenesi, P.; Loppi, S. Biomonitoring urban air pollution using transplanted lichens: Element concentrations across seasons. Environ. Sci. Pollut. Res. 2014, 21, 12836–12842. [Google Scholar] [CrossRef] [PubMed]
- Testi, A.; Ivaldi, E. Material versus social deprivation and health: A case study of an urban area. Eur. J. Health Econ. 2008, 10, 323–328. [Google Scholar] [CrossRef] [PubMed]
- Quaglia, A.; Lillini, R.; Casella, C.; Giachero, G.; Izzotti, A.; Vercelli, M. The combined effect of age and socio-economic status on breast cancer survival. Crit. Rev. Oncol. 2011, 77, 210–220. [Google Scholar] [CrossRef] [PubMed]
- Vercelli, M.; Lillini, R.; Capocaccia, R.; Micheli, A.; Coebergh, J.W.; Quinn, M.; Martinez-Garcia, C.; Quaglia, A. Cancer survival in the elderly: Effects of socio-economic factors and health care system features (ELDCARE project). Eur. J. Cancer 2006, 42, 234–242. [Google Scholar] [CrossRef] [PubMed] [Green Version]
- Crouse, D.L.; Pinault, L.; Balram, A.; Hystad, P.; A Peters, P.; Chen, H.; van Donkelaar, A.; Martin, R.V.; Ménard, R.; Robichaud, A.; et al. Urban greenness and mortality in Canada’s largest cities: A national cohort study. Lancet Planet. Health 2017, 1, e289–e297. [Google Scholar] [CrossRef]
- Gotsens, M.; Ferrando, J.; Marí-Dell’Olmo, M.; Palència, L.; Bartoll, X.; Gandarillas, A.; Sanchez-Villegas, P.; Esnaola, S.; Daponte, A.; Borrell, C. Effect of the Financial Crisis on Socioeconomic Inequalities in Mortality in Small Areas in Seven Spanish Cities. Int. J. Environ. Res. Public Health 2020, 17, 958. [Google Scholar] [CrossRef] [PubMed] [Green Version]
- Rojas-Rueda, D.; de Nazelle, A.; Teixidó, O.; Nieuwenhuijsen, M. Replacing car trips by increasing bike and public transport in the greater Barcelona metropolitan area: A health impact assessment study. Environ. Int. 2012, 49, 100–109. [Google Scholar] [CrossRef] [PubMed]
- Rigolon, A.; Browning, M.; McAnirlin, O.; Yoon, H. Green Space and Health Equity: A Systematic Review on the Potential of Green Space to Reduce Health Disparities. Int. J. Environ. Res. Public Health 2021, 18, 2563. [Google Scholar] [CrossRef] [PubMed]
- Mitchell, R.; Popham, F. Effect of exposure to natural environment on health inequalities: An observational population study. Lancet 2008, 372, 1655–1660. [Google Scholar] [CrossRef] [Green Version]
- Galofré-Vilà, G.; McKee, M.; Bor, J.; Meissner, C.; Stuckler, D. A lesson from history? Worsening mortality and the rise of the Nazi Party in 1930s Germany. Public Health 2021, 195, 18–21. [Google Scholar] [CrossRef] [PubMed]


Publisher’s Note: MDPI stays neutral with regard to jurisdictional claims in published maps and institutional affiliations. |
© 2021 by the authors. Licensee MDPI, Basel, Switzerland. This article is an open access article distributed under the terms and conditions of the Creative Commons Attribution (CC BY) license (https://creativecommons.org/licenses/by/4.0/).
Share and Cite
Contiero, P.; Tagliabue, G.; Tittarelli, A.; Bertoldi, M.; Tresoldi, C.; Barigelletti, G.; Perotti, V.; Balbo, V.; Rizzieri, S.; D’Orazi, M.; et al. Municipality Data as a Rapid and Effective Tool to Analyse Spatial and Temporal Variations of All-Cause Mortality by Town District: The Experience in Genoa (Italy). Int. J. Environ. Res. Public Health 2021, 18, 8250. https://doi.org/10.3390/ijerph18168250
Contiero P, Tagliabue G, Tittarelli A, Bertoldi M, Tresoldi C, Barigelletti G, Perotti V, Balbo V, Rizzieri S, D’Orazi M, et al. Municipality Data as a Rapid and Effective Tool to Analyse Spatial and Temporal Variations of All-Cause Mortality by Town District: The Experience in Genoa (Italy). International Journal of Environmental Research and Public Health. 2021; 18(16):8250. https://doi.org/10.3390/ijerph18168250
Chicago/Turabian StyleContiero, Paolo, Giovanna Tagliabue, Andrea Tittarelli, Martina Bertoldi, Claudio Tresoldi, Giulio Barigelletti, Viviana Perotti, Vittoria Balbo, Stefania Rizzieri, Marco D’Orazi, and et al. 2021. "Municipality Data as a Rapid and Effective Tool to Analyse Spatial and Temporal Variations of All-Cause Mortality by Town District: The Experience in Genoa (Italy)" International Journal of Environmental Research and Public Health 18, no. 16: 8250. https://doi.org/10.3390/ijerph18168250
APA StyleContiero, P., Tagliabue, G., Tittarelli, A., Bertoldi, M., Tresoldi, C., Barigelletti, G., Perotti, V., Balbo, V., Rizzieri, S., D’Orazi, M., & Gennaro, V. (2021). Municipality Data as a Rapid and Effective Tool to Analyse Spatial and Temporal Variations of All-Cause Mortality by Town District: The Experience in Genoa (Italy). International Journal of Environmental Research and Public Health, 18(16), 8250. https://doi.org/10.3390/ijerph18168250