
High BMI and Low Muscular Fitness Predict Low Motor Competence in School-Aged Children Living in Low-Resourced Areas


Abstract
:1. Introduction
2. Materials and Methods
2.1. Participants
2.2. Measurements
2.3. Statistical Analysis
3. Results
3.1. Participants
3.2. PERF-FIT Performance
3.2.1. Static Balance SIS
3.2.2. Dynamic Balance SIS
3.2.3. Jumping and Hopping SIS
4. Discussion
Study Strengths and Limitations
5. Conclusions
Supplementary Materials
Author Contributions
Funding
Institutional Review Board Statement
Informed Consent Statement
Data Availability Statement
Acknowledgments
Conflicts of Interest
References
- Abarca-Gómez, L.; Abdeen, Z.A.; Hamid, Z.A.; Abu-Rmeileh, N.M.; Acosta-Cazares, B.; Acuin, C.; Cho, Y. Worldwide trends in body-mass index, underweight, overweight, and obesity from 1975 to 2016: A pooled analysis of 2416 population-based measurement studies in 1289 million children, adolescents, and adults. Lancet 2017, 390, 2627–2642. [Google Scholar] [CrossRef] [Green Version]
- Haywood, X.; Pienaar, A.E. The mediating effect of physical fitness on long term influences of overweight in primary school girls’ academic performance. J. Sports Med. Phys. Fit. 2021, 61, 63–74. [Google Scholar] [CrossRef]
- Otitoola, O.; Oldewage-Theron, W.; Egal, A. Prevalence of overweight and obesity among selected schoolchildren and adolescents in Cofimvaba, South Africa. S. Afr. J. Clin. Nutr. 2020, 1–6. [Google Scholar] [CrossRef] [Green Version]
- Akowuah, P.; Kobia-Acquah, E. Childhood Obesity and Overweight in Ghana: A Systematic Review and Meta-Analysis. J. Nutr. Metab. 2020, 2020, 1907416. [Google Scholar] [CrossRef] [PubMed] [Green Version]
- Armstrong, M.E.; Lambert, M.I.; Sharwood, K.A.; Lambert, E.V. Obesity and overweight in South African primary school children—The Health of the Nation Study. S. Afr. Med. J. 2006, 96, 439–444. [Google Scholar] [CrossRef] [PubMed] [Green Version]
- Annan, R.A.; Sowah, S.A.; Apprey, C.; Agyapong, N.A.F.; Okonogi, S.; Yamauchi, T.; Sakurai, T. Relationship between breakfast consumption, BMI status and physical fitness of Ghanaian school-aged children. BMC Nutr. 2020, 6, 19. [Google Scholar] [CrossRef] [Green Version]
- Barnett, L.M.; Lai, S.K.; Veldman, S.L.C.; Hardy, L.L.; Cliff, D.P.; Morgan, P.J.; Zask, A.; Lubans, D.R.; Shultz, S.P.; Ridgers, N.D.; et al. Correlates of Gross Motor Competence in Children and Adolescents: A Systematic Review and Meta-Analysis. Sports Med. 2016, 46, 1663–1688. [Google Scholar] [CrossRef] [PubMed] [Green Version]
- Utesch, T.; Bardid, F.; Büsch, D.; Strauss, B. The Relationship Between Motor Competence and Physical Fitness from Early Childhood to Early Adulthood: A Meta-Analysis. Sports Med. 2019, 49, 541–551. [Google Scholar] [CrossRef] [PubMed] [Green Version]
- Bolger, L.E.; Bolger, L.A.; O’Neill, C.; Coughlan, E.; O’Brien, W.; Lacey, S.; Burns, C.; Bardid, F. Global levels of fundamental motor skills in children: A systematic review. J. Sports Sci. 2020, 39, 717–753. [Google Scholar] [CrossRef] [PubMed]
- Webster, E.K.; Martin, C.K.; Staiano, A.E. Fundamental motor skills, screen-time, and physical activity in preschoolers. J. Sport Health Sci. 2019, 8, 114–121. [Google Scholar] [CrossRef]
- García-Hermoso, A.; Ramírez-Campillo, R.; Izquierdo, M. Is Muscular Fitness Associated with Future Health Benefits in Children and Adolescents? A Systematic Review and Meta-Analysis of Longitudinal Studies. Sports Med. 2019, 49, 1079–1094. [Google Scholar] [CrossRef]
- Robinson, L.E.; Stodden, D.F.; Barnett, L.M.; Lopes, V.P.; Logan, S.W.; Rodrigues, L.P.; D’Hondt, E. Motor Competence and its Effect on Positive Developmental Trajectories of Health. Sports Med. 2015, 45, 1273–1284. [Google Scholar] [CrossRef]
- Stodden, D.F.; Goodway, J.D.; Langendorfer, S.J.; Roberton, M.A.; Rudisill, M.E.; Garcia, C.; Garcia, L.E. A Developmental Perspective on the Role of Motor Skill Competence in Physical Activity: An Emergent Relationship. Quest 2008, 60, 290–306. [Google Scholar] [CrossRef]
- Lopes, V.P.; Stodden, D.F.; Bianchi, M.M.; Maia, J.A.; Rodrigues, L.P. Correlation between BMI and motor coordination in children. J. Sci. Med. Sport 2012, 15, 38–43. [Google Scholar] [CrossRef] [PubMed]
- Lopes, V.P.; Stodden, D.F.; Rodrigues, L.P. Weight status is associated with cross-sectional trajectories of motor co-ordination across childhood. Child Care Health Dev. 2014, 40, 891–899. [Google Scholar] [CrossRef]
- Stodden, D.F.; Gao, Z.; Goodway, J.D.; Langendorfer, S.J. Dynamic relationships between motor skill competence and health-related fitness in youth. Pediatr. Exerc. Sci. 2014, 26, 231–241. [Google Scholar] [CrossRef] [PubMed]
- Lima, R.A.; Soares, F.C.; Queiroz, D.R.; Aguilar, J.A.; Bezerra, J.; Barros, M.V.G. The importance of body weight status on motor competence development: From preschool to middle childhood. Scand. J. Med. Sci. Sports 2021, 31, 15–22. [Google Scholar] [CrossRef]
- Lima, R.A.; Bugge, A.; Ersbøll, A.K.; Stodden, D.F.; Andersen, L.B. The longitudinal relationship between motor competence and measures of fatness and fitness from childhood into adolescence. J. Pediatr. 2019, 95, 482–488. [Google Scholar] [CrossRef] [PubMed]
- D’Hondt, E.; Deforche, B.; Gentier, I.; De Bourdeaudhuij, I.; Vaeyens, R.; Philippaerts, R.; Lenoir, M. A longitudinal analysis of gross motor coordination in overweight and obese children versus normal-weight peers. Int. J. Obes. 2013, 37, 61–67. [Google Scholar] [CrossRef] [PubMed] [Green Version]
- Cheng, J.; East, P.; Blanco, E.; Sim, E.K.; Castillo, M.; Lozoff, B.; Gahagan, S. Obesity leads to declines in motor skills across childhood. Child Care Health Dev. 2016, 42, 343–350. [Google Scholar] [CrossRef] [PubMed] [Green Version]
- Augustijn, M.; DʼHondt, E.; Van Acker, L.; De Guchtenaere, A.; Lenoir, M.; Caeyenberghs, K.; Deconinck, F.J.A. Role of Motor Competence and Executive Functioning in Weight Loss: A Study in Children with Obesity. J. Dev. Behav. Pediatr. 2018, 39, 642–651. [Google Scholar] [CrossRef] [PubMed]
- Augustijn, M.; Deconinck, F.J.A.; D’Hondt, E.; Van Acker, L.; De Guchtenaere, A.; Lenoir, M.; Caeyenberghs, K. Reduced motor competence in children with obesity is associated with structural differences in the cerebellar peduncles. Brain Imaging Behav. 2018, 12, 1000–1010. [Google Scholar] [CrossRef]
- Ghosh, S.; Ghosh, T.; Dutta Chowdhury, S.; Wrotniak, B.H.; Chandra, A.M. Factors associated With the development of motor proficiency in school children of Kolkata: A cross-sectional study to assess the role of chronic nutritional and socio-economic status. Dev. Psychobiol. 2016, 58, 734–744. [Google Scholar] [CrossRef]
- Armstrong, M.E.; Lambert, E.V.; Lambert, M.I. Physical fitness of South African primary school children, 6 to 13 years of age: Discovery vitality health of the nation study. Percept. Mot. Skills 2011, 113, 999–1016. [Google Scholar] [CrossRef]
- Walter, C. In school physical activity patterns of primary school learners from disadvantaged schools in South Africa. Afr. J. Phys. Health Educ. Recr. Dance 2011, 17, 779–788. [Google Scholar]
- WHO Guidelines Approved by the Guidelines Review Committee. Guideline: Assessing and Managing Children at Primary Health-Care Facilities to Prevent Overweight and Obesity in the Context of the Double Burden of Malnutrition: Updates for the Integrated Management of Childhood Illness (IMCI). Available online: https://www.who.int/publications/i/item/9789241550123 (accessed on 24 July 2021).
- Armstrong, M.E.G.; Lambert, M.I.; Lambert, E.V. Relationships between different nutritional anthropometric statuses and health-related fitness of South African primary school children. Ann. Hum. Biol. 2017, 44, 208–213. [Google Scholar] [CrossRef] [PubMed] [Green Version]
- Prista, A.; Maia, J.A.; Damasceno, A.; Beunen, G. Anthropometric indicators of nutritional status: Implications for fitness, activity, and health in school-age children and adolescents from Maputo, Mozambique. Am. J. Clin. Nutr. 2003, 77, 952–959. [Google Scholar] [CrossRef] [PubMed] [Green Version]
- Zhang, Y.; Liu, S.; Li, Y.; Li, X.; Ren, P.; Luo, F. The Relationships Between Weight Status and Physical Fitness Among Chinese Children and Youth. Res. Q. Exerc. Sport 2019, 90, 113–122. [Google Scholar] [CrossRef]
- Smits-Engelsman, B.C.M.; Bonney, E.; Neto, J.L.C.; Jelsma, D.L. Feasibility and content validity of the PERF-FIT test battery to assess movement skills, agility and power among children in low-resource settings. BMC Public Health 2020, 20, 1139. [Google Scholar] [CrossRef]
- Smits-Engelsman, B.C.M.; Smit, E.; Doe-Asinyo, R.X.; Lawerteh, S.E.; Aertssen, W.; Ferguson, G.; Jelsma, D.L. Inter-rater reliability and test-retest reliability of the Performance and Fitness (PERF-FIT) test battery for children: A test for motor skill related fitness. BMC Pediatr. 2021, 21, 119. [Google Scholar] [CrossRef]
- Smits-Engelsman, B.; Cavalcante Neto, J.L.; Draghi, T.T.G.; Rohr, L.A.; Jelsma, D. Construct validity of the PERF-FIT, a test of motor skill-related fitness for children in low resource areas. Res. Dev. Disabil. 2020, 102, 103663. [Google Scholar] [CrossRef] [PubMed]
- Castro-Piñero, J.; Ortega, F.B.; Artero, E.G.; Girela-Rejón, M.J.; Mora, J.; Sjöström, M.; Ruiz, J.R. Assessing muscular strength in youth: Usefulness of standing long jump as a general index of muscular fitness. J. Strength Cond. Res. 2010, 24, 1810–1817. [Google Scholar] [CrossRef]
- Zhou, H.; Yu, P.; Thirupathi, A.; Liang, M. How to Improve the Standing Long Jump Performance? A Mininarrative Review. Appl. Bionics Biomech. 2020, 2020, 8829036. [Google Scholar] [CrossRef] [PubMed]
- Smits-Engelsman, B.C.M. Perf-Fit Instruction and Standardization Manual. Available online: http://www.neuromotortasktraining.org/perf-fit/intro (accessed on 24 July 2021).
- Cole, T.J.; Lobstein, T. Extended international (IOTF) body mass index cut-offs for thinness, overweight and obesity. Pediatr. Obes. 2012, 7, 284–294. [Google Scholar] [CrossRef] [PubMed]
- Castro-Piñero, J.; Perez-Bey, A.; Cuenca-Garcia, M.; Cabanas-Sanchez, V.; Gómez-Martínez, S.; Veiga, O.L.; Marcos, A.; Ruiz, J.R. Muscle Fitness Cut Points for Early Assessment of Cardiovascular Risk in Children and Adolescents. J. Pediatr. 2019, 206, 134–141. [Google Scholar] [CrossRef]
- Strength training in children and adolescents: Benefits, risks and recommendations. Arch. Argent. Pediatr. 2018, 116, S82–S91. [CrossRef]
- Kelley, G.A.; Kelley, K.S.; Pate, R.R. Exercise and adiposity in overweight and obese children and adolescents: A systematic review with network meta-analysis of randomised trials. BMJ Open 2019, 9, e031220. [Google Scholar] [CrossRef] [Green Version]
- Kemp, C.; Pienaar, A.E. Relationship between the body composition and motor and physical competence of Grade 1 learners in South Africa. J. Sports Med. Phys. Fit. 2013, 53, 635–643. [Google Scholar]
- Uys, M.; Bassett, S.; Draper, C.E.; Micklesfield, L.; Monyeki, A.; de Villiers, A.; Lambert, E.V. Results From South Africa’s 2016 Report Card on Physical Activity for Children and Youth. J. Phys. Act. Health 2016, 13, S265–S273. [Google Scholar] [CrossRef] [Green Version]
- Han, A.; Fu, A.; Cobley, S.; Sanders, R.H. Effectiveness of exercise intervention on improving fundamental movement skills and motor coordination in overweight/obese children and adolescents: A systematic review. J. Sci. Med. Sport 2018, 21, 89–102. [Google Scholar] [CrossRef]
- Hands, B.; McIntyre, F.; Parker, H. The General Motor Ability Hypothesis: An Old Idea Revisited. Percept. Mot. Skills 2018, 125, 213–233. [Google Scholar] [CrossRef] [PubMed] [Green Version]

| Skill Item Series | Items | Description |
|---|---|---|
| Standing Long jump | 1 | The child is asked to stand with his/her toes behind a starting line and to jump as far as possible without falling [35]. One practice trial with submaximal force is given, followed by two test trials with 15 s rest between trials. The distance (cm) between the starting line and the heel of the foot that landed closest to the starting line is measured. The best performance is the final result. |
| Static balance SIS | 4 | Four items: (1) standing and hugging the knee for maximum 15 s (left and right), (2) standing and grasping the foot for maximum 15 s (left and right) [35]. Timing started when the knee was hugged or the foot was grasped and stopped if the raised leg touched the standing leg, corrective hops were made, or the child lost balance or fell. Per item, a second trial was allowed if the child performed submaximal during the first trial. The best trial was the final result. The scores of each item were summed, resulting in scores between 0–60 s. |
| Dynamic balance SIS | 6 | (1) walking while hugging a knee, (2) walking while grasping a foot, (3) standing on one leg while moving cans from close to far (left and right), and (4) standing on one leg while moving cans from far to close (left and right) [35]. First, the child was asked to walk slowly in an agility ladder (max 8 steps) while hugging a knee or grasping a foot without touching the borders, stepping outside the borders, or losing balance. For each correctly placed step, a point was awarded. For both items, a second trial was allowed if the child performed submaximal during the first trial. The best trial was the final result. With these two items, a maximum of 16 points could be earned [35]. Afterwards, the child stood on one leg while picking up 4 cans consecutively and moving them from close to far (or the other way around) without moving the stance foot, losing balance, or placing the raised leg on the ground. One point was awarded for each correctly placed can (max 4 points). The children performed this for both legs and in both directions (i.e., 4 items) and could earn a maximum of 16 points. The scores of the dynamic balance items were summed, with scores between 0 and 32 points. |
| Jumping and hopping SIS | 12 | Four jumping items and four hopping items (left and right) [35]. The jumping and hopping SIS consists of four levels of difficulty: jump/hop in each square, in every other square, in every other square over a five-centimeter foam pad, and in every other square over a ten-centimeter foam pad. One point was awarded for each correct jump/hop. For the jumping items a total of 20 points could be earned and for the hopping items 40 points, resulting in a total score varying between 0 and 60 points. |
| All Children | Age Groups | ||||||
|---|---|---|---|---|---|---|---|
| 6 | 7 | 8 | 9 | 10 | 11–12 | ||
| Boys (n)/girls (n) | 521/516 | 44/52 | 77/82 | 117/106 | 103/85 | 77/80 | 103/111 |
| Ghanaian (n)/South African (n) | 511/526 | 31/65 | 62/97 | 76/147 | 79/109 | 92/65 | 171/43 |
| Age (years, mean (SD)) | 9.2 (1.7) | 6.4 (0.4) | 7.4 (0.3) | 8.3 (0.3) | 9.4 (0.3) | 10.4 (0.3) | 11.7 (0.5) |
| Weight (kg, mean (SD)) | 31.2 (9.9) | 22.1 (4.3) | 25.9 (6.0) | 27.8 (6.8) | 31.9 (9.2) | 36.2 (10.0) | 38.6 (10.1) |
| Height (cm, mean (SD)) | 134.5 (11.8) | 118.5 (5.7) | 125.0 (6.3) | 130.0 (7.3) | 135.4 (7.4) | 142.1 (7.2) | 147.1 (9.1) |
| BMI (kg/m2, mean (SD)) | 16.95 (3.46) | 15.64 (2.14) | 16.52 (2.97) | 16.31 (2.94) | 17.25 (3.91) | 17.75 (4.00) | 17.69 (3.63) |
| 16.43 (3.03) ¥ | 15.06 (1.84) | 15.64 (2.32) ◆ | 15.75 (3.20) * | 16.32 (3.21) ◆ | 16.74 (3.26) ¥ | 17.16 (2.95) ¥ |
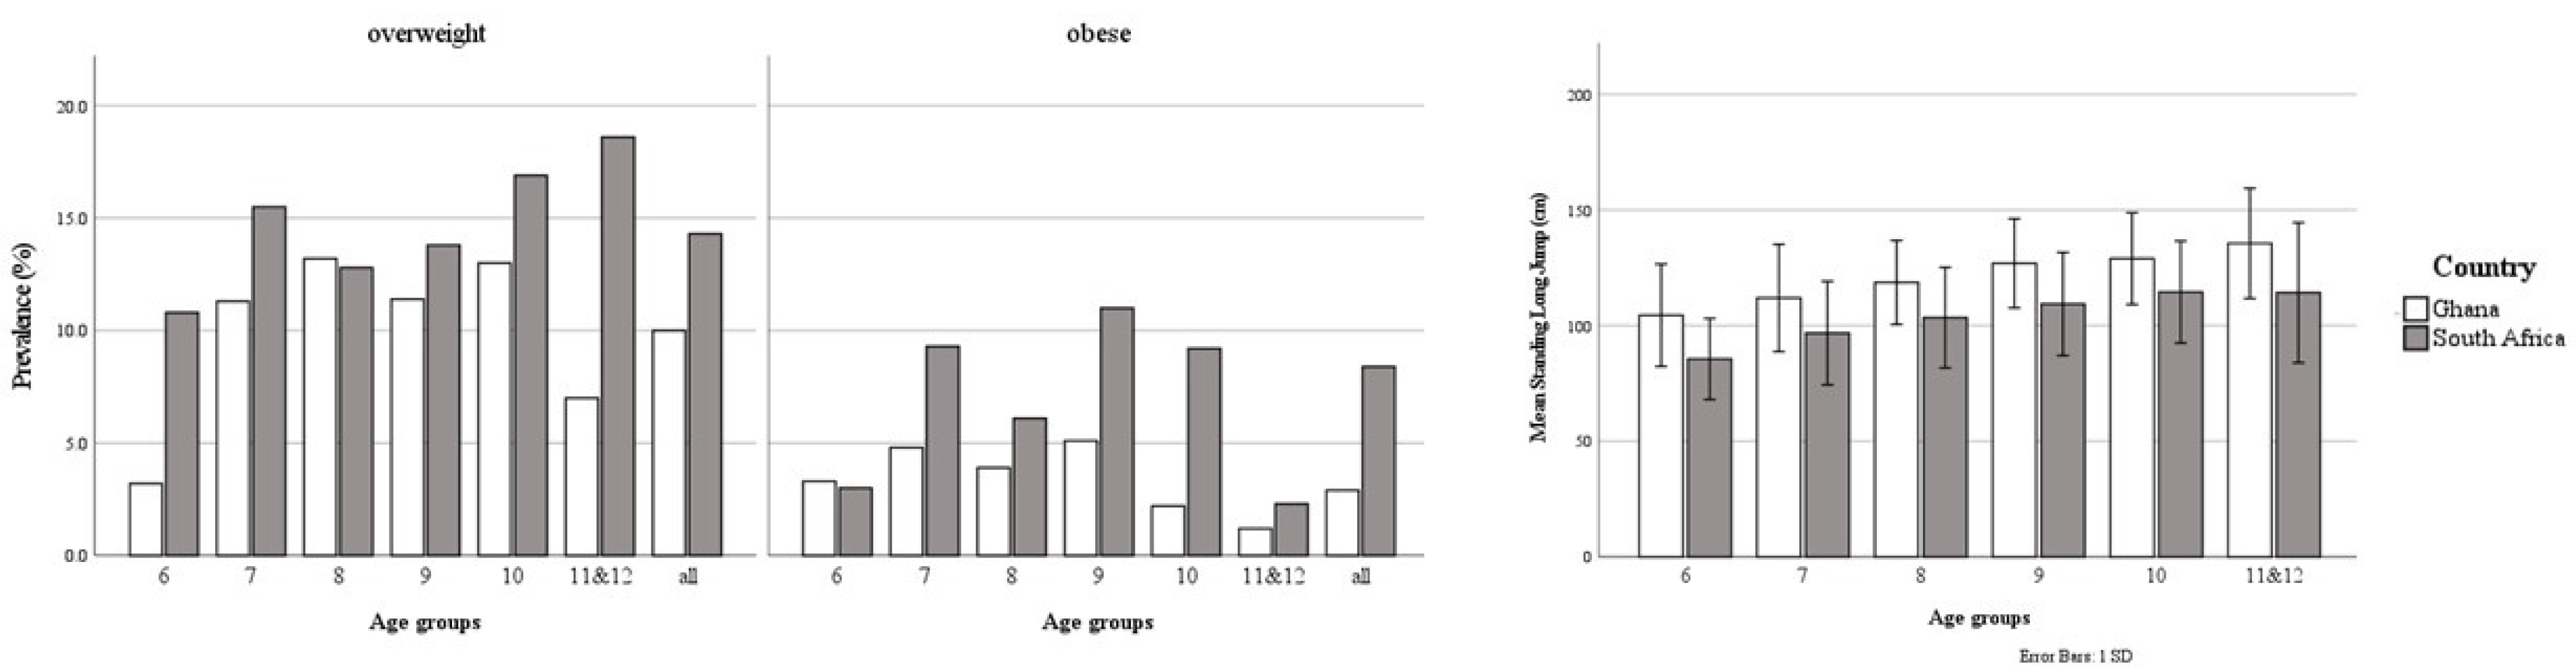
| 10.0 | 3.2 | 11.3 | 13.2 | 11.4 | 13.0 | 7.0 |
| 2.9 | 3.2 | 4.8 | 3.9 | 5.1 | 2.2 | 1.2 |
| 17.46 (3.78) ¥ | 15.92 (2.23) | 17.08 (3.21) ◆ | 16.60 (2.77) * | 17.92 (4.23) ◆ | 19.17 (4.52) ¥ | 19.80 (5.11) ¥ |
| 14.3 | 10.8 | 15.5 | 12.8 | 13.8 | 16.9 | 18.6 |
| 8.4 | 3.0 | 9.3 | 6.1 | 11.0 | 9.2 | 2.3 |
| Standing Long Jump (cm, mean (SD)) | 114 (26) | 92 (21) | 103 (24) | 109 (22) | 117 (22.9) | 123 (22) | 131 (27) |
| 126 (24) ¥ | 104 (22) ¥ | 112 (23) ¥ | 119 (18) ¥ | 127 (19) ¥ | 129 (20) ¥ | 136 (24) ¥ |
| 103 (24) ¥ | 86 (18) ¥ | 97 (22) ¥ | 103 (22) ¥ | 109 (22) ¥ | 115 (22) ¥ | 114 (31) ¥ |
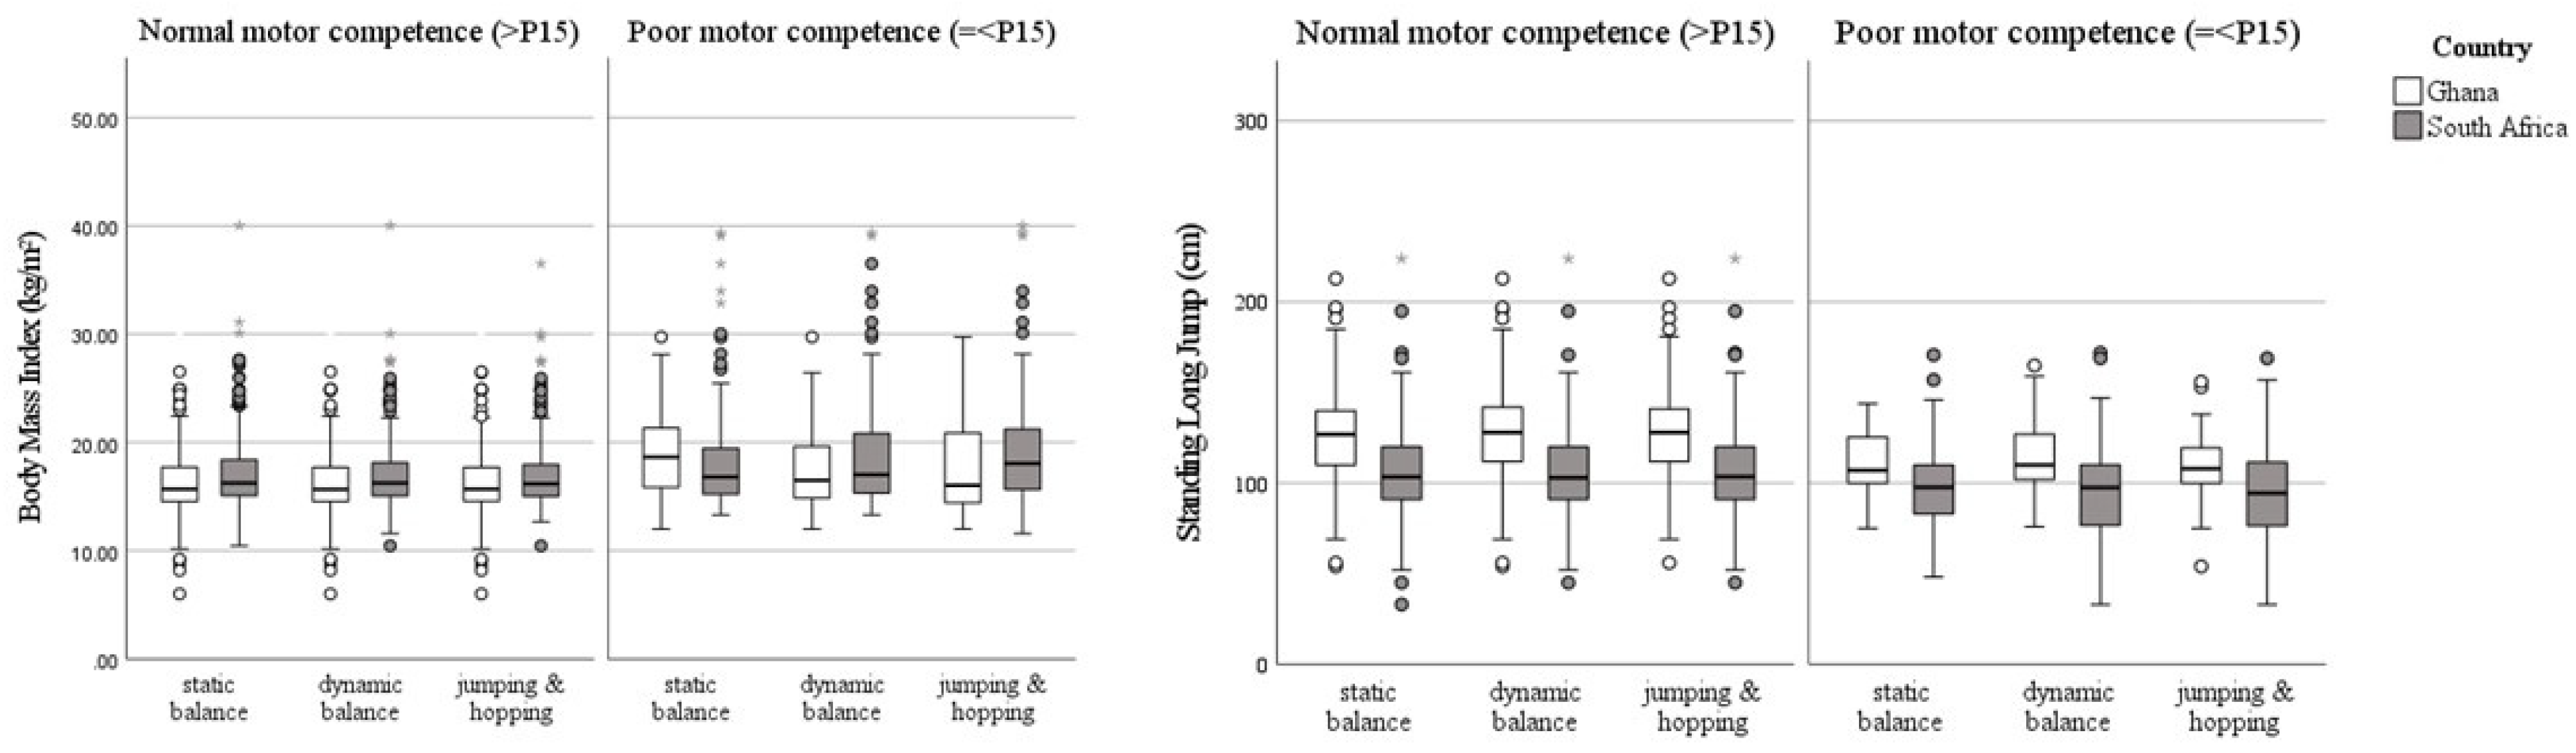
| Static Balance SIS | ||||
| Ghana | South Africa | |||
| >P15 | ≤P15 | >P15 | ≤P15 | |
| N (%) | 492 (96.3) | 19 (3.7) | 397 (75.8) | 127 (24.2) |
| Age (years) | 10.0 (2.8) | 10.1 (3.1) | 8.4 (2.0) | 8.3 (2.6) |
| BMI (kg/m2) | 15.67 (3.17) * | 18.64 (6.63) * | 16.25 (3.32) * | 16.82 (4.28) * |
| SLJ (cm) | 127 (30) * | 107 (26) * | 103 (29) * | 98 (27) * |
| Dynamic Balance SIS | ||||
| Ghana | South Africa | |||
| >P15 | ≤P15 | >P15 | ≤P15 | |
| N (%) | 454 (88.9) | 57 (11.1) | 400 (76.2) | 125 (23.8) |
| Age (years) | 10.0 (2.8) | 10.0 (2.8) | 8.3 (2.0) | 8.8 (2.6) |
| BMI (kg/m2) | 15.65 (3.16) * | 16.48 (4.76) * | 16.25 (3.04) * | 17.03 (5.50) * |
| SLJ (cm) | 128 (30) * | 110 (25) * | 103 (29) | 98 (33) |
| Jumping and hopping SIS | ||||
| Ghana | South Africa | |||
| >P15 | ≤P15 | >P15 | ≤P15 | |
| N (%) | 468 (91.6) | 43 (8.4) | 410 (78.1) | 115 (21.9) |
| Age (years) | 10.0 (2.8) | 10.7 (2.8) | 8.4 (2.0) | 8.5 (2.7) |
| BMI (kg/m2) | 15.67 (3.13) | 16.04 (6.57) | 16.16 (2.93) * | 18.04 (5.6) * |
| SLJ (cm) | 128 (29) * | 108 (20) * | 104 (29) * | 94 (36) * |
| Predictor | Odds Ratio’s | Significance | Interpretation | ||
|---|---|---|---|---|---|
| Mean | 95% CI | Probability for Having Low Motor Competence | |||
| Static balance SIS | |||||
| BMI | 1.228 | [1.101; 1.371] | p < 0.001 | A 1-point BMI ↑ → ↑ probability of 22.8% |
| SLJ | 0.970 | [0.949; 0.992] | p < 0.001 | A 10-cm SLJ ↓ → ↑ probability of 30.0% | |
| BMI | 1.079 | [1.026; 1.136] | p = 0.003 | A 1-point BMI ↑ → ↑ probability of 7.9% |
| SLJ | 0.987 | [0.978; 0.996] | p = 0.005 | A 10-cm SLJ ↓ → ↑ probability of 13.0% | |
| Dynamic balance SIS | |||||
| BMI | 1.106 | [1.022; 1.198] | p = 0.013 | A 1-point BMI ↑ → ↑ probability of 10.6% |
| SLJ | 0.975 | [0.963; 0.988] | p < 0.001 | A 10-cm SLJ ↓ → ↑ probability of 25.0% | |
| BMI | 1.122 | [1.063; 1.184] | p < 0.001 | A 1-point BMI ↑ → ↑ probability of 12.2% |
| SLJ | 0.984 | [0.975; 0.993] | p = 0.001 | A 10-cm SLJ ↓ → ↑ probability of 16.0% | |
| Jumping and hopping SIS | |||||
| BMI | 1.141 | [1.046; 1.245] | p = 0.003 | A 1-point BMI ↑ → ↑ probability of 14.1% |
| SLJ | 0.965 | [0.950; 0.980] | p < 0.001 | A 10-cm SLJ ↓ → ↑ probability of 35.0% | |
| Urban area | 3.364 | [1.417; 7.988] | p = 0.006 | Three times more likely | |
| BMI | 1.160 | [1.098; 1.230] | p < 0.001 | A 1-point BMI ↑ → ↑ probability of 16.0% |
| SLJ | 0.985 | [0.975; 0.994] | p = 0.002 | A 10-cm SLJ ↓ → ↑ probability of 15.0% | |
| Urban area | 2.785 | [1.602; 4.844] | p < 0.001 | Three times more likely | |
Publisher’s Note: MDPI stays neutral with regard to jurisdictional claims in published maps and institutional affiliations. |
© 2021 by the authors. Licensee MDPI, Basel, Switzerland. This article is an open access article distributed under the terms and conditions of the Creative Commons Attribution (CC BY) license (https://creativecommons.org/licenses/by/4.0/).
Share and Cite
Verbecque, E.; Coetzee, D.; Ferguson, G.; Smits-Engelsman, B. High BMI and Low Muscular Fitness Predict Low Motor Competence in School-Aged Children Living in Low-Resourced Areas. Int. J. Environ. Res. Public Health 2021, 18, 7878. https://doi.org/10.3390/ijerph18157878
Verbecque E, Coetzee D, Ferguson G, Smits-Engelsman B. High BMI and Low Muscular Fitness Predict Low Motor Competence in School-Aged Children Living in Low-Resourced Areas. International Journal of Environmental Research and Public Health. 2021; 18(15):7878. https://doi.org/10.3390/ijerph18157878
Chicago/Turabian StyleVerbecque, Evi, Dané Coetzee, Gillian Ferguson, and Bouwien Smits-Engelsman. 2021. "High BMI and Low Muscular Fitness Predict Low Motor Competence in School-Aged Children Living in Low-Resourced Areas" International Journal of Environmental Research and Public Health 18, no. 15: 7878. https://doi.org/10.3390/ijerph18157878
APA StyleVerbecque, E., Coetzee, D., Ferguson, G., & Smits-Engelsman, B. (2021). High BMI and Low Muscular Fitness Predict Low Motor Competence in School-Aged Children Living in Low-Resourced Areas. International Journal of Environmental Research and Public Health, 18(15), 7878. https://doi.org/10.3390/ijerph18157878