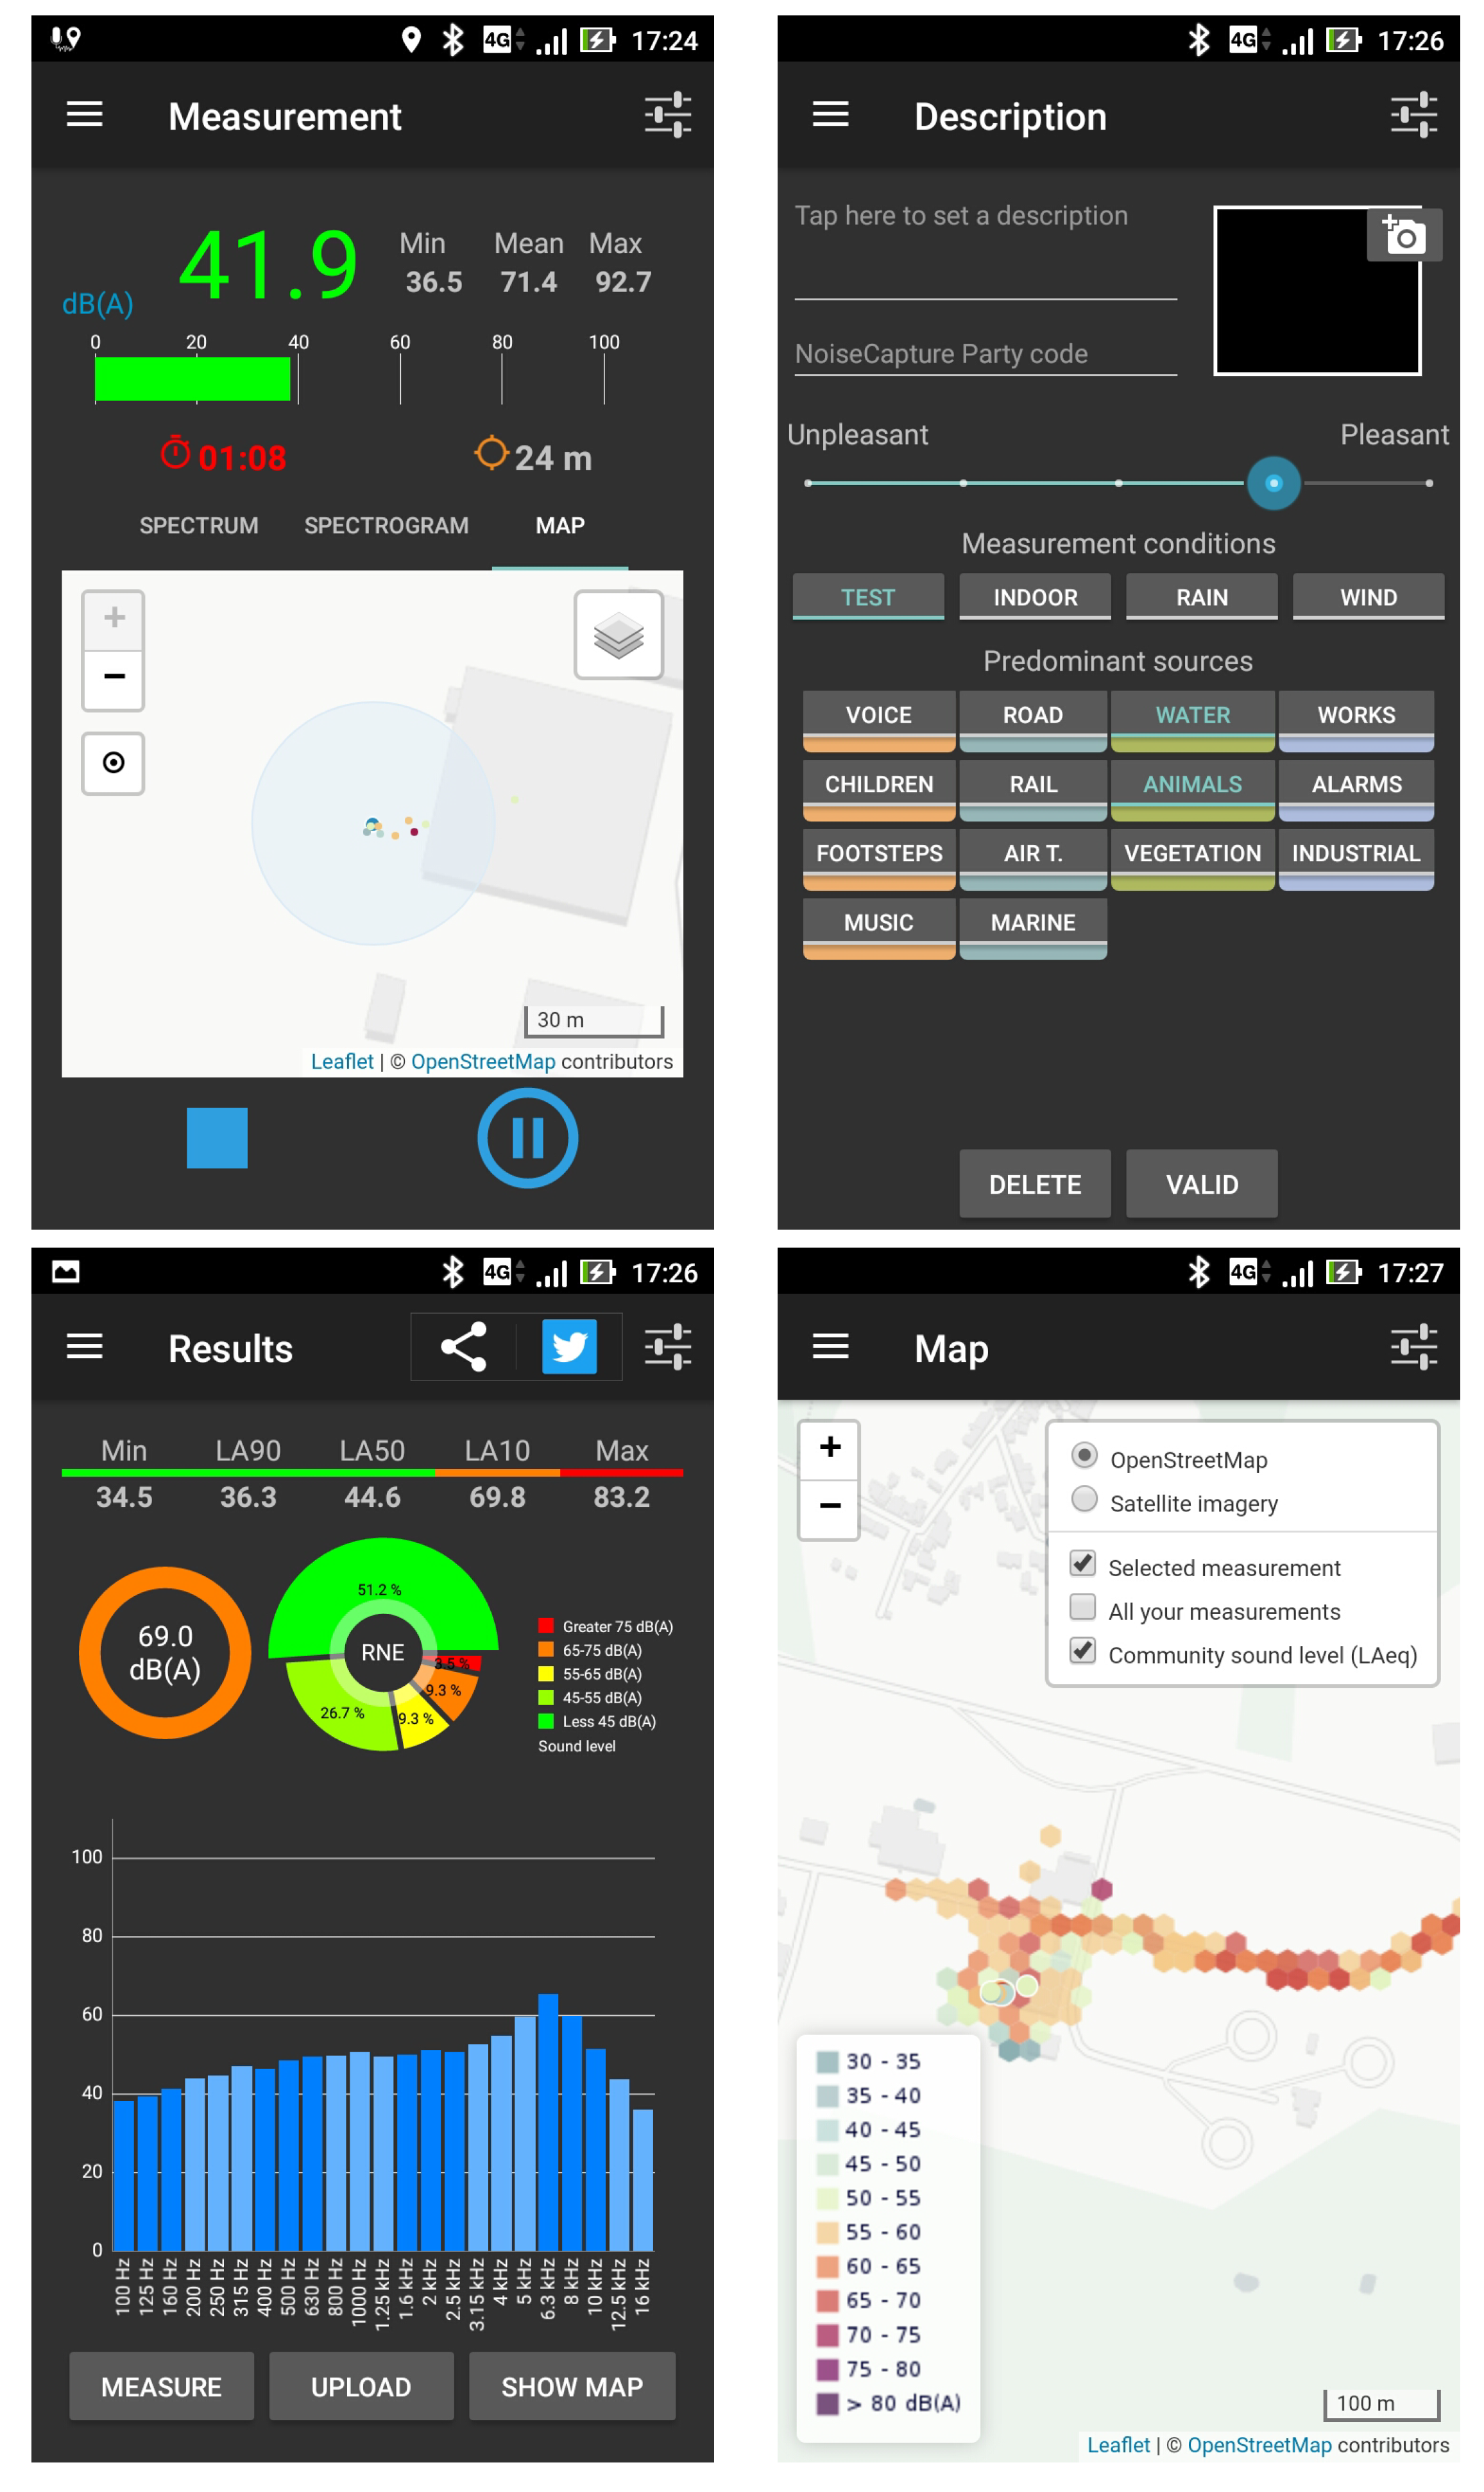
Figure 1.
NoiseCapture Android application main screens. From top/down and left/right: Measurement, Description, Results, Map.
Figure 1.
NoiseCapture Android application main screens. From top/down and left/right: Measurement, Description, Results, Map.
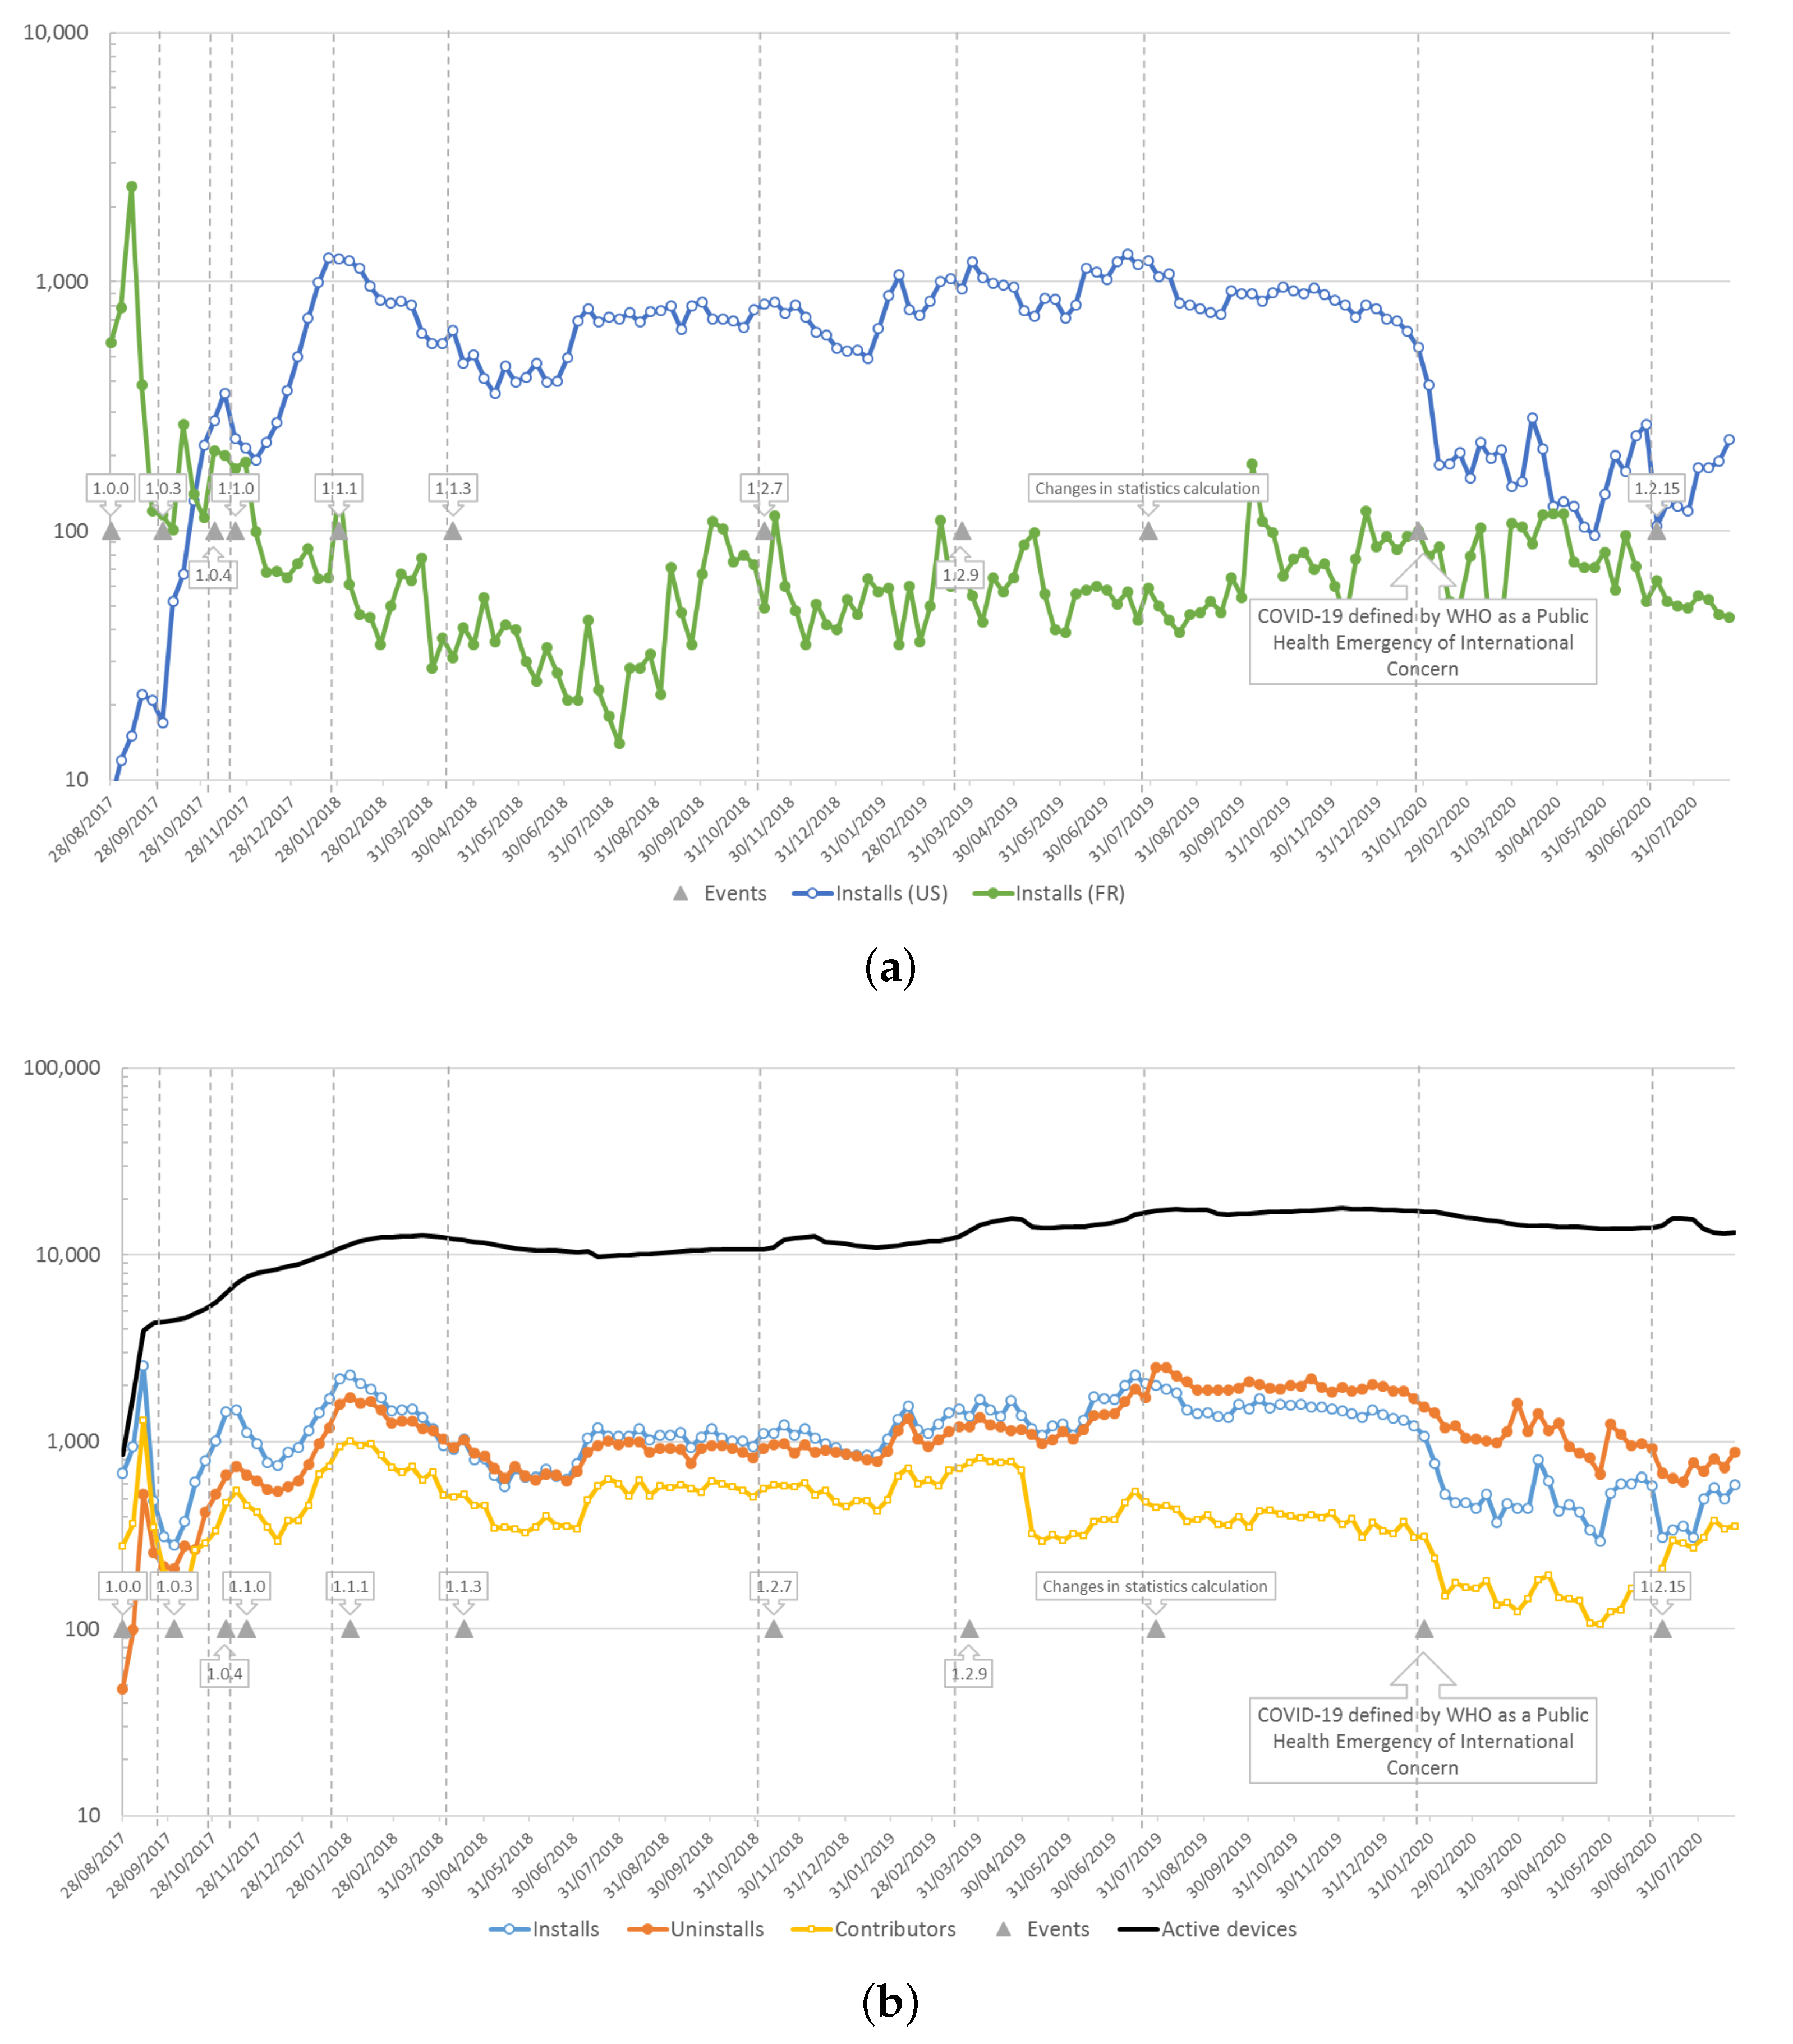
Figure 3.
Weekly evolution of user installs and uninstalls of the NoiseCapture application (data from Google Play dashboard): (a) global data and (b) data for France and United states of America. ‘Installs’: number of users who have installed the application at least on one device; ‘Uninstalls’: users who have uninstalled the application from all their devices; ‘Active devices’: number of active devices that contains application, and which was turned on at least once in the previous 30 days; ‘Contributors’: Users who have upload data to the NoiseCapture remote server; ‘Events’: Events that may have a particular impact on the users behavior. (a) Application installs for France (FR) and United-States of America (US); (b) Application installs/uninstalls/contributors.
Figure 4.
Weekly ratio between the number of contributors to the NoiseCapture database and NoiseCapture installs.
Figure 4.
Weekly ratio between the number of contributors to the NoiseCapture database and NoiseCapture installs.
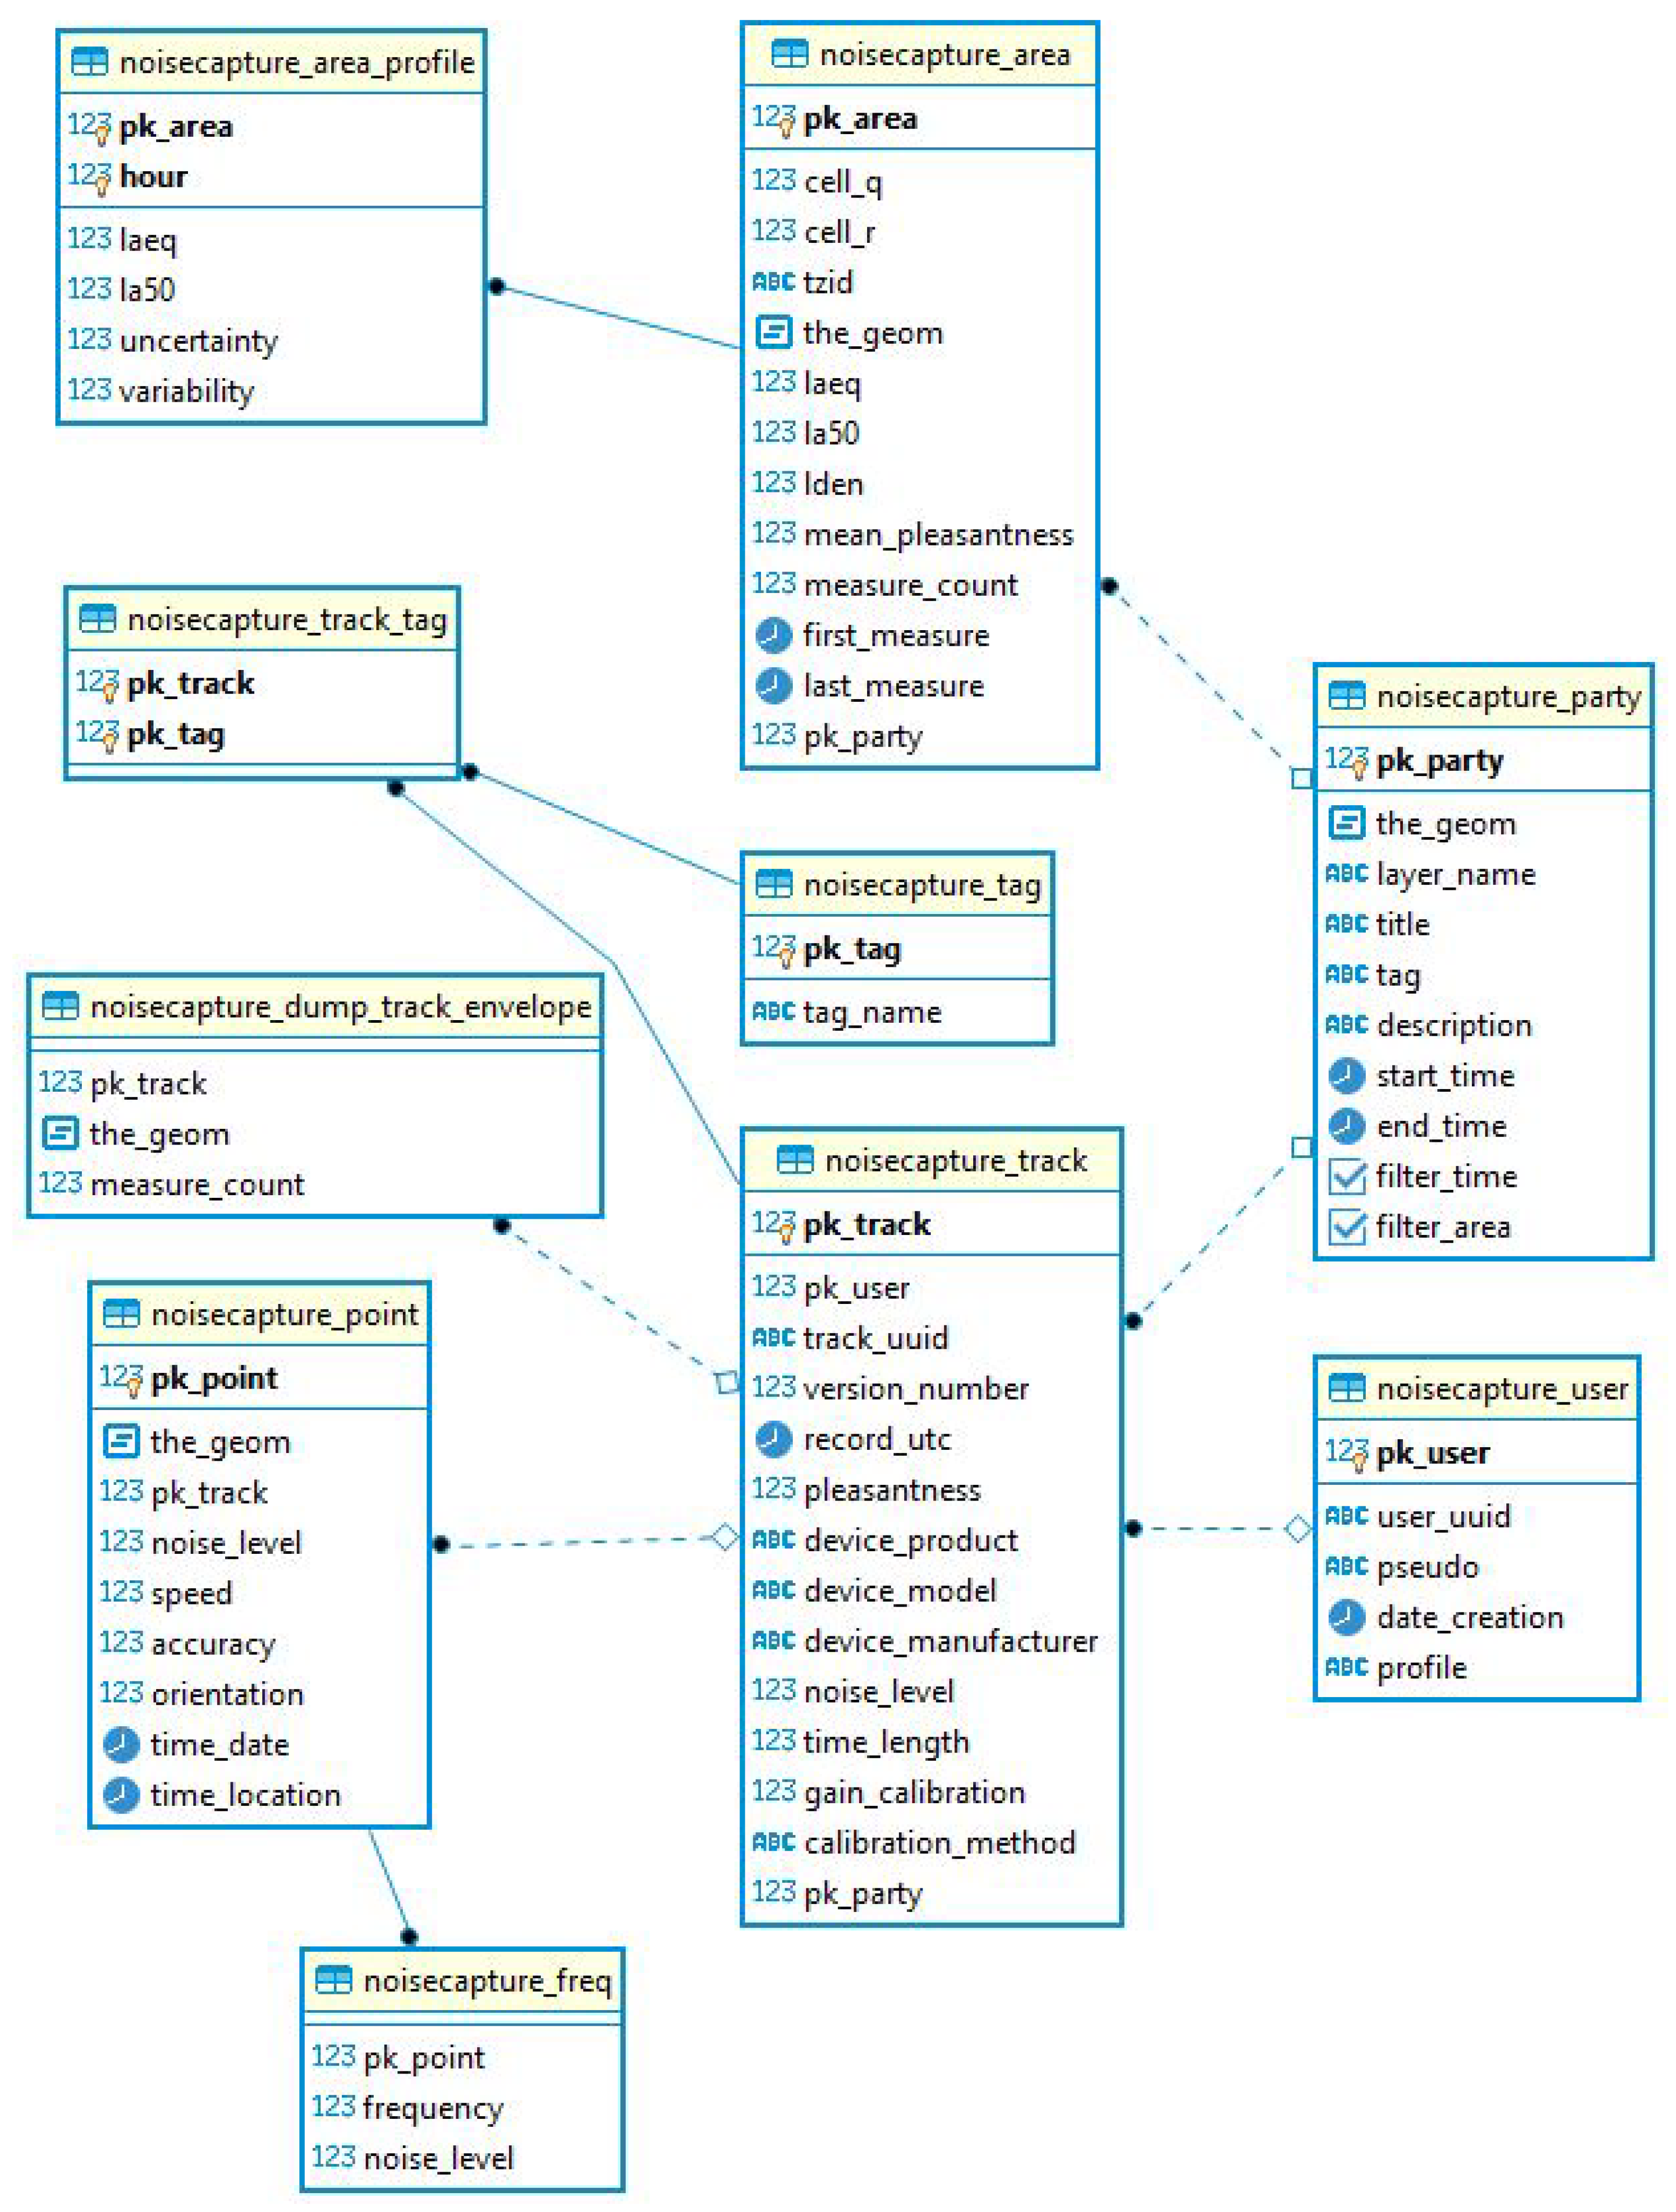
Figure 5.
Entity relation diagrams (ERD) of the NoiseCapture PostGIS database. The type of each field in the tables is mentioned: ‘123’ for ‘float’ values, ‘ABC’ for ‘text’ chains, ‘timestamptz’ for time stamp date, ‘🗹’ for ‘boolean’ value. The ‘key’ yellow symbol is used to display primary keys of the table, whose corresponding names are displayed in bold.
Figure 6.
Distribution of the number of occurrences of a smartphone model in the database. As an example, 775 device models appear more than 50 times in the database.
Figure 6.
Distribution of the number of occurrences of a smartphone model in the database. As an example, 775 device models appear more than 50 times in the database.
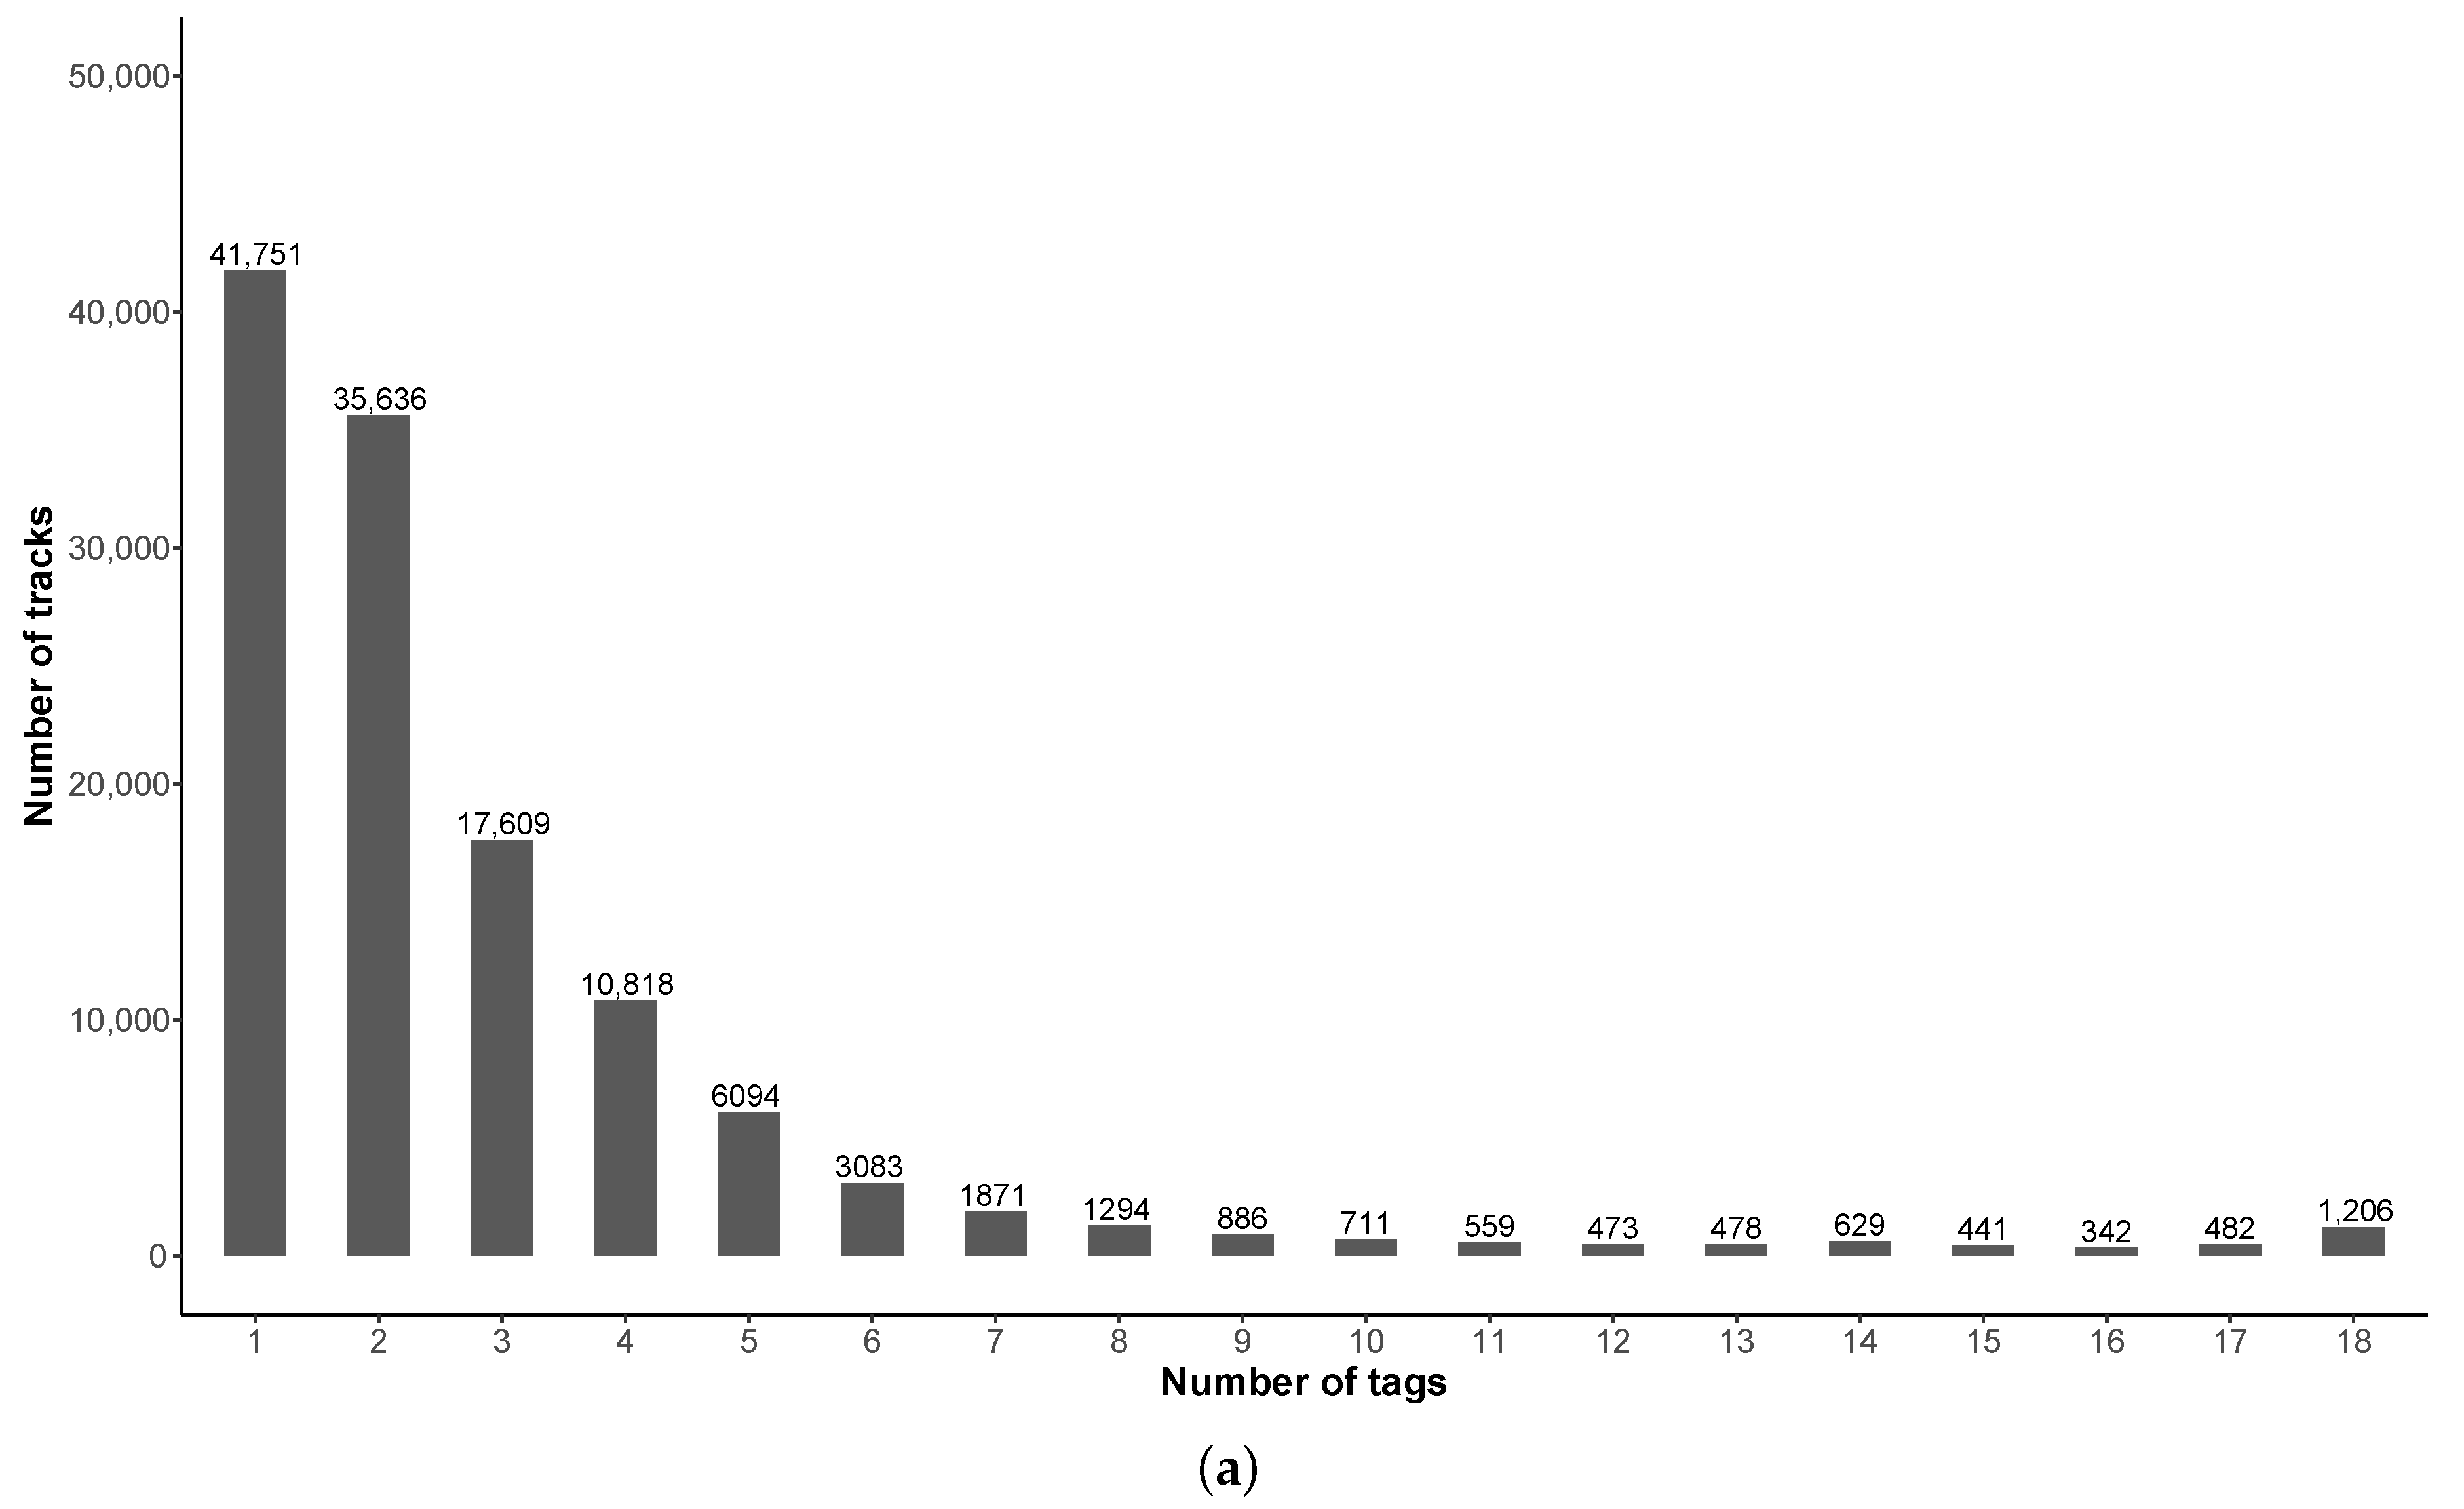
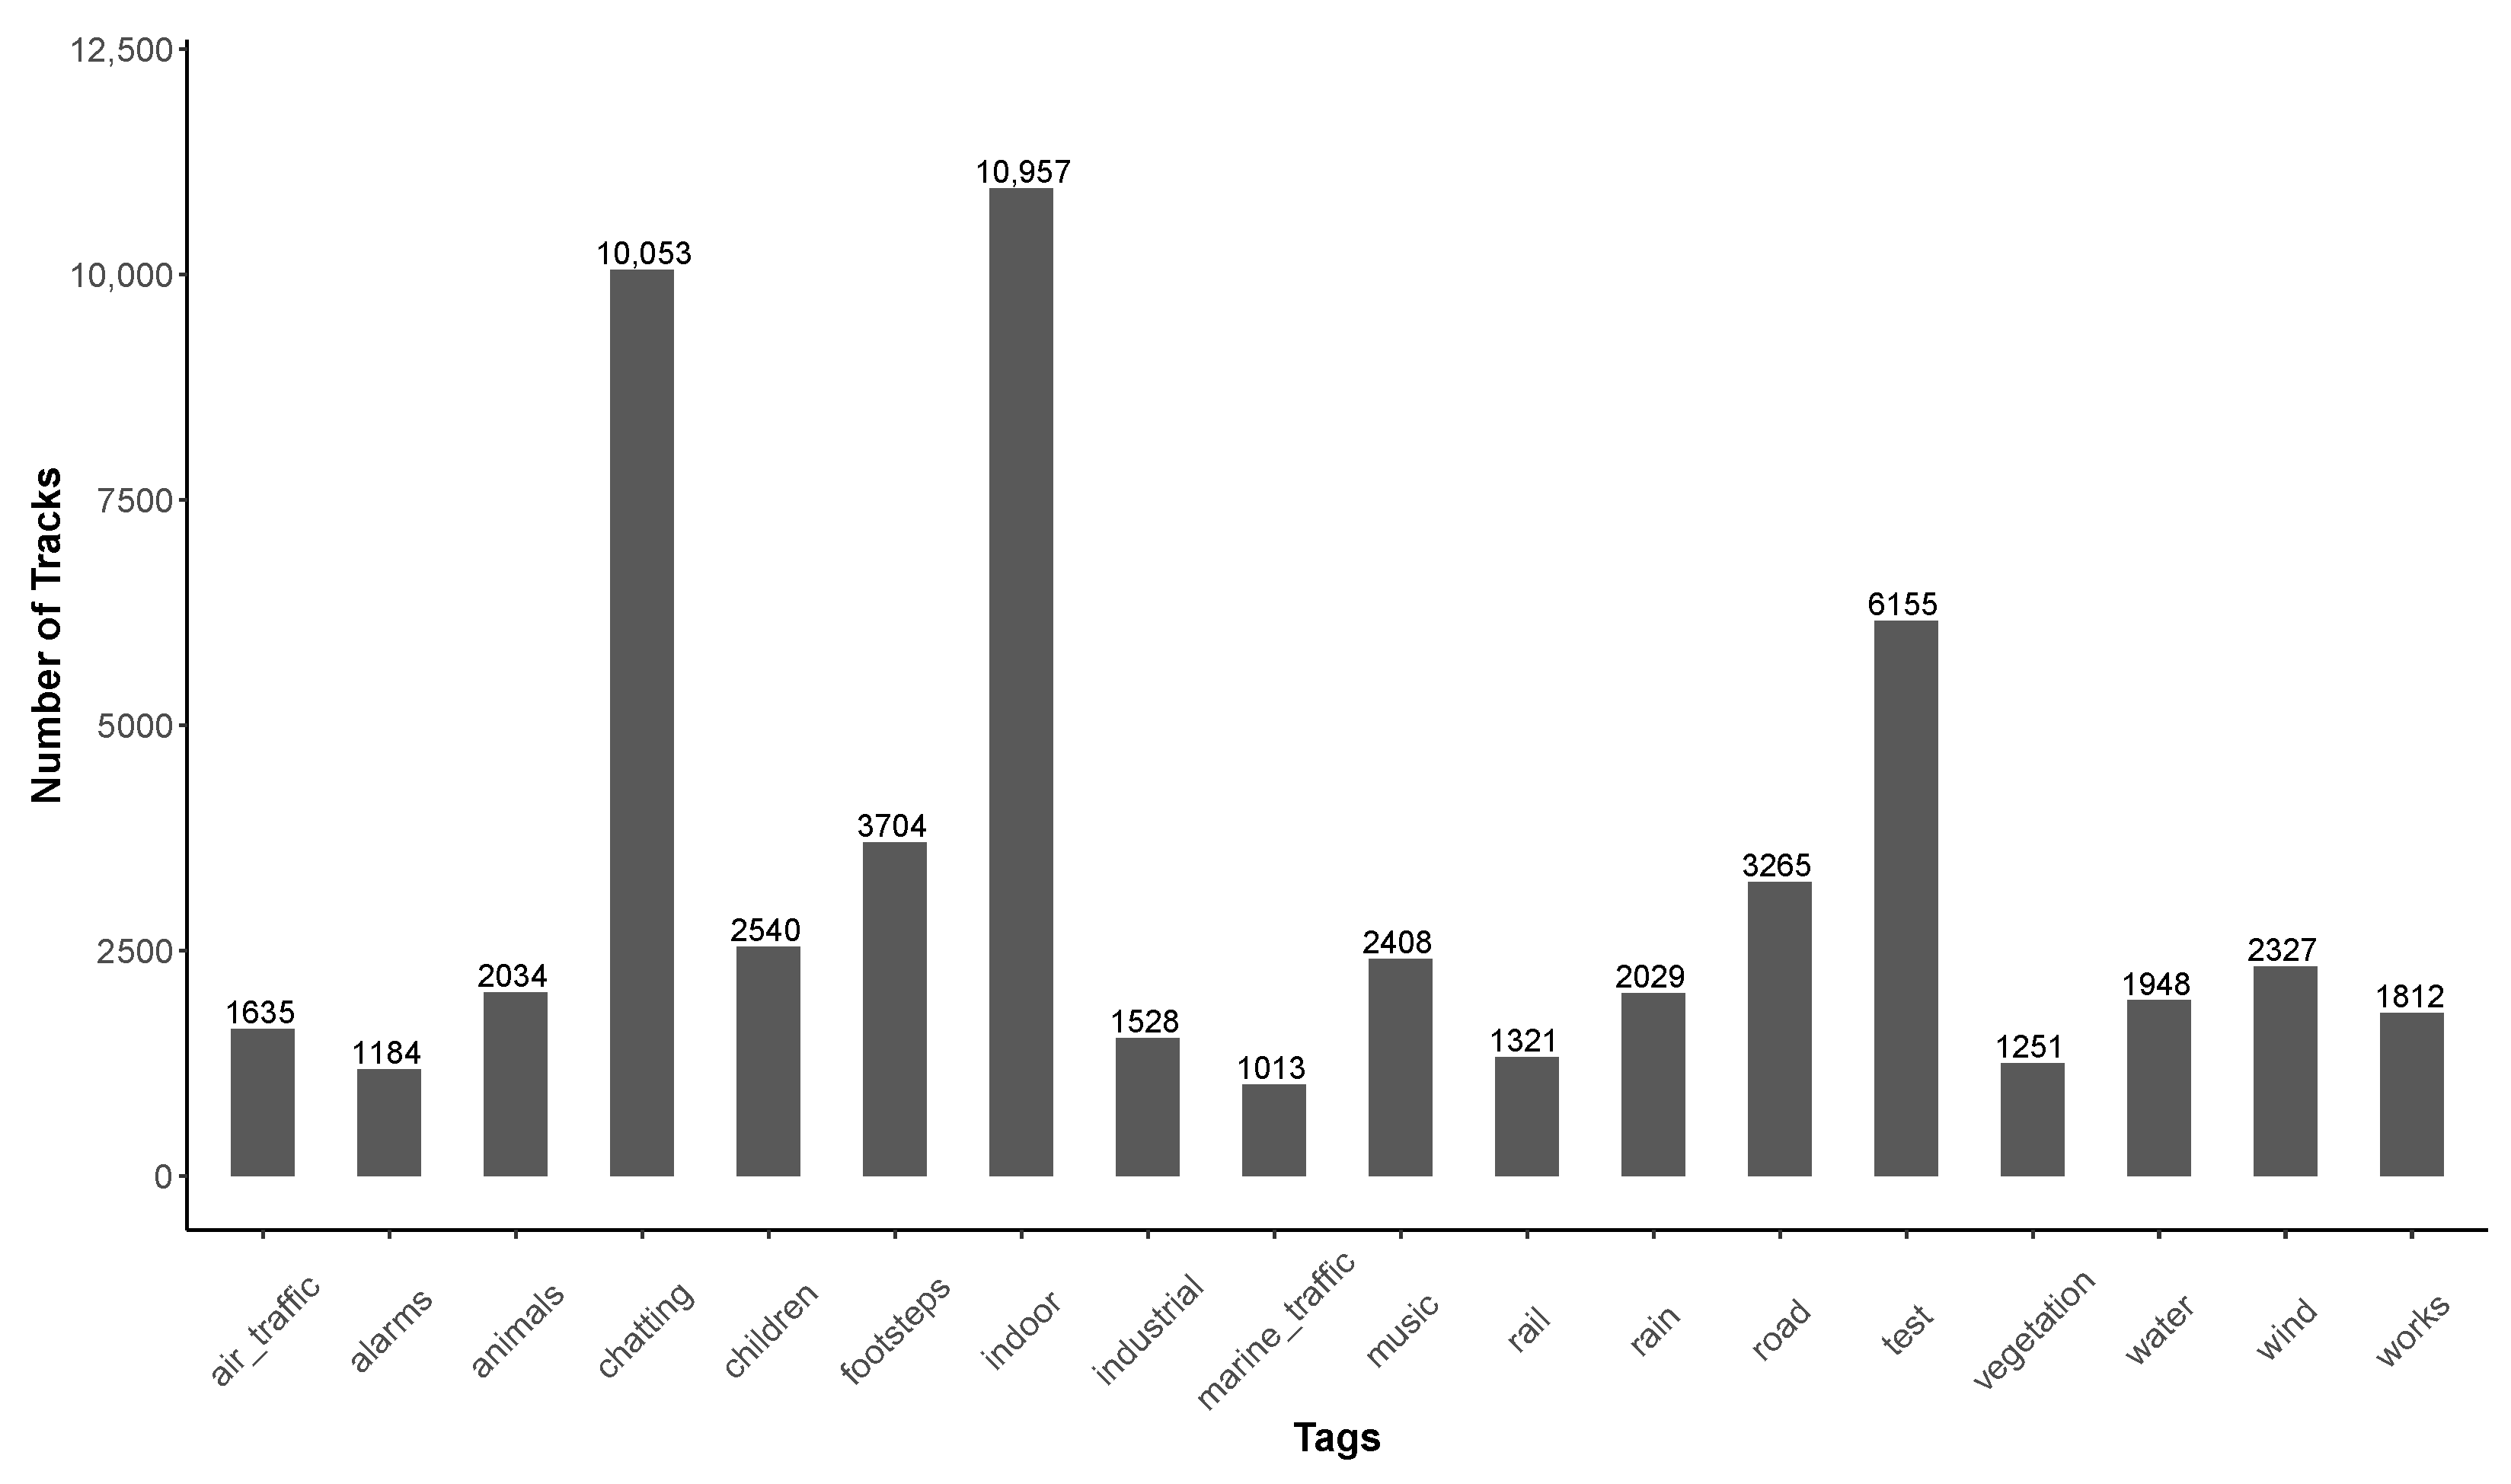
Figure 7.
Distribution of the tags used for tracks collected by user who have 1 only contribution to the database.
Figure 7.
Distribution of the tags used for tracks collected by user who have 1 only contribution to the database.
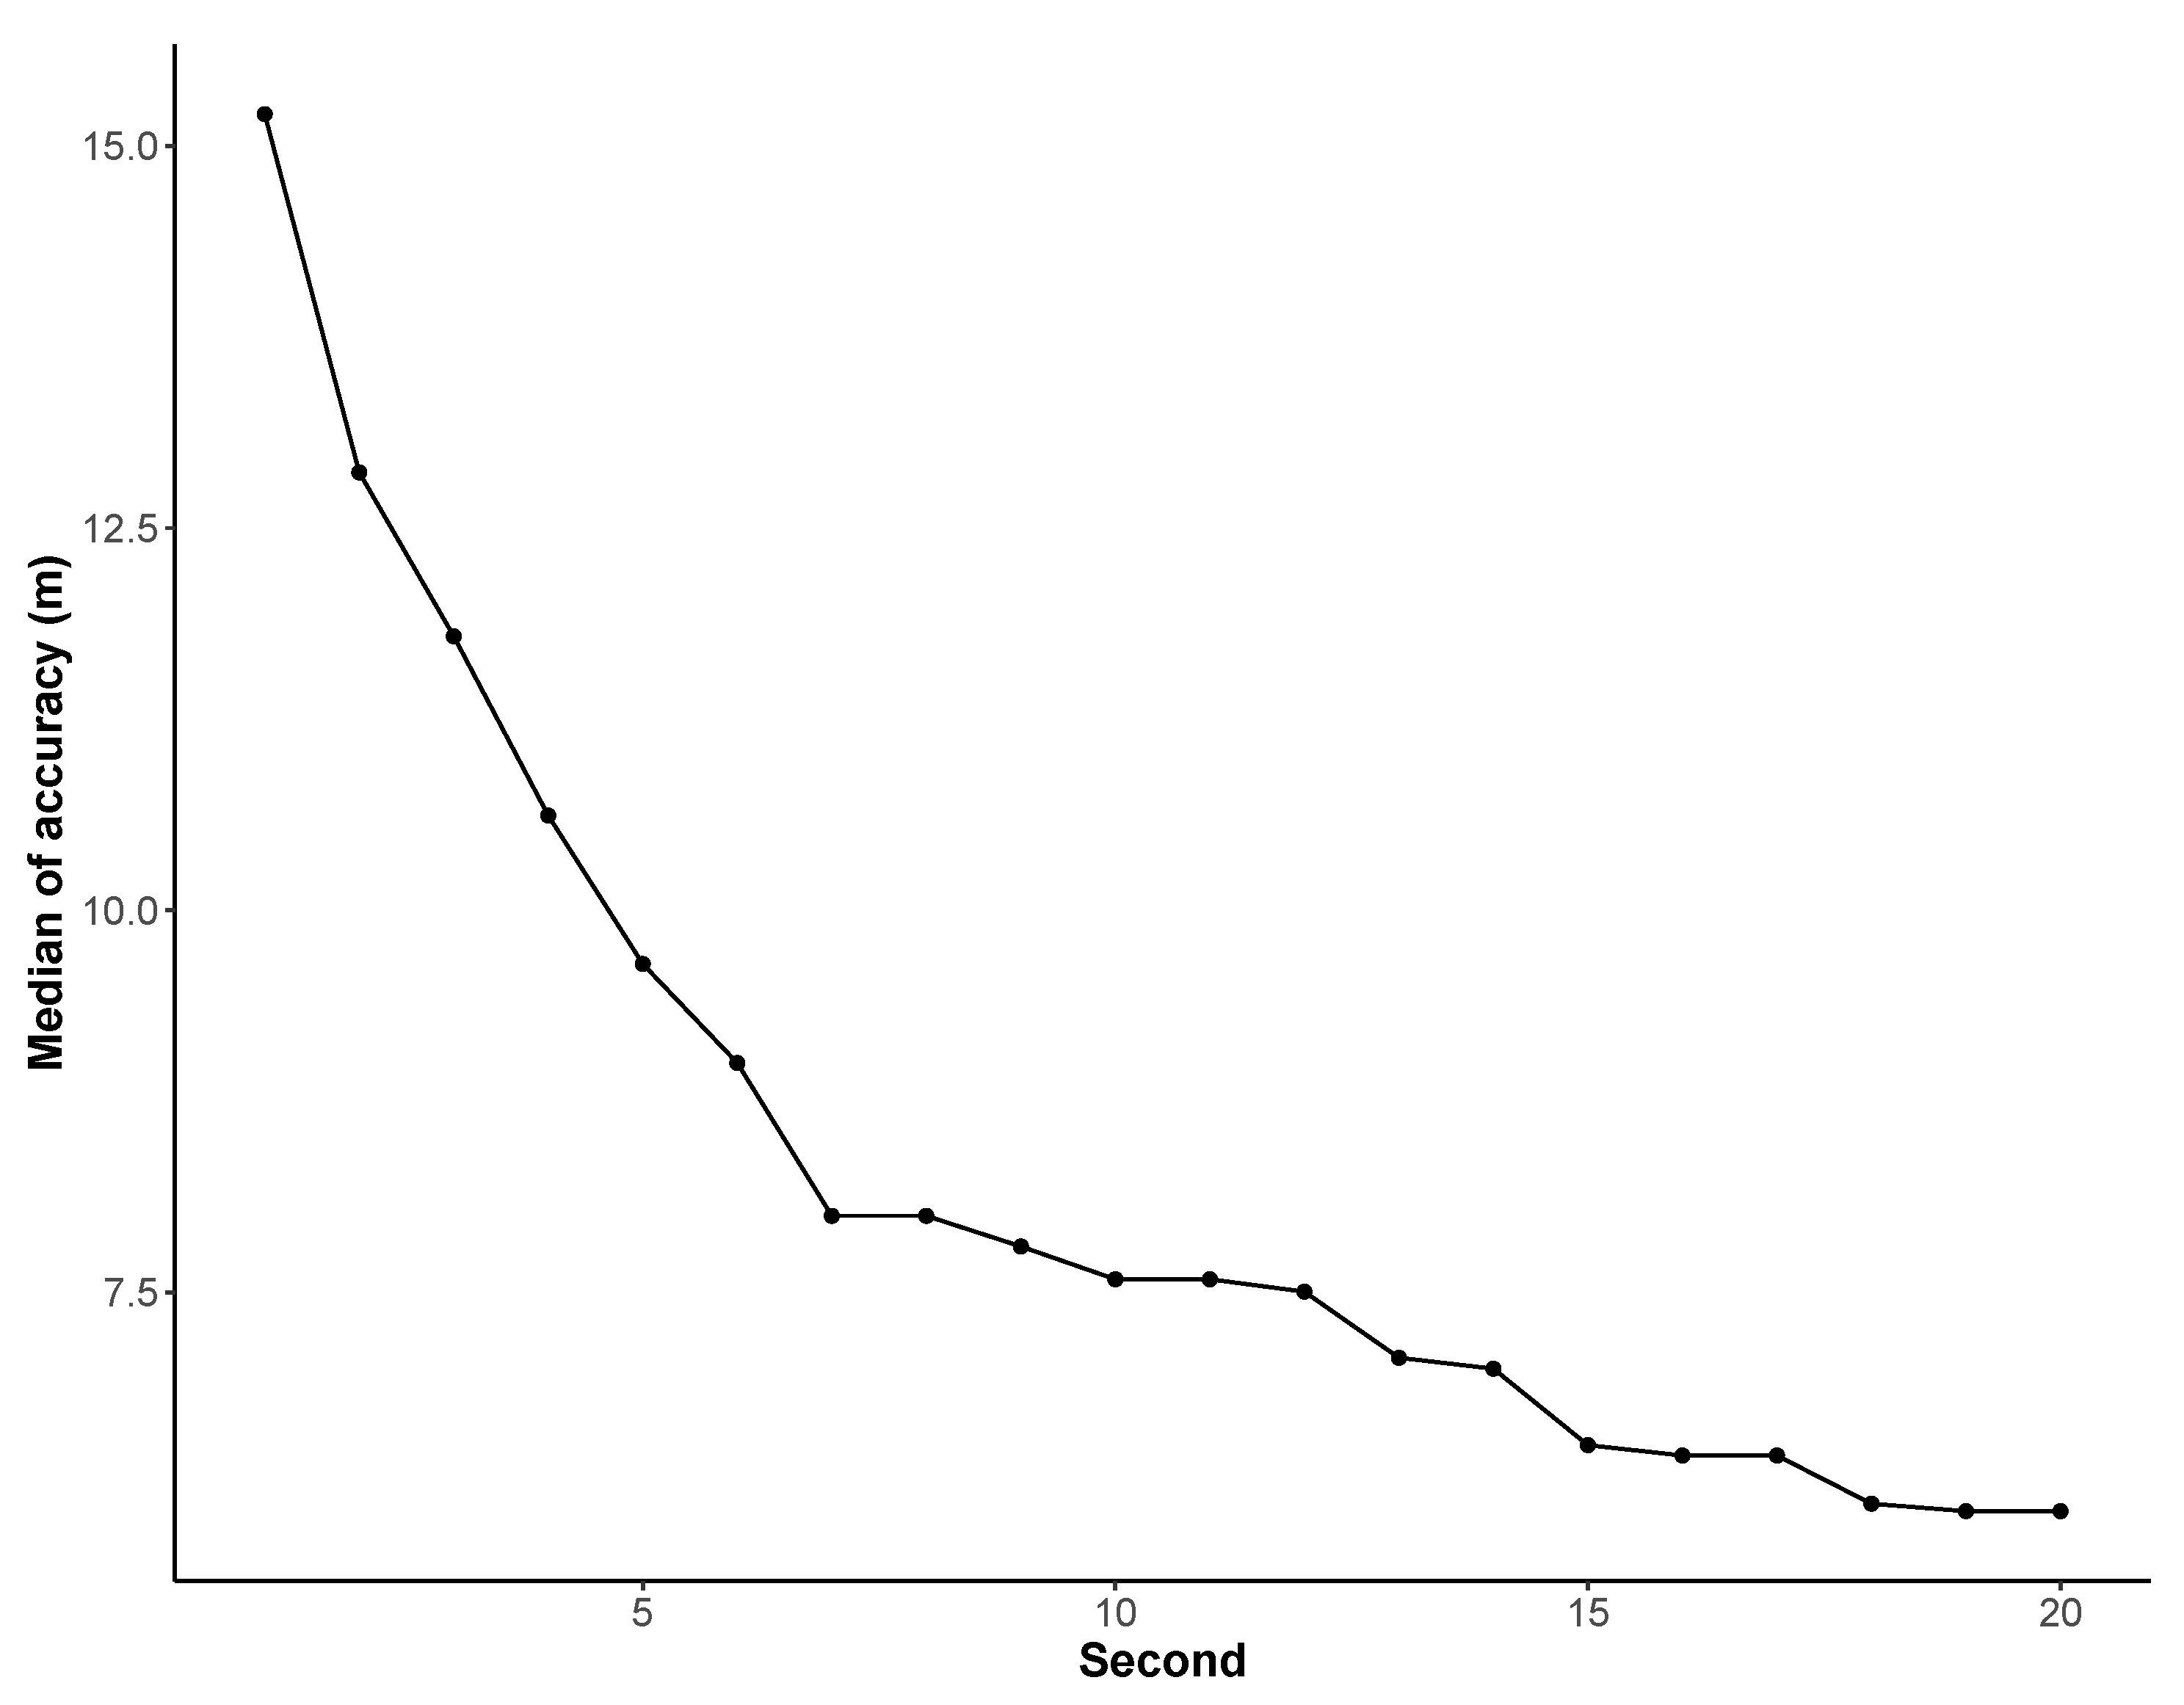
Figure 8.
Evolution of the median value of the accuracy of geolocalization (for all measurement points with geolocalization) in function of time, since the first second of measurement.
Figure 8.
Evolution of the median value of the accuracy of geolocalization (for all measurement points with geolocalization) in function of time, since the first second of measurement.
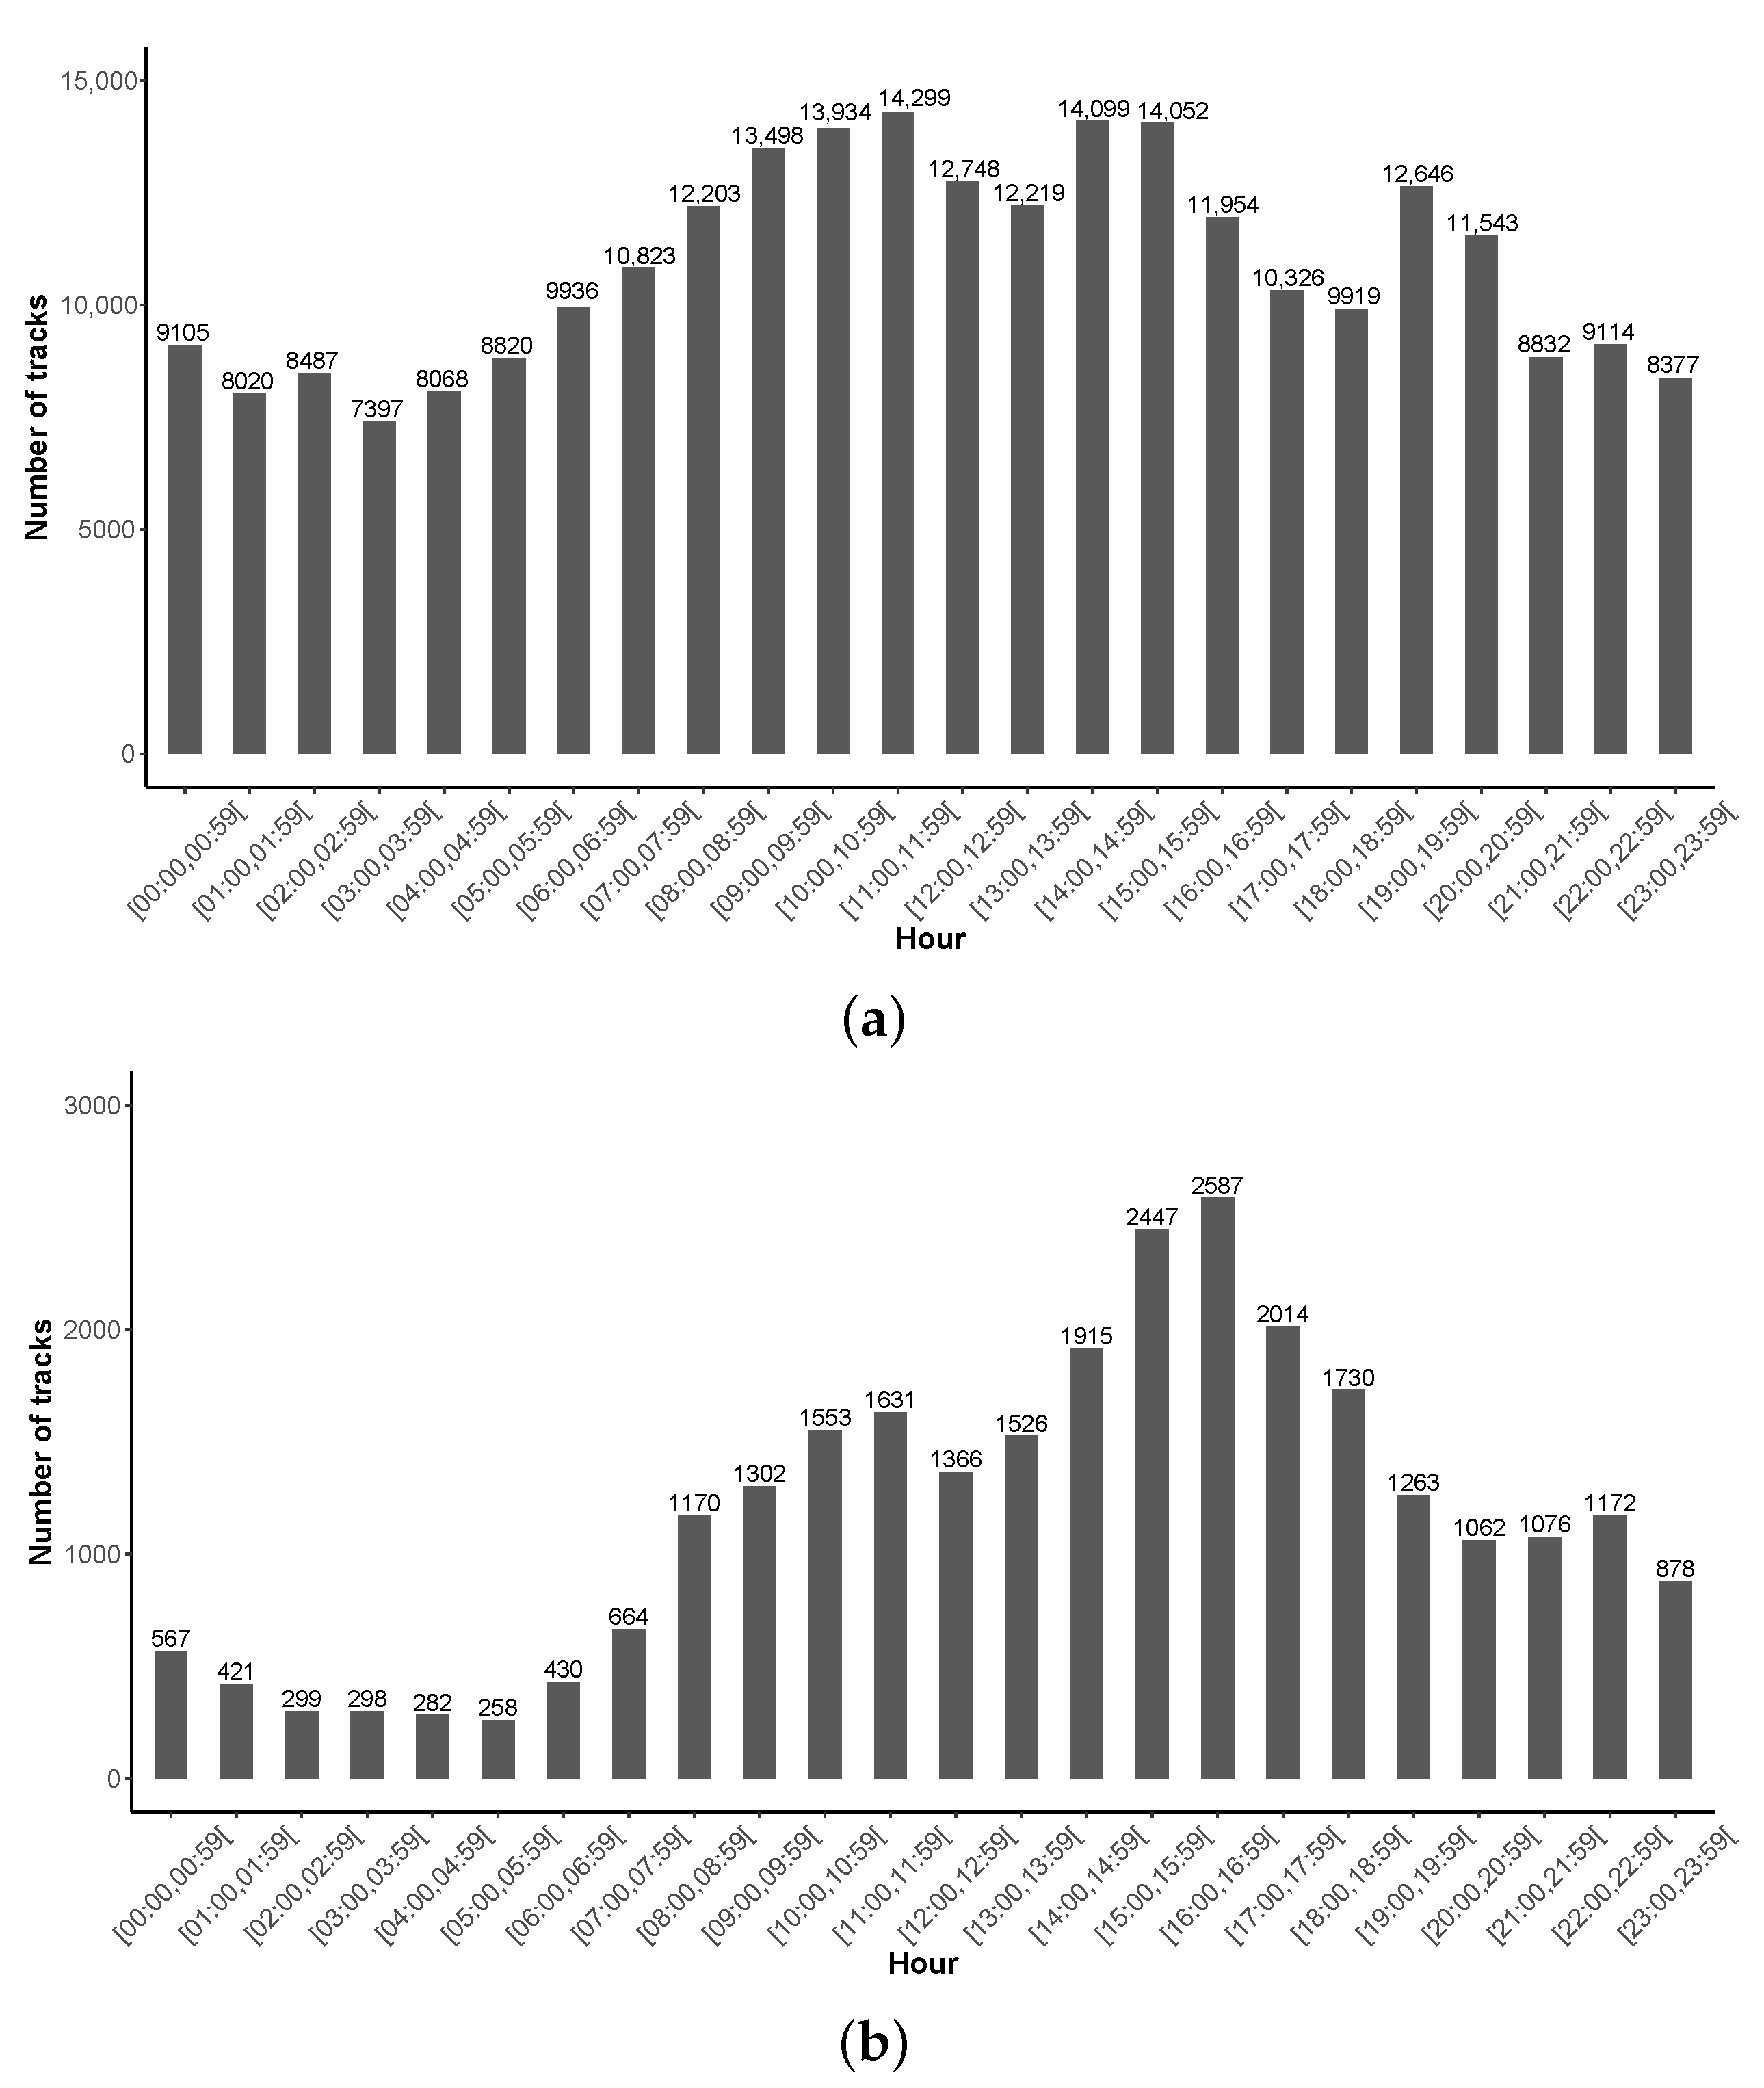
Figure 9.
Distribution of tracks per hour of the day, for the entire database and for the data collected in France only. (a) Distribution of tracks per hour of the day, for the whole database. (b) Distribution of tracks per hour of the day for data collected in France only.
Figure 9.
Distribution of tracks per hour of the day, for the entire database and for the data collected in France only. (a) Distribution of tracks per hour of the day, for the whole database. (b) Distribution of tracks per hour of the day for data collected in France only.
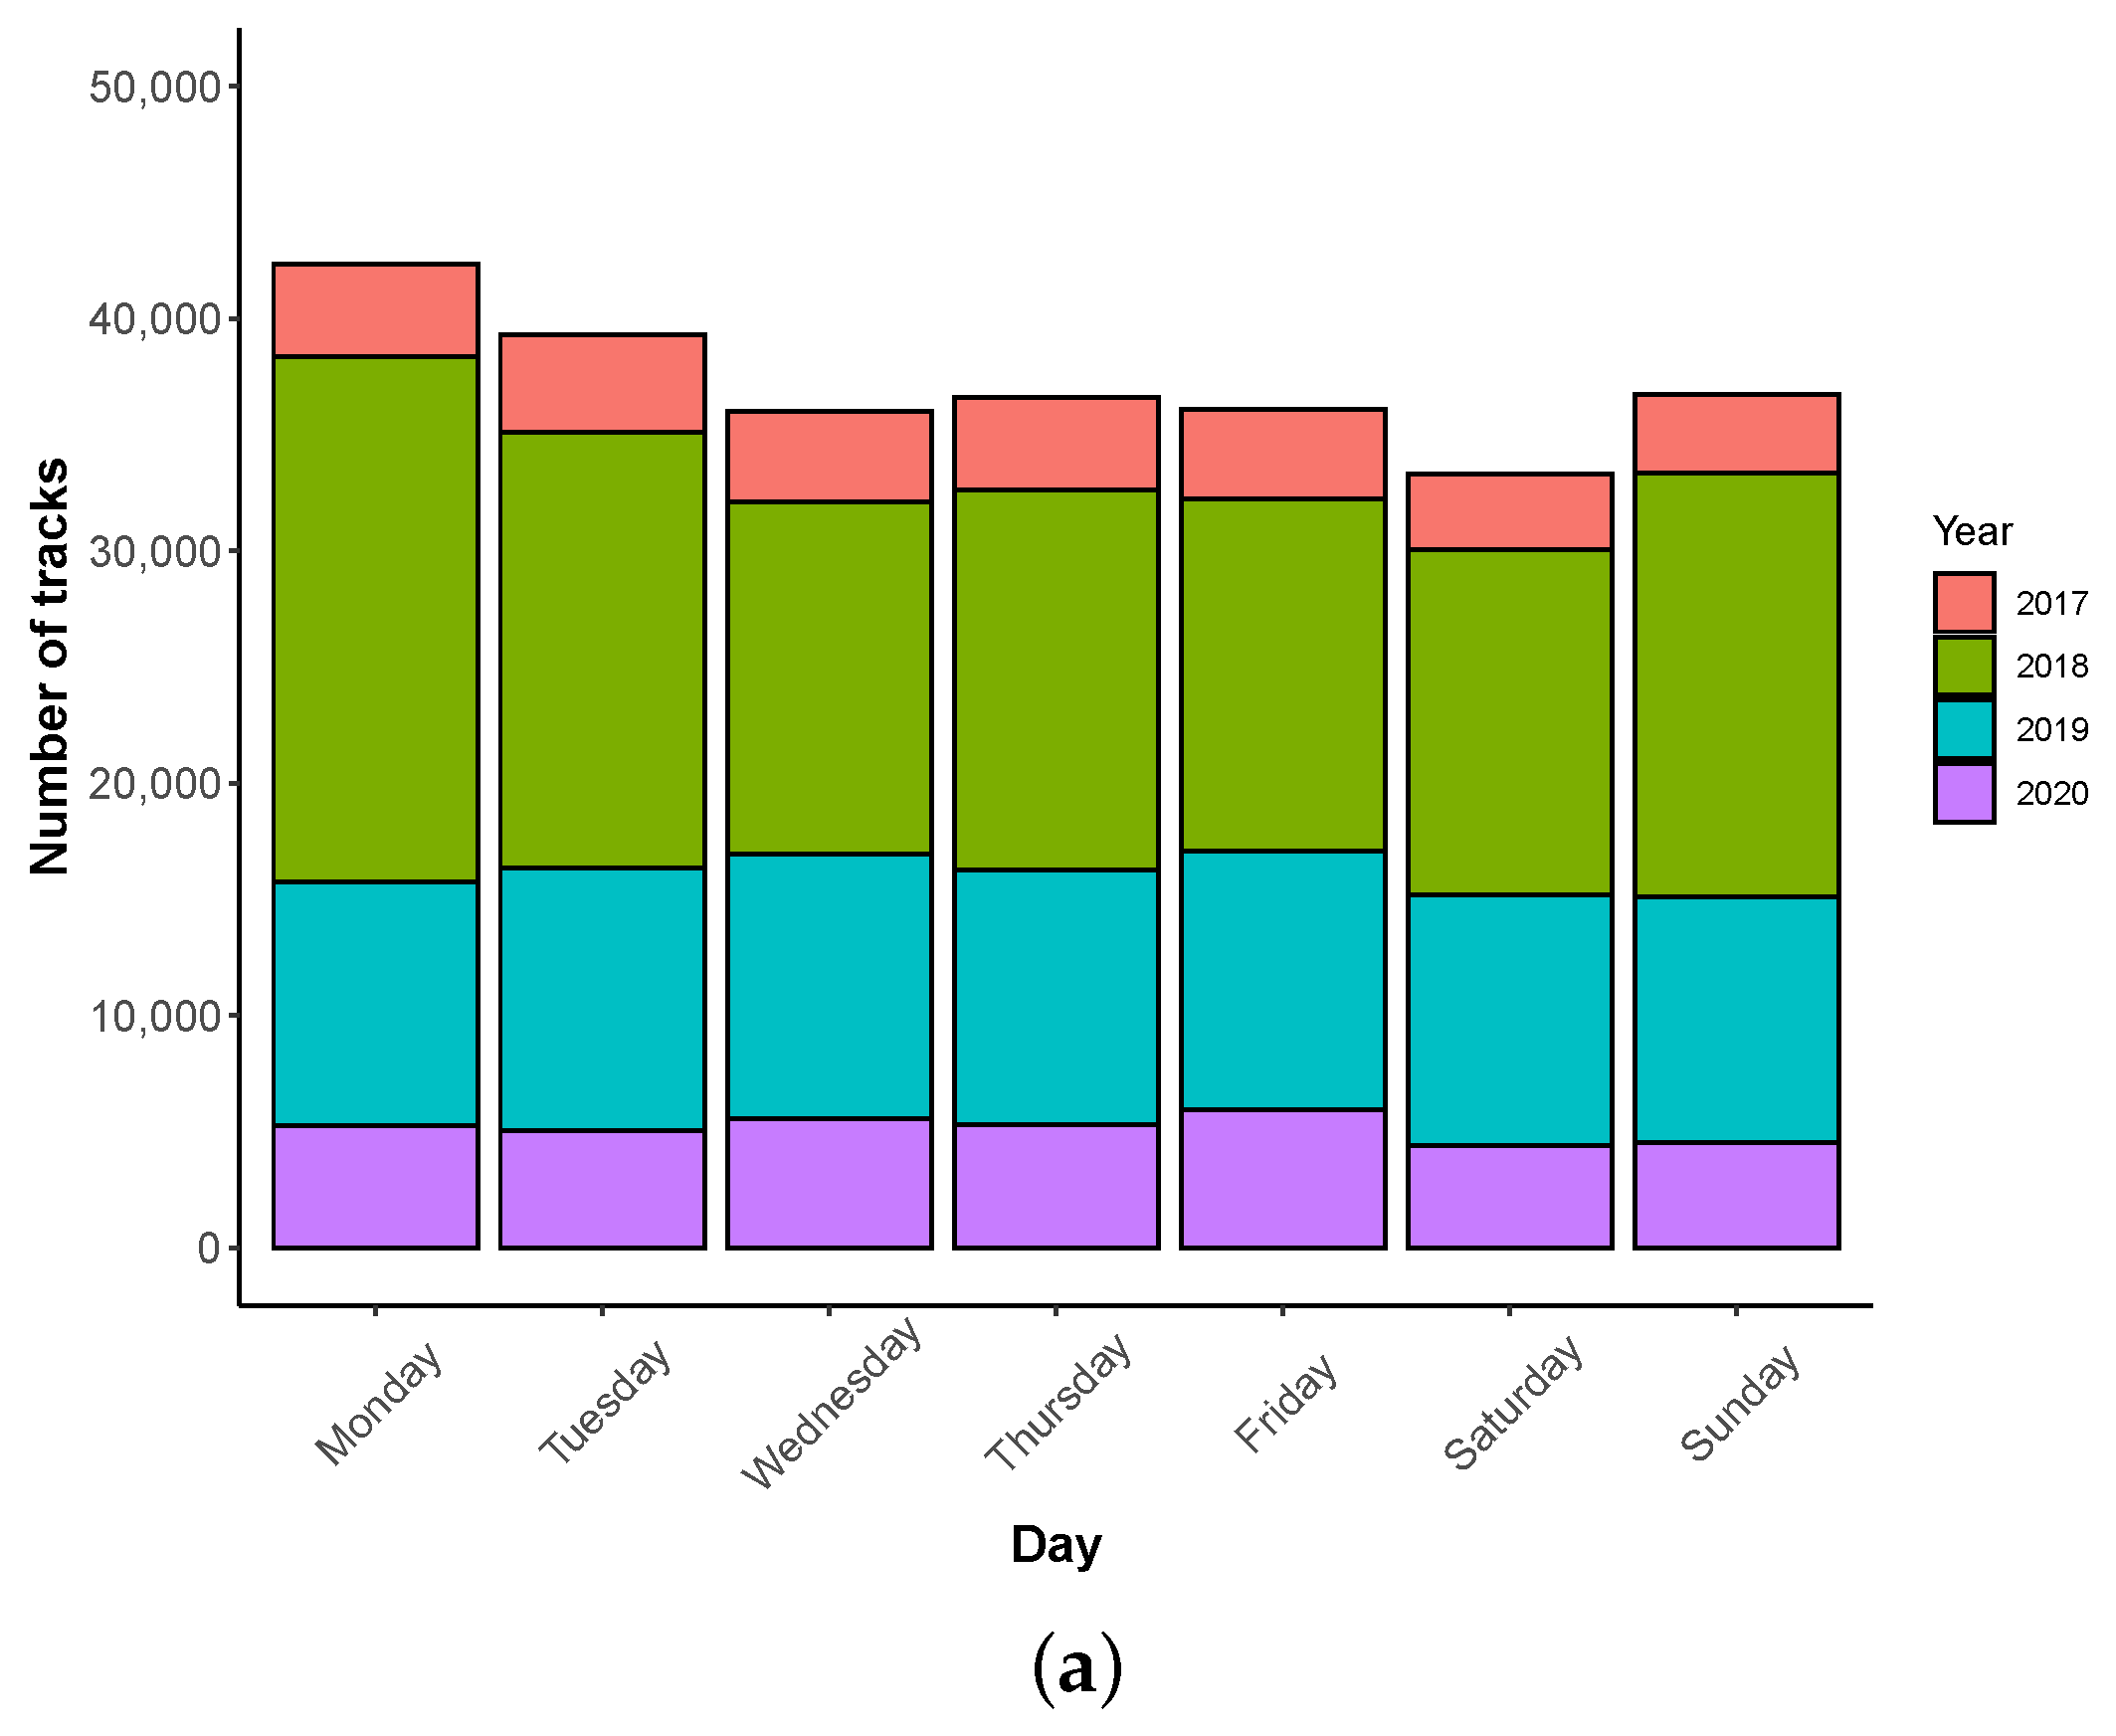
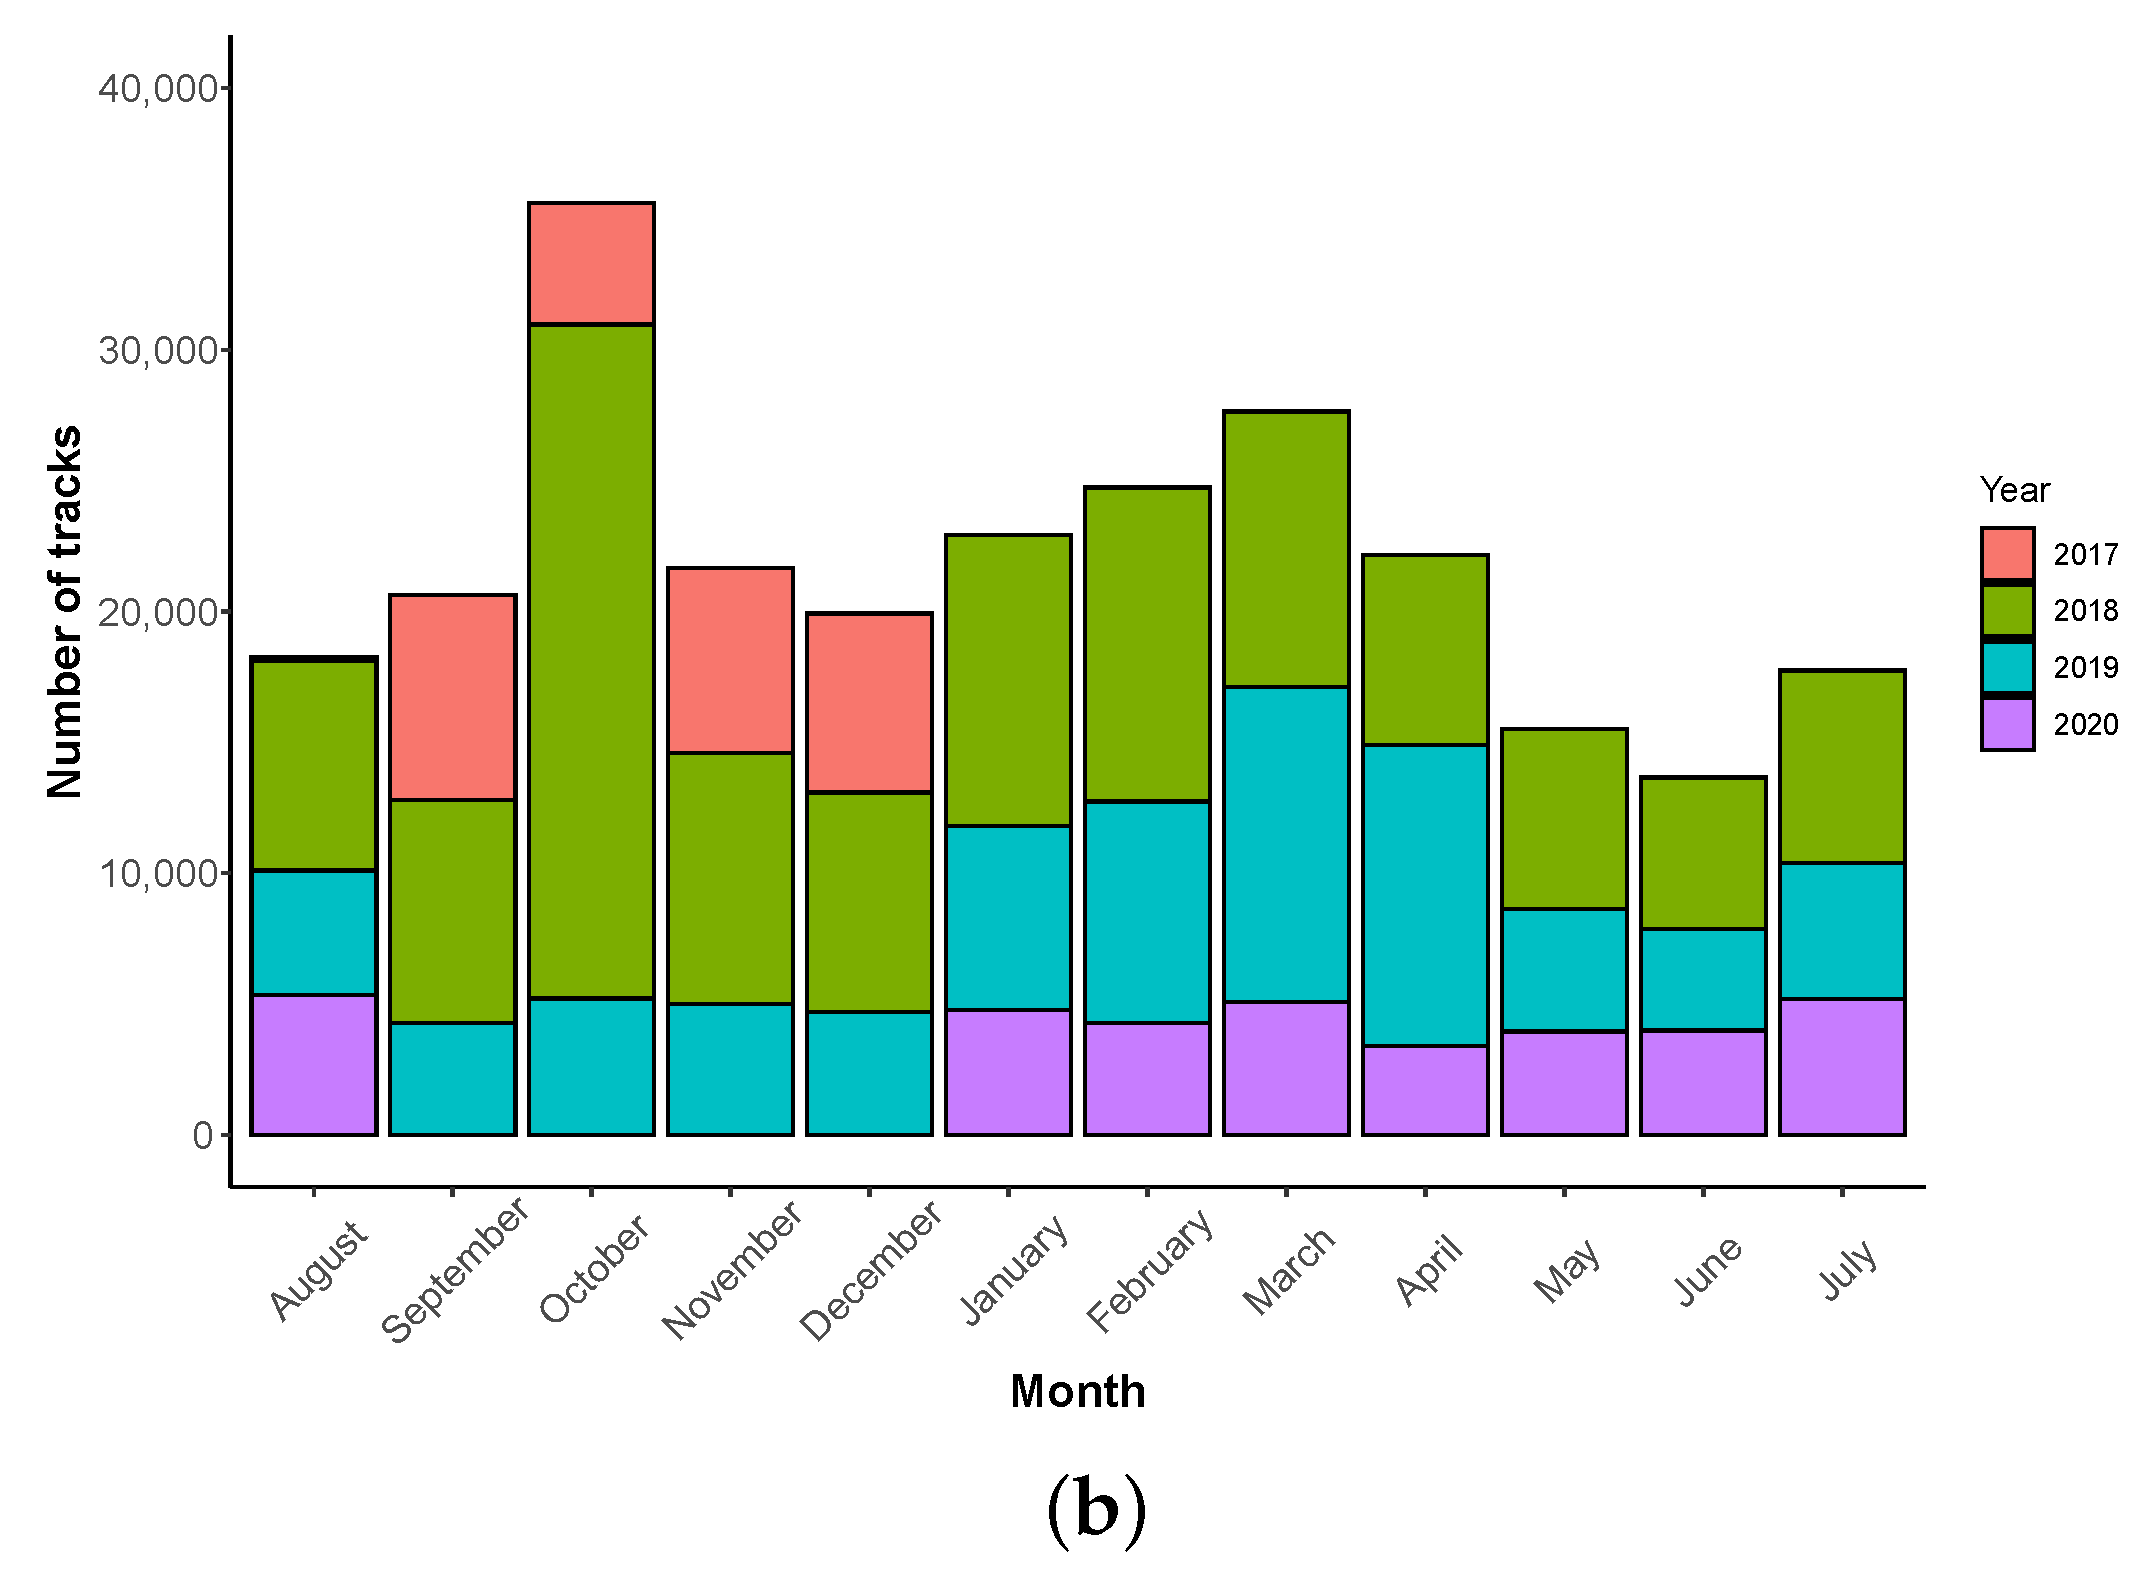
Figure 10.
Distribution of track measurements in function of the day and the month, over the 3 years of the collected data. (a) Distribution of tracks per day of the week. (b) Distribution of tracks per month.
Figure 10.
Distribution of track measurements in function of the day and the month, over the 3 years of the collected data. (a) Distribution of tracks per day of the week. (b) Distribution of tracks per month.
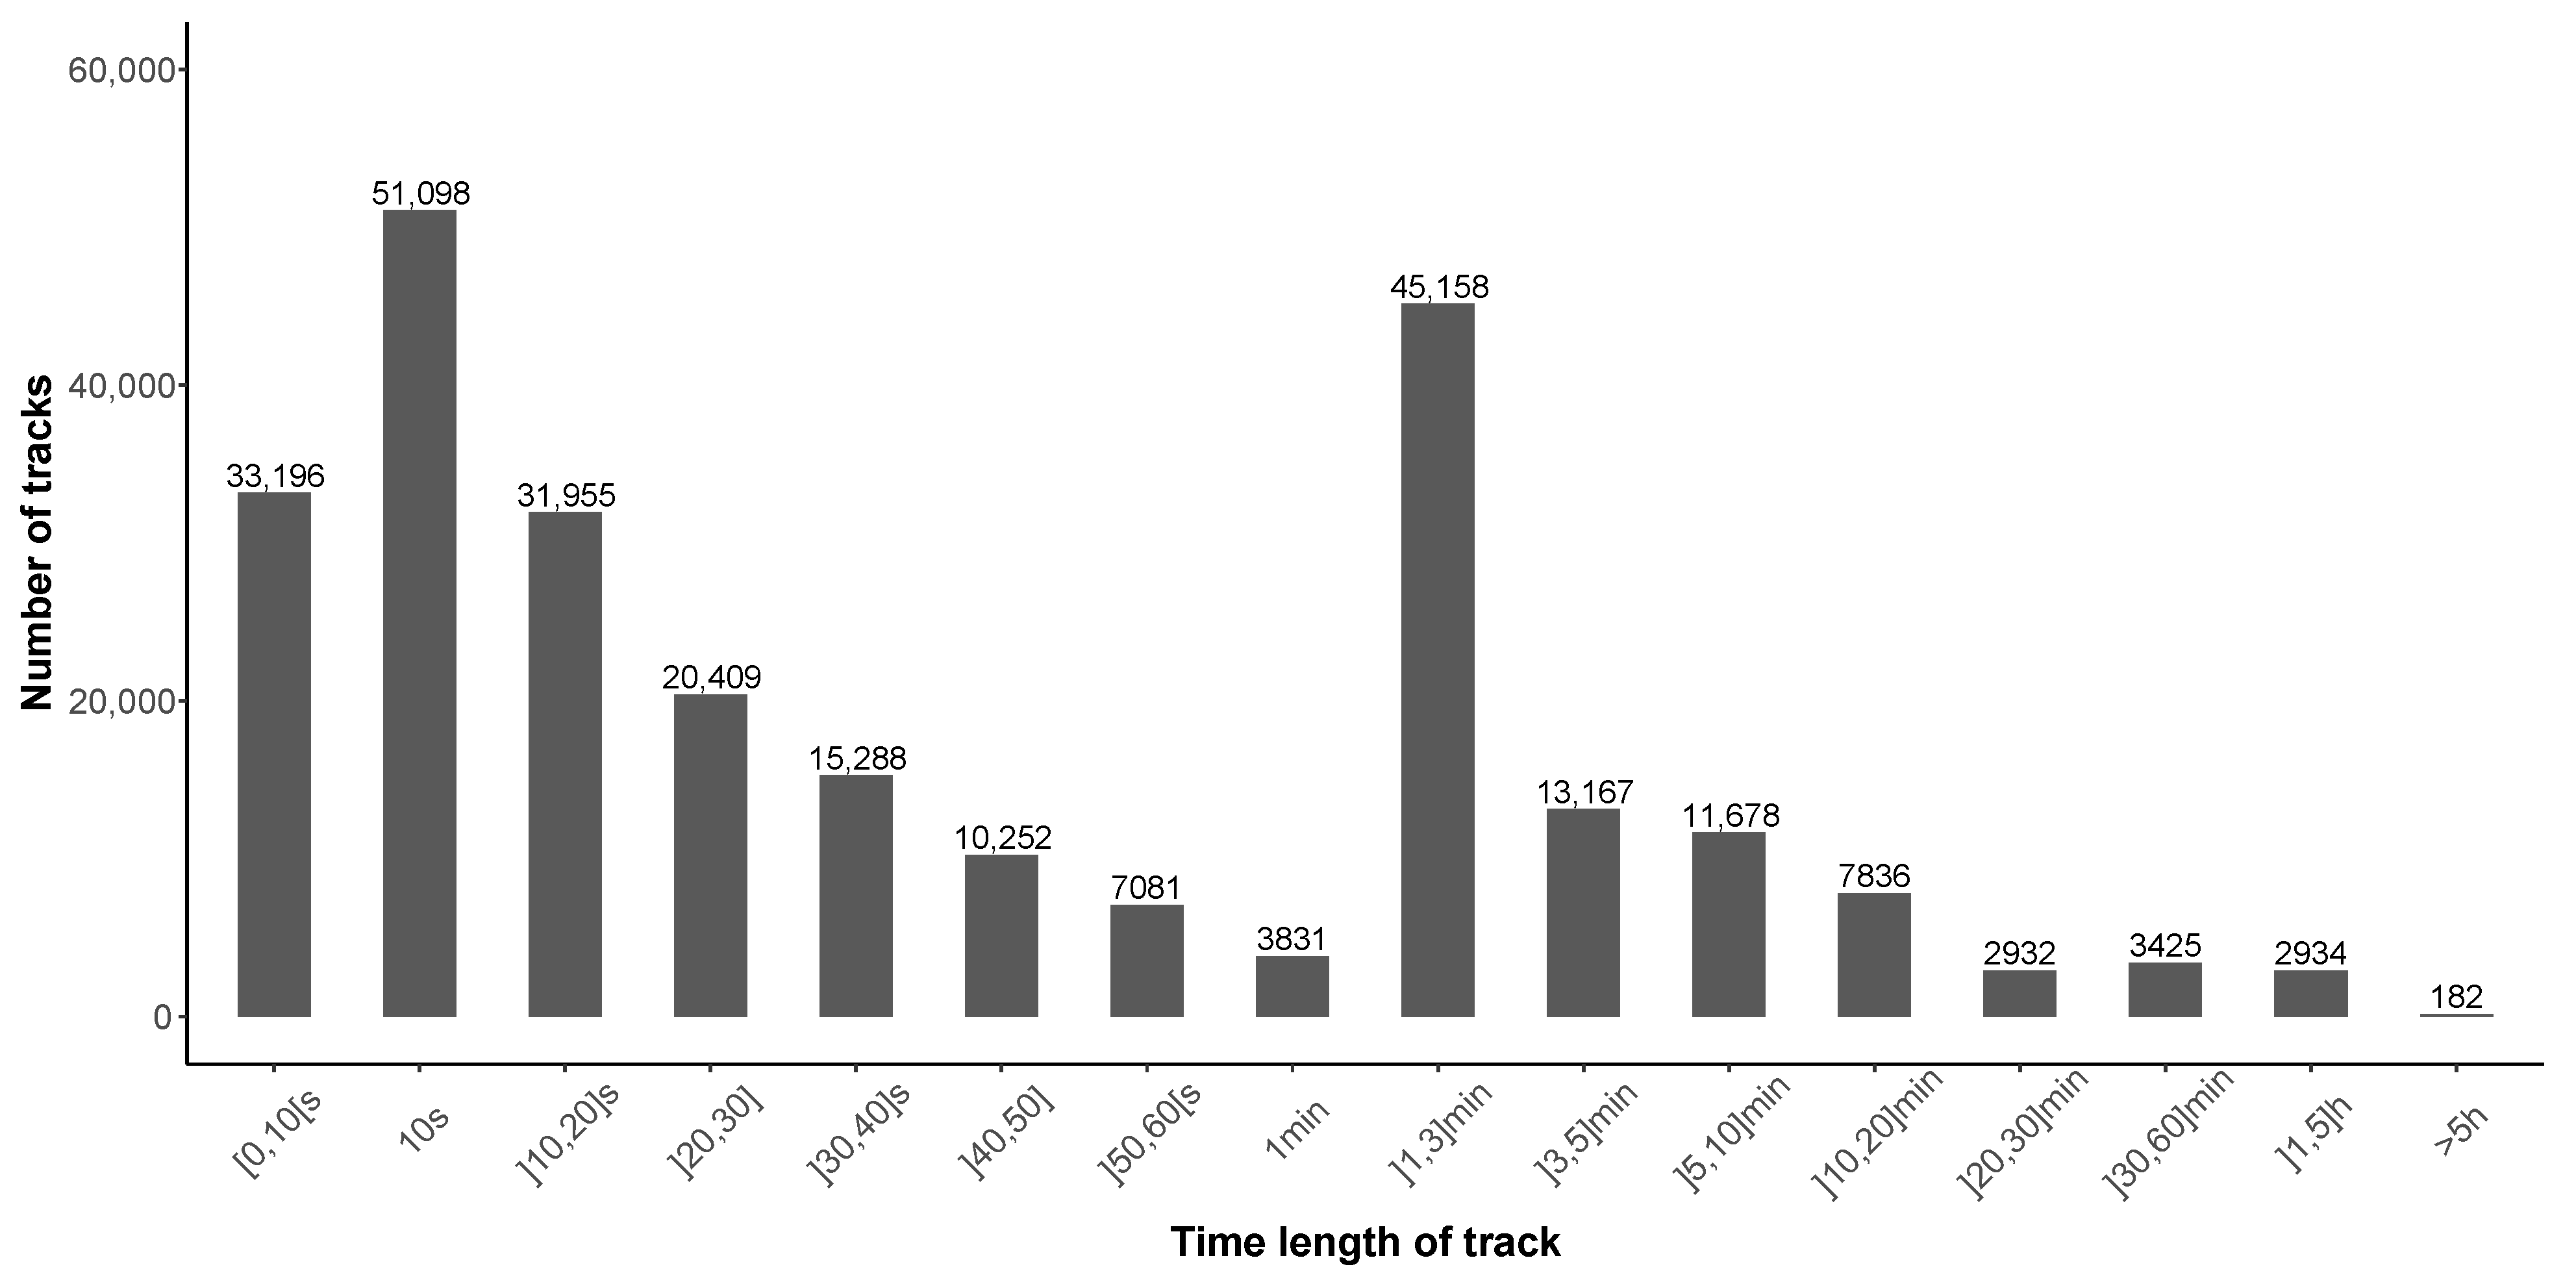
Figure 11.
Distribution of tracks in function of the duration of the measurement (‘time_length’).
Figure 11.
Distribution of tracks in function of the duration of the measurement (‘time_length’).
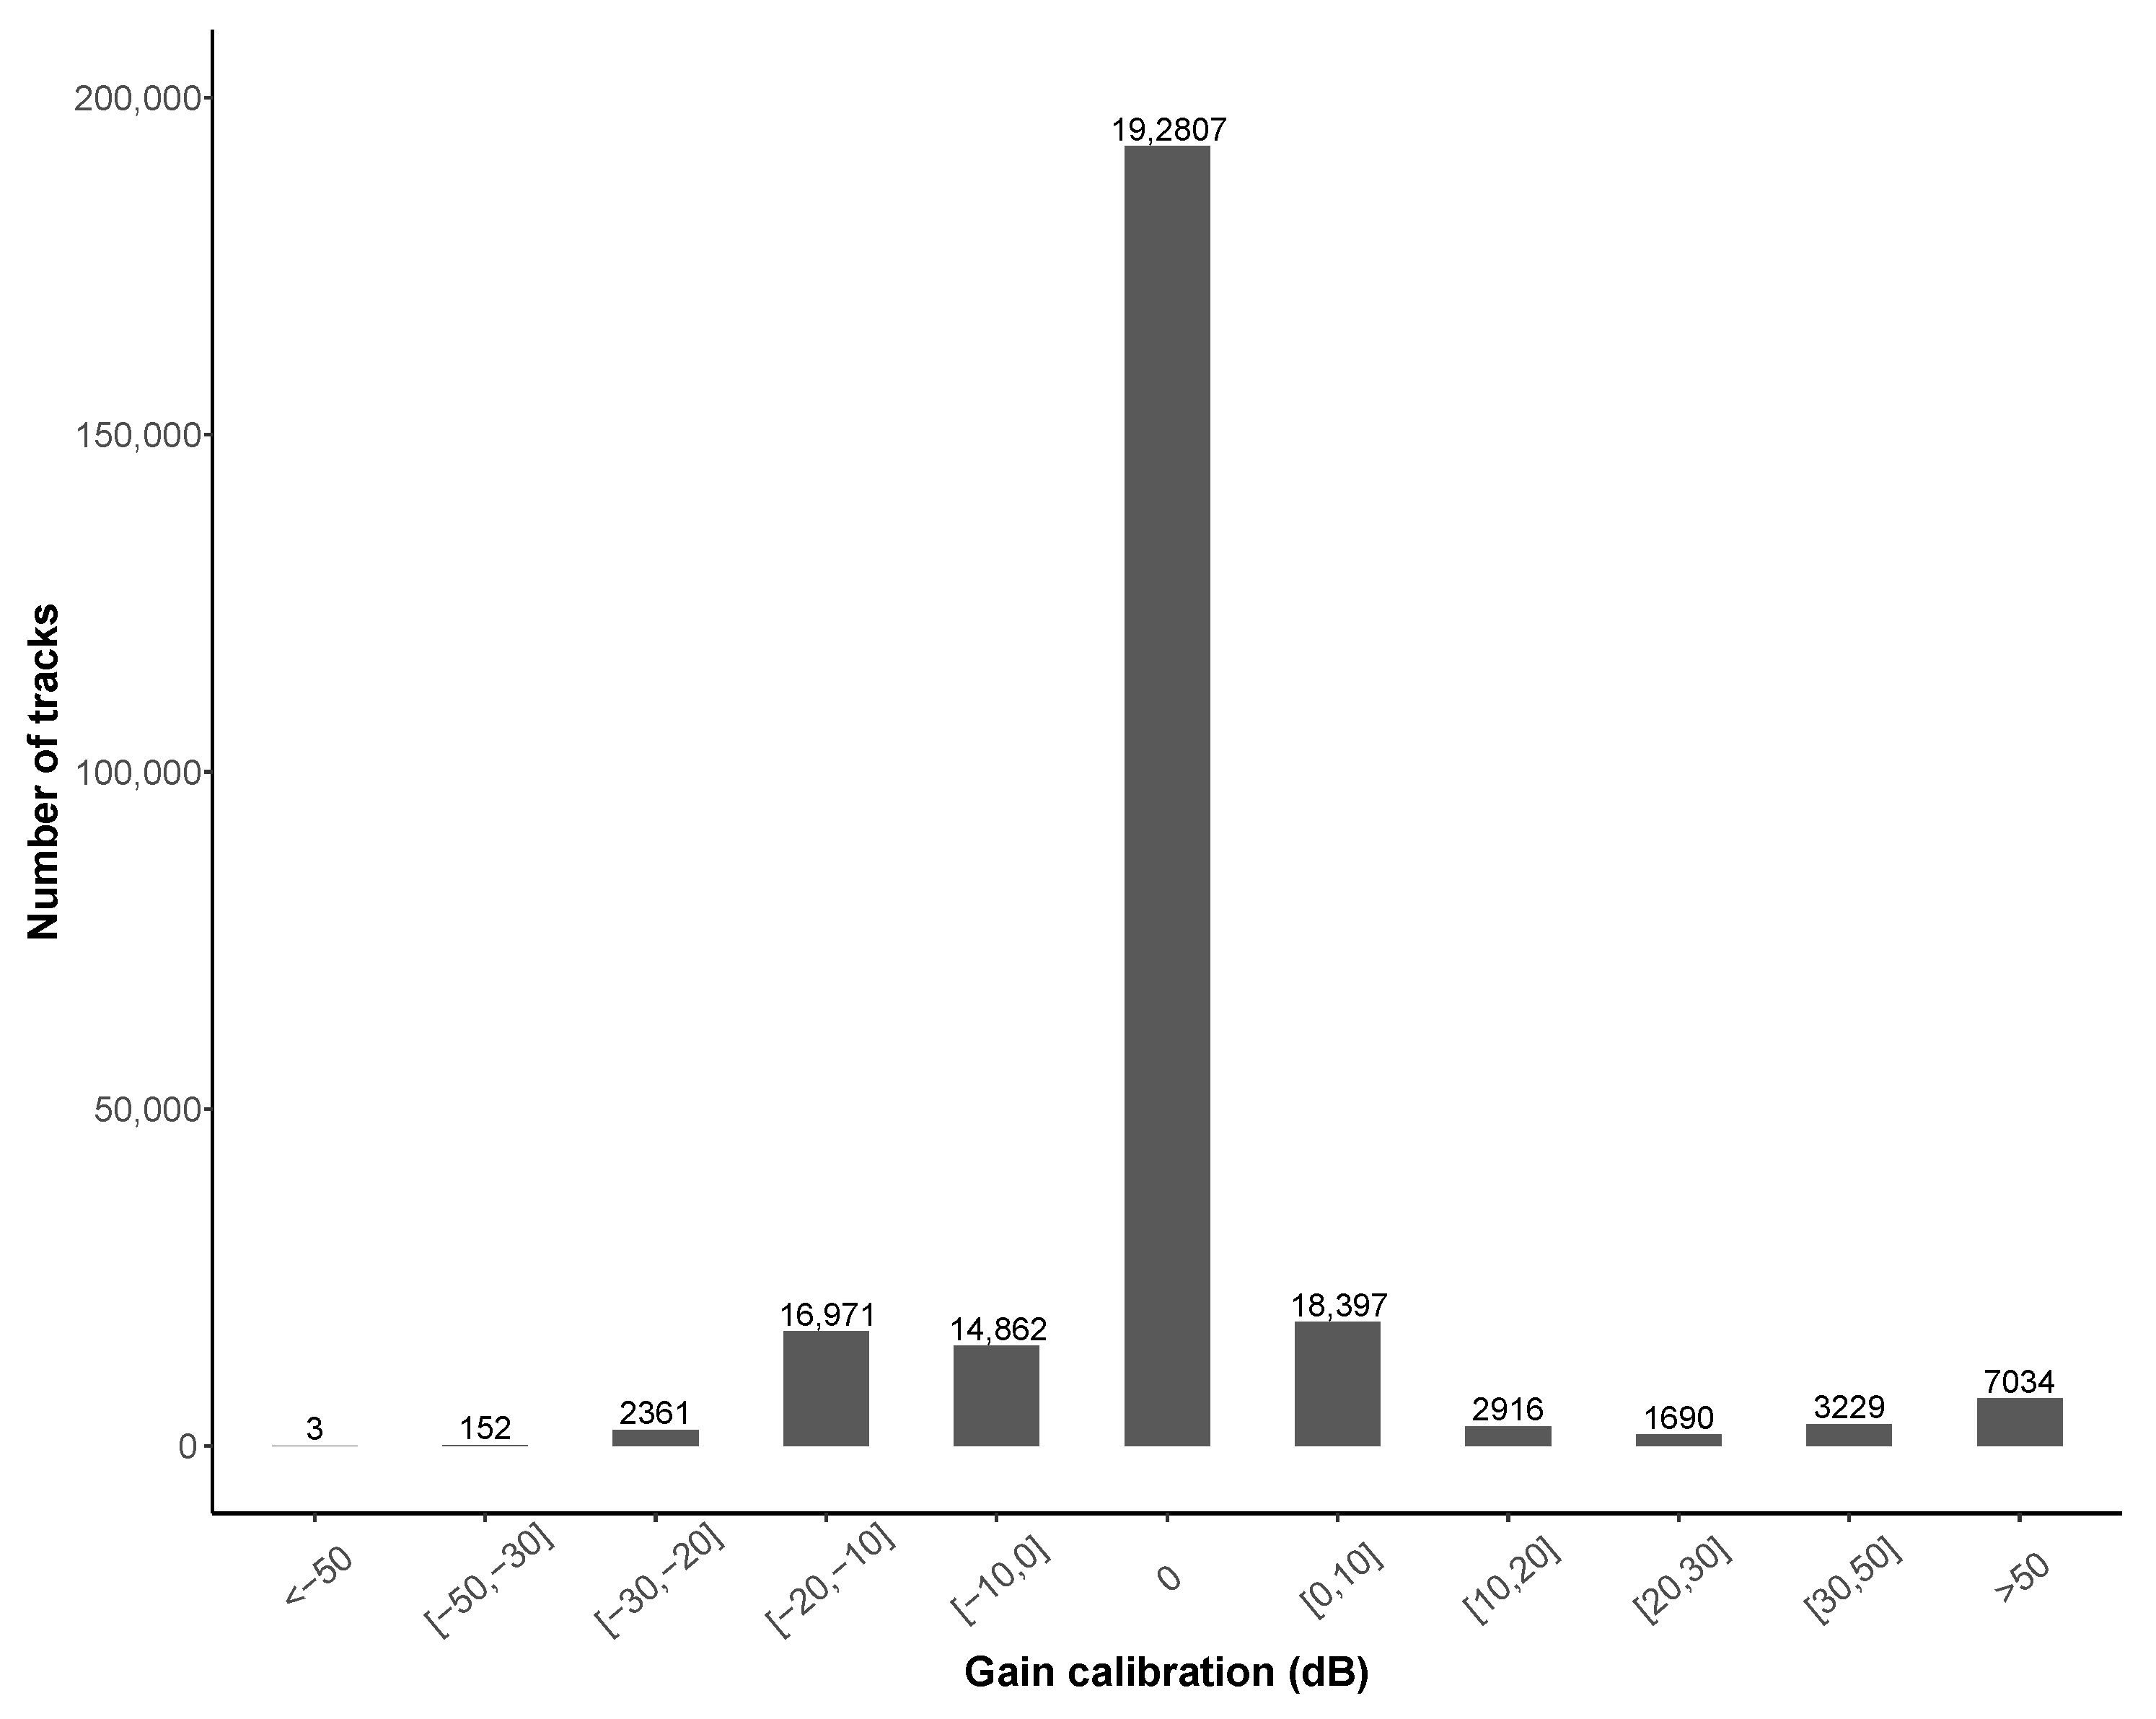
Figure 12.
Number of tracks in function of ‘gain_calibration’ value.
Figure 12.
Number of tracks in function of ‘gain_calibration’ value.
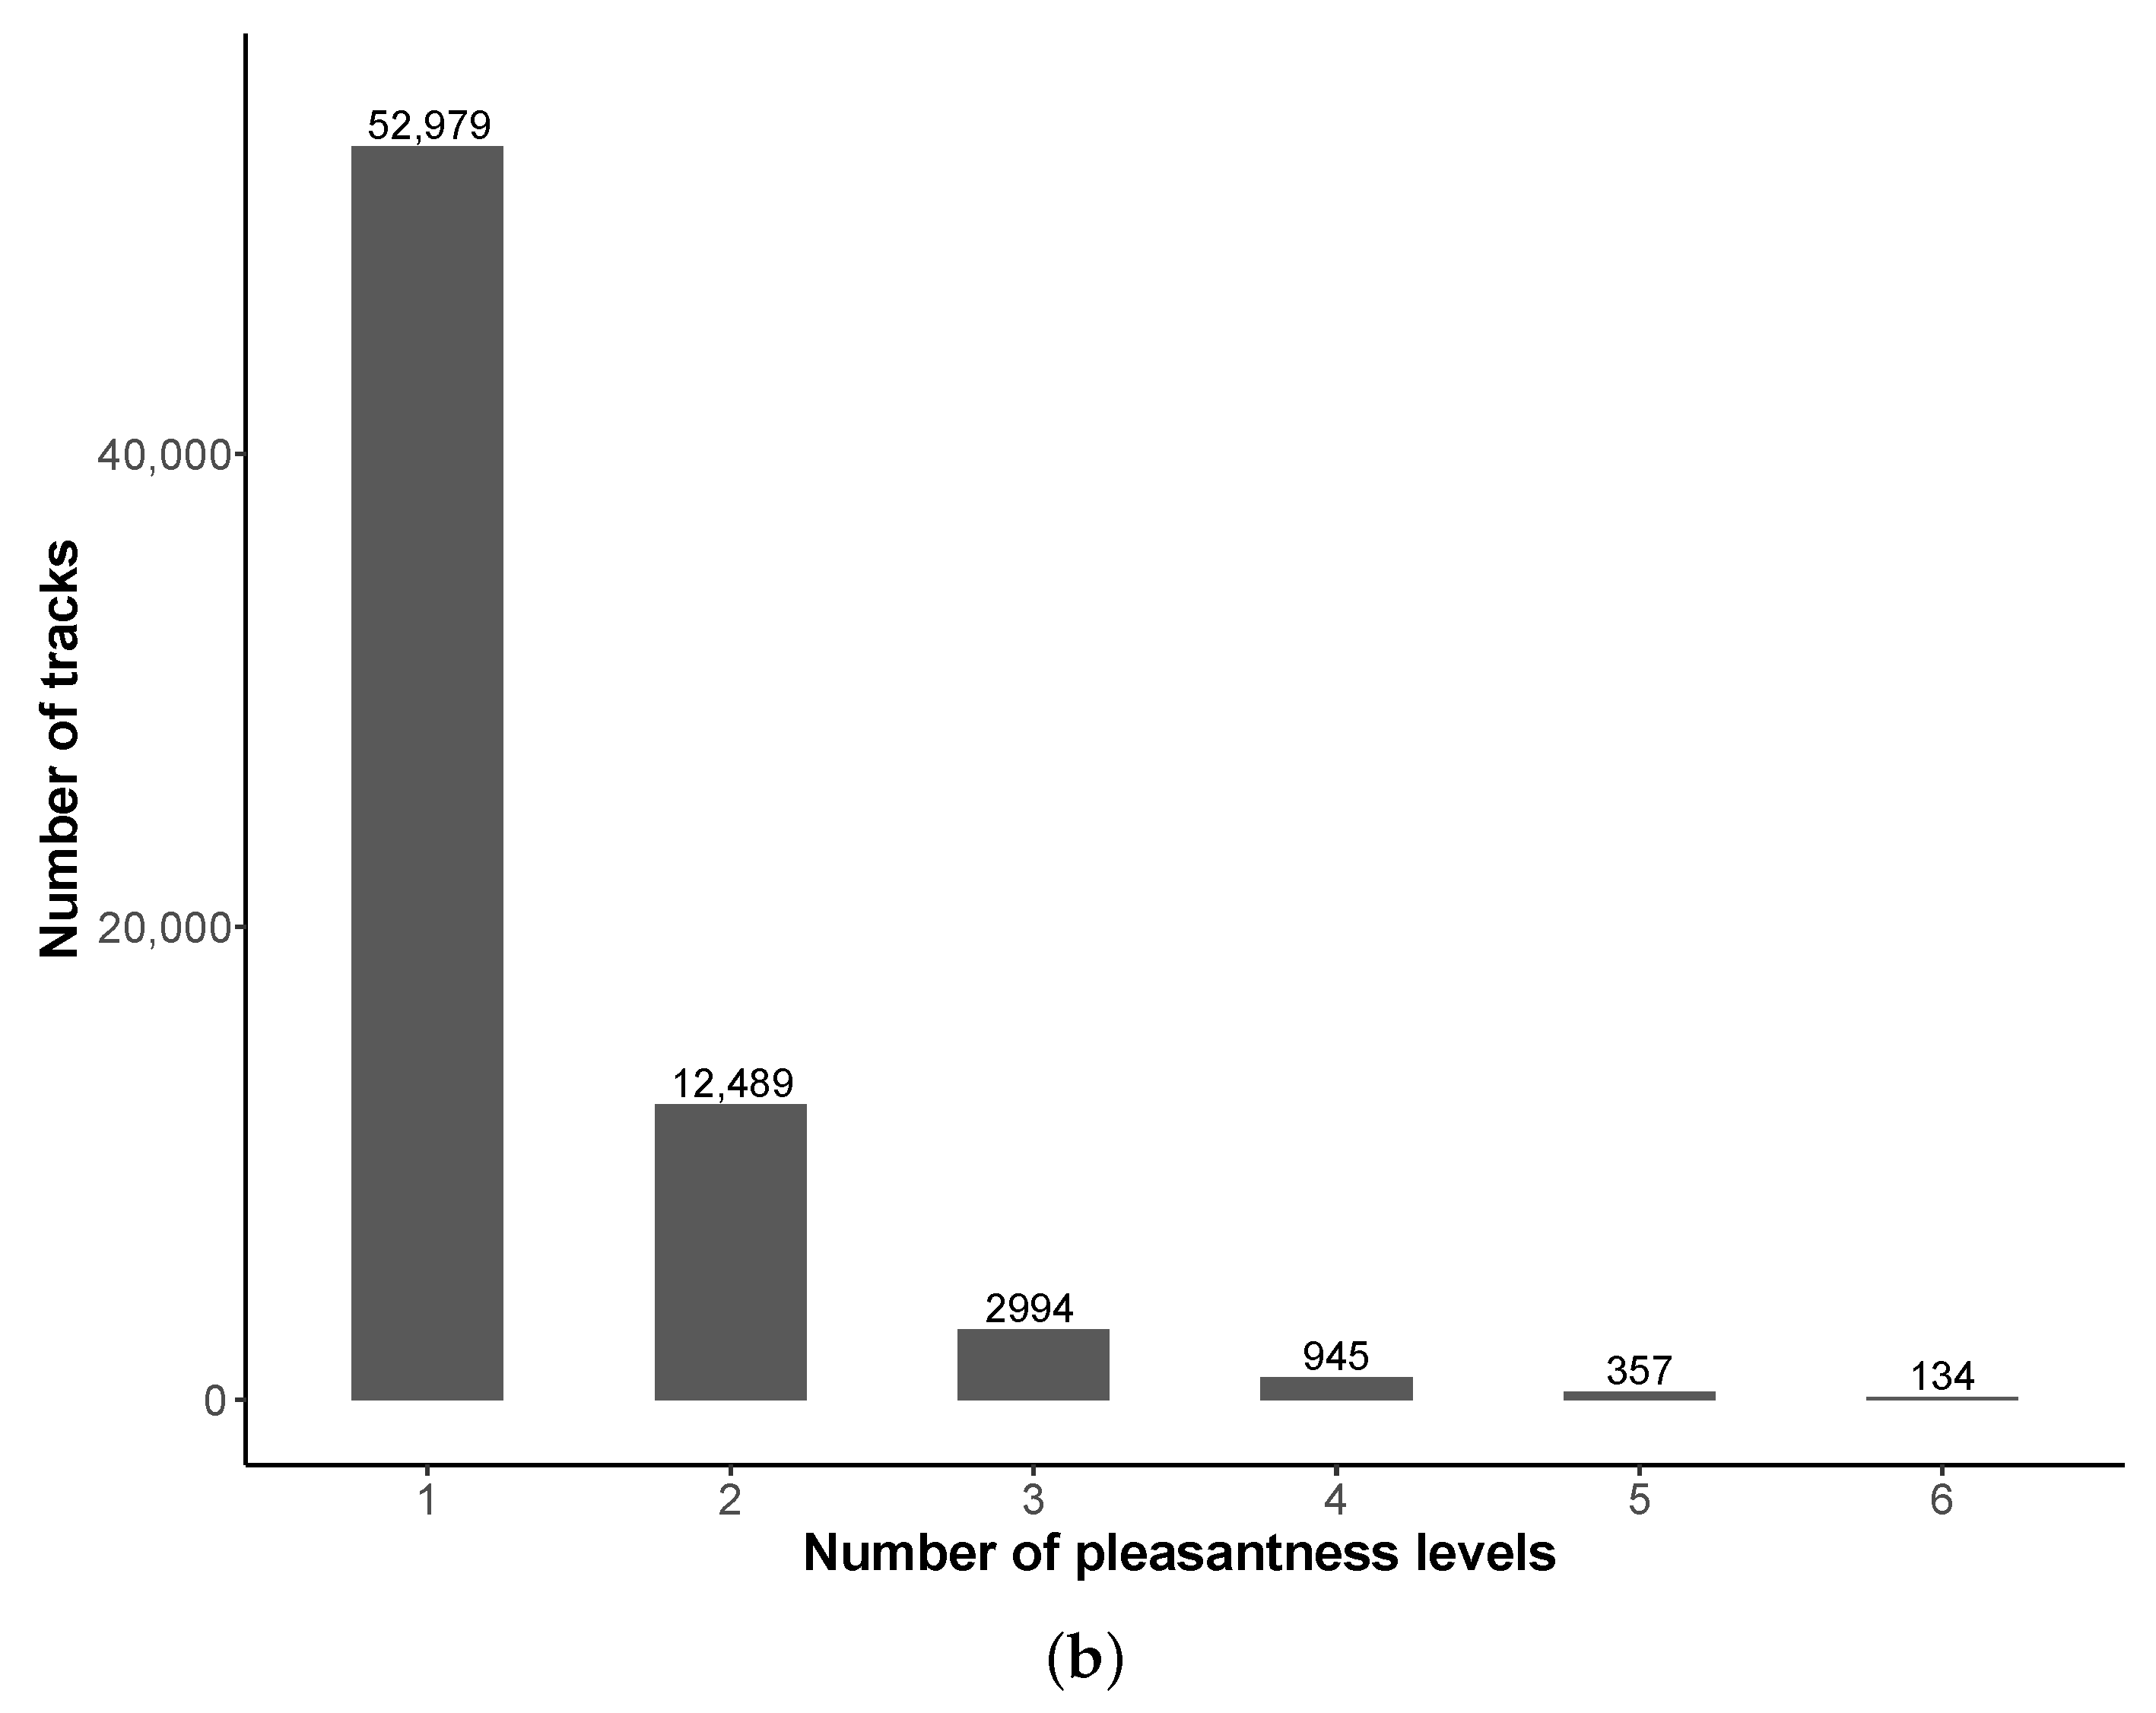
Figure 13.
User evaluation of pleasantness on a track: (a) Distribution of pleasantness values on tracks. (b) Distribution of number of pleasantness levels used by contributors.
Figure 13.
User evaluation of pleasantness on a track: (a) Distribution of pleasantness values on tracks. (b) Distribution of number of pleasantness levels used by contributors.
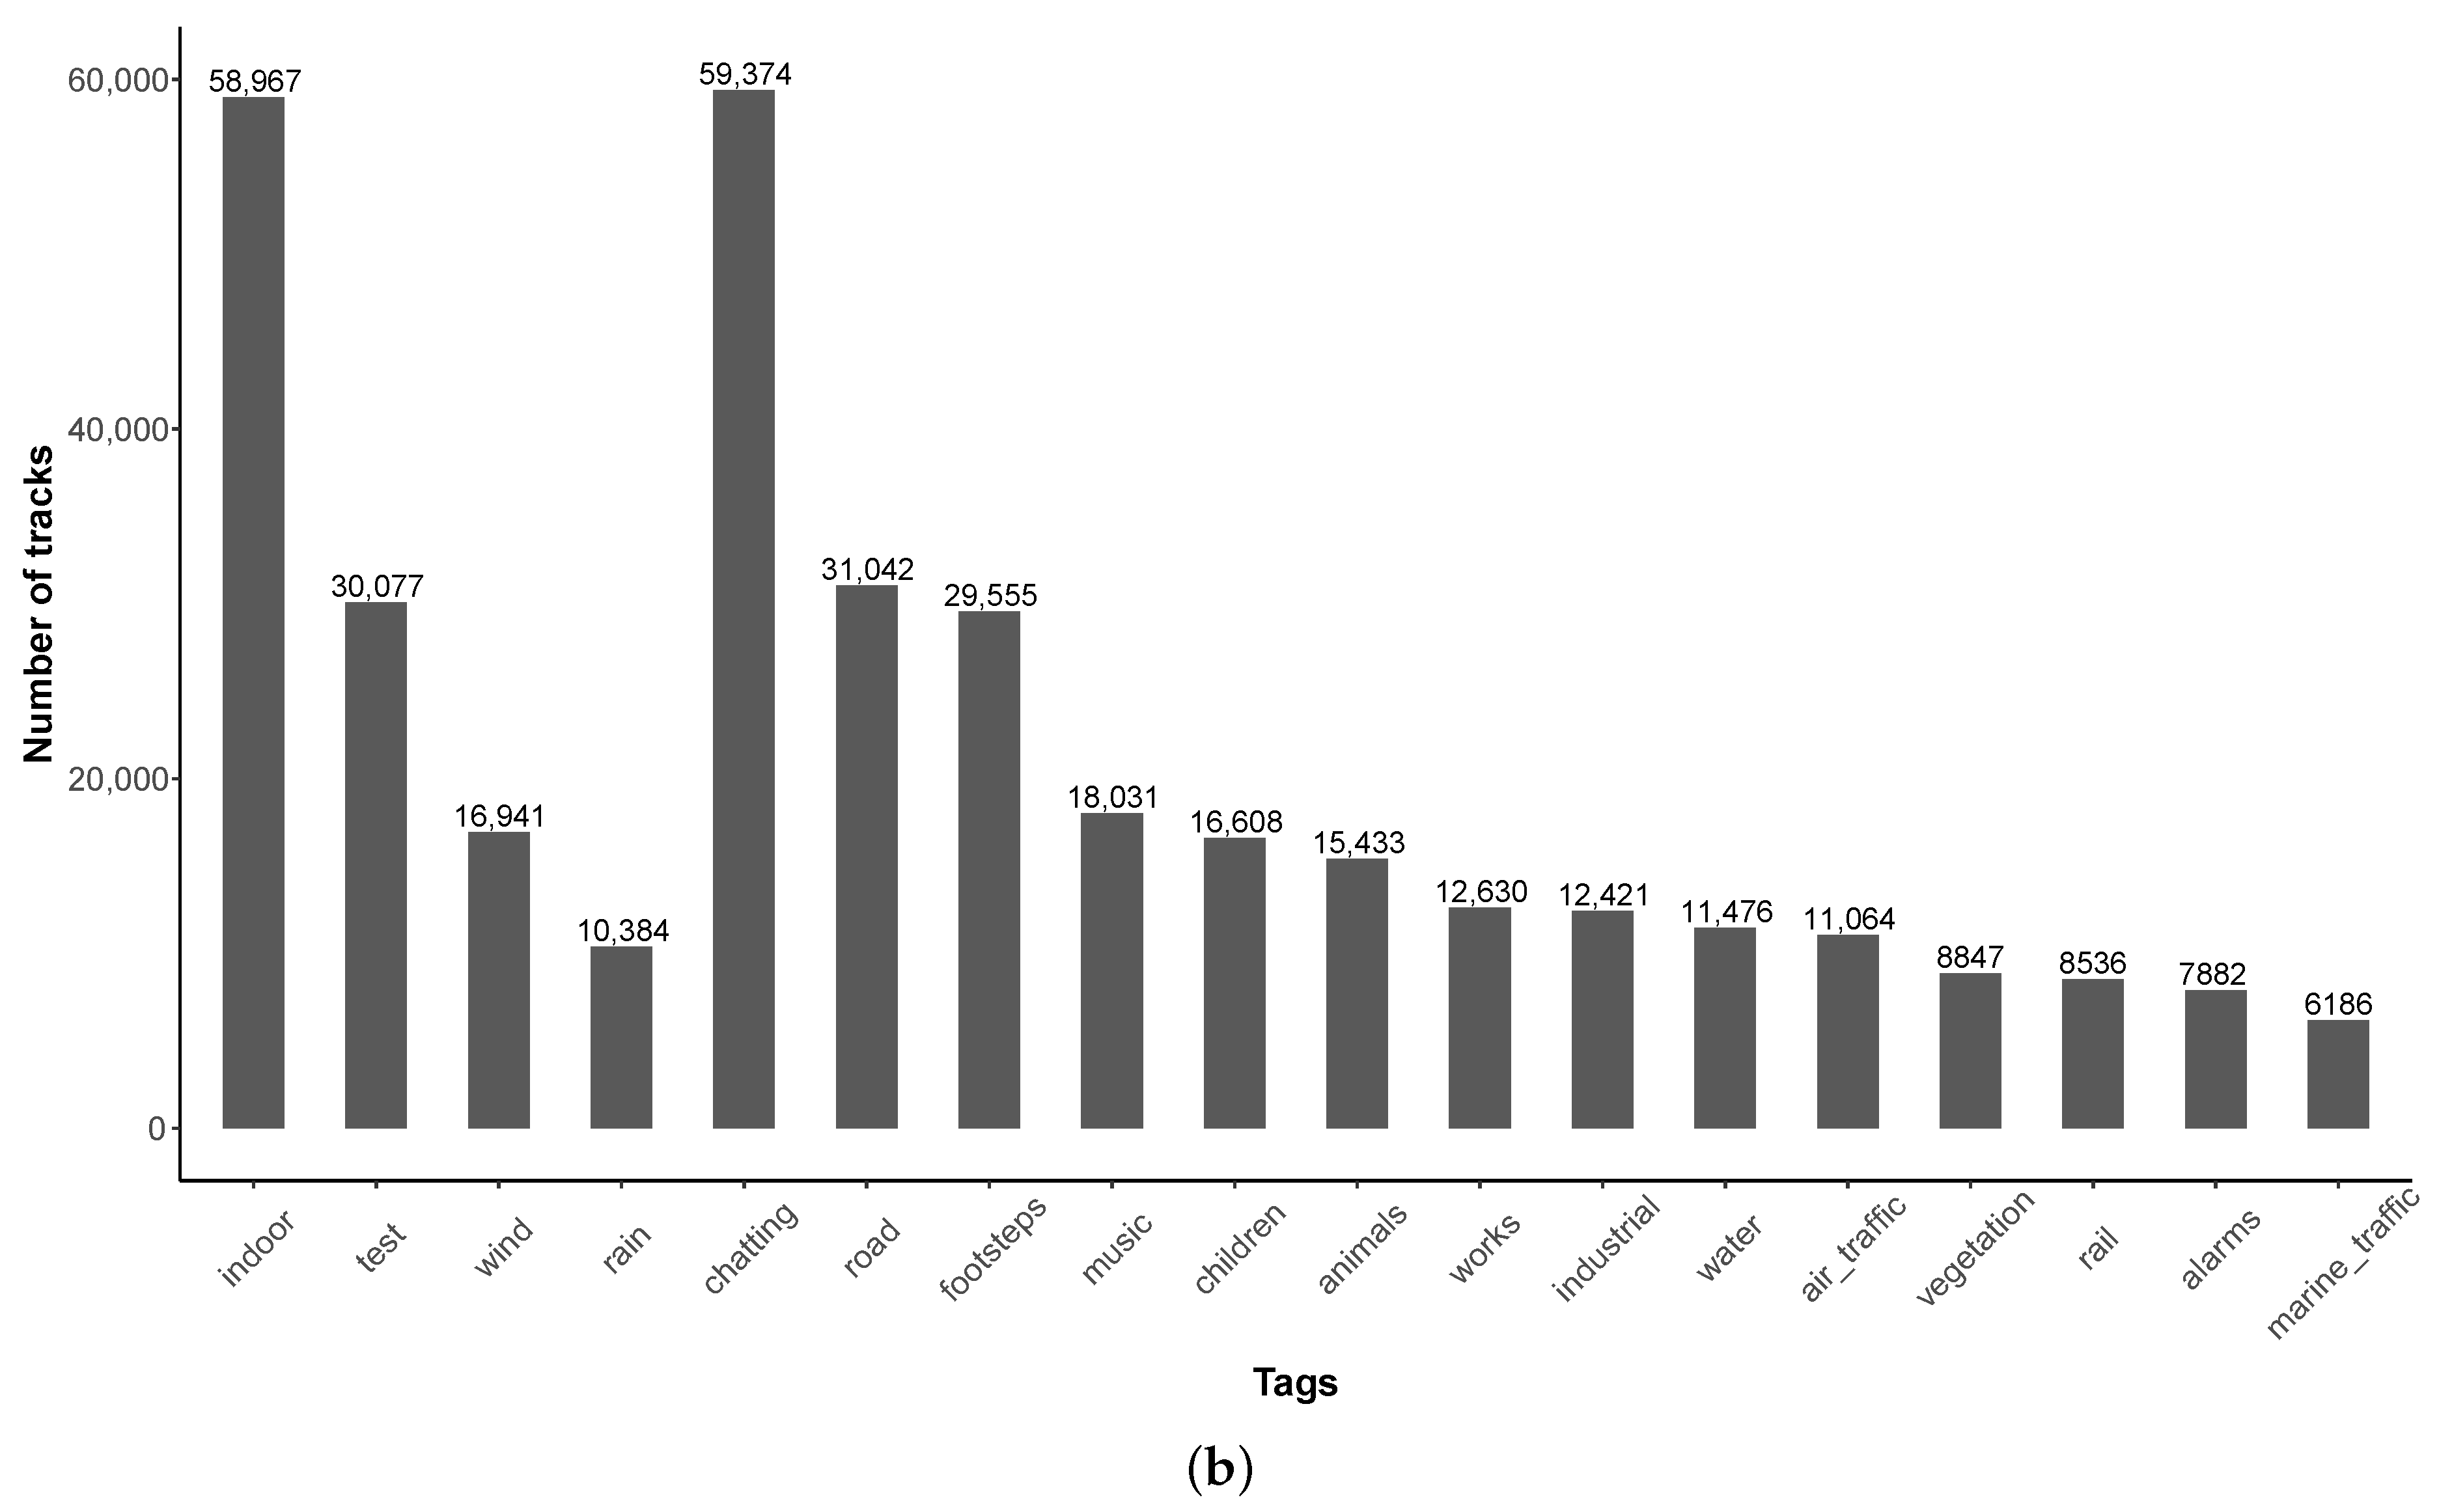
Figure 14.
Use of soundscape tags by contributors. (a) Number of tags simultaneously used in a track. (b) Tags name.
Figure 14.
Use of soundscape tags by contributors. (a) Number of tags simultaneously used in a track. (b) Tags name.
Figure 15.
Distribution of noise levels (a) on the 260,422 tracks and (b) on the 59,685,328 points.
Figure 15.
Distribution of noise levels (a) on the 260,422 tracks and (b) on the 59,685,328 points.
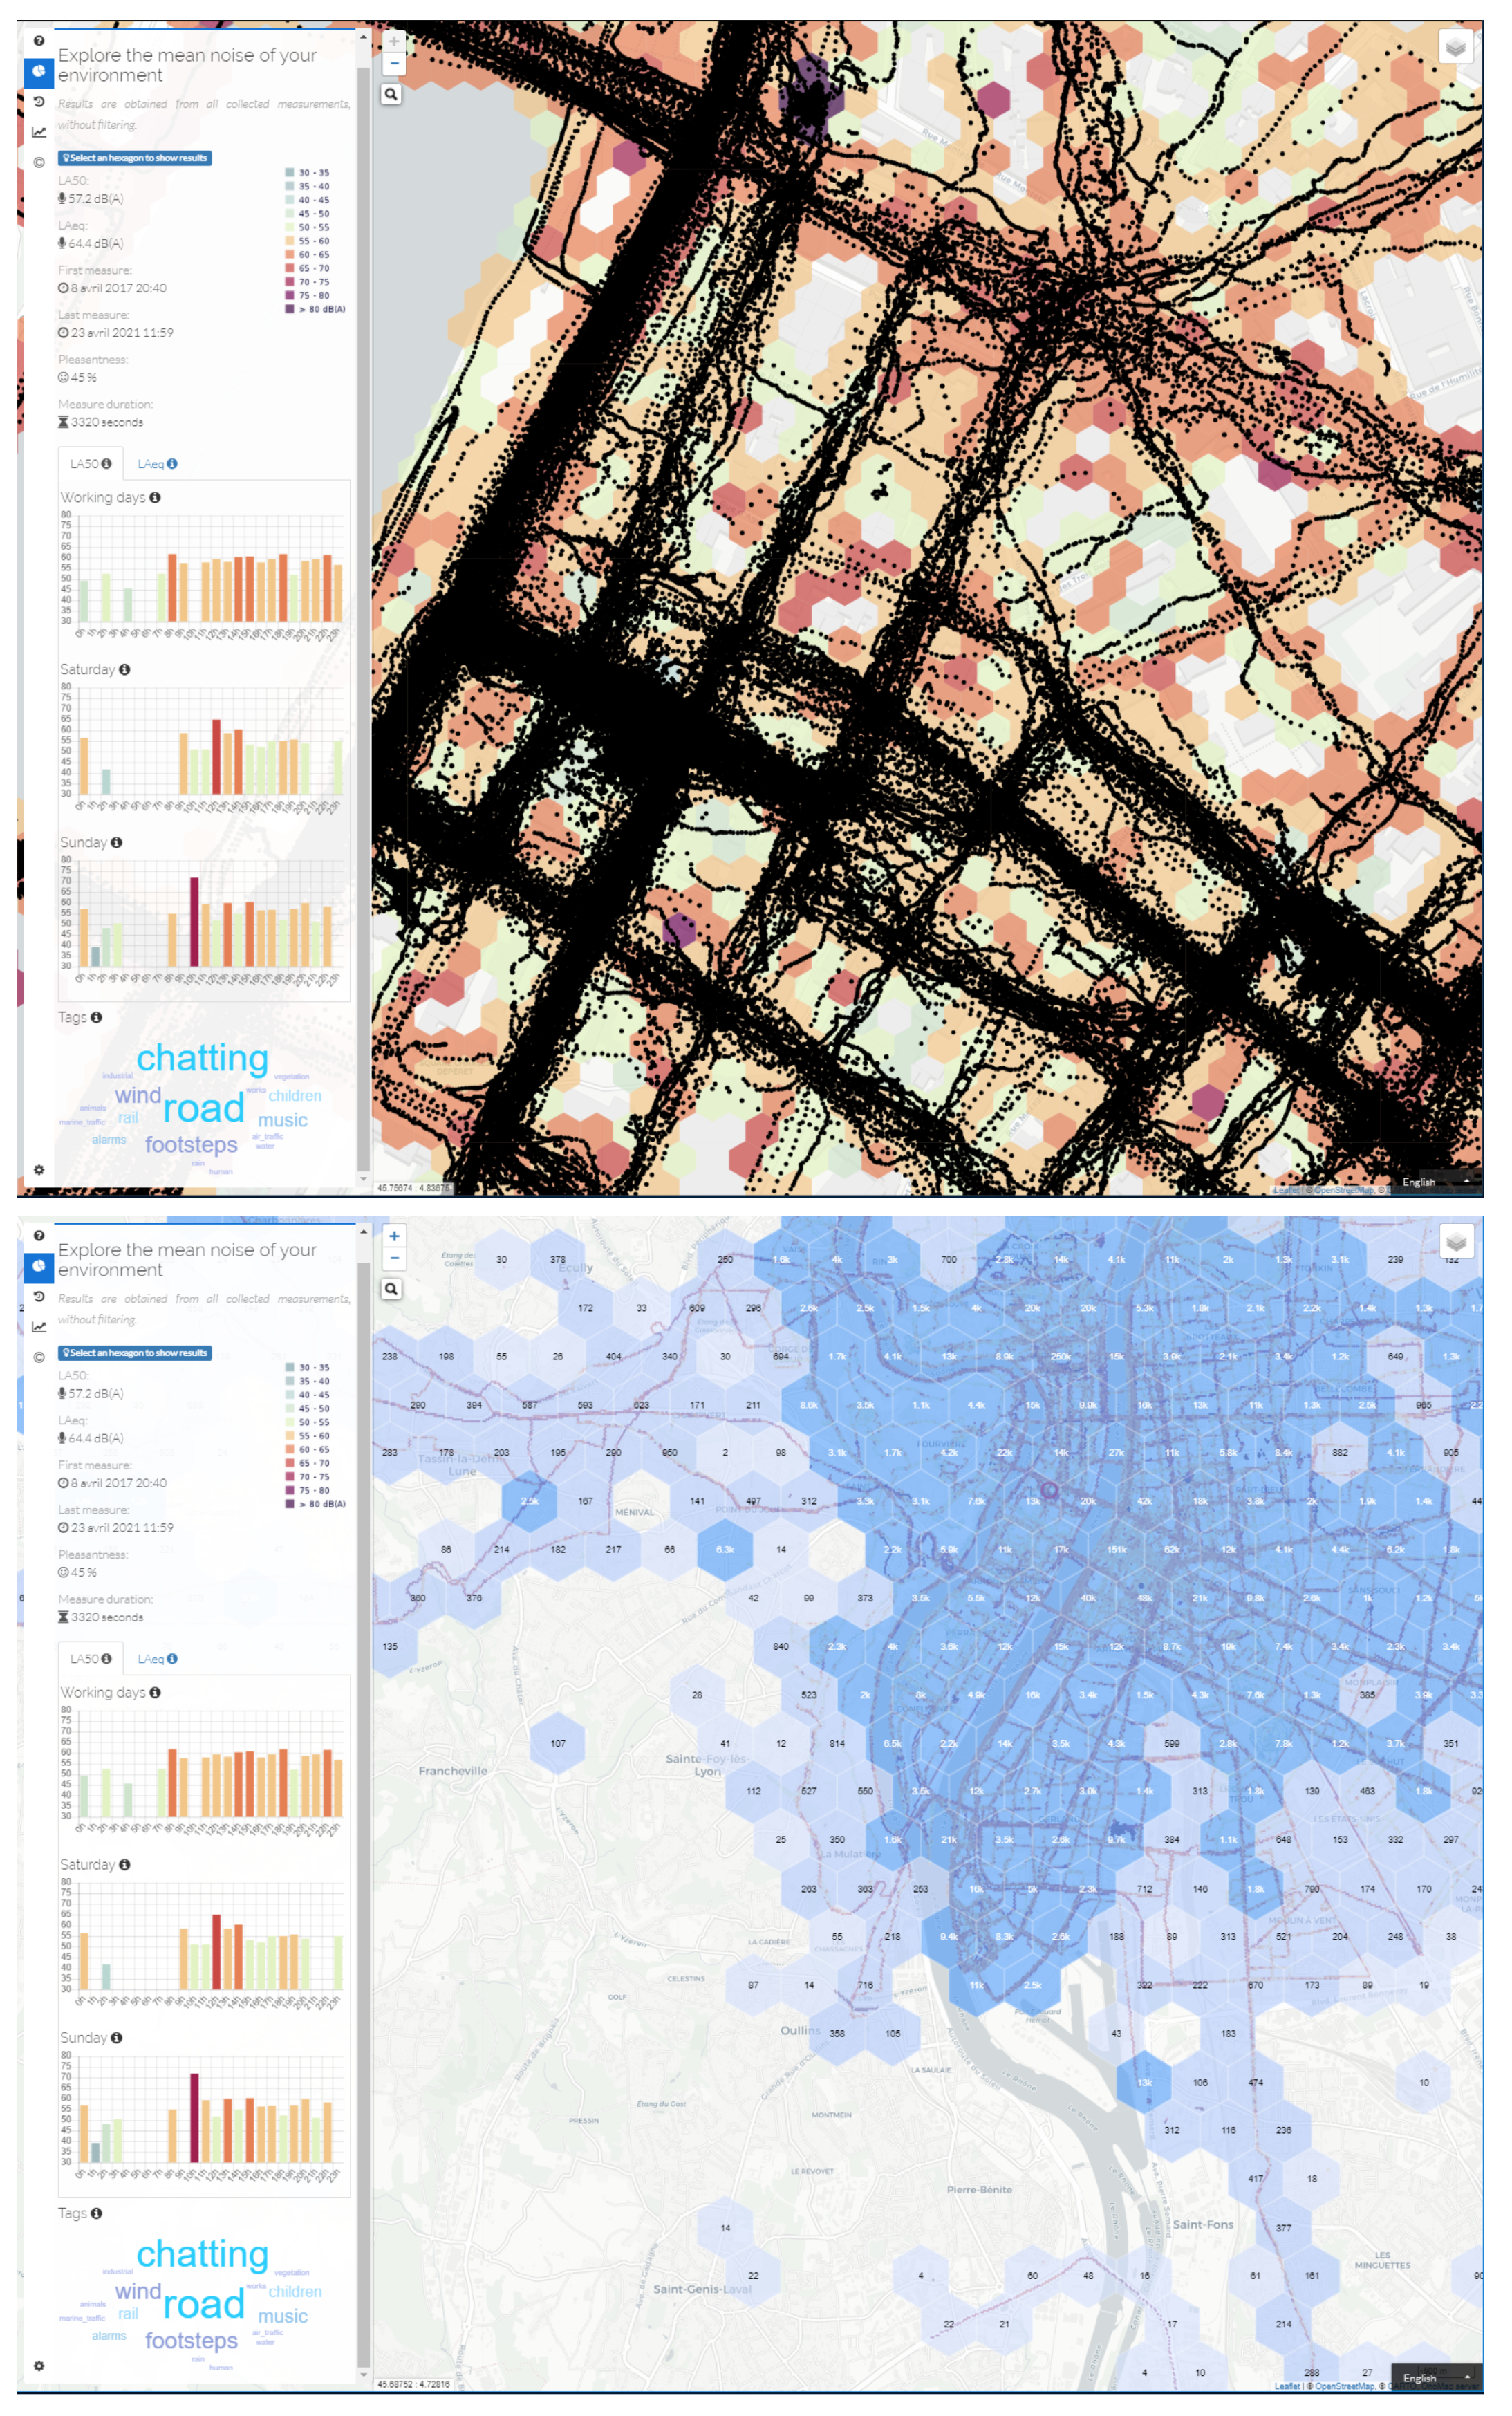
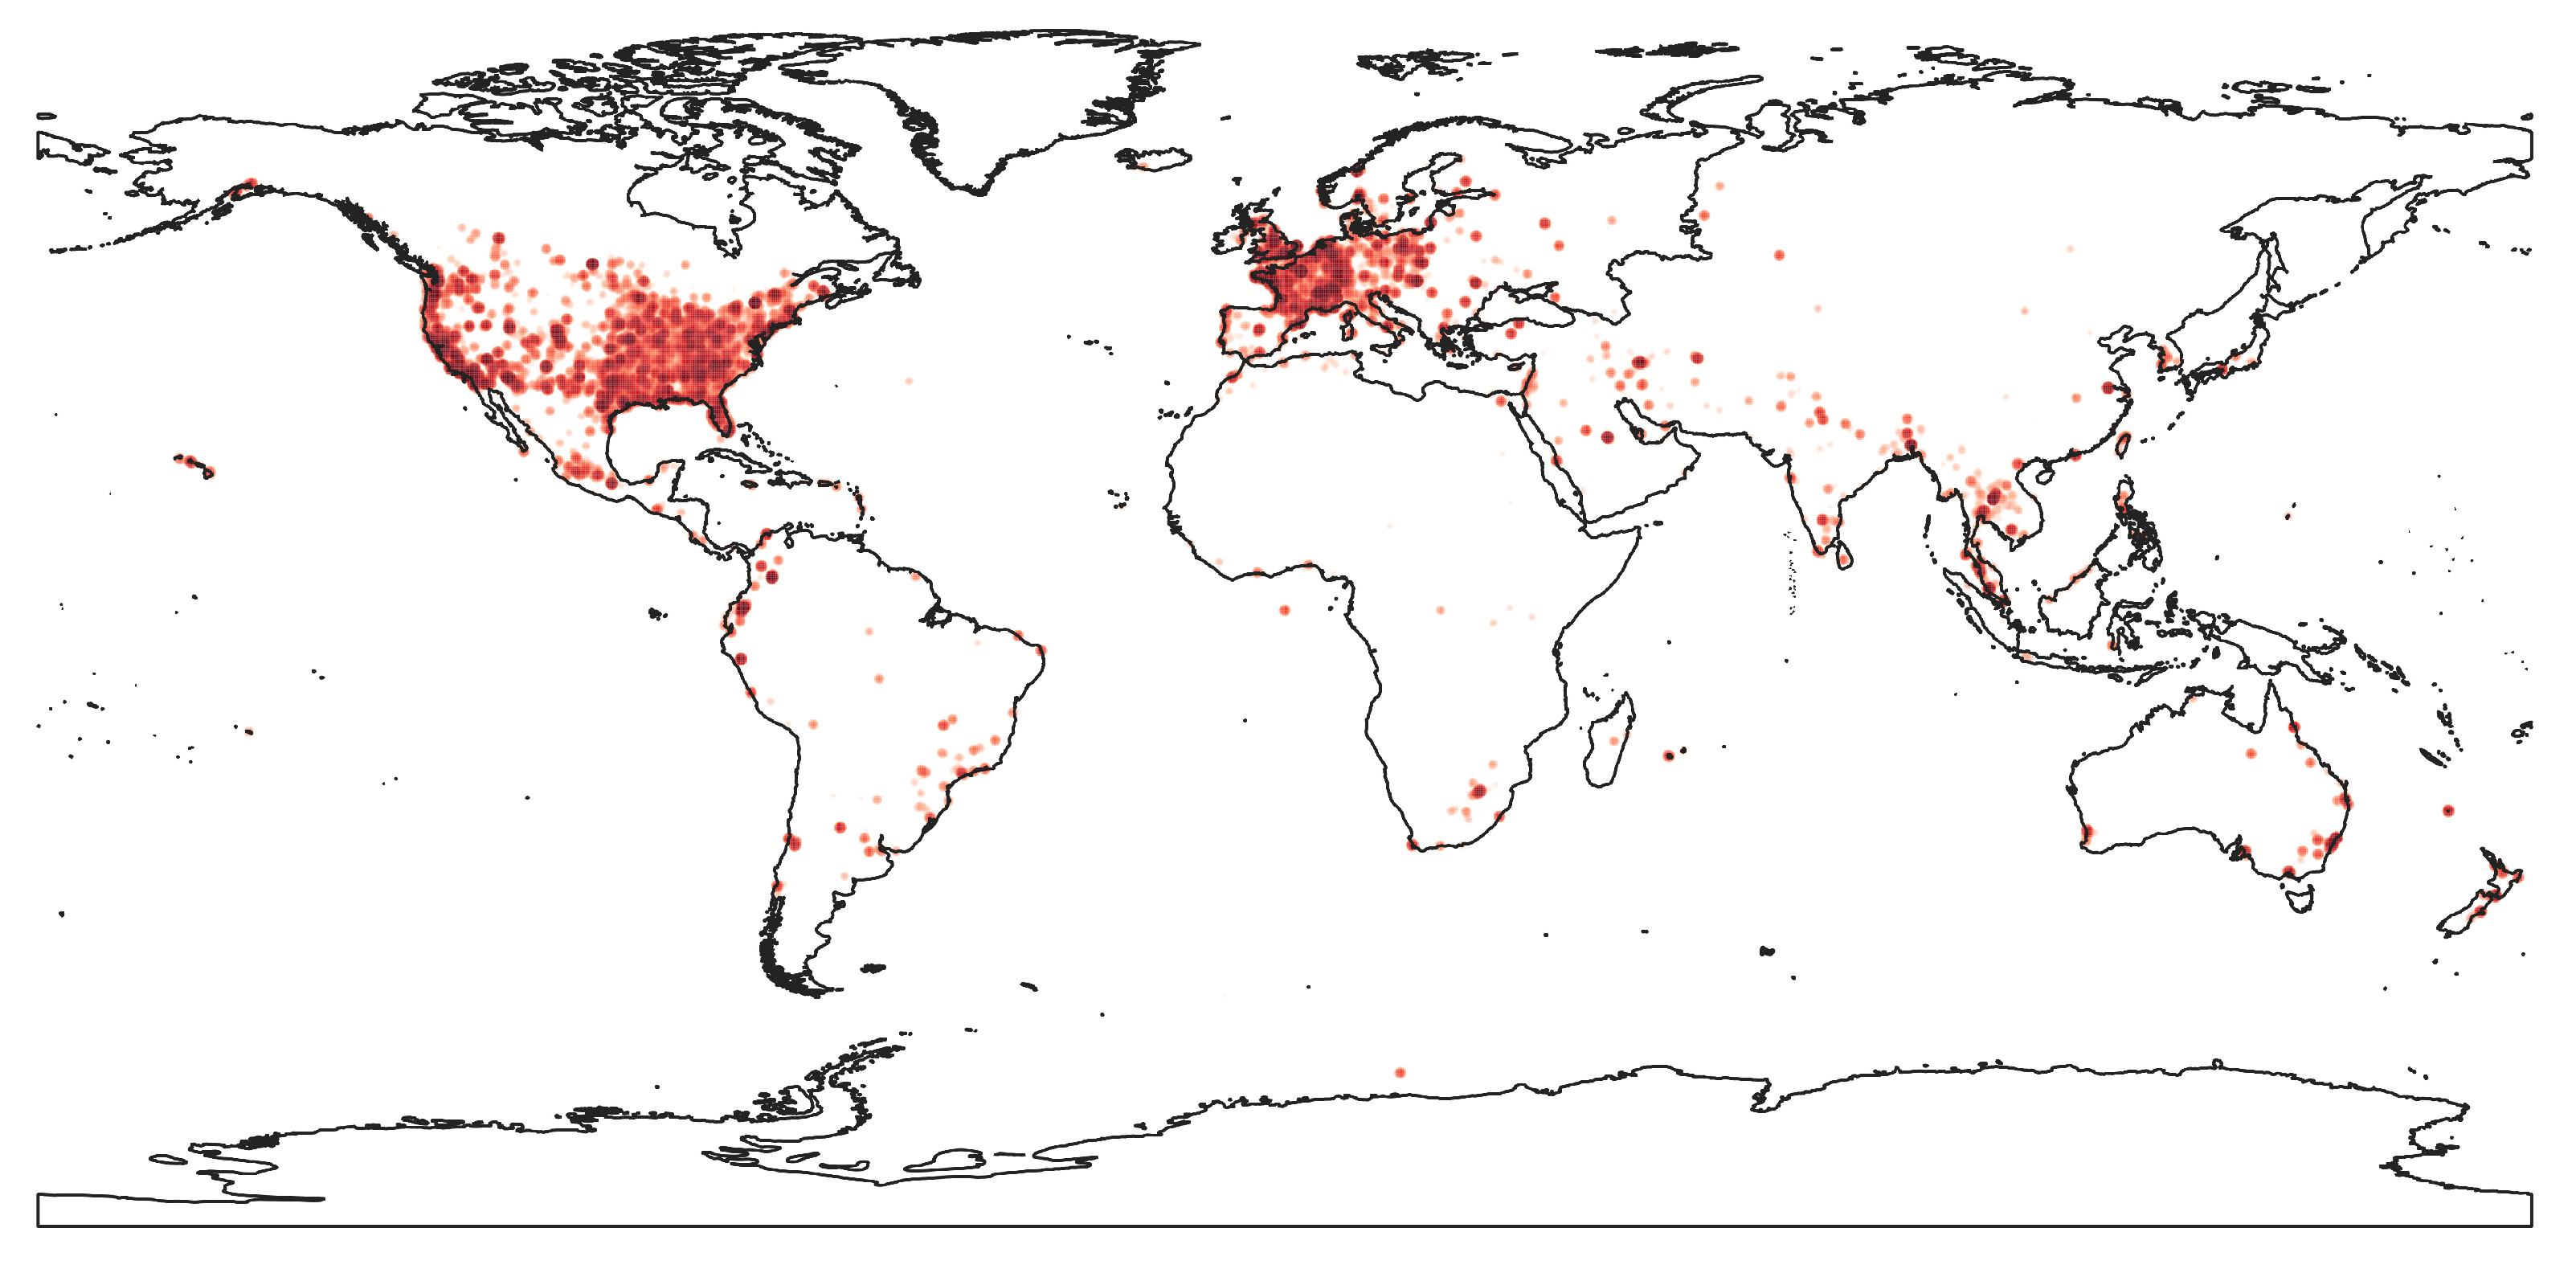
Figure 16.
‘Heatmap’ representation of the NoiseCapture data collected around the world.
Figure 16.
‘Heatmap’ representation of the NoiseCapture data collected around the world.
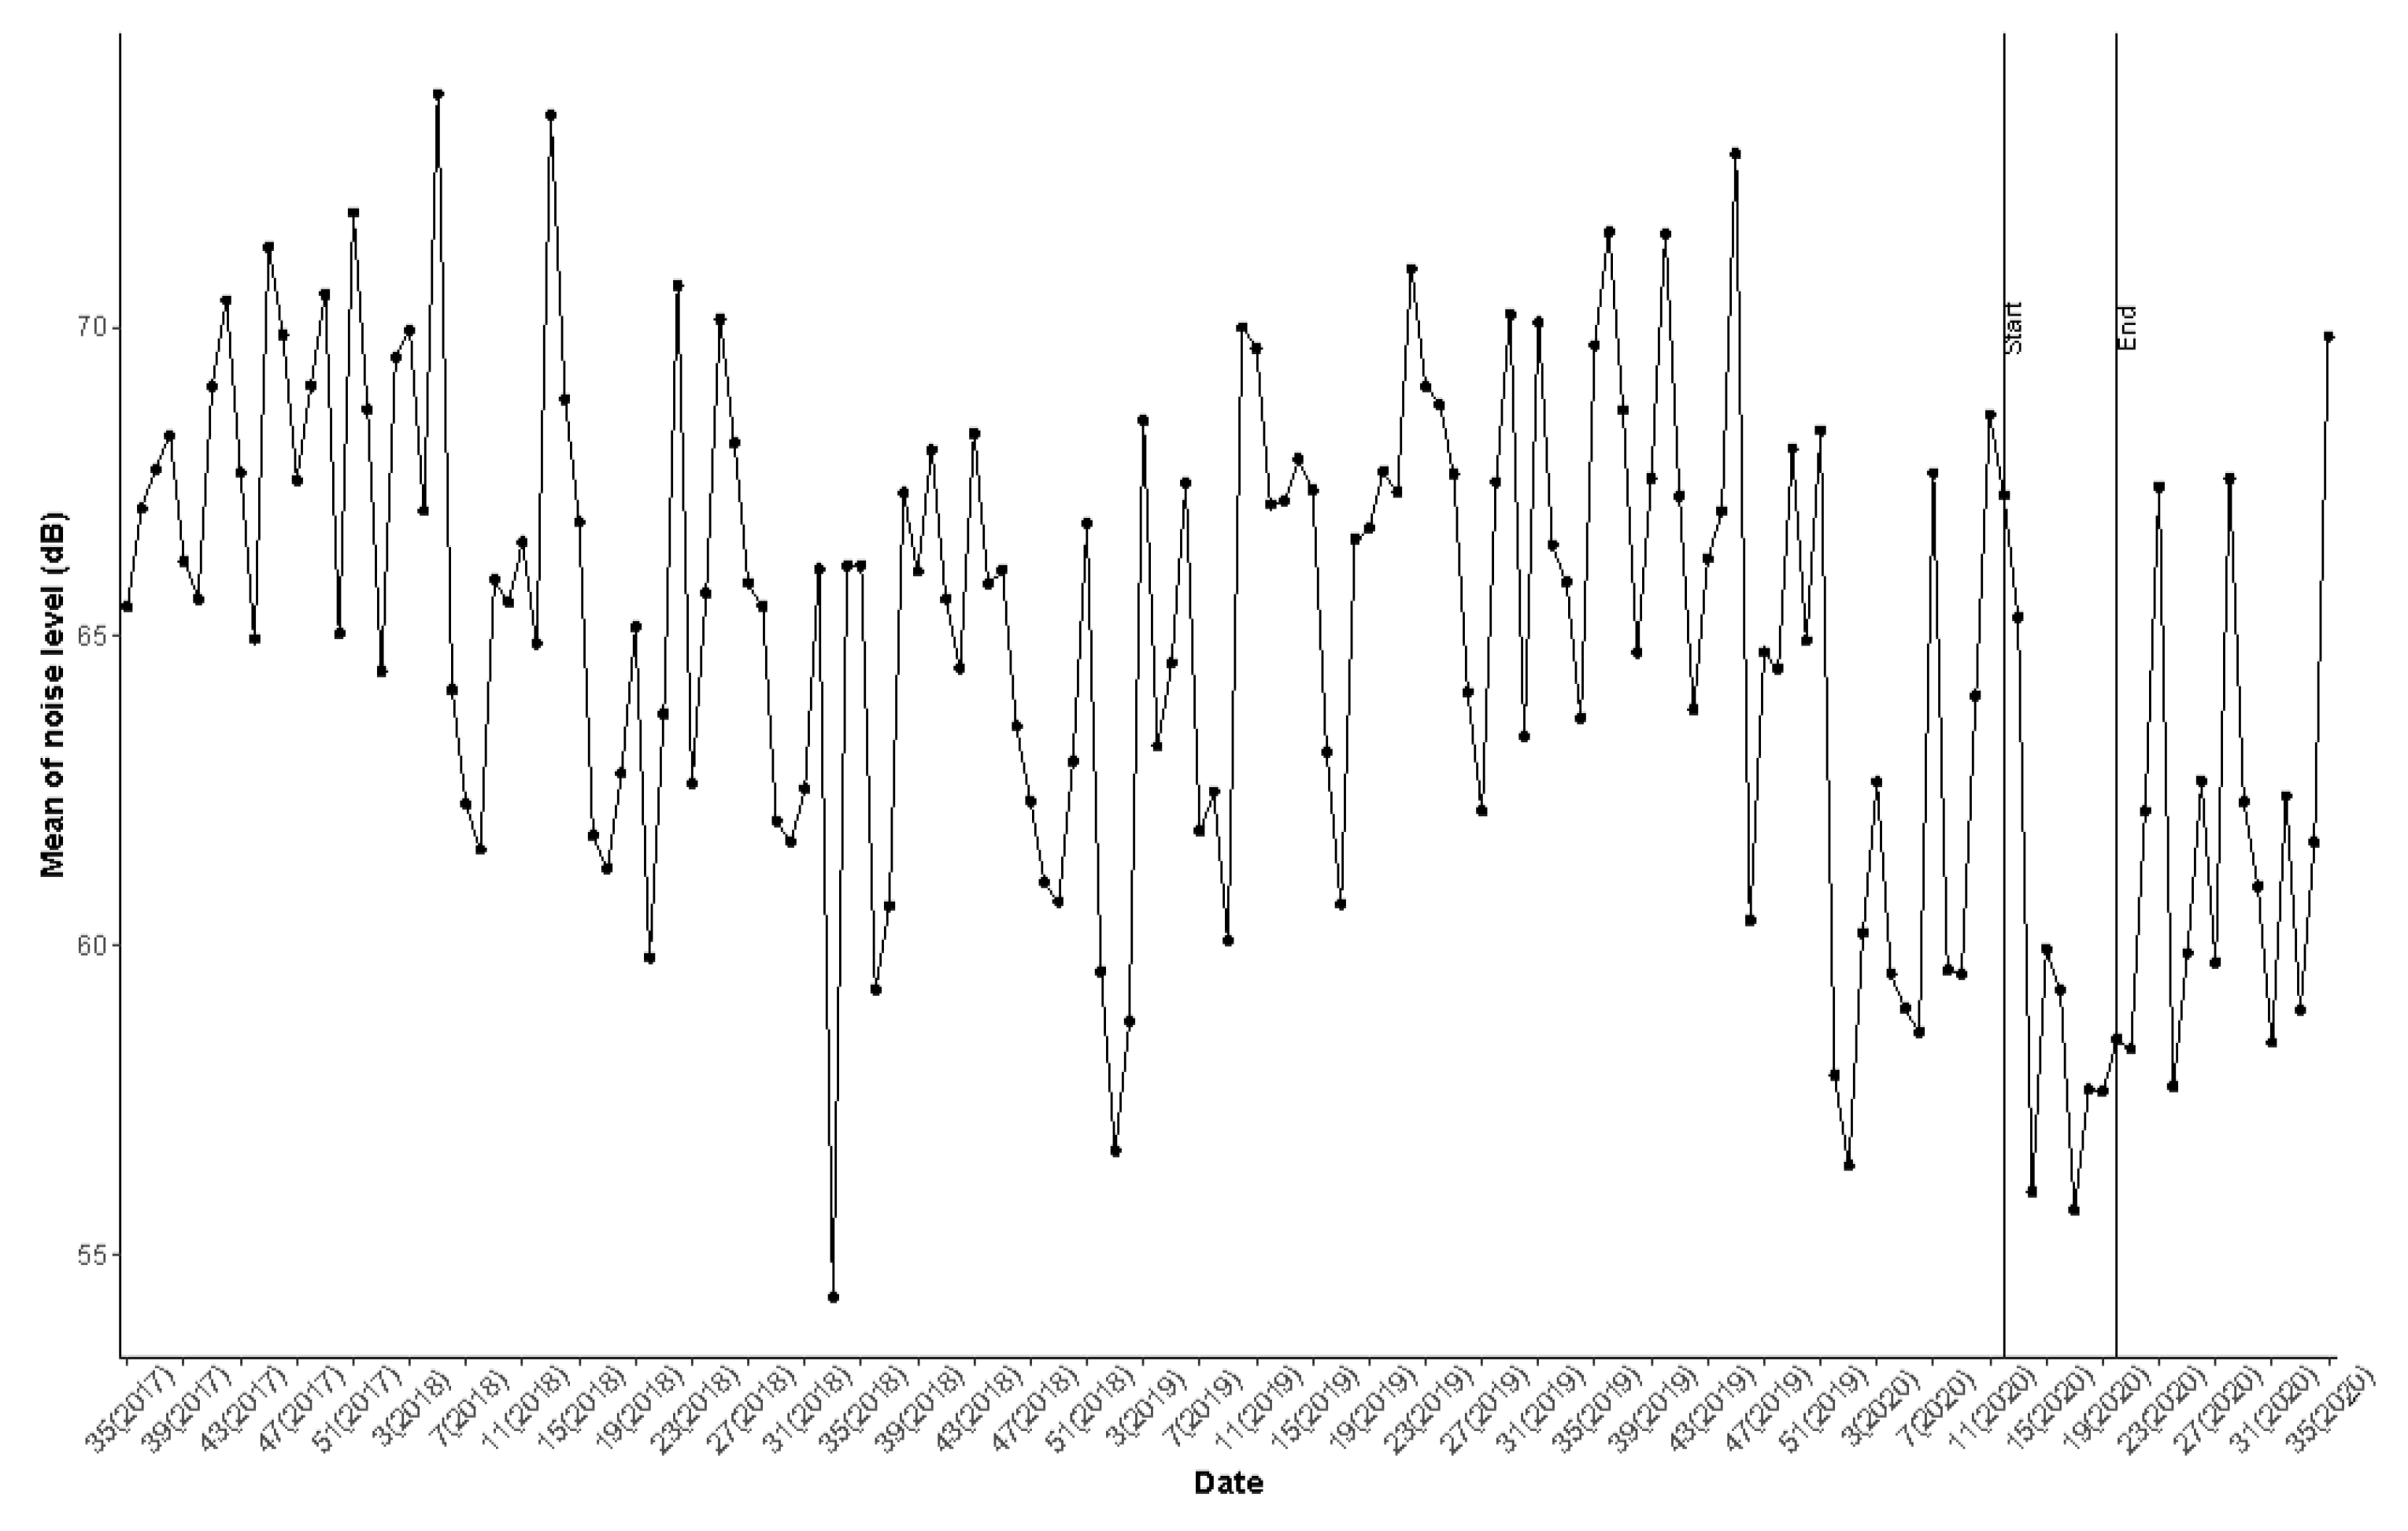
Figure 17.
Distribution of mean ‘noise_level’ in France by week accompanied with 2 verticals lines that represent the start and end of the first lockdown.
Figure 17.
Distribution of mean ‘noise_level’ in France by week accompanied with 2 verticals lines that represent the start and end of the first lockdown.
Table 1.
NoiseCapture application releases. Each new version, defined by a version release (for example ‘51’) and a version number (for example ‘1.2.15’) proposes changes (bug corrections, user interface enhancement, etc.). The reader can refer to the detailed list of fixes in each (pre-)release from the GitHub source code management platform [
27]. The changes made on the data export, from the smartphone to the data server (adding new data, patches, etc.), are detailed in the history of the source code file
MeasurementExport.java [
28]. The date of publication of the application on Google Play is also provided for information (corresponding official public release are indicated in bold with symbol *).
| Release (Number) | Source Code Publication | STATUS | Application Publication | Comments |
|---|
| 51 * (1.2.15) | 3 July 2020 | Release | 7 July 2020 | Fix automated measurement upload |
| 49 (1.2.13) | 17 February 2020 | Pre-release | | Add calibration method using road traffic |
| | | | | Add ‘calibration_method’ |
| 45 * (1.2.9) | 27 March 2019 | Release | 26 March 2019 | Calibration in instead of |
| 43 * (1.2.7) | 16 November 2018 | Release | 16 November 2018 | Minor changes |
| 35 * (1.1.3) | | Release | 20 April 2018 | Minor changes |
| 34 * (1.1.2) | | Release | 29 January 2018 | Minor changes |
| 33 * (1.1.0) | 23 November 2017 | Pre-release | 24 November 2017 | Ability to use a calibrated sMarchtphone |
| | | | | to automatically calibrate other sMarchtphone(s) |
| 32 * (1.0.4) | | Release | 6 November 2017 | Minor changes |
| 31 * (1.0.3) | | Release | 6 October 2017 | Minor changes |
| 30 (1.0.2) | 18 September 2017 | Pre-release | | Add NoiseCapture Party functionalities |
| 29 * (1.0.1) | | Release | 31 August 2017 | Minor changes |
| 28 * (1.0.0) | 23 August 2017 | Release | 29 August 2017 | Official first release |
| | | | | Add ‘user_profile’ |
Table 2.
Distribution of collected data per release, from 29 August 2017 to 28 August 2020. The number of collected data during NoiseCapture Parties (see
Section 3.6) is also indicated, as well as in terms of percentage of the total number of data. Releases in bold with symbol * correspond to public releases on Google Play. Note that the total number of contributors in this table (74,082) does not correspond to the total of unique contributors, as a contributor may have use several release of the application.
| Release | Contributors | Tracks | Points |
|---|
| Total | Party | Total | Party | Total | Party |
|---|
| 28 * | 26 | – | 354 | – | 46,268 | – |
| 29 * | 2705 | – | 8991 | – | 1,588,156 | – |
| 30 | 35 | 7 (20.0%) | 416 | 133 (32.0%) | 140,627 | 11,523 (8.2%) |
| 31 * | 1432 | 2 (0.1%) | 4426 | 6 (0.1%) | 957,920 | 770 (0.1%) |
| 32 * | 1553 | 3 (0.1%) | 4746 | 9 (0.2%) | 847,093 | 1556 (0.2%) |
| 33 * | 5442 | 4 (0.1%) | 19,225 | 52 (0.3%) | 3,530,349 | 8819 (0.2%) |
| 34 * | 9053 | 13 (0.1%) | 28,607 | 67 (0.2%) | 6,121,154 | 18,793 (0.3%) |
| 35 * | 15,734 | 67 (0.4%) | 68,911 | 921 (1.3%) | 12,465,115 | 117,797 (0.9%) |
| 36 | 4 | – | 6 | – | 1861 | – |
| 37 | 11 | – | 55 | – | 20,732 | – |
| 38 | 3 | – | 7 | – | 1774 | – |
| 39 | 2 | – | 2 | – | 108 | – |
| 40 | 1 | – | 1 | – | 2 | – |
| 41 | 1 | – | 1 | – | 97 | – |
| 42 | 1 | – | 1 | – | 10 | – |
| 43 * | 11,169 | 82 (0.7%) | 37,960 | 643 (1.7%) | 9,309,934 | 89,794 (1.0%) |
| 44 | 6 | – | 33 | – | 4276 | – |
| 45 * | 23,331 | 183 (0.8%) | 67,765 | 1306 (1.9%) | 18,629,005 | 142,168 (0.8%) |
| 46 | 3 | – | 7 | – | 5030 | – |
| 47 | 4 | 1 (25.0%) | 6 | 1 (16.6%) | 21,101 | 134 (0.6%) |
| 48 | 3 | – | 12 | – | 8597 | – |
| 49 | 25 | – | 233 | – | 235,882 | – |
| 50 | 4 | – | 4 | 0 0.0%) | 146 | – |
| 51 * | 3534 | 2 (0.1%) | 18,653 | 4 (0.02%) | 5,750,091 | 221 (0.003%) |
| Total | 74,082 | 364 (0.5%) | 260,422 | 3142 (1.2%) | 59,685,328 | 391,575 (0.6%) |
Table 3.
Collected device information for the Samsung Galaxy A10 Android phone, as well as, the count of corresponding phones in the NoiseCapture database.
Table 3.
Collected device information for the Samsung Galaxy A10 Android phone, as well as, the count of corresponding phones in the NoiseCapture database.
| ‘device_model’ | ‘device_product’ | ‘device_manufacturer’ | Count |
|---|
| SM-A102N | a10ekx | samsung | 1 |
| SM-A102U | a10esq | samsung | 880 |
| SM-A102U1 | a10eue | samsung | 1 |
| SM-A102W | a10ecs | samsung | 4 |
| SM-A105F | a10dd | samsung | 53 |
| SM-A105FN | a10eea | samsung | 176 |
| SM-A105G | a10dx | samsung | 31 |
| SM-A105M | a10ub | samsung | 97 |
| SM-A107F | a10sxx | samsung | 508 |
| SM-A107M | a10sub | samsung | 23 |
Table 4.
Top 15 of smartphone manufacturers (‘device_manufacturer’, case insensitive) in the NoiseCapture database. The number of corresponding distinct device models (‘device_model’), the number of tracks, as well as the cumulative number of tracks are also given. Note that this table do not regroup data from the same manufacturer but with a different writing (upper/lower case, as for ‘Samsung’ and ‘samsung’).
| Rank | Device_MANUFACTURER | Nb of Models | Nb of Tracks | % | Cumul. Nb of Tracks | % |
|---|
| 1 | samsung | 1032 | 101,420 | 38.9% | 101,420 | 38.9% |
| 2 | LGE | 383 | 36,288 | 13.9% | 137,708 | 52.9% |
| 3 | HUAWEI | 454 | 31,937 | 12.2% | 169,645 | 65.1% |
| 4 | motorola | 126 | 17,822 | 6.8% | 187,467 | 71.9% |
| 5 | ZTE | 171 | 12,840 | 4.9% | 200,307 | 76.9% |
| 6 | Xiaomi | 106 | 6334 | 2.4% | 206,641 | 79.3% |
| 7 | TCL | 191 | 5180 | 2.0% | 211,821 | 81.3% |
| 8 | Sony | 167 | 5116 | 2.0% | 216,937 | 83.3% |
| 9 | OPPO | 91 | 3742 | 1.4% | 220,679 | 84.7% |
| 10 | WIKO | 73 | 3223 | 1.2% | 223,902 | 86.0% |
| 11 | asus | 115 | 2870 | 1.1% | 226,772 | 87.1% |
| 12 | HTC | 130 | 2406 | 0.9% | 229,178 | 88.0% |
| 13 | HMD Global | 41 | 2208 | 0.8% | 231,386 | 88.8% |
| 14 | LENOVO | 108 | 1881 | 0.7% | 235,065 | 89.6% |
| 15 | OnePlus | 32 | 1798 | 0.7% | 235,065 | 90.3% |
Table 5.
Top 5 of smartphone model (‘device_model’) in the NoiseCapture database.
Table 5.
Top 5 of smartphone model (‘device_model’) in the NoiseCapture database.
| Rank | Device_MODEL | ‘Device_MANUFACTURER’ | Nb of Tracks | % | Cumulative Nb of Tracks | % |
|---|
| 1 | ANE-LX3 | samsung | 4729 | 1.8% | 4729 | 1.8% |
| 2 | SM-G930F | samsung | 3722 | 1.4% | 8451 | 3.2% |
| 3 | LM-X210(G) | LGE | 3479 | 1.3% | 11,930 | 4.6% |
| 4 | SM-A520F | samsung | 3205 | 1.2% | 15,135 | 5.8% |
| 5 | Z982 | ZTE | 2890 | 1.1% | 18,025 | 6.9% |
| 6 | SM-G935F | samsung | 2854 | 1.1% | 20,879 | 8.0% |
| 7 | Moto E (4) | motorola | 2748 | 1.0% | 23,627 | 9.1% |
| 8 | SM-N950U | samsung | 2384 | 0.9% | 26,011 | 9.9% |
| 9 | moto e5 play | motorola | 2361 | 0.9% | 28,372 | 10.9% |
| 10 | SM-G950F | samsung | 2301 | 0.9% | 30,673 | 11.8% |
| 11 | SM-J327T1 | samsung | 2297 | 0.9% | 32,970 | 12.6% |
| 12 | LGMP260 | LGE | 2213 | 0.8% | 35,183 | 13.5% |
| 13 | SM-S327VL | samsung | 2200 | 0.8% | 37,383 | 14.3% |
| 14 | VTR-L09 | samsung | 2095 | 0.8% | 39,478 | 15.1% |
| 15 | SM-J727T1 | HUAWEI | 2048 | 0.8% | 41,526 | 15.9% |
Table 6.
Top 6 smartphone manufacturers (
‘device_manufacturer’, case-insensitive) for USA and France between August 2017 and August 2020. Top 6 manufacturers data are from Statcounter Global Stats website (licensed under a Creative Commons Attribution-Share Alike 3.0 Unported License) [
40].
Table 6.
Top 6 smartphone manufacturers (
‘device_manufacturer’, case-insensitive) for USA and France between August 2017 and August 2020. Top 6 manufacturers data are from Statcounter Global Stats website (licensed under a Creative Commons Attribution-Share Alike 3.0 Unported License) [
40].
| Country | Device_MANUFACTURER | Number of Tracks | % | Top 6 Manufacturer in Country |
|---|
| United States | samsung | 32,341 | 36.6% | IPhone |
| LGE | 23,668 | 26.8% | Samsung |
| motorola | 9257 | 10.5% | LGE |
| ZTE | 8154 | 9.2% | Motorola |
| TCL | 2117 | 2.4% | Google |
| Alcatel | 1289 | 1.4% | ZTE |
| France | samsung | 12,899 | 46.2% | Samsung |
| HUAWEI | 4864 | 17.4% | IPhone |
| WIKO | 1731 | 6.2% | HUAWEI |
| Xiaomi | 1294 | 4.6% | Sony |
| Sony | 1254 | 4.5% | Xiaomi |
| motorola | 1093 | 3.9% | WIKO |
Table 7.
Distribution of the number of contributors in function of the number of track measurements. The number of corresponding points is also given.
Table 7.
Distribution of the number of contributors in function of the number of track measurements. The number of corresponding points is also given.
| Number of Tracks | Number of Contributors | % | Number of Points | % |
|---|
| 1 | 36,405 | 52.0% | 8,709,872 | 14.6% |
| 2–10 | 30,043 | 43.0% | 24,106,578 | 40.1% |
| 11–50 | 3063 | 4.4% | 14,779,033 | 24.7% |
| 51–100 | 236 | 0.3% | 3,915,310 | 6.5% |
| 101–1000 | 143 | 0.2% | 8,016,517 | 13.4% |
| >1000 | 8 | 0.1% | 158,018 | 0.7% |
| Total | 69,898 | | 59,685,328 | |
Table 8.
Distribution of the time length (in second) in function of the number of track measurements for tracks collected by user who had 1 contribution to the database.
Table 8.
Distribution of the time length (in second) in function of the number of track measurements for tracks collected by user who had 1 contribution to the database.
| Time Length | Number of Tracks | % |
|---|
| 1–20 | 14,034 | 38.5% |
| 21–60 | 9452 | 26.0% |
| 61–300 | 9242 | 25.4% |
| 301–600 | 1537 | 4.2% |
| 601–900 | 534 | 1.5% |
| 901–1200 | 315 | 0.8% |
| 1201–1800 | 368 | 1.0% |
| 1801–2400 | 213 | 0.6% |
| 2401–3000 | 111 | 0.3% |
| 3001–3600 | 103 | 0.3% |
| >3600 | 496 | 1.4% |
| Total | 36,405 | |
Table 9.
Duration between two successive measurements for users who have more than one contribution.
Table 9.
Duration between two successive measurements for users who have more than one contribution.
| Duration between 2 Successive Measurements (Day) | Number of Tracks | % |
|---|
| 0 | 158,631 | 83.3% |
| 1 | 7140 | 3.7% |
| 2–7 | 11,831 | 6.2% |
| 8–14 | 3911 | 2.0% |
| 14–21 | 1923 | 1.0% |
| 21–30 | 1450 | 0.8% |
| 31–60 | 2256 | 1.2% |
| 61–90 | 1063 | 0.6% |
| 91–180 | 1269 | 0.7% |
| 181–365 | 768 | 0.4% |
| >365 | 282 | 0.1% |
| Total | 188,794 | 100% |
Table 10.
Distribution of the collected data per country and ranking (first ranks are displayed in bold). Population per country (percentage of world population) data are from in [
43].
Table 10.
Distribution of the collected data per country and ranking (first ranks are displayed in bold). Population per country (percentage of world population) data are from in [
43].
| Country | Population (Rank) | Contributors (Rank) | Tracks (Rank) | Points (Rank) | Points/Track |
|---|
| China | 17.9% (1) | 58 (54) | 354 (43) | 158,797 (26) | 448.6 |
| India | 17.5% (2) | 894 (4) | 2241 (16) | 243,778 (22) | 108.9 |
| United States | 4.2% (3) | 29,108 (1) | 88,341 (1) | 22,676,833 (1) | 256.7 |
| Indonesia | 3.4% (4) | 91 (45) | 199 (55) | 20,244 (65) | 101.7 |
| Pakistan | 2.8% (5) | 124 (32) | 321 (45) | 27,035 (57) | 84.2 |
| Brazil | 2.7% (6) | 448 (14) | 1503 (20) | 244,482 (21) | 162.6 |
| Nigeria | 2.7% (7) | 33 (67) | 66 (78) | 9319 (75) | 141.2 |
| Bangladesh | 2.1% (8) | 160 (26) | 572 (28) | 332,316 (19) | 581 |
| Russia | 1.86% (9) | 174 (24) | 850 (24) | 94,277 (33) | 110.2 |
| Germany | 1.1% (19) | 790 (7) | 3093 (7) | 1,216,164 (5) | 393.2 |
| France | 0.9% (20) | 5516 (2) | 27,911 (2) | 4,972,054 (2) | 178.1 |
| United Kingdom | 0.8% (21) | 1164 (3) | 4693 (4) | 2,067,182 (3) | 440.5 |
| Canada | 0.5% (37) | 792 (6) | 2512 (15) | 1,551,808 (4) | 617.7 |
| Peru | 0.4% (42) | 77 (48) | 11,231 (3) | 138,716 (27) | 12.3 |
| Netherlands | 0.2% (67) | 435 (15) | 3409 (5) | 413,897 (16) | 121.4 |
Table 11.
Distribution of accuracy for the point with geolocalization.
Table 11.
Distribution of accuracy for the point with geolocalization.
| ‘accuracy’ | Number of Points | % |
|---|
| 0 | 0 | 0 |
| 420,150 | 0.9 |
| 1,400,466 | 2.8 |
| 3,574,004 | 7.3 |
| 7,406,060 | 15.1 |
| 5,268,843 | 10.8 |
| 11,142,305 | 22.8 |
| 5,973,000 | 12.2 |
| 7,128,773 | 14.6 |
| 1,725,169 | 3.5 |
| 1,192,908 | 2.4 |
| 1,426,475 | 2.9 |
| >100 | 2,243,566 | 4.6 |
| Total | 48,901,719 | |
Table 12.
Distribution of ‘speed’ for points with geolocalization.
Table 12.
Distribution of ‘speed’ for points with geolocalization.
| ‘speed’ | Number of Points | % |
|---|
| 0 | 31,986,102 | 65.4% |
| 837,662 | 18.2% |
| 2,058,585 | 4.2% |
| >4.2 | 5,919,370 | 12.2% |
| Total | 48,901,719 | |
Table 13.
Time shift (in hour) between record_utc and time_location, for the tracks are are 100% geolocalized.
Table 13.
Time shift (in hour) between record_utc and time_location, for the tracks are are 100% geolocalized.
| Time Shift (h) | Number of Tracks | % |
|---|
| <−24 | 797 | 0.4 |
| −24 | 151 | 0.07 |
| −23 | 35 | 0.02% |
| −22 | 4 | 0.002% |
| −20 | 3 | 0.002% |
| −19 | 8 | 0.004% |
| −18 | 8 | 0.004% |
| −15 | 1 | 0.0005% |
| −14 | 1 | 0.0005% |
| −13 | 3 | 0.002% |
| −12 | 25 | 0.012% |
| −11 | 17 | 0.008% |
| −10 | 8 | 0.004% |
| −9 | 6 | 0.003% |
| −8 | 3 | 0.002% |
| −7 | 10 | 0.005% |
| −6 | 7 | 0.004% |
| −5 | 6 | 0.003% |
| −4 | 10 | 0.005% |
| −3 | 67 | 0.034% |
| −2 | 47 | 0.023% |
| −1 | 258 | 0.13% |
| 0 | 194,690 | 98.54% |
| 1 | 479 | 0.242 |
| 2 | 54 | 0.027% |
| 3 | 28 | 0.013% |
| 4 | 15 | 0.008 |
| 5 | 10 | 0.005% |
| 6 | 6 | 0.003% |
| 7 | 6 | 0.003% |
| 8 | 10 | 0.005% |
| 9 | 3 | 0.002% |
| 10 | 10 | 0.005% |
| 11 | 4 | 0.002% |
| 12 | 1 | 0.0005% |
| 13 | 3 | 0.002% |
| 14 | 2 | 0.001% |
| 15 | 8 | 0.004% |
| 16 | 11 | 0.006% |
| 18 | 8 | 0.004% |
| 19 | 4 | 0.002% |
| 20 | 5 | 0.002% |
| 21 | 2 | 0.001% |
| 22 | 3 | 0.002% |
| 23 | 18 | 0.009% |
| 24 | 11 | 0.006% |
| >24 | 702 | 0.355% |
| Total | 197,568 | |
Table 14.
Total number of collected data and distribution per time length and part of the measurement tracks and points that have been collected in motion (only data with geolocalization are considered, with a speed greater than 0.5 m/s).
Table 14.
Total number of collected data and distribution per time length and part of the measurement tracks and points that have been collected in motion (only data with geolocalization are considered, with a speed greater than 0.5 m/s).
| ‘time_length’ | Tracks | Points |
|---|
| Total | Moving | Total | Moving |
|---|
| min | 21,963 | 4477 (20.4%) | 679,675 | 437,640 (64.4%) |
| min | 7190 | 1575 (21.9%) | 516,389 | 343,035 (66.4%) |
| min | 7204 | 2029 (28.16%) | 1,080,596 | 769,976 (71.2%) |
| min | 5231 | 1678 (32.1%) | 1,661,753 | 1,189,641 (71.6%) |
| min | 2083 | 752 (36.1%) | 1,237,893 | 925,499 (74.7%%) |
| min | 2362 | 741 (31.4) | 2,094,625 | 1,446,091 (69.0%) |
| h | 2026 | 466 (22.9%) | 3,694,683 | 1,912,894 (51.7%) |
| >5 h | 142 | 19 (13.4%) | 752,485 | 189,075 (25.1%) |
Table 15.
Distribution of tracks in function of the calibration method, before and after release 49 (’n.a.’ for ‘not available’).
Table 15.
Distribution of tracks in function of the calibration method, before and after release 49 (’n.a.’ for ‘not available’).
| ‘calibration_method’ | Since Release | Nb of Tracks before R49 (%) | Nb of Tracks Since R49 (%) |
|---|
| CalibratedSmartPhone | 33 | n.a. | 277 (1.4%) |
| Calibrator | 28 | n.a. | 139 (0.7%) |
| ManualSetting | 28 | n.a. | 838 (4.4%) |
| None | 28 | 241,532 | 17,395 (92.1%) |
| Reference | 28 | n.a. | 167 (0.9%) |
| Traffic | 49 | n.a. | 74 (0.5%) |
| Total | | 241,532 | 18,890 |
Table 16.
Cross table of the number of collected tracks in function of the calibration method and the calibration gain (data from release 49).
Table 16.
Cross table of the number of collected tracks in function of the calibration method and the calibration gain (data from release 49).
| Calibration Method/Gain | <−10 dB | [−10, −5] dB | [−5, 0] dB | 0 dB | [0, 5] dB | [5, 10] dB | >10 dB | Total |
|---|
| CalibratedSmartPhone | - | 61 (22.0%) | 136 (49.1%) | - | 75 (27.1%) | 3 (1.1%) | 2 (0.7%) | 277 |
| Calibrator | 1 (0.7%) | 2 (1.4%) | 3 (2.2%) | - | 7 (5.0%) | - | 126 (90.7%) | 139 |
| ManualSetting | 56 (6.7%) | 13 (1.6%) | 150 (17.9%) | 126 (15.%) | 156 (18.6%) | 54 (6.4%) | 283 (33.8%) | 838 |
| None | 559 (2.4%) | 911 (5.3%) | 865 (5.1%) | 13,857 (79.9%) | 485 (2.9%) | 227 (1.5%) | 491 (2.9%) | 17,395 |
| Reference | 9 (5.4%) | 21 (12.6%) | 38 (22.7%) | 23 (13.8%) | 57 (34.1%) | 7 (4.2%) | 12 (7.2%) | 167 |
| Traffic | 20 (27.0%) | 14 (18.9%) | 28 (37.8%) | - | 6 (8.1%) | 5 (6.8%) | 1 (1.4%) | 74 |
| Total | 645 | 1022 | 1220 | 14,006 | 786 | 296 | 915 | 18,890 |
Table 17.
List of NoiseCapture Parties. More information are located in the ‘noisecapture_party’ table of the database. The number of contributors, as well as the total of collected tracks and points are given. The organization in charge of the NoiseCapture Party is also mentioned (Noise-Planet is the organization in charge of the development of NoiseCapture application). While the CICAM NoiseCapture Party has been planned, it was canceled due to the pandemic situation (i.e., there are no corresponding tracks).
| ‘pk_party’ | ‘tag’ | Organization | ‘filter_area’ | ‘filter_time’ | Contributors | Tracks | Points |
|---|
| 1 | SNDIGITALWEEK | Noise-Planet | TRUE | FALSE | 7 | 133 | 11,523 |
| 2 | ANQES | Noise-Planet | TRUE | TRUE | 4 | 29 | 4479 |
| 3 | FDS2017 | Noise-Planet | TRUE | TRUE | 2 | 6 | 1239 |
| 5 | IMS2018 | Noise-Planet | TRUE | FALSE | 13 | 67 | 18,793 |
| 6 | UDC | Universidade da Coruña | TRUE | TRUE | 8 | 56 | 6879 |
| 9 | TEST44 | Noise-Planet | TRUE | TRUE | 1 | 3 | 91 |
| 10 | UNISA | University of Salerno, Italy | TRUE | TRUE | 13 | 149 | 15,912 |
| 11 | PNRGM | Noise-Planet | TRUE | TRUE | 2 | 13 | 6089 |
| 12 | AMSOUNDS | Waag Technology & Society | TRUE | TRUE | 2 | 18 | 693 |
| 13 | PNRGM | Parc Naturel du Morbihan | TRUE | TRUE | 14 | 100 | 21,470 |
| 14 | FDSSTRAS | Noise-Planet | TRUE | TRUE | 5 | 31 | 2967 |
| 15 | AGGLOBASTIA | Noise-Planet | FALSE | TRUE | 19 | 507 | 59,838 |
| 17 | FDSNTS | Noise-Planet | TRUE | TRUE | 7 | 66 | 5916 |
| 18 | H2020 | Noise-Planet | TRUE | TRUE | 11 | 89 | 22,060 |
| 19 | UDC | Universidade da Coruña, Spain | FALSE | TRUE | 20 | 138 | 5866 |
| 20 | MSA | Noise-Planet | TRUE | TRUE | 9 | 9 | 1885 |
| 21 | GEO2019 | Noise-Planet | TRUE | TRUE | 43 | 420 | 63,521 |
| 22 | IMS2019 | Noise-Planet | TRUE | TRUE | 23 | 192 | 17,309 |
| 23 | FPSLYO | Noise-Planet | TRUE | TRUE | 11 | 34 | 10,285 |
| 24 | SSSOROLL2019 | Generalitat de Catalunya | FALSE | TRUE | 68 | 372 | 36,272 |
| 26 | UNISA | University of Salerno, Italy | TRUE | TRUE | 20 | 332 | 23,220 |
| 27 | FDSSTRAS | Noise-Planet | TRUE | TRUE | 3 | 7 | 1771 |
| 28 | H2020 | Noise-Planet | TRUE | TRUE | 9 | 39 | 32,948 |
| 29 | UDC | Universidade da Coruña, Spain | FALSE | TRUE | 9 | 73 | 2099 |
| 30 | MSA | Noise-Planet | TRUE | TRUE | 10 | 10 | 3665 |
| 31 | CICAM | EPN, Quito, Ecuador | FALSE | TRUE | - | - | - |
| 32 | UDC_COVID | Universidade da Coruña, Spain | TRUE | TRUE | 33 | 249 | 14,785 |
Table 18.
Cross table between pleasantness and tags.
Table 18.
Cross table between pleasantness and tags.
| Tag/Pleasantness | Used | Not Used |
|---|
| Used | 45,549 (17.5%) | 78,814 (30.2%) |
| Not used | 9457 (3.6%) | 126,602 (48.7%) |
Table 19.
Tags description: ‘pk_tag’ and ‘tag_name’ are the primary key and the name of the tags. The ‘Description’ correspond to the name of the tag in the corresponding NoiseCapture screen.
Table 19.
Tags description: ‘pk_tag’ and ‘tag_name’ are the primary key and the name of the tags. The ‘Description’ correspond to the name of the tag in the corresponding NoiseCapture screen.
| Category | Measurement Conditions |
| ‘pk_tag’ | 1 | 6 | 13 | 23 |
| ‘tag_name’ | test | indoor | rain | wind |
| Description | Test | Indoor | Rain | Wind |
| | Human Activity Sources |
| ‘pk_tag’ | 18 | 30 | 20 | 28 |
| ‘tag_name’ | chatting | children | footsteps | music |
| Description | Voice | Children | Footsteps | Music |
| Category | Transportation Sources |
| ‘pk_tag’ | 27 | 32 | 26 | 35 |
| ‘tag_name’ | road | rail | air_traffic | marine_traffic |
| Description | Road | Rail | Air T. | Marine |
| | Natural Sources |
| ‘pk_tag’ | 34 | 33 | 29 | |
| ‘tag_name’ | water | animals | vegetation | |
| Description | Water | Animals | Vegetation | |
| | Mechanical Activity Sources |
| ‘pk_tag’ | 24 | 36 | 31 | |
| ‘tag_name’ | works | alarms | industrial | |
| Description | Works | Alarms | Industrial | |
Table 20.
Possible enhancements of the NoiseCapture application and database.
Table 20.
Possible enhancements of the NoiseCapture application and database.
| Data | Uncertainties/Bias | Possible Sources | Possible Solutions |
|---|
| User profile | Profile information is empty | Cannot evaluate the expertise of the contributor | In the app: update the field during an app update if the field is empty. |
| Geolocalization | No geolocalization of a track | The geolocalization is turned off | In the app: add a message for turning on the geolocalization |
| | Indoor measurements | In the app: wait for future methodologies (Indoor positioning System) and high sensitivity GPS for indoor localization |
| No geolocalization of a point in a track | Local loss of geolocalization | Use GIS methodologies to re-locate the point within the track |
| Inhomogeneous worldwide coverage | No access to Google Play | Use alternative app stores |
| Accuracy | Value equal to ‘0.0’ | No geolocalization | In the app: add a message for turning on the geolocalization |
| Extreme (not realistic) values | Unknown | No known solutions |
| Large (but realistic) values | | In the app: ask contributors to wait for a better localization before starting the measurement |
| Speed | Value equal to ‘0.0’ | No geolocalization | In the app: add a message for turning on the geolocalization |
| Negative values | Unknown | No known solutions |
| No evaluation of the accuracy of the speed value | In the app: use the Android function getSpeedAccuracyMetersPerSecond() to store this missing information. |
| Timestamp | Wrong date | The geolocalization is turned off | In the app: add a message for turning on the geolocalization |
| | Wrong phone setting | In the app: check that the date is correct and add a message if not |
| Calibration | The calibration method is not known | The information about the selected calibration method is collected since the version 49 only | No solution |
| Extreme (not realistic) values | No calibration method used | In the app: send a notification to calibrate the smartphone |
| In the app: check the calibration value and send a notication if the value seems incorrect |
| In the app/remote server: create a smartphone model calibration database |
| Pleasantness | Possible bias at level 50% | The default value is fixed at a pleasantness of 50% | In the app: change the selection mode for the pleasantness without default value |
| Noise levels | Extreme (not realistic) values | Calibration is not correct | Improve the calibration of the smartphone |


 ,
, 


