
Review of the Health, Welfare and Care Workforce in Tasmania, Australia: 2011–2016


Abstract
:1. Introduction
2. Materials and Methods
3. Results
3.1. Tasmanian HWC Workforce
3.1.1. Size
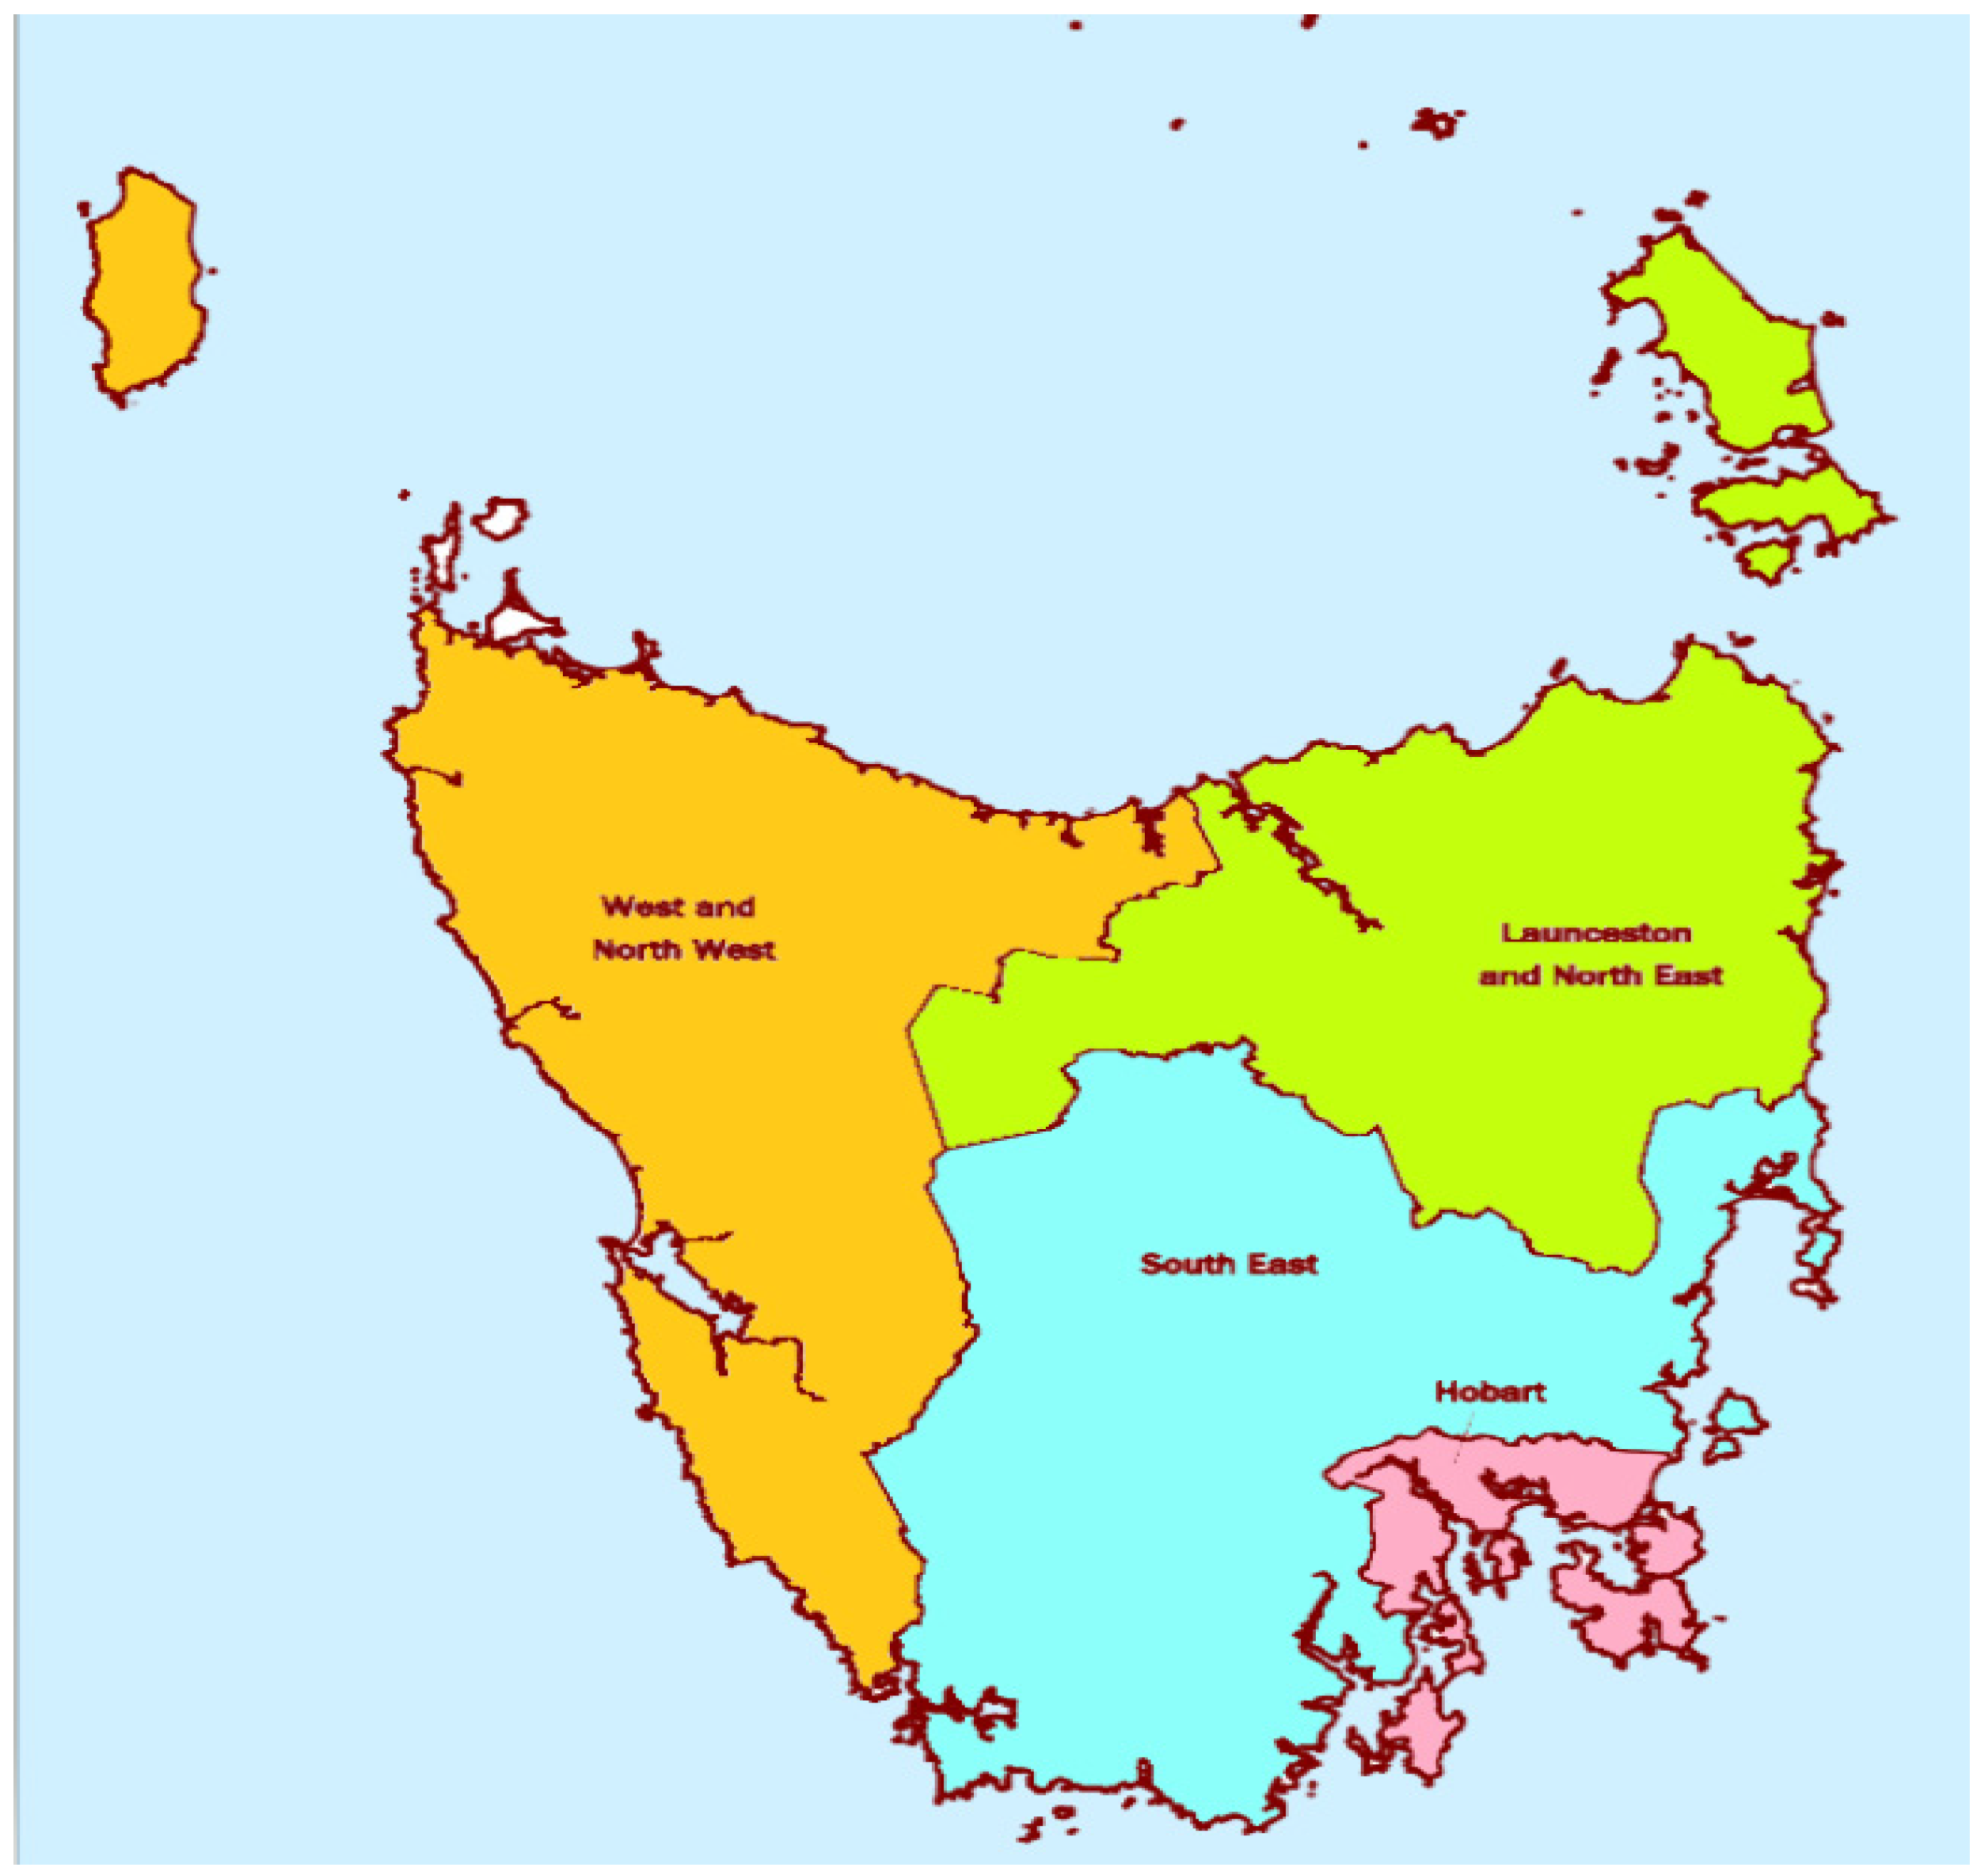
3.1.2. Distribution
3.1.3. Gender Composition
3.1.4. Employment Participation
4. Discussion
5. Conclusions
Author Contributions
Funding
Institutional Review Board Statement
Informed Consent Statement
Data Availability Statement
Acknowledgments
Conflicts of Interest
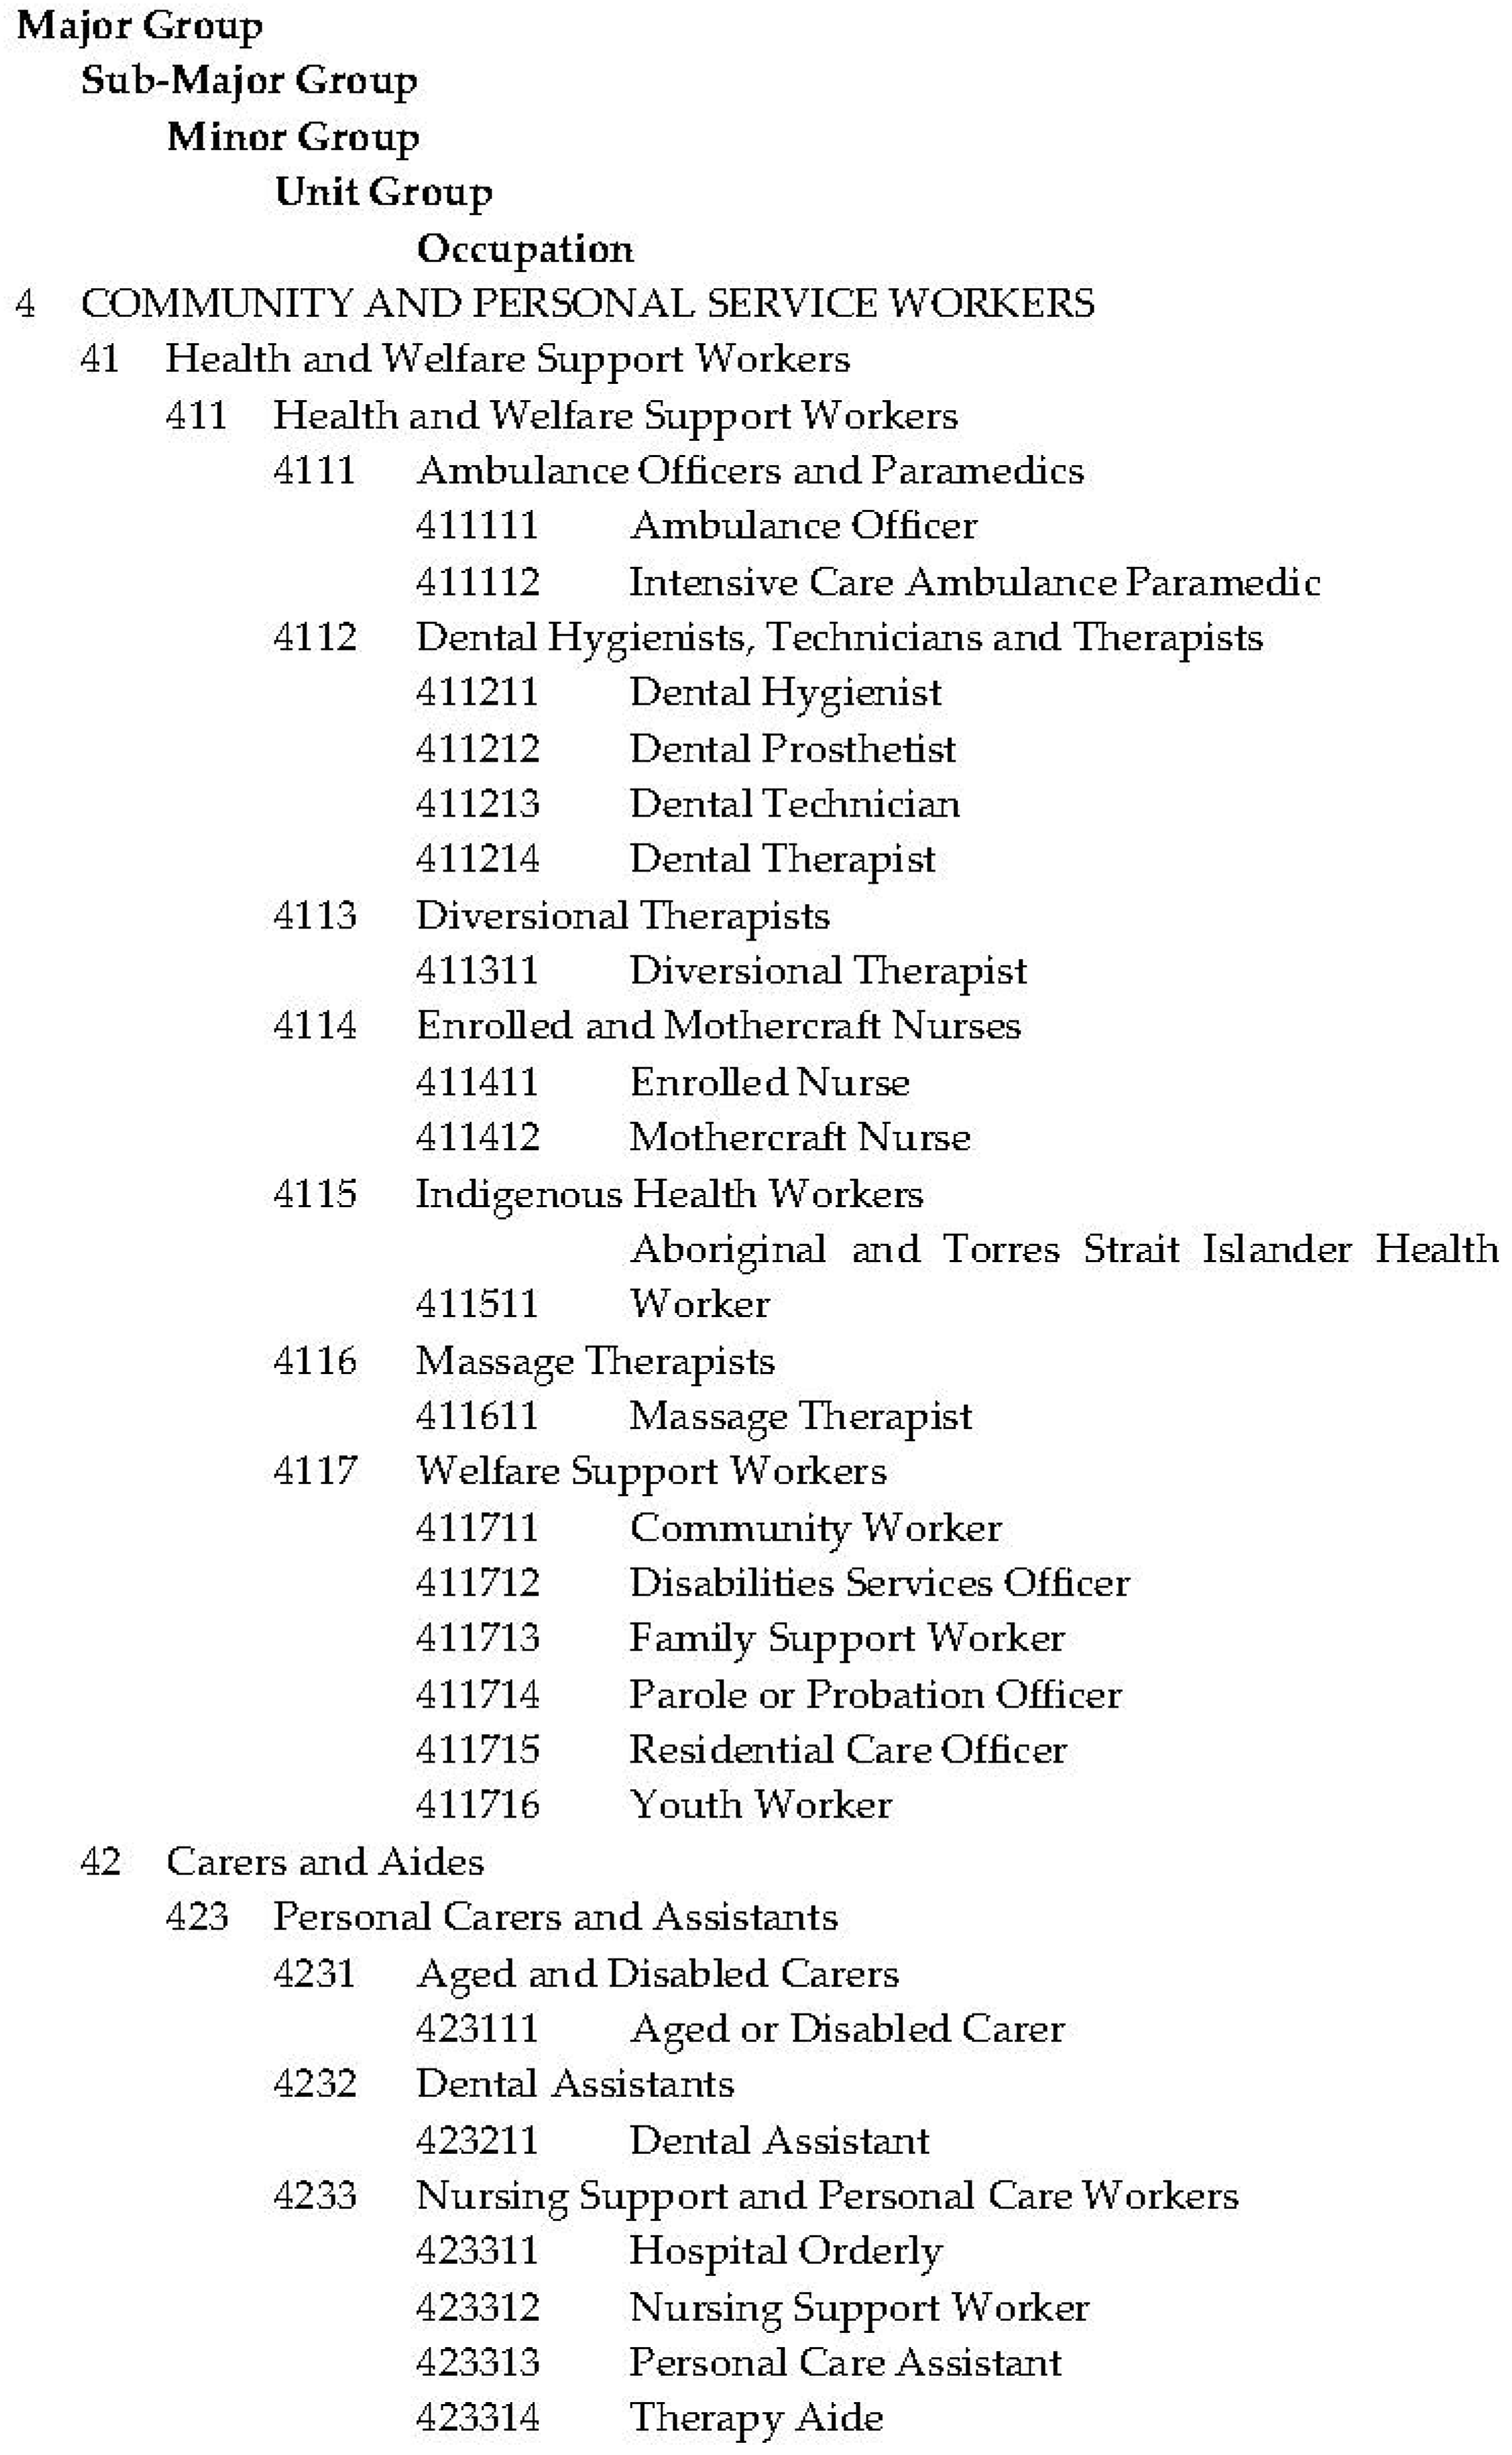
Appendix A

| Category | ANZSCO Codes Included |
|---|---|
| Medicine | 253 Medical Practitioners |
| Nursing and Midwifery | 254 Midwifery and Nursing Professionals; 4114 Enrolled and Mothercraft Nurses |
| Allied Health | 234,915 Exercise Physiologist; 251,111 Dietitian; 2512 Medical Imaging Professionals; 2514 Optometrists and Orthoptists; 2515 Pharmacists; 251,912 Orthotist or Prosthetist; 2521 Chiropractors and Osteopaths; 252,214 Traditional Chinese Medicine Practitioner; 2524 Occupational Therapists; 2525 Physiotherapists; 2526 Podiatrists; 2527 Audiologists and Speech Pathologists\Therapists; 272,114 Rehabilitation Counsellor; 2723 Psychologists; 2725 Social Workers; 4111 Ambulance Officers and Paramedics; 4113 Diversional Therapists; 4115 Indigenous Health Workers |
| Dentistry and Oral Health | 2523 Dental Practitioners; 4112 Dental Hygienists, Technicians and Therapists; 4232 Dental Assistants |
| Health-Other | 1340 Education, Health and Welfare Services Managers, nfd; 1342 Health and Welfare Services Managers; 233,913 Biomedical Engineer; 2346 Medical Laboratory Scientists; 2500 Health Professionals, nfd; 2510 Health Diagnostic and Promotion Professionals, nfd; 251,100 Nutrition Professionals nfd; 251,112 Nutritionist; 2513 Occupational and Environmental Health Professionals; 251,900 Other Health Diagnostic and Promotion Professionals nfd; 251,911 Health Promotion Officer; 251,999 Health Diagnostic and Promotion Professionals nec; 2520 Health Therapy Professionals, nfd; 252,200 Complementary Health Therapists nfd; 252,211 Acupuncturist; 252,212 Homoeopath; 252213 Naturopath; 252,299 Complementary Health Therapists nec; 3112 Medical Technicians; 4116 Massage Therapists; 4233 Nursing Support and Personal Care Workers |
| Welfare | 2700 Legal, Social and Welfare Professionals, nfd; 2720 Social and Welfare Professionals, nfd; 272,100 Counsellors nfd; 272,111 Careers Counsellor; 272,112 Drug and Alcohol Counsellor; 272,113 Family and Marriage Counsellor; 272,115 Student Counsellor; 272,199 Counsellors nec; 272,211 Minister of Religion; 2726 Welfare, Recreation and Community Arts Workers; 4000 Community and Personal Service Workers, nfd; 4110 Health and Welfare Support Workers, nfd; 4117 Welfare Support Workers; 4234 Special Care Workers |
| Carers | 4200 Carers and Aides, nfd; 4230 Personal Carers and Assistants, nfd; 4231 Aged and Disabled Carers |
References
- Wakerman, J.; Humphreys, J.S. “Better health in the bush”: Why we urgently need a national rural and remote health strategy. Med. J. Aust. 2019, 210, 202–203. [Google Scholar] [CrossRef] [PubMed]
- Crettenden, I.F.; McCarty, M.V.; Fenech, B.J.; Heywood, T.; Taitz, M.C.; Tudman, S. How evidence-based workforce planning in Australia is informing policy development in the retention and distribution of the health workforce. Hum. Resour. Health 2014, 12, 7. [Google Scholar] [CrossRef] [PubMed] [Green Version]
- Ono, T.; Lafortune, G.; Schoenstein, M. Health Workforce Planning in OECD Countries: A Review of 26 Projection Models from 18 Countries; OECD Health Working Paper No. 62; OECD Publishing: Paris, France, 2013. [Google Scholar]
- Duckett, S.J. Health workforce design for the 21st century. Aust. Health Rev. 2005, 29, 201–210. [Google Scholar] [CrossRef] [PubMed] [Green Version]
- Buchan, J.; Law, D. A Review of Allied Health Workforce Models and Structures: A Report to the Victorian Ministerial Advisory Committee for Allied Health; Department of Health and Human Services: Melbourne, Australia, 2016. [Google Scholar]
- The Evidence Centre for Skills for Health. Key Changes in the Healthcare Workforce: Rapid Review of International Evidence; Skills for Health: Bristol, UK, 2011. [Google Scholar]
- Gilburt, H. Supporting Integration through New Roles and Working across Boundaries; The King’s Fund: London, UK, 2016. [Google Scholar]
- Adams, J.; Lauche, R.; Peng, W.; Steel, A.; Moore, C.; Amorin-Woods, L.G.; Sibbritt, D. A workforce survey of Australian chiropractic: The profile and practice features of a nationally representative sample of 2005 chiropractors. BMC Complement. Altern. Med. 2017, 17, 14. [Google Scholar] [CrossRef] [PubMed] [Green Version]
- Heywood, T.; Laurence, C. The general practice nurse workforce: ‘Estimating future supply’. Aust. J. Gen. Pract. 2018, 47, 788. [Google Scholar] [CrossRef] [PubMed] [Green Version]
- Pretorius, A.; Karunaratne, N.; Fehring, S. Australian physiotherapy workforce at a glance: A narrative review. Aust. Health Rev. 2016, 40, 438–442. [Google Scholar] [CrossRef] [PubMed]
- Ridgewell, E.; Dillon, M.; O’Connor, J.; Anderson, S.; Clarke, L. Demographics of the Australian orthotic and prosthetic workforce 2007–12. Aust. Health Rev. 2016, 40, 555–561. [Google Scholar] [CrossRef] [PubMed]
- Australian Institute of Health and Welfare. Medical Practitioners Workforce 2015; AIHW: Canberra, Australia, 2016. [Google Scholar]
- Health Workforce Australia. Health Workforce 2025: Doctors, Nurses and Midwives; Health Workforce Australia: Adelaide, Australia, 2012. [Google Scholar]
- Australian Institute of Health and Welfare. Nursing and Midwifery Workforce 2015; AIHW: Canberra, Australia, 2016. [Google Scholar]
- Australian Institute of Health and Welfare. Allied Health Workforce 2012; AIHW: Canberra, Australia, 2013. [Google Scholar]
- Nancarrow, S.A.; Young, G.; O’Callaghan, K.; Jenkins, M.; Philip, K.; Barlow, K. Shape of allied health: An environmental scan of 27 allied health professions in Victoria. Aust. Health Rev. 2017, 41, 327–335. [Google Scholar] [CrossRef] [PubMed]
- Whitford, D.; Smith, T.; Newbury, J. The South Australian Allied Health Workforce survey: Helping to fill the evidence gap in primary health workforce planning. Aust. J. Prim. Health 2012, 18, 234–241. [Google Scholar] [CrossRef] [PubMed] [Green Version]
- Australian Institute of Health and Welfare. Dental Workforce 2012; AIHW: Canberra, Australia, 2014. [Google Scholar]
- Tasmanian Government Department of Health and Human Services. Submission to the Productivity Commission Health Workforce Study for the Council of Australian Governments; TAS: Hobart, Australia, 2005. [Google Scholar]
- Australian Bureau of Statistics. 1220.0-ANZSCO—Australian and New Zealand Standard Classification of Occupations. Version 1.2. 2013. Available online: https://www.abs.gov.au/ausstats/abs@.nsf/mf/1220.0 (accessed on 3 March 2019).
- Australian Bureau of Statistics. 1220.0-ANZSCO—Australian and New Zealand Standard Classification of Occupations. First Edition, Revision 1. 2009. Available online: https://www.abs.gov.au/ausstats/abs@.nsf/Previousproducts/1220.0Search0First%20Edition,%20Revision%201 (accessed on 3 March 2019).
- Australian Institute of Health and Welfare. Workforce Glossary. Available online: https://www.aihw.gov.au/reports-data/health-welfare-services/workforce/glossary (accessed on 3 March 2019).
- Australian Bureau of Statistics. 2901.0-Census of Population and Housing: Census Dictionary. 2016. Available online: https://www.abs.gov.au/ausstats/abs@.nsf/Lookup/2901.0Chapter33502016 (accessed on 3 March 2019).
- Australian Bureau of Statistics. Population by Age and Sex, Regions of Australia. Cat. 3235.0. 2019. Available online: https://www.abs.gov.au/ausstats/abs@.nsf/Explanatory%20Notes/3235.0/ (accessed on 3 March 2019).
- Australian Institute of Health and Welfare. Australia’s Health 2018; AIHW: Canberra, Australia, 2018. [Google Scholar]
- Mavromaras, K.; Knight, G.; Isherwood, L.; Crettenden, A.; Flavel, G.; Karmel, T.; Moskos, M.; Smith, L.; Walton, H.; Wei, Z. National Aged Care Workforce Census and Survey–The Aged Care Workforce, 2016; Department of Health: Canberra, Australia, 2017. [Google Scholar]
- National Disability Services. Australian Disability Workforce Report, 3rd ed.; National Disability Services: Sydney, Australia, 2018. [Google Scholar]
- Australian Bureau of Statistics. 2016 Census QuickStats: Tasmania. 2019. Available online: https://quickstats.censusdata.abs.gov.au/census_services/getproduct/census/2016/quickstat/6?opendocument#:~:text=In%20the%202016%20Census%2C%20there,up%204.6%25%20of%20the%20population.&text=The%20median%20age%20of%20people%20in%20Tasmania%20was%2042%20years (accessed on 3 March 2019).
- Productivity Commission. Caring for Older Australians: Overview, Report No. 53, Final Inquiry Report; Productivity Commission: Canberra, Australia, 2011. [Google Scholar]
- The Royal Australian College of General Practitioners. General Practice: Health of the Nation 2018; RACGP: Melbourne, Australia, 2018. [Google Scholar]
- Australian Bureau of Statistics. 4430.0-Disability, Ageing and Carers, Australia: Summary of Findings. 2012. Available online: https://www.abs.gov.au/ausstats/abs@.nsf/Lookup/A813E50F4C45A338CA257C21000E4F36?opendocument#:~:text=DISABILITY%20%2D%20KEY%20FINDINGS,-The%202012%20Survey&text=The%202012%20SDAC%20found%20that,13%25%20compared%20with%2025%25) (accessed on 27 October 2019).
- Mavromaras, K.; Moskos, M.; Mahuteau, S.; Isherwood, S.; Goode, A.; Walton, H.; Smith, L.; Wei, Z.; Flavel, J. Evaluation of the NDIS: Final Report; National Institute of Labour Studies Flinders University: Adelaide, Australia, 2018. [Google Scholar]
- Commonwealth of Australia (Department of Social Sciences). NDIS National Workforce Plan: 2021–2025; Department of Social Services: Canberra, Australia, 2021. [Google Scholar]
- Tasmanian Government Department of Health. The State of Public Health Tasmania 2018; Department of Health: Hobart, Australia, 2018. [Google Scholar]
- Office of the National Rural Health Commissioner. Discussion Paper for Consultation: Rural Allied Health Quality, Access and Distribution; National Rural Health Commissioner: Canberra, Australia, 2019. [Google Scholar]
- Australian Institute of Health and Welfare. Welfare Workforce; AIHW: Canberra, Australia, 2019. [Google Scholar]
- Australian Government. Welfare Support Workers: Australian Government Job Outlook. Available online: https://joboutlook.gov.au/occupation?code=4117 (accessed on 27 October 2019).
- Australian Government. Evaluation of the Better Access to Psychiatrists, Psychologists and General Practitioners through the Medicare Benefits Schedule (Better Access) Initiative. Available online: https://www1.health.gov.au/internet/publications/publishing.nsf/Content/mental-ba-eval-dexec-toc (accessed on 28 June 2021).
- Di Mattia, M.A.; Grant, J. Counselling Psychology in Australia: History, status and challenges. Couns. Psychol. Q. 2016, 29, 139–149. [Google Scholar] [CrossRef]
- Australian Institute of Health and Welfare. Australia’s Health 2016. Australia’s Health Series No. 15. Cat. No. AUS 199; AIHW: Canberra, Australia, 2016. [Google Scholar]
- Australian Bureau of Statistics. Doctors and Nurses. Cat. 4102.0. 2013. Available online: https://www.abs.gov.au/ausstats/abs@.nsf/lookup/4102.0main+features20april+2013 (accessed on 27 October 2019).
- Department of Health and Human Services. One State, One Health System, better Outcomes: Delivering Safe and Sustainable Clinical Services White Paper; Department of Health and Human Services: Hobart, Australia, 2015. [Google Scholar]
- Brennan, D.; Chrisopoulos, S.; Teusner, D. Hours worked and patient visits provided by dentists in Australia. Aust. Dent. J. 2018, 63, 118–123. [Google Scholar] [CrossRef] [PubMed]
- van Hassel, D.; van der Velden, L.; de Bakker, D.; Batenburg, R. Age-related differences in working hours among male and female GPs: An SMS-based time use study. Hum. Resour. Health 2017, 15, 84. [Google Scholar] [CrossRef] [PubMed] [Green Version]
- Institute for the Study of Social Change. The Tasmanian Workforce by Industry Sector. Inst. Insights 2016, Insight Two, 1–12. [Google Scholar]
- Institute for the Study of Social Change. The Changing Nature of Work in Tasmania. Inst. Insights 2016, Insight One, 1–8.
- Cassidy, N.; Parsons, S. The rising share of part-time employment. RBA Bull. 2017, Sept Quarter, 19–26. [Google Scholar]
- Girasek, E.; Kovács, E.; Aszalós, Z.; Eke, E.; Ragány, K.; Kovács, R.; Cserháti, Z.; Szócska, M. Headcount and FTE data in the European health workforce monitoring and planning process. Hum. Resour. Health 2016, 14, 42. [Google Scholar] [CrossRef] [PubMed] [Green Version]
- Rozner, G. The Disappearing Australian Working Man; Institute of Public Affairs: Melbourne, Australia, 2017; pp. 1–18. [Google Scholar]
| Headcount | Full Time Equivalent | Annual Service Hours per Capita | |||||||
|---|---|---|---|---|---|---|---|---|---|
| 2011 | 2016 | % Change | 2011 | 2016 | % Change | 2011 | 2016 | % Change | |
| Medicine | 1574 | 1874 | 19.1 | 1613.4 | 1850.6 | 14.7 | 6.8 | 7.5 | 11.4 |
| Nursing and Midwifery | 6413 | 6955 | 8.5 | 5109.8 | 5518.0 | 8.0 | 20.4 | 21.4 | 4.9 |
| Allied Health | 3050 | 3627 | 18.9 | 2671.6 | 3110.3 | 16.4 | 10.7 | 12.1 | 13.1 |
| Dentistry and Oral Health | 720 | 831 | 15.4 | 637.1 | 712.0 | 11.7 | 2.5 | 2.8 | 8.5 |
| Health-Other | 3654 | 4134 | 13.1 | 2994.5 | 3351.7 | 11.9 | 11.9 | 13.0 | 8.7 |
| Welfare | 2698 | 2714 | 0.6 | 2324.8 | 2245.5 | −3.4 | 9.3 | 8.7 | −6.2 |
| Carers | 4391 | 5278 | 20.2 | 3153.1 | 3714.1 | 17.8 | 12.6 | 14.4 | 14.4 |
| Total | 22,500 | 25,413 | 12.9 | 18,504.2 | 20,502.1 | 10.8 | 74.2 | 79.8 | 7.6 |
| SA4 Region | Headcount | Full Time Equivalent | Annual Service Hours per Capita | ||||||
|---|---|---|---|---|---|---|---|---|---|
| 2011 | 2016 | % Change | 2011 | 2016 | % Change | 2011 | 2016 | % Change | |
| Hobart (Population) | (211,656) | (222,356) | (5.1) | ||||||
| Dependency Ratio | 52.0 | 55.8 | 3.8 | ||||||
| Medicine | 881 | 1082 | 22.8 | 878.8 | 1055.0 | 20.0 | 8.6 | 9.9 | 14.3 |
| Nursing and Midwifery | 3138 | 3429 | 9.3 | 2499.3 | 2666.0 | 6.7 | 23.3 | 23.7 | 1.5 |
| Allied Health | 1529 | 1847 | 20.8 | 1307.8 | 1575.6 | 20.5 | 12.2 | 14.0 | 14.7 |
| Dentistry and Oral Health | 355 | 417 | 17.5 | 313.7 | 363.8 | 16.0 | 2.9 | 3.2 | 10.4 |
| Health-Other | 1764 | 2144 | 21.5 | 1476.5 | 1761.9 | 19.3 | 13.8 | 15.7 | 13.6 |
| Welfare | 1231 | 1272 | 3.3 | 1056.7 | 1071.3 | 1.4 | 9.9 | 9.5 | −3.5 |
| Carers | 1661 | 2192 | 32.0 | 1237.2 | 1643.0 | 32.8 | 11.6 | 14.6 | 26.4 |
| Total | 10,559 | 12,383 | 17.3 | 8770.0 | 10,136.5 | 15.6 | 82.3 | 90.6 | 10.0 |
| South East (Population) | (35,797) | (37,119) | (3.7) | ||||||
| Dependency Ratio | 55.6 | 63.7 | 8.1 | ||||||
| Medicine | 25 | 40 | 60.0 | 26.6 | 33.3 | 25.4 | 1.5 | 1.9 | 20.9 |
| Nursing and Midwifery | 119 | 129 | 8.4 | 94.4 | 94.8 | 0.5 | 5.2 | 5.0 | −3.1 |
| Allied Health | 49 | 63 | 28.6 | 36.9 | 44.0 | 19.3 | 2.0 | 2.3 | 15.0 |
| Dentistry and Oral Health | 3 | 13 | 333.3 | 2.5 | 11.5 | 361.3 | 0.1 | 0.6 | 344.9 |
| Health-Other | 79 | 101 | 27.8 | 59.2 | 83.7 | 41.4 | 3.3 | 4.5 | 36.4 |
| Welfare | 74 | 58 | −21.6 | 57.5 | 42.9 | −25.5 | 3.2 | 2.3 | −28.1 |
| Carers | 116 | 132 | 13.8 | 82.4 | 88.1 | 6.9 | 4.5 | 4.7 | 3.1 |
| Total | 465 | 536 | 15.3 | 359.4 | 398.3 | 10.8 | 19.9 | 21.3 | 6.9 |
| Launceston and North East (Population) | (137,558) | (140,484) | (2.1) | ||||||
| Dependency Ratio | 55.3 | 60.0 | 4.7 | ||||||
| Medicine | 378 | 481 | 27.2 | 405.4 | 502.6 | 24.0 | 6.1 | 7.4 | 21.4 |
| Nursing and Midwifery | 1724 | 2129 | 23.5 | 1383.6 | 1719.1 | 24.3 | 19.9 | 24.2 | 21.7 |
| Allied Health | 795 | 992 | 24.8 | 712.8 | 848.5 | 19.0 | 10.2 | 11.9 | 16.6 |
| Dentistry and Oral Health | 188 | 235 | 25.0 | 163.1 | 197.9 | 21.3 | 2.3 | 2.8 | 18.8 |
| Health-Other | 966 | 1067 | 10.5 | 803.2 | 856.4 | 6.6 | 11.5 | 12.0 | 4.4 |
| Welfare | 724 | 726 | 0.3 | 622.0 | 595.7 | −4.2 | 8.9 | 8.4 | −6.2 |
| Carers | 988 | 1268 | 28.3 | 691.4 | 878.9 | 27.1 | 9.9 | 12.4 | 24.5 |
| Total | 5763 | 6898 | 19.7 | 4781.5 | 5599.2 | 17.1 | 69.0 | 79.1 | 14.7 |
| West and North West (Population) | (109,152) | (109,024) | (−0.02) | ||||||
| Dependency Ratio | 58.2 | 62.9 | 4.7 | ||||||
| Medicine | 227 | 253 | 11.5 | 233.8 | 247.9 | 6.0 | 4.5 | 4.7 | 6.2 |
| Nursing and Midwifery | 1118 | 1212 | 8.4 | 901.4 | 996.4 | 10.5 | 16.3 | 18.1 | 10.7 |
| Allied Health | 521 | 637 | 22.3 | 475.8 | 562.6 | 18.3 | 8.6 | 10.2 | 18.4 |
| Dentistry and Oral Health | 128 | 161 | 25.8 | 116.3 | 135.3 | 16.4 | 2.1 | 2.5 | 16.5 |
| Health-Other | 623 | 710 | 14.0 | 484.8 | 571.4 | 17.9 | 8.8 | 10.4 | 18.0 |
| Welfare | 513 | 564 | 9.9 | 461.7 | 478.9 | 3.7 | 8.4 | 8.7 | 3.8 |
| Carers | 808 | 1104 | 36.6 | 610.0 | 781.2 | 28.1 | 11.0 | 14.2 | 28.2 |
| Total | 3938 | 4641 | 17.9 | 3283.7 | 3773.8 | 14.9 | 59.7 | 68.6 | 15.0 |
| No Fixed Address | |||||||||
| Medicine | 53 | 15 | −71.7 | 54.9 | 10.7 | −80.6 | |||
| Nursing and Midwifery | 336 | 59 | −82.4 | 258.5 | 40.8 | −84.2 | |||
| Allied Health | 182 | 65 | −4.3 | 140.3 | 47.5 | −66.2 | |||
| Dentistry and Oral Health | 30 | 3 | −90.0 | 26.8 | 3.5 | −87.0 | |||
| Health-Other | 201 | 95 | −52.7 | 145.5 | 56.1 | −61.5 | |||
| Welfare | 175 | 71 | −59.4 | 134.7 | 43.7 | −67.6 | |||
| Carers | 814 | 581 | −28.6 | 519.0 | 327.0 | −37.0 | |||
| Total | 1791 | 889 | −50.4 | 1279.8 | 529.2 | −58.6 | |||
| Hobart | South East | Launceston and the North East | West and North West | |||||||||
|---|---|---|---|---|---|---|---|---|---|---|---|---|
| 2011 | 2016 | % Change | 2011 | 2016 | % Change | 2011 | 2016 | % Change | 2011 | 2016 | % Change | |
| Population | 211,656 | 222,356 | 5.1 | 35,797 | 37,119 | 3.7 | 137,558 | 140,484 | 2.1 | 109,152 | 109,024 | −0.02 |
| Dependency Ratio | 52.0 | 55.8 | 3.8 | 55.6 | 63.7 | 8.1 | 55.3 | 60.0 | 4.7 | 58.2 | 62.9 | 4.7 |
| Medicine | 8.6 | 9.9 | 14.3 | 1.5 | 1.9 | 20.9 | 6.1 | 7.4 | 21.4 | 4.5 | 4.7 | 6.2 |
| Nursing and Midwifery | 23.3 | 23.7 | 1.5 | 5.2 | 5 | −3.1 | 19.9 | 24.2 | 21.7 | 16.3 | 18.1 | 10.7 |
| Allied Health | 12.2 | 14 | 14.7 | 2 | 2.3 | 15 | 10.2 | 11.9 | 16.6 | 8.6 | 10.2 | 18.4 |
| Dentistry and Oral Health | 2.9 | 3.2 | 10.4 | 0.1 | 0.6 | 344.9 | 2.3 | 2.8 | 18.8 | 2.1 | 2.5 | 16.5 |
| Health-Other | 13.8 | 15.7 | 13.6 | 3.3 | 4.5 | 36.4 | 11.5 | 12 | 4.4 | 8.8 | 10.4 | 18 |
| Welfare | 9.9 | 9.5 | −3.5 | 3.2 | 2.3 | −28.1 | 8.9 | 8.4 | −6.2 | 8.4 | 8.7 | 3.8 |
| Carers | 11.6 | 14.6 | 26.4 | 4.5 | 4.7 | 3.1 | 9.9 | 12.4 | 24.5 | 11 | 14.2 | 28.2 |
| Total | 82.3 | 90.6 | 10 | 19.9 | 21.3 | 6.9 | 69 | 79.1 | 14.7 | 59.7 | 68.6 | 15 |
| Headcount (%) | FTE (%) | |||||
|---|---|---|---|---|---|---|
| 2011 | 2016 | % Change | 2011 | 2016 | % Change | |
| Medicine | ||||||
| Male | 949 (60.3) | 1072 (57.2) | 13.0 | 1055.8 (65.4) | 1157.8 (62.6) | 9.7 |
| Female | 624 (39.6) | 809 (43.2) | 29.6 | 555.4 (34.4) | 699.8 (37.8) | 26.0 |
| Nursing and Midwifery | ||||||
| Male | 667 (10.4) | 734 (10.6) | 10.0 | 625.4 (12.2) | 680.7 (12.3) | 8.8 |
| Female | 5756 (89.8) | 6225 (89.5) | 8.1 | 4498.8 (88.0) | 4844.7 (87.8) | 7.7 |
| Allied Health | ||||||
| Male | 914 (30.0) | 1058 (29.2) | 15.8 | 924.7 (34.6) | 1041.2 (33.5) | 12.6 |
| Female | 2156 (70.7) | 2567 (70.8) | 19.1 | 1757.1 (65.8) | 2063.3 (66.3) | 17.4 |
| Dentistry and Oral Health | ||||||
| Male | 194 (26.9) | 190 (22.9) | −2.1 | 193.7 (30.4) | 187.8 (26.4) | −3.1 |
| Female | 522 (72.5) | 641 (77.1) | 22.8 | 439.8 (69.0) | 523.9 (73.6) | 19.1 |
| Health-Other | ||||||
| Male | 1019 (27.9) | 1091 (26.4) | 7.1 | 964.8 (32.2) | 1015.0 (30.3) | 5.2 |
| Female | 2652 (72.6) | 3048 (73.7) | 14.9 | 2037.0 (68.0) | 2338.1 (69.8) | 14.8 |
| Welfare | ||||||
| Male | 902 (33.4) | 844 (31.1) | −6.4 | 860.7 (37.0) | 787.5 (35.1) | −8.5 |
| Female | 1798 (66.6) | 1861 (68.6) | 3.5 | 1466.5 (63.1) | 1452.8 (64.7) | −0.9 |
| Carers | ||||||
| Male | 825 (18.8) | 1089 (20.6) | 32.0 | 670.6 (21.3) | 869.8 (23.4) | 29.7 |
| Female | 3563 (81.1) | 4180 (79.2) | 17.3 | 2474.9 (78.5) | 2841.3 (76.5) | 14.8 |
| Total | ||||||
| Male | 5470 (24.3) | 6078 (23.9) | 11.1 | 5295.7 (28.6) | 5739.7 (28.0) | 8.4 |
| Female | 17,071 (75.9) | 19,331 (76.1) | 13.2 | 13,229.5 (71.5) | 14,764.0 (72.0) | 11.6 |
| Full-Time | Part-Time | Away from Work * | |||||||||||||
|---|---|---|---|---|---|---|---|---|---|---|---|---|---|---|---|
| Headcount (%) | FTE (%) | Headcount (%) | FTE (%) | Headcount (%) | |||||||||||
| 2011 | 2016 | % Change | 2011 | 2016 | % Change | 2011 | 2016 | % Change | 2011 | 2016 | % Change | 2011 | 2016 | % Change | |
| Male | |||||||||||||||
| Medicine | 785 | 853 | 8.7 | 979.3 | 1042.8 | 6.5 | 122 | 179 | 46.7 | 68.6 | 104.3 | 51.9 | 43 | 39 | −9.3 |
| Nursing and Midwifery | 403 | 433 | 7.4 | 467.0 | 488.3 | 4.6 | 212 | 251 | 18.4 | 150.0 | 178.9 | 19.3 | 47 | 46 | −2.1 |
| Allied Health | 667 | 778 | 16.6 | 786.5 | 903.7 | 14.9 | 188 | 248 | 31.9 | 113.5 | 147.8 | 30.3 | 47 | 44 | −6.4 |
| Dentistry and Oral Health | 146 | 141 | −3.4 | 169.8 | 159.2 | −6.3 | 44 | 48 | 9.1 | 28.1 | 32.9 | 17.1 | 11 | 6 | −45.5 |
| Health-Other | 713 | 715 | 0.3 | 803.5 | 825.1 | 2.7 | 256 | 309 | 20.7 | 148.4 | 180.5 | 21.6 | 49 | 76 | 55.1 |
| Welfare | 580 | 526 | −9.3 | 685.5 | 605.5 | −11.7 | 268 | 264 | −1.5 | 156.4 | 153.9 | −1.6 | 59 | 23 | −61.0 |
| Carers | 313 | 399 | 27.5 | 375.8 | 460.9 | 22.6 | 460 | 625 | 35.9 | 279.4 | 386.9 | 38.5 | 53 | 68 | 28.3 |
| Total | 3607 | 3845 | 6.6 | 4267.4 | 4485.4 | 5.1 | 1550 | 1924 | 24.1 | 944.4 | 1185.2 | 25.5 | 309 | 302 | −2.3 |
| Female | |||||||||||||||
| Medicine | 380 | 466.0 | 22.6 | 444.6 | 535.9 | 20.5 | 196 | 284 | 44.9 | 105.4 | 158.3 | 50.3 | 49 | 58 | 18.4 |
| Nursing and Midwifery | 2296 | 2265 | −1.4 | 2599.4 | 2535.4 | −2.5 | 2919 | 3435 | 17.7 | 1856.7 | 2263.5 | 21.9 | 538 | 526 | −2.2 |
| Allied Health | 1100 | 1264 | 14.9 | 1222.6 | 1385.1 | 13.3 | 860 | 1140 | 32.6 | 488.0 | 671.4 | 37.6 | 150 | 187 | 24.7 |
| Dentistry and Oral Health | 290 | 340 | 17.2 | 305.6 | 358.2 | 17.2 | 211 | 276 | 30.8 | 122.8 | 164.4 | 33.8 | 16 | 26 | 62.5 |
| Health-Other | 1064 | 1223 | 14.9 | 1213.5 | 1377.4 | 13.5 | 1401 | 1602 | 14.3 | 810.1 | 923.4 | 14.0 | 191 | 219 | 14.7 |
| Welfare | 875 | 819 | −6.4 | 977.9 | 905.4 | −7.4 | 808 | 917 | 13.5 | 466.2 | 531.9 | 14.1 | 100 | 125 | 25.0 |
| Carers | 954 | 1061 | 11.2 | 1105.5 | 1222.5 | 10.6 | 2329 | 2783 | 19.5 | 1315.5 | 1564.5 | 18.9 | 269 | 350 | 30.1 |
| Total | 6959 | 7438 | 6.9 | 7869.1 | 8319.9 | 5.7 | 8724 | 10437 | 19.6 | 5164.7 | 6277.4 | 21.5 | 1313 | 1491 | 13.6 |
| Total | |||||||||||||||
| Medicine | 1162 (73.8) | 1319 (70.4) | 13.5 | 1420.5 (88.0) | 1579.5 (85.4) | 11.2 | 317 (20.1) | 464 (24.8) | 46.4 | 173.6 (10.8) | 263.3 (14.2) | 51.7 | 94 (6.0) | 91 (4.9) | −3.2 |
| Nursing and Midwifery | 2699 (42.1) | 2697 (38.8) | −0.1 | 3068.3 (60.0) | 3026.2 (54.8) | −1.4 | 3137 (48.9) | 3688 (53.0) | 17.6 | 2009.3 (39.3) | 2448.3 (44.4) | 21.8 | 585 (9.1) | 567 (8.2) | −3.1 |
| Allied Health | 1764 (57.8) | 2050 (56.5) | 16.2 | 2014.2 (75.4) | 2298.8 (73.9) | 14.1 | 1078 (35.3) | 1389 (38.3) | 28.8 | 623.1 (23.3) | 823.2 (26.5) | 32.1 | 195 (6.4) | 225 (6.2) | 15.4 |
| Dentistry and Oral Health | 434 (60.3) | 474 (57.0) | 9.2 | 472.5 (74.2) | 509.7 (71.6) | 7.9 | 255 (35.4) | 324 (39.0) | 27.1 | 150.5 (23.6) | 197.0 (27.7) | 30.9 | 28 (3.9) | 34 (4.1) | 21.4 |
| Health-Other | 1765 (48.3) | 1929 (46.7) | 9.3 | 2016.1 (67.3) | 2200.7 (65.7) | 9.2 | 1642 (44.9) | 1900 (46.0) | 15.7 | 949.2 (31.7) | 1096.8 (32.7) | 15.5 | 242 (6.6) | 286 (6.9) | 18.2 |
| Welfare | 1464 (54.3) | 1358 (50.0) | −7.2 | 1674.2 (72.0) | 1533.0 (68.3) | −8.4 | 1066 (39.5) | 1195 (44.0) | 12.1 | 619.7 (26.7) | 693.0 (30.9) | 11.8 | 156 (5.8) | 163 (6.0) | 4.5 |
| Carers | 1276 (29.1) | 1455 (27.6) | 14.0 | 1493.0 (47.4) | 1676.1 (45.1) | 12.3 | 2785 (63.4) | 3407 (64.6) | 22.3 | 1588.2 (50.4) | 1949.2 (52.5) | 22.7 | 329 (7.5) | 414 (7.8) | 25.8 |
| Total | 10,564 (47.0) | 11,282 (44.4) | 6.8 | 12,158.9 (65.7) | 12,824.1 (62.5) | 5.5 | 10,280 (45.7) | 12,367 (48.7) | 20.3 | 6113.5 (33.0) | 7470.7 (36.4) | 22.2 | 1629 (7.2) | 1780 (7.0) | 9.3 |
Publisher’s Note: MDPI stays neutral with regard to jurisdictional claims in published maps and institutional affiliations. |
© 2021 by the authors. Licensee MDPI, Basel, Switzerland. This article is an open access article distributed under the terms and conditions of the Creative Commons Attribution (CC BY) license (https://creativecommons.org/licenses/by/4.0/).
Share and Cite
Jessup, B.; Barnett, T.; Obamiro, K.; Cross, M.; Mseke, E. Review of the Health, Welfare and Care Workforce in Tasmania, Australia: 2011–2016. Int. J. Environ. Res. Public Health 2021, 18, 7014. https://doi.org/10.3390/ijerph18137014
Jessup B, Barnett T, Obamiro K, Cross M, Mseke E. Review of the Health, Welfare and Care Workforce in Tasmania, Australia: 2011–2016. International Journal of Environmental Research and Public Health. 2021; 18(13):7014. https://doi.org/10.3390/ijerph18137014
Chicago/Turabian StyleJessup, Belinda, Tony Barnett, Kehinde Obamiro, Merylin Cross, and Edwin Mseke. 2021. "Review of the Health, Welfare and Care Workforce in Tasmania, Australia: 2011–2016" International Journal of Environmental Research and Public Health 18, no. 13: 7014. https://doi.org/10.3390/ijerph18137014
APA StyleJessup, B., Barnett, T., Obamiro, K., Cross, M., & Mseke, E. (2021). Review of the Health, Welfare and Care Workforce in Tasmania, Australia: 2011–2016. International Journal of Environmental Research and Public Health, 18(13), 7014. https://doi.org/10.3390/ijerph18137014