
Supporting Cross-Company Networks in Workplace Health Promotion through Social Network Analysis—Description of the Methodological Approach and First Results from a Model Project on Physical Activity Promotion in Germany

 , , and
Abstract
:1. Introduction
2. Materials and Methods
2.1. The KomRueBer Project
2.2. Objective and Research Questions of the SNA within the KomRueBer Project
- How can SNA be applied to depict the development and implementation of a cross-company network for promoting physical activity?
- How has the cross-company network for the promotion of physical activity developed over time?
2.3. SNA Approach
2.3.1. Defining Nodes and Edges
2.3.2. Identifying and Defining Network Members
2.4. Data Collection, Preparation, and Processing
2.4.1. Data Collection
2.4.2. Preparation of the Data
2.4.3. Processing of the Data
2.5. Analysis
3. First Results
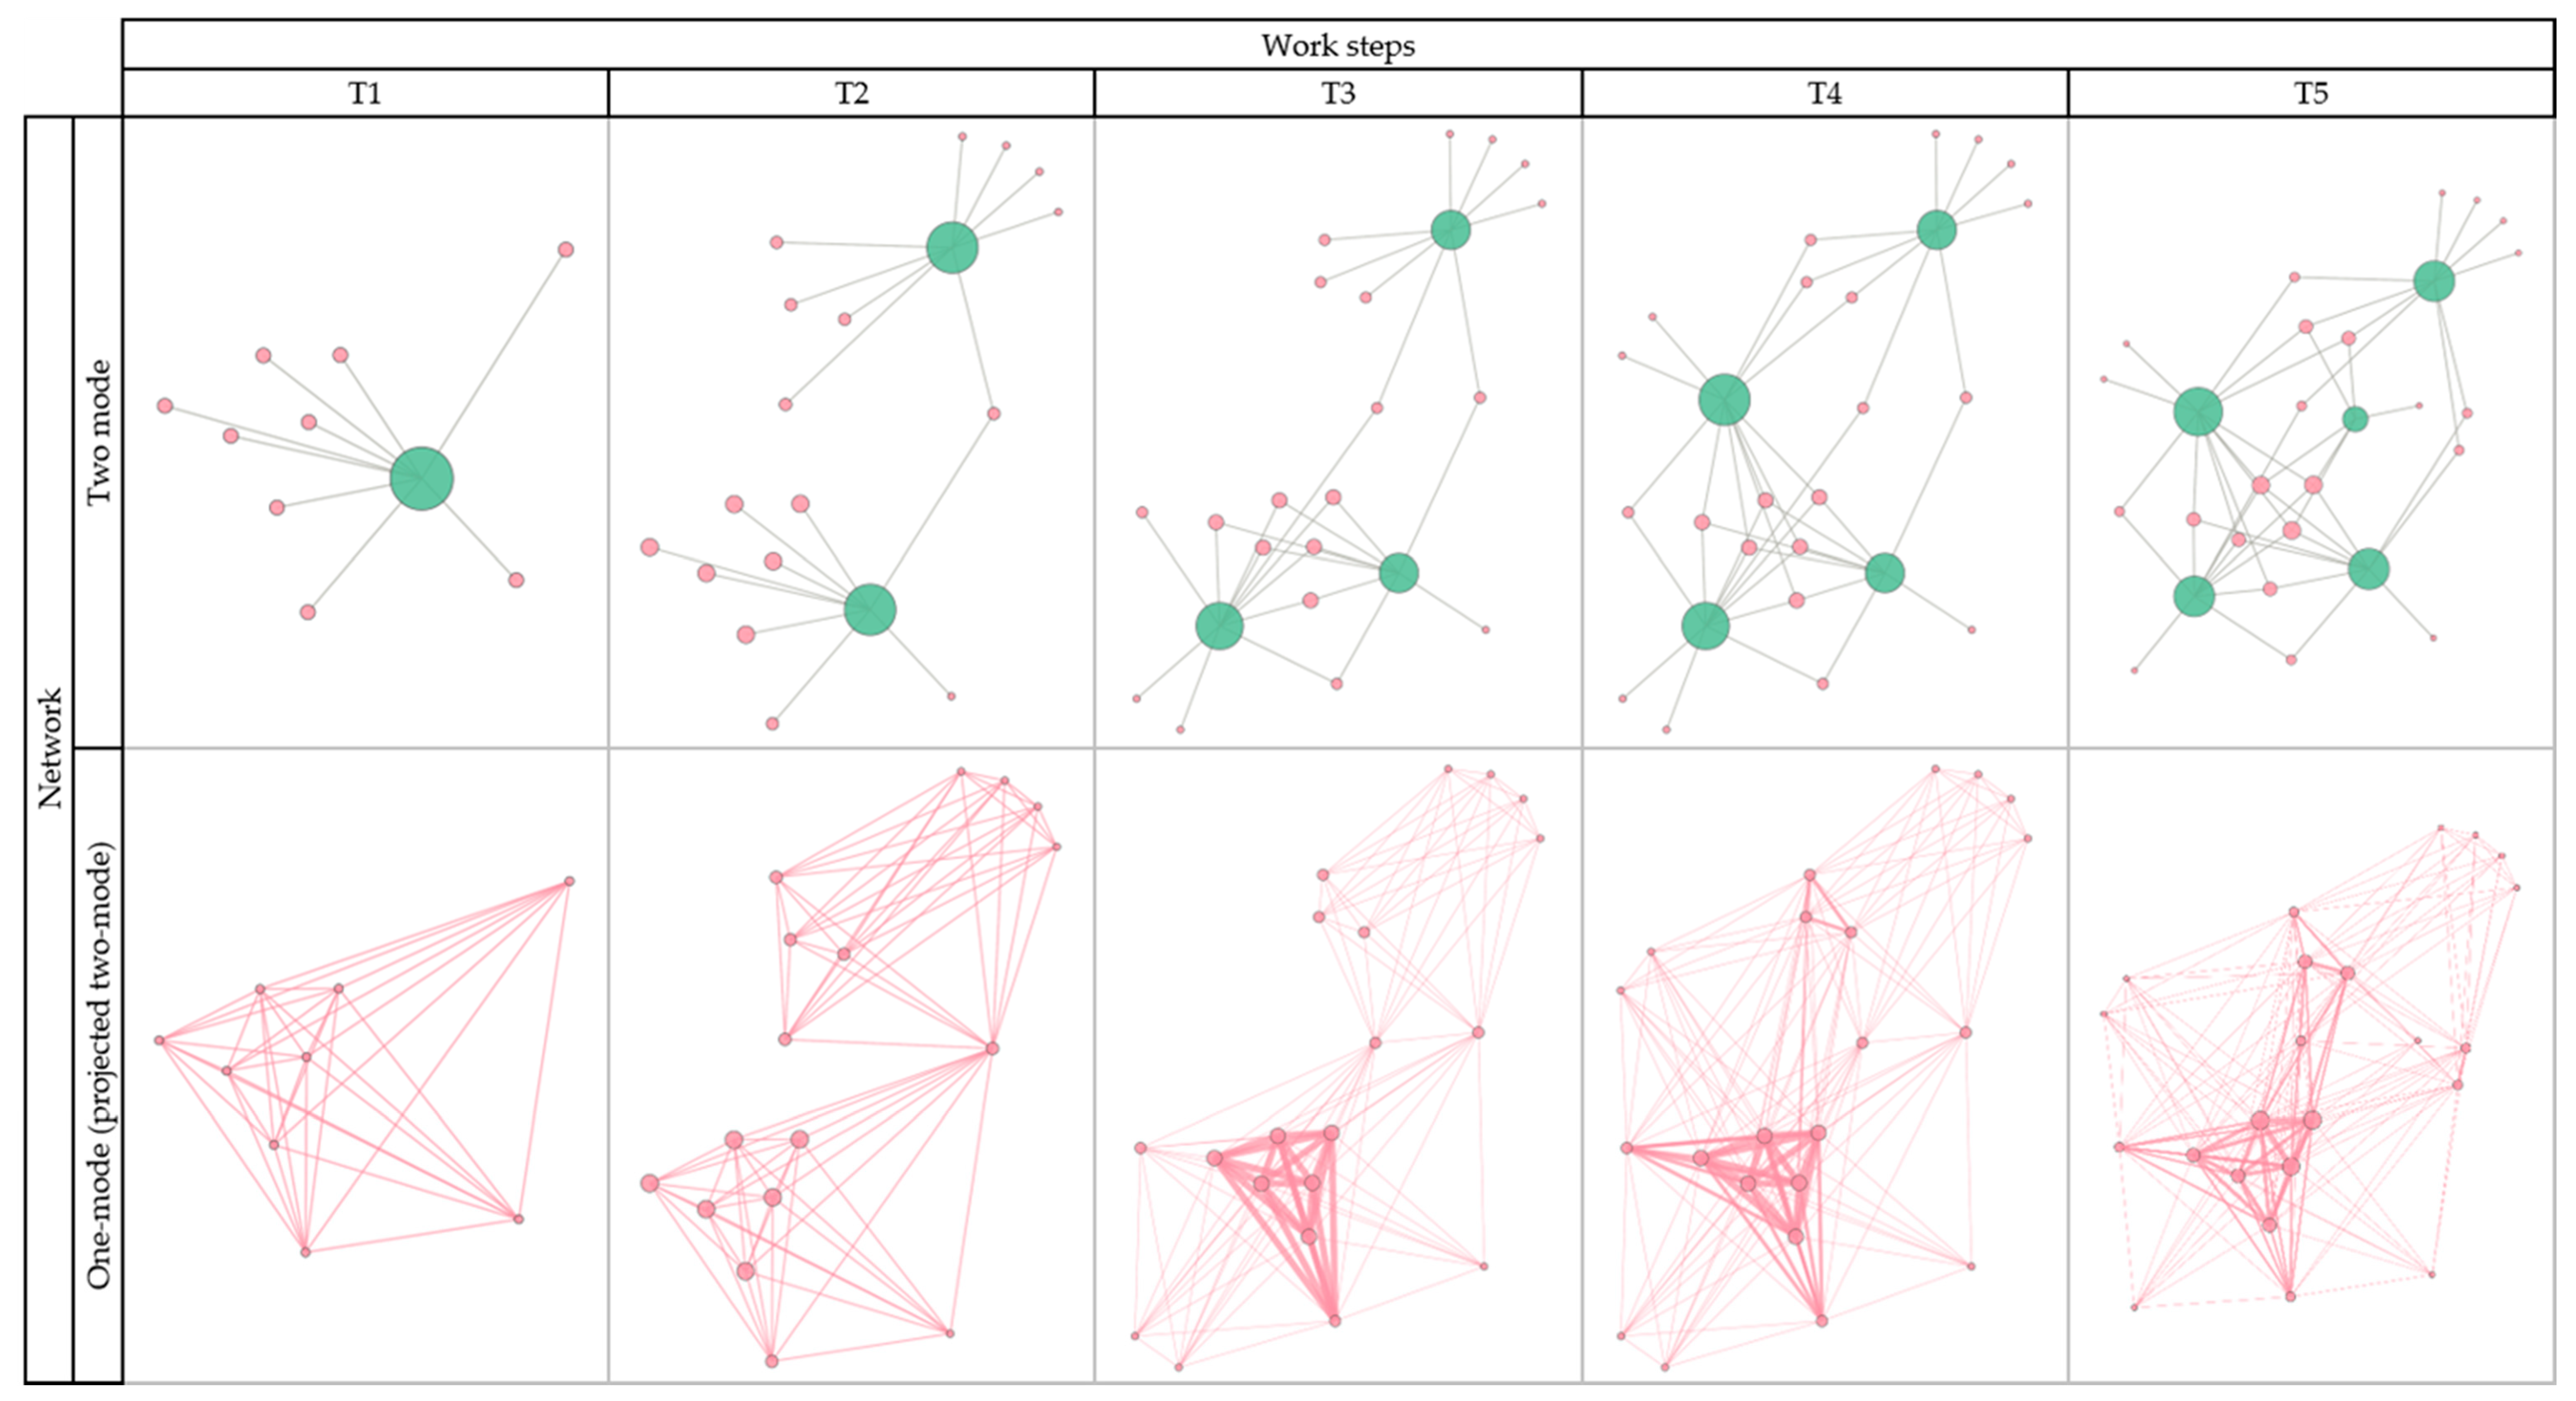
3.1. Visualization
3.2. Network Metrics
4. Discussion
4.1. Summary of Findings
4.2. Classification of the SNA Approach in the State of Research
4.3. KomRueBer Network Development
4.4. Practical Implications for the Development of Cross-Company Networks in WHP
4.5. Study Limitations and Strengths
5. Conclusions
Author Contributions
Funding
Institutional Review Board Statement
Informed Consent Statement
Data Availability Statement
Conflicts of Interest
References
- Gerlinger, T. Präventionsgesetz. Available online: https://www.leitbegriffe.bzga.de/alphabetisches-verzeichnis/praeventionsgesetz/ (accessed on 27 April 2021).
- Bauer, S.; Geiger, L.; Niggemann, R.; Seidel, J. Präventionsbericht 2020: Leistungen der Gesetzlichen Krankenversicherung: Primärprävention und Gesundheitsförderung. Leistungen der Sozialen Pflegeversicherung: Prävention in Stationären Pflegeeinrichtungen. Berichtsjahr 2019. Available online: https://www.gkv-spitzenverband.de/media/dokumente/krankenversicherung_1/praevention__selbsthilfe__beratung/praevention/praeventionsbericht/2020_GKV_MDS_Praeventionsbericht.pdf (accessed on 22 January 2021).
- Jordan, S.; Lippe, E. von der. Angebote der Prävention – Wer nimmt teil? GBE Kompakt 2012, 3, 1–9. [Google Scholar]
- Jordan, S.; Lippe, E. von der. Teilnahme an verhaltenspräventiven Maßnahmen: Ergebnisse der Studie zur Gesundheit Erwachsener in Deutschland (DEGS1). Bundesgesundheitsblatt Gesundh. Gesundh. 2013, 56, 878–884. [Google Scholar] [CrossRef] [Green Version]
- Schempp, N.; Strippel, H. Präventionsbericht 2016: Leistungen der Gesetzlichen Krankenversicherung: Primärprävention und Betriebliche Gesundheitsförderung. Berichtsjahr 2015. Available online: https://www.gkv-spitzenverband.de/media/dokumente/krankenversicherung_1/praevention__selbsthilfe__beratung/praevention/praeventionsbericht/2016_GKV_MDS_Praeventionsbericht.pdf (accessed on 22 January 2021).
- Statistisches Bundesamt. Beschäftigungsstatistik—Sozialversicherungspflichtig Beschäftigte am Arbeitsort. Available online: https://www.destatis.de/DE/Themen/Arbeit/Arbeitsmarkt/Erwerbstaetigkeit/Tabellen/insgesamt.html (accessed on 22 January 2021).
- Cernavin, O.; Schröter, W.; Stowasser, S. Prävention 4.0: Analysen und Handlungsempfehlungen für eine Produktive und Gesunde Arbeit 4.0; Springer: Wiesbaden, Germany, 2018; ISBN 978-3-658-17963-2. [Google Scholar]
- Taylor, A.W.; Pilkington, R.; Montgomerie, A.; Feist, H. The role of business size in assessing the uptake of health promoting workplace initiatives in Australia. BMC Public Health 2016, 16, 353. [Google Scholar] [CrossRef] [PubMed] [Green Version]
- Prietl, I.; Nöhammer, E. Gesundheitskompetenz im Betrieb im Kontext der betrieblichen Gesundheitsförderung. Präv. Gesundh. 2021, 155, 97. [Google Scholar] [CrossRef]
- Statista. Anzahl der Betriebe in Deutschland nach Größenklassen in den Jahren von 2009 bis 2018. Available online: https://de.statista.com/statistik/daten/studie/157401/umfrage/unternehmen-nach-groessenklasse-im-jahr-2009/ (accessed on 28 April 2021).
- Dale, A.M.; Enke, C.; Buckner-Petty, S.; Hipp, J.A.; Marx, C.; Strickland, J.; Evanoff, B. Availability and Use of Workplace Supports for Health Promotion Among Employees of Small and Large Businesses. Am. J. Health Promot. 2019, 33, 30–38. [Google Scholar] [CrossRef] [PubMed]
- Hente, L.; Schlesinger, T. Factors influencing the implementation of workplace health promotion in companies in rural areas. IJWHM 2021, 14, 242–259. [Google Scholar] [CrossRef]
- Williams, S.J.; Snow, D.M. Promoting health in small and medium-sized enterprises. J. Small Bus. Enterp. Dev. 2012, 19, 729–744. [Google Scholar] [CrossRef]
- Linnan, L.; Bowling, M.; Childress, J.; Lindsay, G.; Blakey, C.; Pronk, S.; Wieker, S.; Royall, P. Results of the 2004 National Worksite Health Promotion Survey. Am. J. Public Health 2008, 98, 1503–1509. [Google Scholar] [CrossRef]
- Handschuch, M.; Schreiner-Kürten, K.; Dr. Wanek, V. Leitfaden Prävention. Handlungsfelder und Kriterien nach § 20 Abs. 2 SGB V. Leitfaden Prävention in Stationären Pflegeeinrichtungen nach § 5 SGB XI. Available online: https://www.gkv-spitzenverband.de/media/dokumente/krankenversicherung_1/praevention__selbsthilfe__beratung/praevention/praevention_leitfaden/Leitfaden_Pravention_2020_barrierefrei.pdf (accessed on 22 January 2021).
- GKV-Spitzenverband. Betriebliche Gesundheitsförderung. Available online: https://www.gkv-spitzenverband.de/krankenversicherung/praevention_selbsthilfe_beratung/praevention_und_bgf/bgf/BGF_s.jsp (accessed on 27 April 2021).
- Hoffmann, C.; Stassen, G.; Schaller, A. Theory-Based, Participatory Development of a Cross-Company Network Promoting Physical Activity in Germany: A Mixed-Methods Approach. Int. J. Environ. Res. Public Health 2020, 17, 8952. [Google Scholar] [CrossRef] [PubMed]
- Jung, C.; Seidel, J.; Strippel, H. Präventionsbericht 2014: Leistungen der Gesetzlichen Krankenversicherung: Primärprävention und Betriebliche Gesundheitsförderung Berichtsjahr 2013. Available online: https://webcache.googleusercontent.com/search?q=cache:r_tnLVQBRxMJ:https://www.mds-ev.de/uploads/media/downloads/Praeventionsbericht_2014_01.pdf+&cd=1&hl=de&ct=clnk&gl=de&client=firefox-b-d (accessed on 18 May 2021).
- Leppin, A.L.; Okamoto, J.M.; Organick, P.W.; Thota, A.D.; Barrera-Flores, F.J.; Wieland, M.L.; McCoy, R.G.; Bonacci, R.P.; Montori, V.M. Applying Social Network Analysis to Evaluate Implementation of a Multisector Population Health Collaborative That Uses a Bridging Hub Organization. Front. Public Health 2018, 6, 315. [Google Scholar] [CrossRef] [PubMed]
- Valente, T.W.; Palinkas, L.A.; Czaja, S.; Chu, K.-H.; Brown, C.H. Social network analysis for program implementation. PLoS ONE 2015, 10, e0131712. [Google Scholar] [CrossRef] [PubMed] [Green Version]
- Mays, G.P.; Scutchfield, F.D.; Bhandari, M.W.; Smith, S.A. Understanding the organization of public health delivery systems: An empirical typology. Milbank Q. 2010, 88, 81–111. [Google Scholar] [CrossRef] [PubMed] [Green Version]
- Otte, E.; Rousseau, R. Social network analysis: A powerful strategy, also for the information sciences. J. Inf. Sci. 2002, 28, 441–453. [Google Scholar] [CrossRef]
- Wasserman, S.; Faust, K. Social Network Analysis: Methods and Applications; Reprinted; Cambridge University Press: Cambridge, UK, 1999; ISBN 0521387078. [Google Scholar]
- Robins, G.L. Doing Social Network Research: Network-Based Research Design for Social Scientists; SAGE Publications Ltd.: London, UK, 2015; ISBN 9781473916722. [Google Scholar]
- Cha, Y.; Cho, J. Social-network analysis using topic models. In Proceedings of the 35th international ACM SIGIR conference on Research and development in information retrieval—SIGIR ‘12, Portland, OR, USA, 12–16 August 2012. [Google Scholar]
- Wetherell, C.; Plakans, A.; Wellman, B. Social Networks, Kinship, and Community in Eastern Europe. J. Interdiscip. Hist. 1994, 24, 639. [Google Scholar] [CrossRef]
- Freemann, L.C. The Development of Social Network Analysis: A Study in the Sociology of Science; Empirical Press: Vancouver, BC, Canada, 2004; ISBN 1-59457-714-5. [Google Scholar]
- Chambers, D.; Wilson, P.; Thompson, C.; Harden, M. Social network analysis in healthcare settings: A systematic scoping review. PLoS ONE 2012, 7, e41911. [Google Scholar] [CrossRef]
- Miele, V.; Matias, C.; Robin, S.; Dray, S. Nine quick tips for analyzing network data. PLoS Comput. Biol. 2019, 15, e1007434. [Google Scholar] [CrossRef] [Green Version]
- Wäsche, H.; Dickson, G.; Woll, A.; Brandes, U. Social network analysis in sport research: An emerging paradigm. Eur. J. Sport Soc. 2017, 14, 138–165. [Google Scholar] [CrossRef]
- Smit, L.C.; Dikken, J.; Schuurmans, M.J.; de Wit, N.J.; Bleijenberg, N. Value of social network analysis for developing and evaluating complex healthcare interventions: A scoping review. BMJ Open 2020, 10, e039681. [Google Scholar] [CrossRef] [PubMed]
- de Brún, A.; McAuliffe, E. Social Network Analysis as a Methodological Approach to Explore Health Systems: A Case Study Exploring Support among Senior Managers/Executives in a Hospital Network. Int. J. Environ. Res. Public Health 2018, 15, 511. [Google Scholar] [CrossRef] [Green Version]
- Shelton, R.C.; Lee, M.; Brotzman, L.E.; Crookes, D.M.; Jandorf, L.; Erwin, D.; Gage-Bouchard, E.A. Use of social network analysis in the development, dissemination, implementation, and sustainability of health behavior interventions for adults: A systematic review. Soc. Sci. Med. 2019, 220, 81–101. [Google Scholar] [CrossRef]
- Bundesministerium für Gesundheit. Bewegung und Bewegungsförderung—Förderschwerpunkt. Available online: https://www.bundesgesundheitsministerium.de/service/begriffe-von-a-z/b/bewegung-und-bewegungsfoerderung.html (accessed on 2 March 2021).
- Rütten, A.; Wolff, A.R. BIG—Bewegung als Investition in Gesundheit: Gesundheitsförderung in der Kommune für Frauen in Schwierigen Lebenslagen; BIG-Manual; Bayerisches Landesamt für Gesundheit und Lebensmittelsicherheit: Erlangen, Germany, 2018. [Google Scholar]
- Rütten, A.; Röger, U.; Abu-Omar, K.; Frahsa, A. Empowerment von Frauen in sozial benachteiligten Lebenslagen: Das BIG-Projekt. Gesundheitswesen 2008, 70, 742–747. [Google Scholar] [CrossRef] [Green Version]
- Borgatti, S.P.; Everett, M.G.; Johnson, J.C. Analyzing Social Networks; Sage: Los Angeles, CA, USA, 2013; ISBN 1446247414. [Google Scholar]
- Valente, T.W. Social Networks and Health: Models, Methods, and Applications; Oxford University Press: Oxford, UK; New York, NY, USA, 2010; ISBN 0199719721. [Google Scholar]
- Kothari, A.; Hamel, N.; MacDonald, J.-A.; Meyer, M.; Cohen, B.; Bonnenfant, D. Exploring Community Collaborations: Social Network Analysis as a Reflective Tool for Public Health. Syst. Pract. Action Res. 2014, 27, 123–137. [Google Scholar] [CrossRef]
- Luke, D.A.; Harris, J.K. Network analysis in public health: History, methods, and applications. Annu. Rev. Public Health 2007, 28, 69–93. [Google Scholar] [CrossRef] [Green Version]
- Hindhede, A.L.; Aagaard-Hansen, J. Using Social Network Analysis as a Method to Assess and Strengthen Participation in Health Promotion Programs in Vulnerable Areas. Health Promot. Pract. 2017, 18, 175–183. [Google Scholar] [CrossRef] [PubMed]
- Klärner, A.; Gamper, M.; Keim-Klärner, S.; Moor, I.; von der Lippe, H.; Vonneilich, N. Soziale Netzwerke und gesundheitliche Ungleichheiten—eine neue Perspektive für die Forschung. In Soziale Netzwerke und Gesundheitliche Ungleichheiten: Eine neue Perspektive für die Forschung; Klärner, A., Gamper, M., Keim-Klärner, S., Moor, I., von der Lippe, H., Vonneilich, N., Eds.; Springer VS: Wiesbaden, Germany, 2020; pp. 1–30. ISBN 9783658216580. [Google Scholar]
- Cunningham, F.C.; Ranmuthugala, G.; Plumb, J.; Georgiou, A.; Westbrook, J.I.; Braithwaite, J. Health professional networks as a vector for improving healthcare quality and safety: A systematic review. BMJ Qual. Saf. 2012, 21, 239–249. [Google Scholar] [CrossRef] [PubMed] [Green Version]
- Britto, M.T.; Fuller, S.C.; Kaplan, H.C.; Kotagal, U.; Lannon, C.; Margolis, P.A.; Muething, S.E.; Schoettker, P.J.; Seid, M. Using a network organisational architecture to support the development of Learning Healthcare Systems. BMJ Qual. Saf. 2018, 27, 937–946. [Google Scholar] [CrossRef] [Green Version]
- Hawe, P.; Webster, C.; Shiell, A. A glossary of terms for navigating the field of social network analysis. J. Epidemiol. Community Health 2004, 58, 971–975. [Google Scholar] [CrossRef] [PubMed]
- Jansen, M.W.; van Oers, H.A.; Kok, G.; de Vries, N.K. Public health: Disconnections between policy, practice and research. Health Res. Policy Syst. 2010, 8, 37. [Google Scholar] [CrossRef] [Green Version]


| Phase According to the BIG Model | Step | Description of the Event | Date/Period |
|---|---|---|---|
| Pre-conception phase (proposal) | T1 | Letter of Intent | August 2018 (before project start) |
| Conception phase | T2 | On-site information and consultation | July–September 2019 |
| T3 | Stakeholder workshop | July 2019 | |
| T4 | Stakeholder workshop II | January 2020 | |
| Implementation phase | T5 | Steering group (digital meeting) | October 2020 |
| Name of the Person | Affiliation | Stakeholder Group | Participation in the Work Step | ||||
|---|---|---|---|---|---|---|---|
| T1 | T2 | T3 | T4 | T5 | |||
| AA | aa | Company | 1 | 1 | 0 | 0 | 0 |
| BB | bb | Exercise provider | 0 | 1 | 0 | 1 | 0 |
| Network Measure | Description |
|---|---|
| Network size | |
| Number of nodes | Total number of nodes |
| Number of edges (ties) | Total number of edges (ties) |
| Degree measures | |
| Average degree | Average of individual values of degree centrality (number of direct connections). |
| Average weighted degree | Average of individual values of degree centrality, considering edge weight (edge weight: sum of the edges between two nodes). |
| Distance measures | |
| Network diameter | The maximum distance or maximum number of steps between any pair of nodes in the graph (longest path). |
| Average path length | Average number of steps along the shortest paths for all possible pairs of network nodes. |
| Density and clustering measures | |
| Network density | Number of edges divided by the total possible edges; a measure of well connectedness of a network (complete = 1). |
| Total number of triads | A triad is given if a node’s two neighbors are connected to each other. |
| Average clustering coefficient | Degree to which the nodes of a network tend to cluster together; calculated by using “number of triangles” (complete = 1). |
| T1 Letter of Intent | T1 to T2 On-Site Information and Consultation | T1 to T3 Stakeholder Workshop | T1 to T4 Stakeholder Workshop II | T1 to T5 Steering Group (Digital Meeting) | |
|---|---|---|---|---|---|
| Number of nodes | 9 | 17 | 20 | 22 | 23 |
| Number of edges | 36 | 72 | 106 | 148 | 153 |
| Average degree | 8.0 | 8.5 | 10.6 | 13.5 | 13.3 |
| Average weighted degree | 8.0 | 8.5 | 12.7 | 17.5 | 18.1 |
| Network diameter | 1 | 2 | 2 | 2 | 2 |
| Average path length | 1.000 | 1.400 | 1.442 | 1.359 | 1.395 |
| Network density | 1.000 | 0.529 | 0.558 | 0.641 | 0.605 |
| Average clustering coefficient | 1.000 | 0.969 | 0.915 | 0.854 | 0.848 |
| Number of triads | 84 | 168 | 305 | 528 | 538 |
Publisher’s Note: MDPI stays neutral with regard to jurisdictional claims in published maps and institutional affiliations. |
© 2021 by the authors. Licensee MDPI, Basel, Switzerland. This article is an open access article distributed under the terms and conditions of the Creative Commons Attribution (CC BY) license (https://creativecommons.org/licenses/by/4.0/).
Share and Cite
Schaller, A.; Fohr, G.; Hoffmann, C.; Stassen, G.; Droste-Franke, B. Supporting Cross-Company Networks in Workplace Health Promotion through Social Network Analysis—Description of the Methodological Approach and First Results from a Model Project on Physical Activity Promotion in Germany. Int. J. Environ. Res. Public Health 2021, 18, 6874. https://doi.org/10.3390/ijerph18136874
Schaller A, Fohr G, Hoffmann C, Stassen G, Droste-Franke B. Supporting Cross-Company Networks in Workplace Health Promotion through Social Network Analysis—Description of the Methodological Approach and First Results from a Model Project on Physical Activity Promotion in Germany. International Journal of Environmental Research and Public Health. 2021; 18(13):6874. https://doi.org/10.3390/ijerph18136874
Chicago/Turabian StyleSchaller, Andrea, Gabriele Fohr, Carina Hoffmann, Gerrit Stassen, and Bert Droste-Franke. 2021. "Supporting Cross-Company Networks in Workplace Health Promotion through Social Network Analysis—Description of the Methodological Approach and First Results from a Model Project on Physical Activity Promotion in Germany" International Journal of Environmental Research and Public Health 18, no. 13: 6874. https://doi.org/10.3390/ijerph18136874
APA StyleSchaller, A., Fohr, G., Hoffmann, C., Stassen, G., & Droste-Franke, B. (2021). Supporting Cross-Company Networks in Workplace Health Promotion through Social Network Analysis—Description of the Methodological Approach and First Results from a Model Project on Physical Activity Promotion in Germany. International Journal of Environmental Research and Public Health, 18(13), 6874. https://doi.org/10.3390/ijerph18136874