
Regional Differences in Disability Incidence among Japanese Adults Aged 75 Years and Older: A 4-Year Prospective Cohort Study


Abstract
:1. Introduction
2. Materials and Methods
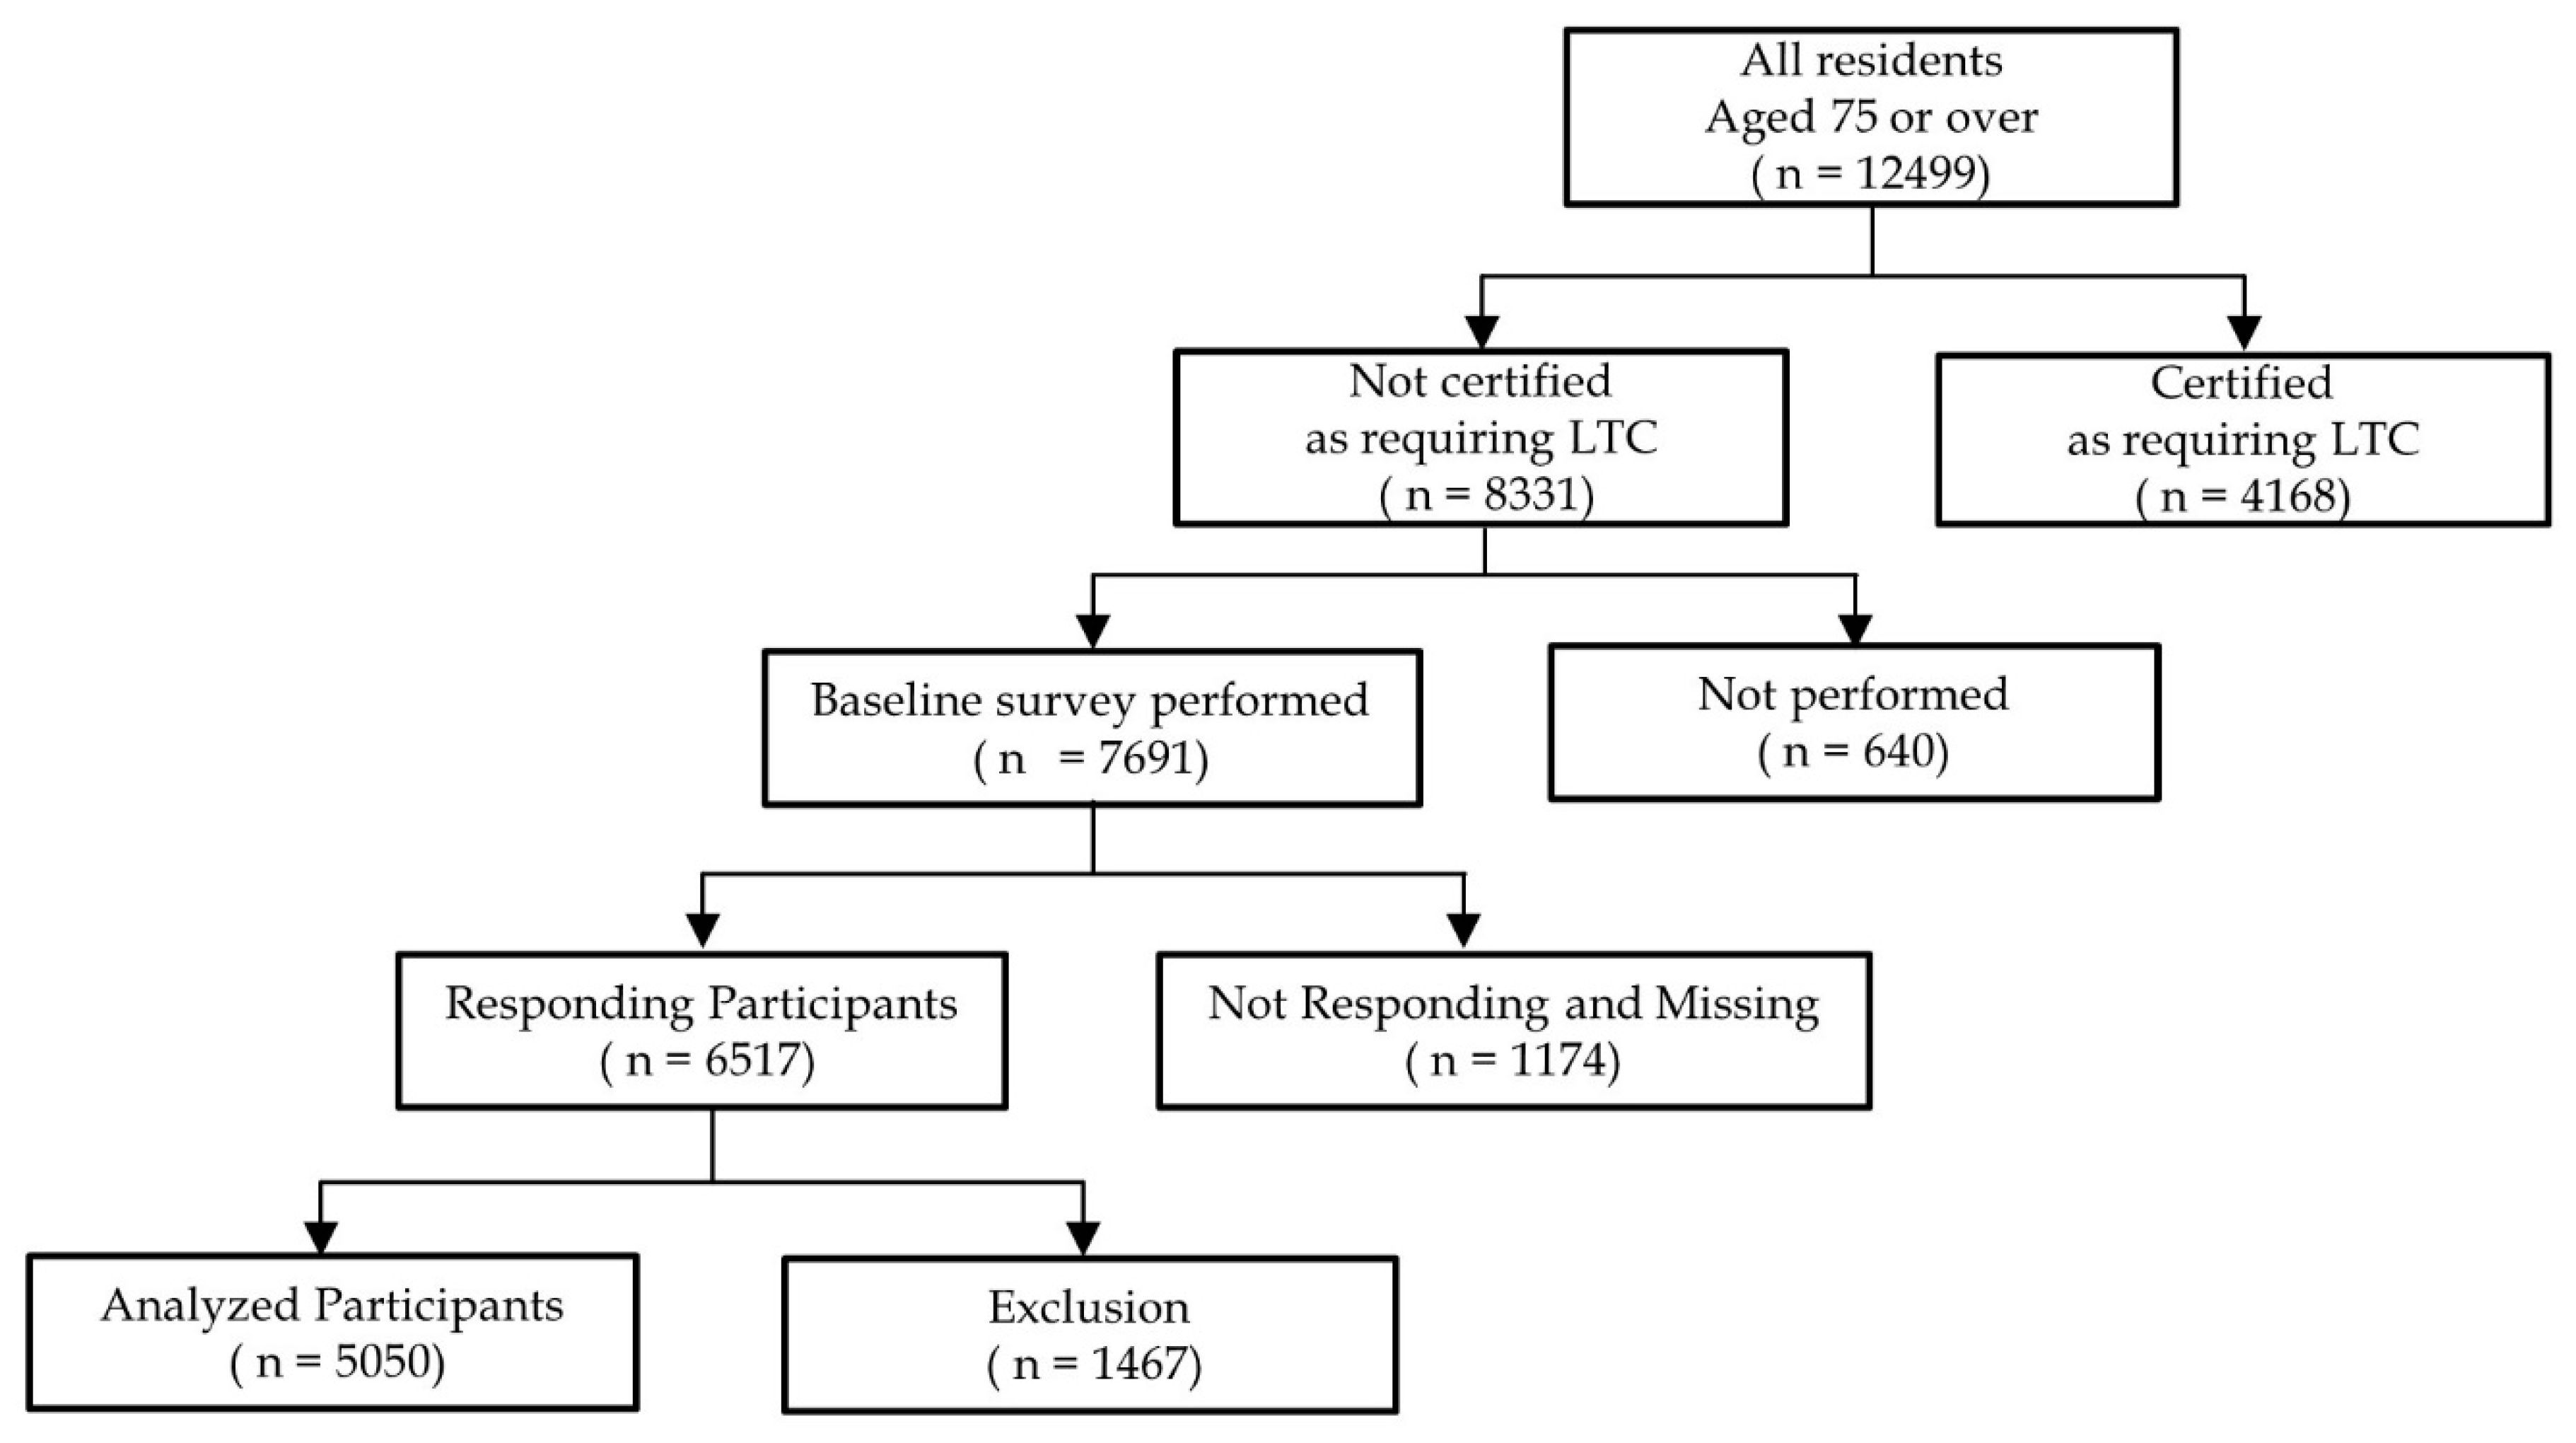
2.1. Study Design and Participants
2.2. Measurements of Functional Decline and Frailty Status
2.3. Measurements of Other Variables
2.4. Covariates
2.5. Outcome Measurements
2.6. School District
2.7. Statistical Analysis
3. Results
4. Discussion
5. Conclusions
Supplementary Materials
Author Contributions
Funding
Institutional Review Board Statement
Informed Consent Statement
Data Availability Statement
Acknowledgments
Conflicts of Interest
References
- World Health Organization. World Report on Ageing and Health. Available online: http://apps.who.int/iris/bitstream/10665/186463/1/9789240694811_eng.pdf?ua=1 (accessed on 15 May 2021).
- Arai, H.; Ouchi, Y.; Toba, K.; Endo, T.; Shimokado, K.; Tsubota, K.; Matsuo, S.; Mori, H.; Yumura, W.; Yokode, M.; et al. Japan as the front-runner of super-aged societies: Perspectives from medicine and medical care in Japan. Geriatr. Gerontol. Int. 2015, 15, 673–687. [Google Scholar] [CrossRef] [PubMed]
- Tas, U.; Steyerberg, E.W.; Bierma-Zeinstra, S.M.; Hofman, A.; Koes, B.W.; Verhagen, A.P. Age, gender and disability predict future disability in older people: The Rotterdam Study. BMC Geriatr. 2011, 11, 22. [Google Scholar] [CrossRef] [PubMed] [Green Version]
- Gill, T.M.; Han, L.; Gahbauer, E.A.; Leo-Summers, L.; Allore, H.G. Prognostic Effect of Changes in Physical Function Over Prior Year on Subsequent Mortality and Long-Term Nursing Home Admission. J. Am. Geriatr. Soc. 2018, 66, 1587–1591. [Google Scholar] [CrossRef] [PubMed]
- Liu, H.X.; Ding, G.; Yu, W.J.; Liu, T.F.; Yan, A.Y.; Chen, H.Y.; Zhang, A.H. Association between frailty and incident risk of disability in community-dwelling elder people: Evidence from a meta-analysis. Public Health 2019, 175, 90–100. [Google Scholar] [CrossRef] [PubMed]
- Kojima, G. Frailty as a predictor of disabilities among community-dwelling older people: A systematic review and meta-analysis. Disabil. Rehabil. 2017, 39, 1897–1908. [Google Scholar] [CrossRef] [PubMed]
- Dent, E.; Morley, J.E.; Cruz-Jentoft, A.J.; Woodhouse, L.; Rodríguez-Mañas, L.; Fried, L.P.; Woo, J.; Aprahamian, I.; Sanford, A.; Lundy, J.; et al. Physical Frailty: ICFSR International Clinical Practice Guidelines for Identification and Management. J. Nutr. Health Aging 2019, 23, 771–787. [Google Scholar] [CrossRef] [Green Version]
- Makizako, H.; Shimada, H.; Doi, T.; Tsutsumimoto, K.; Suzuki, T. Impact of physical frailty on disability in community-dwelling older adults: A prospective cohort study. BMJ Open 2015, 5, e008462. [Google Scholar] [CrossRef]
- Makizako, H.; Shimada, H.; Doi, T.; Tsutumimoto, K.; Yoshida, D.; Suzuki, T. Effects of a community disability prevention program for frail older adults at 48-month follow up. Geriatr. Gerontol. Int. 2017, 17, 2347–2353. [Google Scholar] [CrossRef]
- Kojima, G.; Iliffe, S.; Taniguchi, Y.; Shimada, H.; Rakugi, H.; Walters, K. Prevalence of frailty in Japan: A systematic review and meta-analysis. J. Epidemiol. 2017, 27, 347–353. [Google Scholar] [CrossRef] [Green Version]
- Kojima, G.; Taniguchi, Y.; Iliffe, S.; Urano, T.; Walters, K. Factors Associated With Improvement in Frailty Status Defined Using the Frailty Phenotype: A Systematic Review and Meta-analysis. J. Am. Med. Dir. Assoc. 2019, 20, 1647–1649.e2. [Google Scholar] [CrossRef]
- Kojima, G.; Taniguchi, Y.; Kitamura, A.; Fujiwara, Y. Is living alone a risk factor of frailty? A systematic review and meta-analysis. Ageing Res. Rev. 2020, 59, 101048. [Google Scholar] [CrossRef]
- Sato, K.; Ikeda, T.; Watanabe, R.; Kondo, N.; Kawachi, I.; Kondo, K. Intensity of community-based programs by long-term care insurers and the likelihood of frailty: Multilevel analysis of older Japanese adults. Soc. Sci. Med. 2020, 245, 112701. [Google Scholar] [CrossRef] [PubMed]
- Saito, M.; Kondo, N.; Aida, J.; Kawachi, I.; Koyama, S.; Ojima, T.; Kondo, K. Development of an instrument for community-level health related social capital among Japanese older people: The JAGES Project. J. Epidemiol. 2017, 27, 221–227. [Google Scholar] [CrossRef] [PubMed]
- Arai, H.; Satake, S. English translation of the Kihon Checklist. Geriatr. Gerontol. Int. 2015, 15, 518–519. [Google Scholar] [CrossRef] [PubMed]
- Sewo Sampaio, P.Y.; Sampaio, R.A.; Yamada, M.; Arai, H. Systematic review of the Kihon Checklist: Is it a reliable assessment of frailty? Geriatr. Gerontol. Int. 2016, 16, 893–902. [Google Scholar] [CrossRef]
- Satake, S.; Shimokata, H.; Senda, K.; Kondo, I.; Arai, H.; Toba, K. Predictive Ability of Seven Domains of the Kihon Checklist for Incident Dependency and Mortality. J. Frailty Aging 2019, 8, 85–87. [Google Scholar] [CrossRef]
- Satake, S.; Shimokata, H.; Senda, K.; Kondo, I.; Toba, K. Validity of Total Kihon Checklist Score for Predicting the Incidence of 3-Year Dependency and Mortality in a Community-Dwelling Older Population. J. Am. Med. Dir. Assoc 2017, 18, 552.e1–552.e6. [Google Scholar] [CrossRef]
- Satake, S.; Senda, K.; Hong, Y.J.; Miura, H.; Endo, H.; Sakurai, T.; Kondo, I.; Toba, K. Validity of the Kihon Checklist for assessing frailty status. Geriatr. Gerontol. Int. 2016, 16, 709–715. [Google Scholar] [CrossRef]
- Satake, S.; Shimada, H.; Yamada, M.; Kim, H.; Yoshida, H.; Gondo, Y.; Matsubayashi, K.; Matsushita, E.; Kuzuya, M.; Kozaki, K.; et al. Prevalence of frailty among community-dwellers and outpatients in Japan as defined by the Japanese version of the Cardiovascular Health Study criteria. Geriatr. Gerontol. Int. 2017, 17, 2629–2634. [Google Scholar] [CrossRef]
- Tsutsui, T.; Muramatsu, N. Care-needs certification in the long-term care insurance system of Japan. J. Am. Geriatr. Soc. 2005, 53, 522–527. [Google Scholar] [CrossRef]
- Haberman, S.J. The Analysis of Residuals in Cross-Classified Tables. Biometrics 1973, 29, 205–220. [Google Scholar] [CrossRef]
- Taniguchi, Y.; Kitamura, A.; Nofuji, Y.; Ishizaki, T.; Seino, S.; Yokoyama, Y.; Shinozaki, T.; Murayama, H.; Mitsutake, S.; Amano, H.; et al. Association of Trajectories of Higher-Level Functional Capacity with Mortality and Medical and Long-Term Care Costs Among Community-Dwelling Older Japanese. J. Gerontol. A Biol. Sci. Med. Sci. 2019, 74, 211–218. [Google Scholar] [CrossRef]
- Spiers, N.A.; Matthews, R.J.; Jagger, C.; Matthews, F.E.; Boult, C.; Robinson, T.G.; Brayne, C. Diseases and impairments as risk factors for onset of disability in the older population in England and Wales: Findings from the Medical Research Council Cognitive Function and Ageing Study. J. Gerontol. A Biol. Sci. Med. Sci. 2005, 60, 248–254. [Google Scholar] [CrossRef] [PubMed]
- Kanamori, S.; Kai, Y.; Aida, J.; Kondo, K.; Kawachi, I.; Hirai, H.; Shirai, K.; Ishikawa, Y.; Suzuki, K.; The, J.G. Social Participation and the Prevention of Functional Disability in Older Japanese: The JAGES Cohort Study. PLoS ONE 2014, 9, e99638. [Google Scholar] [CrossRef] [PubMed]
- Trevisan, C.; Veronese, N.; Maggi, S.; Baggio, G.; Toffanello, E.D.; Zambon, S.; Sartori, L.; Musacchio, E.; Perissinotto, E.; Crepaldi, G.; et al. Factors Influencing Transitions Between Frailty States in Elderly Adults: The Progetto Veneto Anziani Longitudinal Study. J. Am. Geriatr. Soc. 2017, 65, 179–184. [Google Scholar] [CrossRef] [PubMed]
- Chang, S.F.; Cheng, C.L.; Lin, H.C. Frail Phenotype and Disability Prediction in Community-Dwelling Older People A Systematic Review and Meta-Analysis of Prospective Cohort Studies. J. Nurs. Res. 2019, 27, e28. [Google Scholar] [CrossRef]
- He, B.; Ma, Y.; Wang, C.; Jiang, M.; Geng, C.; Chang, X.; Ma, B.; Han, L. Prevalence and Risk Factors for Frailty Among Community-Dwelling Older People in China A Systematic Review and Meta-Analysis. J. Nutr. Health Aging 2019, 23, 442–450. [Google Scholar] [CrossRef]
- Baicker, K.; Chandra, A. Evidence-Based Health Policy. N. Engl. J. Med. 2017, 377, 2413–2415. [Google Scholar] [CrossRef]
- Yamada, M.; Arai, H. Self-Management Group Exercise Extends Healthy Life Expectancy in Frail Community-Dwelling Older Adults. Int. J. Environ. Res. Public Health 2017, 14, 531. [Google Scholar] [CrossRef] [Green Version]
- Yamada, M.; Arai, H.; Sonoda, T.; Aoyama, T. Community-based exercise program is cost-effective by preventing care and disability in Japanese frail older adults. J. Am. Med. Dir. Assoc. 2012, 13, 507–511. [Google Scholar] [CrossRef]
- Prasad, A.; Kano, M.; Dagg, K.A.; Mori, H.; Senkoro, H.H.; Ardakani, M.A.; Elfeky, S.; Good, S.; Engelhardt, K.; Ross, A.; et al. Prioritizing action on health inequities in cities: An evaluation of Urban Health Equity Assessment and Response Tool (Urban HEART) in 15 cities from Asia and Africa. Soc. Sci. Med. 2015, 145, 237–242. [Google Scholar] [CrossRef] [PubMed] [Green Version]

| Variable | Total | Independent | Incident Disability | p-Value | |||
|---|---|---|---|---|---|---|---|
| (n = 5050) | (n = 4483) | (n = 567) | |||||
| Age, years | <0.001 | ||||||
| 75–79, n (%) | 3002 | (59.4) | 2777 | (61.9) | 255 | (39.7) | |
| 80–84, n (%) | 1475 | (29.2) | 1273 | (28.4) | 202 | (35.6) | |
| 85–89, n (%) | 489 | (9.7) | 378 | (8.4) | 111 | (19.6) | |
| 90+, n (%) | 84 | (1.7) | 55 | (1.2) | 29 | (5.1) | |
| Female, n (%) | 2538 | (50.3) | 2197 | (49.0) | 341 | (60.1) | <0.001 |
| Living alone, n (%) | 765 | (15.1) | 659 | (14.7) | 106 | (18.7) | 0.008 |
| Medical history | |||||||
| Hypertension, n (%) | 2267 | (44.9) | 1995 | (44.5) | 272 | (48.0) | 0.064 |
| Diabetes mellitus, n (%) | 563 | (11.1) | 492 | (11.0) | 71 | (12.5) | 0.151 |
| Heart Disease, n (%) | 566 | (11.2) | 489 | (10.9) | 78 | (13.8) | 0.027 |
| Stroke, n (%) | 76 | (1.5) | 61 | (1.4) | 15 | (2.6) | 0.02 |
| Respiratory Disease, n (%) | 223 | (4.4) | 192 | (4.3) | 31 | (5.5) | 0.12 |
| Fracture and Arthritis, n (%) | 689 | (13.6) | 578 | (12.9) | 111 | (19.6) | <0.001 |
| KCL assessment † | |||||||
| IADL decline, n (%) | 210 | (4.2) | 154 | (3.4) | 56 | (9.9) | <0.001 |
| Physical decline, n (%) | 812 | (16.1) | 640 | (14.3) | 172 | (30.3) | <0.001 |
| Malnutrition, n (%) | 103 | (2.0) | 82 | (1.8) | 21 | (3.7) | 0.004 |
| Oral dysfunction, n (%) | 885 | (17.5) | 751 | (16.8) | 134 | (23.6) | <0.001 |
| Homebound, n (%) | 274 | (5.4) | 212 | (4.7) | 62 | (10.9) | <0.001 |
| Cognitive decline, n (%) | 1515 | (30.0) | 1307 | (29.2) | 208 | (36.7) | <0.001 |
| Depressive mood, n (%) | 1357 | (26.9) | 950 | (21.2) | 189 | (33.3) | <0.001 |
| History of fall (past a year), n (%) | 851 | (16.9) | 713 | (15.9) | 138 | (24.3) | <0.001 |
| Fear of falling, n (%) | 2091 | (41.4) | 1769 | (39.5) | 322 | (56.8) | <0.001 |
| Frailty ‡ | |||||||
| Robust, n (%) | 2901 | (57.4) | 2681 | (59.8) | 220 | (38.8) | <0.001 |
| Pre-frailty, n (%) | 1384 | (27.4) | 1202 | (26.8) | 182 | (32.1) | |
| Frailty, n (%) | 765 | (15.1) | 600 | (13.4) | 165 | (29.1) | |
| Social capital | |||||||
| Community trust, n (%) | 4332 | (85.8) | 3864 | (86.2) | 468 | (82.5) | 0.013 |
| Interaction with neighbors, n (%) | 3571 | (70.7) | 3184 | (71.0) | 387 | (68.3) | 0.095 |
| Social participation, n (%) | 2632 | (52.1) | 2387 | (53.2) | 245 | (43.2) | <0.001 |
| multiple, n (%) | 1129 | (22.4) | 1048 | (23.4) | 81 | (14.3) | <0.001 |
| Total | A | B | C | D | E | F | G | H | I | J | K | L | |
|---|---|---|---|---|---|---|---|---|---|---|---|---|---|
| Participants, n (%) | 5050 (100.0) | 433 (8.6) | 290 (5.7) | 636 (12.6) | 582 (11.5) | 549 (10.9) | 535 (10.6) | 330 (6.5) | 368 (7.3) | 483 (9.6) | 286 (5.7) | 318 (6.3) | 240 (4.8) |
| Frailty † | |||||||||||||
| Robust at baseline, n (%) | 2901 (57.4) | 265 (61.2) | 166 (57.2) | 343 (53.9) | 332 (57.0) | 345 (62.8) | 311 (58.1) | 189 (57.3) | 222 (60.3) | 266 (55.1) | 170 (59.4) | 174 (54.7) | 118 (49.2) |
| Prefrail at baseline, n (%) | 1384 (27.4) | 115 (26.6) | 82 (28.3) | 193 (30.3) | 163 (28.0) | 139 (25.3) | 140 (26.2) | 83 (25.2) | 90 (24.5) | 147 (30.4) | 74 (25.9) | 94 (29.6) | 64 (26.7) |
| Frail at baseline, n (%) | 765 (15.1) | 53 (12.2) | 42 (14.5) | 100 (15.7) | 87 (14.9) | 65 * (11.8) | 84 (15.7) | 58 (17.6) | 56 (15.2) | 70 (14.5) | 42 (14.7) | 50 (15.7) | 58 ** (24.2) |
| Adjusted residual | p = 0.009 | −1.80 | −0.30 | 0.40 | −0.10 | −2.30 | 0.40 | 1.30 | 0.00 | −0.40 | −0.20 | 0.30 | 4.00 |
| Disability | |||||||||||||
| follow-up years | 3.89 | 3.94 | 3.91 | 3.92 | 3.91 | 3.89 | 3.91 | 3.87 | 3.87 | 3.89 | 3.88 | 3.81 | 3.84 |
| Disability within 4 years, n (%) | 567 (11.2) | 35 * (8.1) | 25 (8.6) | 61 (9.6) | 58 (10.0) | 61 (11.1) | 62 (11.6) | 39 (11.8) | 47 (12.8) | 63 (13.0) | 38 (13.3) | 43 (13.5) | 35 (14.6) |
| Adjusted residual | p = 0.102 | −2.17 | −1.45 | −1.40 | −1.03 | −0.09 | 0.28 | 0.35 | 0.97 | 1.33 | 1.14 | 1.34 | 1.69 |
| Disability from Robust within 4 years, n (%) | 220 (7.6) | 14 (5.3) | 10 (6.0) | 18 (5.3) | 26 (7.8) | 29 (8.4) | 22 (7.1) | 13 (6.9) | 21 (9.5) | 23 (8.7) | 22 ** (12.9) | 15 (8.6) | 7 (5.9) |
| Adjusted residual | p = 0.178 | −1.48 | −0.78 | −1.74 | 0.18 | 0.62 | −0.36 | −0.38 | 1.10 | 0.69 | 2.72 | 0.53 | −0.69 |
| Disability from Prefrail within 4 years, n (%) | 182 (13.2) | 13 (11.3) | 11 (13.4) | 22 (11.4) | 16 (9.8) | 18 (12.9) | 20 (14.3) | 16 (19.3) | 11 (12.2) | 22 (15.0) | 9 (12.2) | 14 (14.9) | 10 (15.6) |
| Adjusted residual | p = 0.839 | −0.61 | 0.07 | −0.78 | −1.34 | −0.07 | 0.42 | 1.70 | −0.27 | 0.69 | −0.26 | 0.52 | 0.60 |
| Disability from frail within 4 years, n (%) | 165 (21.6) | 8 (15.1) | 4 (9.5) | 21 (21.0) | 16 (18.4) | 14 (21.5) | 20 (23.8) | 10 (17.2) | 15 (26.8) | 18 (25.7) | 7 (16.7) | 14 (28.0) | 18 (31.0) |
| Adjusted residual | p = 0.303 | −1.19 | −1.95 | −0.15 | −0.77 | −0.01 | 0.53 | −0.83 | 0.99 | 0.89 | −0.80 | 1.14 | 1.82 |
| Disability, 1000 person-year | 28.8 | 20.5 | 22.1 | 24.5 | 25.5 | 28.6 | 29.7 | 30.5 | 33 | 33.6 | 34.3 | 35.5 | 38 |
| Variable | Model 1 | Model 2 | Model 3 | Model 4 | ||||
|---|---|---|---|---|---|---|---|---|
| HR (95% CI) | p-Value | HR (95% CI) | p-Value | HR (95% CI) | p-Value | HR (95% CI) | p-Value | |
| Age, years | ||||||||
| 75–79 | ref. | ref. | ref. | ref. | ||||
| 80–84 | 1.89 (1.56–2.28) | <0.001 | 1.72 (1.42–2.09) | <0.001 | 1.70 (1.41–2.06) | <0.001 | 1.72 (1.42–2.08) | <0.001 |
| 85–89 | 3.31 (2.63–4.15) | <0.001 | 2.67 (2.11–3.38) | <0.001 | 2.64 (2.08–3.34) | <0.001 | 2.67 (2.10–3.38) | <0.001 |
| 90+ | 5.59 (3.79–8.23) | <0.001 | 3.81 (2.53–5.72) | <0.001 | 3.71 (2.46–5.57) | <0.001 | 3.74 (2.48–5.64) | <0.001 |
| Female | 1.41 (1.18–1.67) | <0.001 | 1.30 (1.08–1.56) | 0.005 | 1.29 (1.07–1.56) | 0.007 | 1.28 (1.07–1.55) | 0.005 |
| Living alone | 1.11 (0.89–1.38) | 0.345 | 1.13 (0.91–1.41) | 0.261 | 1.15 (0.92–1.43) | 0.22 | 1.16 (0.93–1.44) | 0.198 |
| Medical history | ||||||||
| Stroke | 1.80 (1.07–3.05) | 0.028 | 1.84 (1.09–3.11) | 0.023 | 1.84 (1.09–3.12) | 0.023 | ||
| Frailty † | ||||||||
| Robust | ref. | ref. | ref. | |||||
| Pre-frailty | 1.47 (1.17–1.85) | 0.001 | 1.44 (1.14–1.81) | 0.002 | 1.45 (1.15–1.82) | 0.002 | ||
| Frailty | 1.99 (1.39–2.84) | <0.001 | 1.89 (1.32–2.71) | <0.001 | 1.91 (1.33–2.74) | <0.001 | ||
| Social capital | ||||||||
| Social participation | 0.71 (0.56–0.90) | 0.006 | 0.72 (0.56–0.91) | 0.007 | ||||
| (multiple) | ||||||||
| District | ||||||||
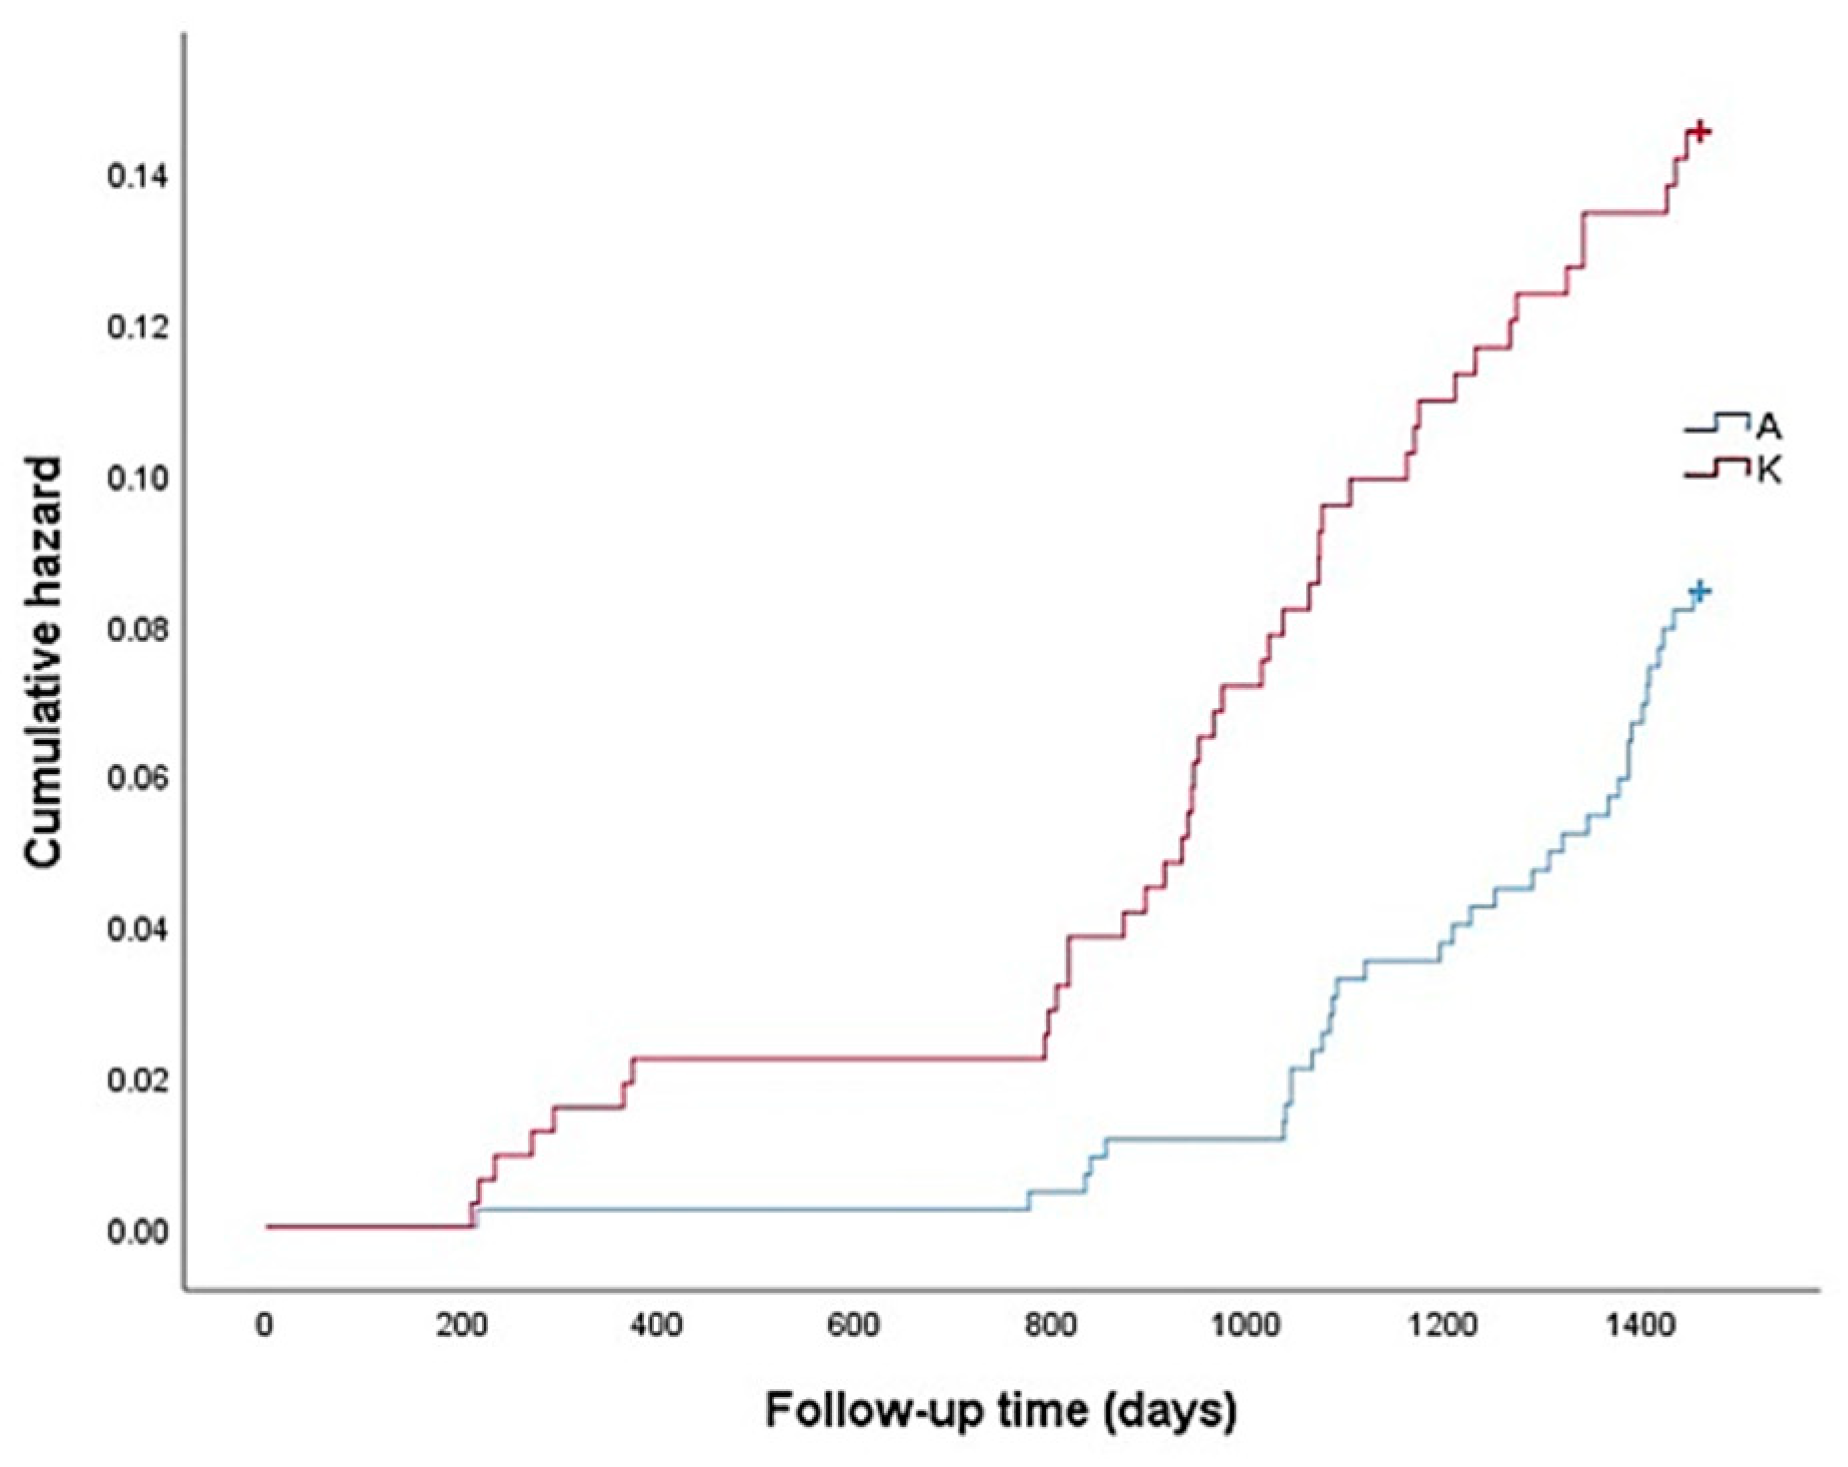
| A | ref. | |||||||
| K | 1.67 (1.06–2.61) | 0.026 | ||||||
Publisher’s Note: MDPI stays neutral with regard to jurisdictional claims in published maps and institutional affiliations. |
© 2021 by the authors. Licensee MDPI, Basel, Switzerland. This article is an open access article distributed under the terms and conditions of the Creative Commons Attribution (CC BY) license (https://creativecommons.org/licenses/by/4.0/).
Share and Cite
Matsumoto, D.; Takatori, K. Regional Differences in Disability Incidence among Japanese Adults Aged 75 Years and Older: A 4-Year Prospective Cohort Study. Int. J. Environ. Res. Public Health 2021, 18, 6791. https://doi.org/10.3390/ijerph18136791
Matsumoto D, Takatori K. Regional Differences in Disability Incidence among Japanese Adults Aged 75 Years and Older: A 4-Year Prospective Cohort Study. International Journal of Environmental Research and Public Health. 2021; 18(13):6791. https://doi.org/10.3390/ijerph18136791
Chicago/Turabian StyleMatsumoto, Daisuke, and Katsuhiko Takatori. 2021. "Regional Differences in Disability Incidence among Japanese Adults Aged 75 Years and Older: A 4-Year Prospective Cohort Study" International Journal of Environmental Research and Public Health 18, no. 13: 6791. https://doi.org/10.3390/ijerph18136791
APA StyleMatsumoto, D., & Takatori, K. (2021). Regional Differences in Disability Incidence among Japanese Adults Aged 75 Years and Older: A 4-Year Prospective Cohort Study. International Journal of Environmental Research and Public Health, 18(13), 6791. https://doi.org/10.3390/ijerph18136791