Article

Modelling the Relationship between the Nature of Work Factors and Driving Performance Mediating by Role of Fatigue

by
Al-Baraa Abdulrahman Al-Mekhlafi
1,*,
Ahmad Shahrul Nizam Isha
1,
Nicholas Chileshe
2,
Mohammed Abdulrab
3,
Anwar Ameen Hezam Saeed
4 and
Ahmed Farouk Kineber
5
1
Department of Management & Humanities, Universiti Teknologi PETRONAS, Seri Iskandar 32610, Perak, Malaysia
2
UniSA STEM, Scarce Resources and Circular Economy (ScaRCE), University of South Australia, Adelaide 5001, Australia
3
Management Department, Community College of Qatar, Doha 00974, Qatar
4
Department of Chemical Engineering, Universiti Teknologi PETRONAS, Seri Iskandar 32610, Perak, Malaysia
5
Department of Civil & Environmental Engineering, Universiti Teknologi PETRONAS, Seri Iskandar 32610, Perak, Malaysia
*
Author to whom correspondence should be addressed.
Int. J. Environ. Res. Public Health 2021, 18(13), 6752; https://doi.org/10.3390/ijerph18136752
Submission received: 27 April 2021 / Revised: 9 June 2021 / Accepted: 17 June 2021 / Published: 23 June 2021
(This article belongs to the Special Issue Driving Behaviors and Road Safety)

Abstract

:
Driving fatigue is a serious issue for the transportation sector, decreasing the driver’s performance and increasing accident risk. This study aims to investigate how fatigue mediates the relationship between the nature of work factors and driving performance. The approach included a review of the previous studies to select the dimensional items for the data collection instrument. A pilot test to identify potential modification to the questionnaire was conducted, then structural equation modelling (SEM) was performed on a stratified sample of 307 drivers, to test the suggested hypotheses. Based on the results, five hypotheses have indirect relationships, four of which have a significant effect. Besides, the results show that driving fatigue partially mediates the relationship between the work schedule and driving performance and fully mediates in the relationship between work activities and driving performance. The nature of work and human factors is the most common reason related to road accidents. Therefore, the emphasis on driving performance and fatigue factors would thereby lead to preventing fatal crashes and life loss.

1. Introduction

Fatigue is a chronic biochemical issue that affects all drivers, and it is thought to be a major cause of traffic accidents. Fatigue has been linked to 10–20% of serious injuries, according to reports [1,2,3,4]. Sleep-related variables such as the circadian rhythm (i.e., time of day) and sleep restriction are strongly linked to driver fatigue [5]. Employers should be aware of their current fatigue rate, which would be linked to work design, prolonged periods of physical or mental effort, insufficient break time between shifts, and insufficient rest. The attention of drivers in driving duties can contribute immensely to the enhancement of their alertness performance [6]. Oil and gas truck drivers were one of the occupations with a significant risk of fatigue. As a result, safety and protection are critical, as the risk of an accident in this sector is high [7]; further, the severity of crashes of the heavy vehicle leads to huge casualties and losses of the property, as they often occur near or within residential areas [8,9]. Workplace safety is one of the most significant concerns that organizations must address since it is one of the most critical aspects in determining a company’s success. Accidents at work result in major business losses, such as injuries, asset damage, and productivity loss [10].
In the oil and gas transportation sector, work schedule and work activities are considered as risk factors for driving performance. Work in the schedule shifts has decreased drivers performance because of circadian rhythm disruptions [11]. According to Adams-Guppy [12], extended driving time is highly associated with the poor performance of drivers in the urban areas for professional drivers. Besides, there are many activities drivers have to perform besides driving, contributing to decreasing driving performance, such as filling fuel for the tanker, checking everything before moving, loading the order in the supplier terminal, downloading the order in customer stations, taking care of order invoices and cleaning the tanker when the driver comes back. Studies in the Malaysian oil and gas transportation sector have examined the effects of exhaustion-related psychological risk factors [13], psychological well-being and fatigue [14,15], perceived stress [16], and the assessment of fatigue by the psychomotor vigilance test [17]. Although these factors were important, however, the impact of the nature of work factors (work schedule and work activities) on driving performance and the mechanism of how fatigue mediates this relationship have been neglected. Currently, there is an urgent need to address the low performance among Malaysian oil and gas tanker drivers caused by the nature of work factors (work schedule and work activities) and driving fatigue.
This study aims to make up for the lack of empirical research on the effect of the nature of work factors on driving performance and to investigate the mechanism impact of driving fatigue on the relationship between the nature of work factors and driving performance in the Malaysian oil and gas transportation context. For this to happen, this study utilizes structural equation modelling by the partial least squares (PLS-SEM) approach. This study has focused on the nature of work as causal factors impairing the performance of oil and gas tanker drivers. Understanding the interaction between the performance of drivers and the factors influencing their performance will allow them to become part of the performance model development [18]. To ensure safe tanker journeys, the availability of this performance model will include a comprehensive measure of the driver’s performance [19]. Additionally, the performance assessment improves service quality, reduces risk degree, and prevents the occurrence of accidents.

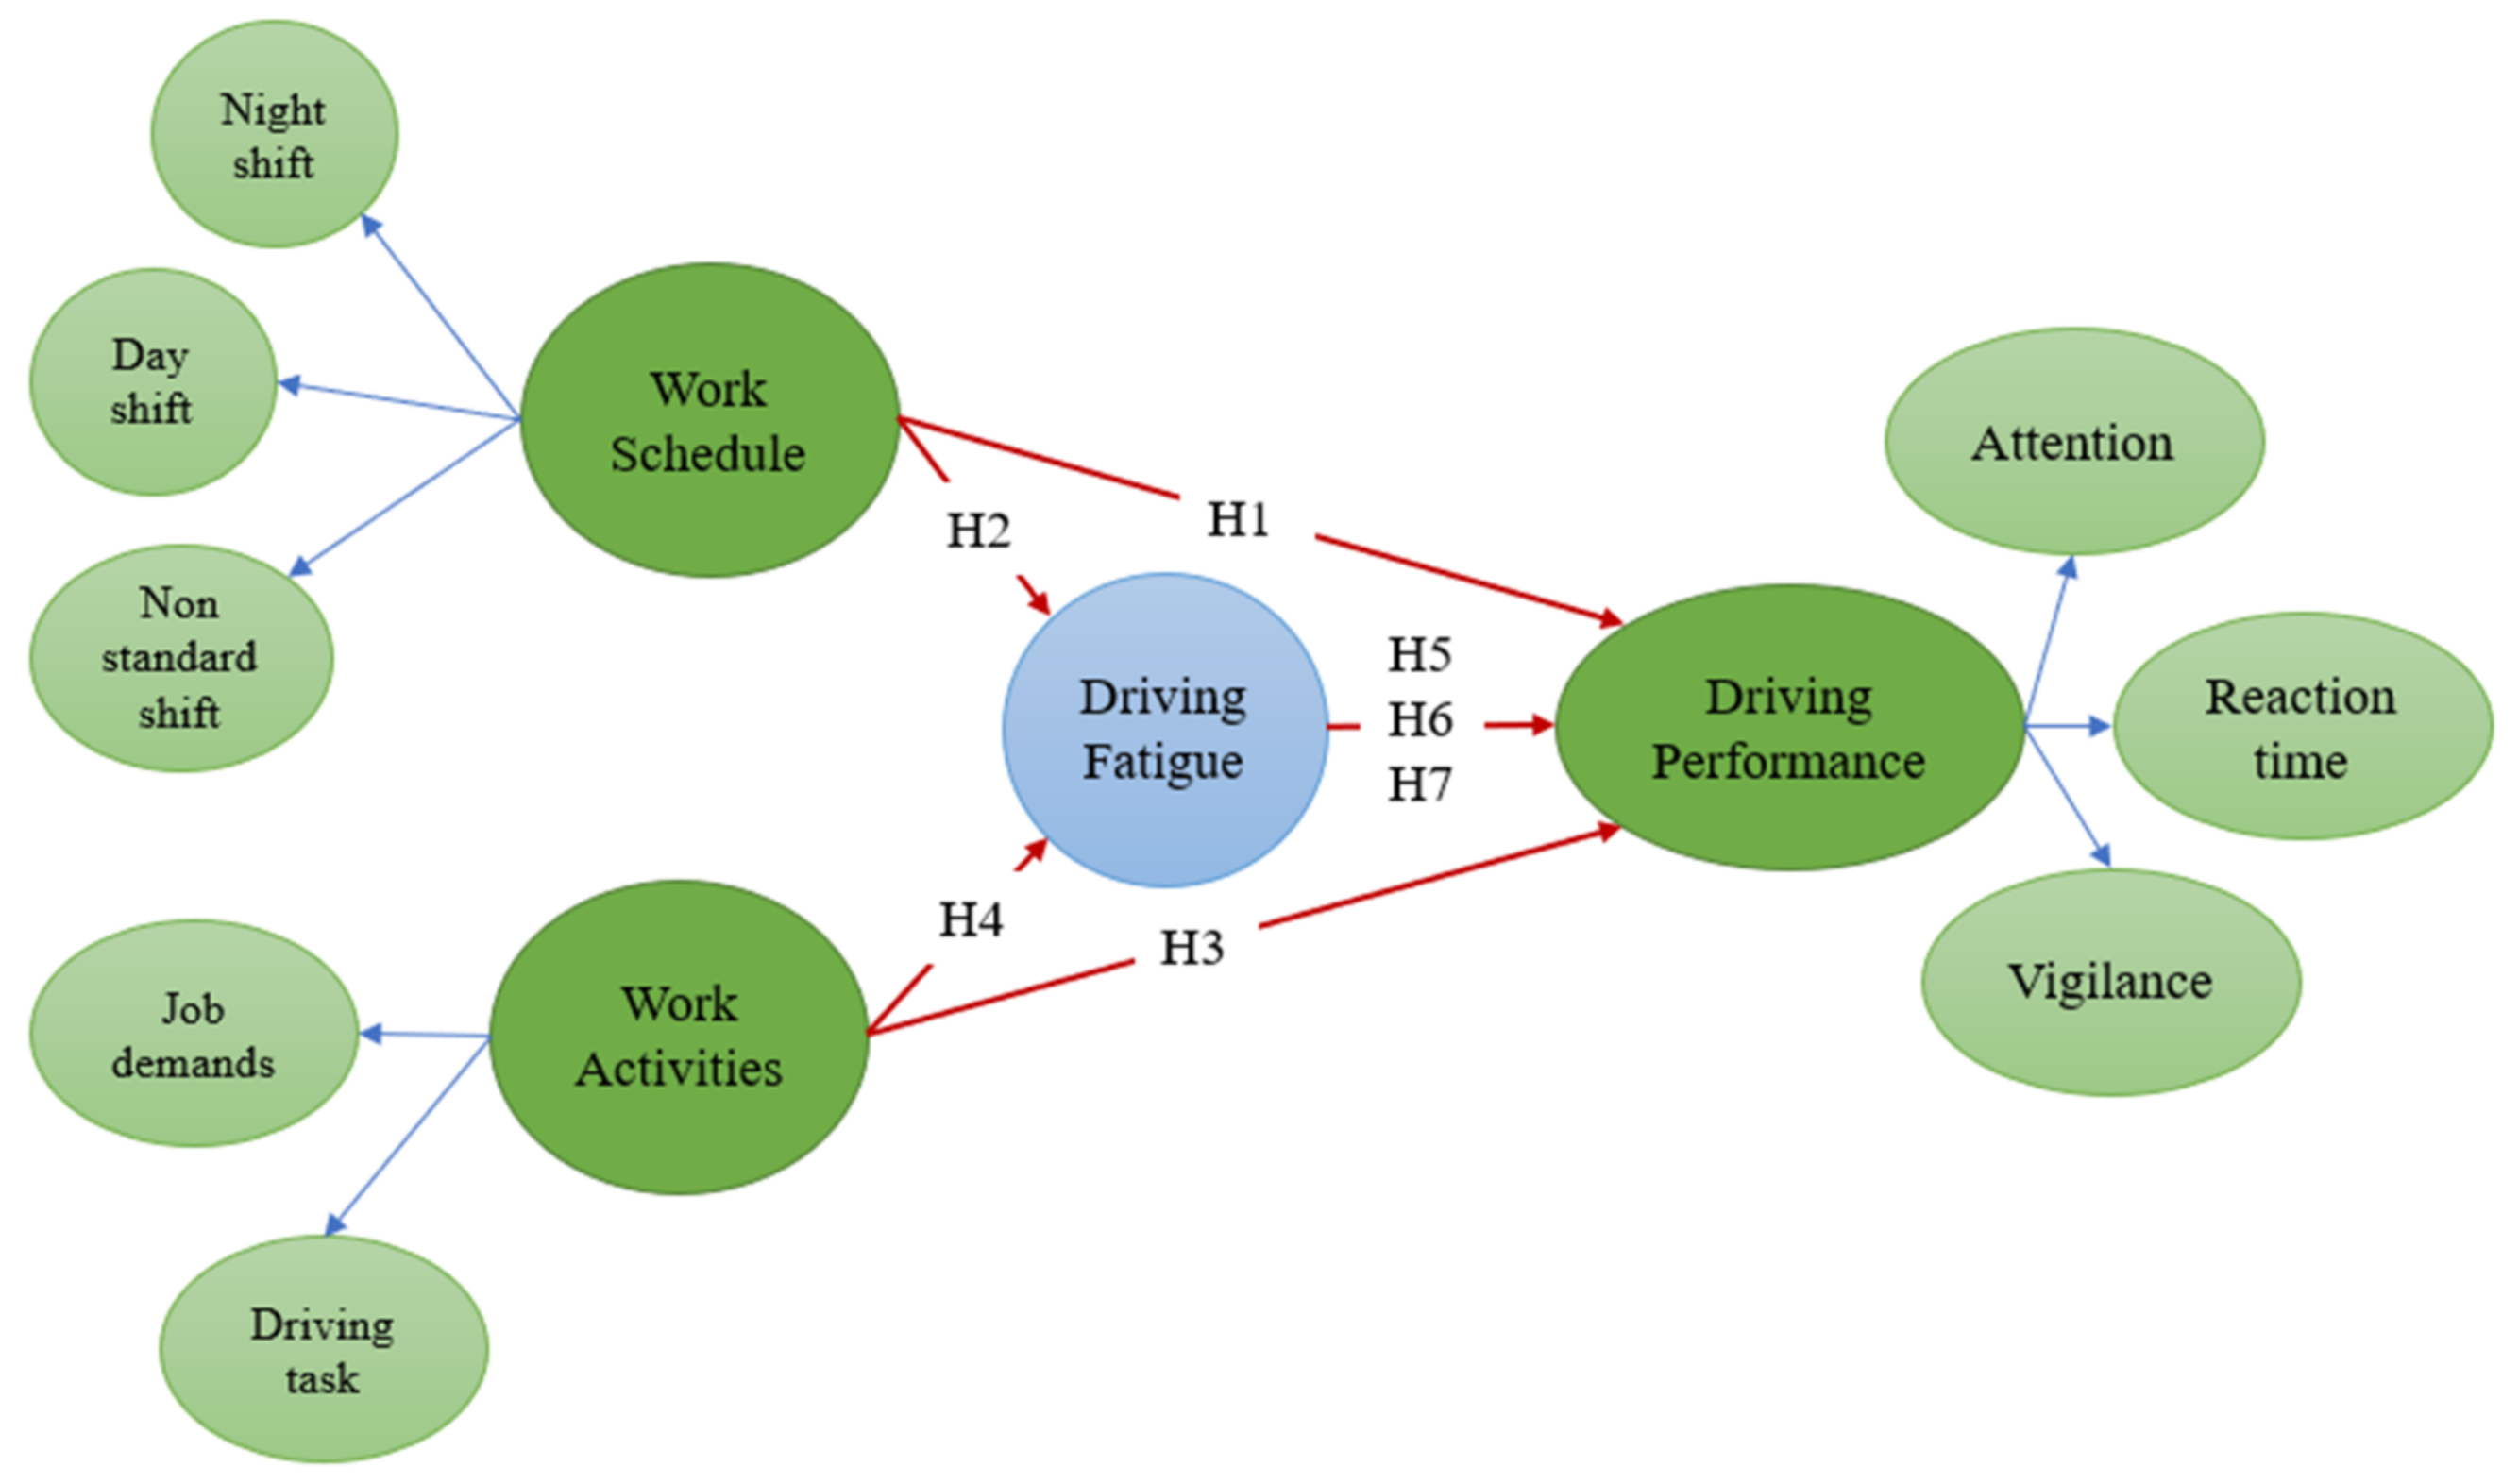
2. Literature Review and Hypotheses Development

In general, performance can be well-defined as the capacity of an individual to perform a specific task over some time [20]. Therefore, driving performance can be defined as the effectiveness of a driver to complete the driving duty. The effectiveness can be concerning vigilance, reaction time, and the attention of drivers, and can be measured when the drivers perform their duties [20,21,22]. The need for improvement can be rationally assessed and determined by measuring human performance. In the early stages of the design process, the performance development factors that are in line with the workers’ characteristics, needs and knowledge should be considered [23]. Delayed improvements may occur if the organization’s management does not understand human performance [24].
The performance levels of an employee often are directly related to the characteristics of the employee and the nature of their work. The essence of the work of an employee is better described as the sort of work they carry out. This could include the everyday simple activities performed as part of a job and other non-routine activities [25]. Thus, the nature of driving work includes driving, shifting activities, monotone driving, and environmental interaction [26,27]. In the current study, the essence of a driver’s job is typical of these tasks (attention, vigilance, reaction time) [20,21,22], driving fatigue influences the reaction abilities of drivers [28,29], and can be summed up by the two guiding forces impacting the performance, work schedule, and work activities.

2.1. Work Schedule

Employees working in shift systems often have physical and psychological health issues related to working in shifts [30,31]. According to previous research, forming the risk index for work schedule, clear patterns were identified: relative occupational risk (i) increased by 18% for a shift in the afternoon and evening and 30% for night shift, compared to a shift in the morning; (ii) it was 6% higher in the second night, 17% higher in the third and 36% higher in the fourth night, compared to the first night shift, and a similar though slower pattern was observed for day shifts of 2%, 7%, and 17%, respectively, increased the risk of accidents; (iii) the rise was 13% for 10 h shifts and 27% for 12 h shifts compared to 8 h shift; and (iv) recorded increases essentially linearly with time spent on the driving such that after 90–119 min, the possibility of accidents is high, relative to the first 30 min [32]. Heavy vehicles are known to be a very dangerous occupation due to long periods of driving and poor physical activities when driving. The prevalence of fatigue increases due to these risk factors associated with shift work and irregular sleep patterns. Subsequently, fatigue is associated closely with stress and resulting in low physiological and psychological [33]. Research was conducted in 2005 on the connection between workability and working time. The study showed that decreased workability between day workers is higher than between night workers, as the Work Ability Index indicated (WAI) [34], and 63% of construction workers were suffering from poor quality of sleep and daytime dysfunction and physical fatigue [35,36]. Shifting, including work at night, is regarded as a major risk factor. A study found that employees are at enhanced risk of accidents during successive night shifts [37]. Besides, commuting home by car after a night shift is another safety hazard for employees in the shift [38]. The literature also indicates that those employees who work a night shift have increased fatigue and drowsiness [39], and both are considered to be important risk factors for road accidents [5,40,41]. The literature also suggests that working a night shift is linked with increased driver’s sleepiness and self-reported driving impairments [42].
Regarding the industry, a classic study by Bjerner [43] noticed that shift time and length of the shift are other variables that can affect the safety of drivers. According to Rogers [44], a shift of ten hours and twelve hours are tighter, and the drivers are thus more likely to fall asleep after a night shift. Reduced sleepiness and poor vigilance of drivers are connected more specifically with longer journey time (>35 min) and decreased sleep time (6 h). Gillberg [45] demonstrated that driving at night was slow with greater speed variability, and subjective alertness was much smaller.
A shift work disorder or non-standard shift is a fundamental sleep disorder in the Circadian Rhythm Sleep Disorders group [46]. It is described as extreme sleep and/or insomnia that is temporally correlated with a work schedule. Drake and colleagues proposed that the prevalence of a shift work disorder is observed in at least 10% of those working in the night and rotating shifts [47]. A shift work disorder in primary care has been incorrectly diagnosed, most possibly due to the lack of standardized screening equipment [48,49]. It is also not well-known that a driver may be susceptible to adverse health and safety consequences of work, partly because a shift work disorder lacks an effective monitoring tool. Therefore, in this study, three types of work schedules were applied to assess the performance of oil and gas drivers: day shift, night shift, and non-standard shift. Therefore, the previous literature review hypothesized that:
Hypothesis 1.
Work schedule has a significant impact on driving performance.
Hypothesis 2.
Work schedule has a significant impact on driving fatigue.

2.2. Work Activities

The activities of humans are one of the significant factors that affect human performance [50]. Work activities are referred to as the task or job performed by an employee or driver or an individual’s daily work activities demanded by a superior [51].
Job demand refers to the psychological, physical, social or organizational elements of the work, which require continuous physical or psychological efforts or abilities and therefore involve certain physiological and/or psychological costs [52,53,54]. Job demand can become stressful at work if the demand and abilities are not balanced [52]. People suffer from work-related stress when their employment requirements exceed their mental and physical capabilities, and hence are dangerous or harmful to their well-being. There was also an important social impact of workers’ exhaustion, such as health care costs and lack of productivity [55,56].
The consequences of driving tasks have been addressed in several studies [57,58,59]. The driver should have dynamic control and takes real-time decisions; also, drivers must be aware of the signal, regulations and safety messages during a journey [60]. A monotonous, long-period driving task can lead to a driver’s fatigue and reduce his/her alertness and ability to monitor incidents and information collected during the trip, hence reacting to them [7,61]. Thus, in the present study, work activities, including job demands and driving tasks, were determined to be the important factors affecting the driving performance of oil and gas tanker drivers. Therefore, the previous literature review hypothesized that:
Hypothesis 3.
Work activities have a significant impact on driving performance.
Hypothesis 4.
Work activities have a significant impact on driving fatigue.

2.3. Fatigue as a Mediation

A mediation model aims to define and clarify the process that underlies an observed relationship between independent and dependent variables through the incorporation of a hypothesis third variable known as a mediator variable (intermediary variable, mediating variable or intermediating vary) [62].
Many studies have found that fatigue is a danger to drivers, which decreases their performance and causes road crashes [7,8,63]. Heavy-duty drivers are more likely to cause human and economic losses in a road accident [63,64]. To devise and introduce safe and efficient interventions to reduce mortality, it is relevant to know the accidental history of distinct organizations with distinct drivers’ employment types [65]. Fatigue results in the deterioration of mental and physical health, and in the case of drivers, fatigue is the cause of 20% of the total road crashes [66]. Besides, Meyer [67] have examined the link between the indirect and direct present exposure of stress, and multiple results (i.e., satisfaction with empathy, and employment satisfaction) were examined by a non-parametrical bootstrapping technique, both for indirect and direct pre-existing exposure of stress [68,69].
In Malaysia, the proportion of accidents are significantly greater than 20%, as fatigue impedes human effectiveness to work efficiently [70]. The Malaysian Institute of Road Safety Research reported about 34.7% of accidents of tanker drivers because of fatigue due to poor quality of sleep [71]. Driving fatigue was chosen as a mediator to examine the relationship between the nature of work and driving performance among oil and gas tanker drivers in Malaysia. Therefore, in this study, driving fatigue is selected theoretically as a mediator variable for studying indirect relationships. To verify the mechanism of the mediating role of driving fatigue on the relationship between nature of work and driving performance, therefore, this study proposes the following hypotheses:
Hypothesis 5.
Driving fatigue has a significant impact on driving performance.
Hypothesis 6.
Driving fatigue mediates the relationship between work schedule and driving performance.
Hypothesis 7.
Driving fatigue mediates the relationship between work activities and driving performance.
In the theoretical underpinning, the current study depends on the effort–compensation theory to create the conceptual framework [72]. This theory suggested that, in long-haul driving, stress can result from many factors, such as job demands, driving tasks, and shift schedule. This stress will directly impact the alertness of drivers, leading to lower performance levels. Thus, maintaining attention requires constant self-regulation by the driver. The driver must choose between the personal costs (i.e., effort or exertion) and the benefits (i.e., extrinsic and intrinsic rewards) to maintain vigilance over time [73]. Hence, based on this theory, we proposed the following framework (see Figure 1).

3. Research Approaches

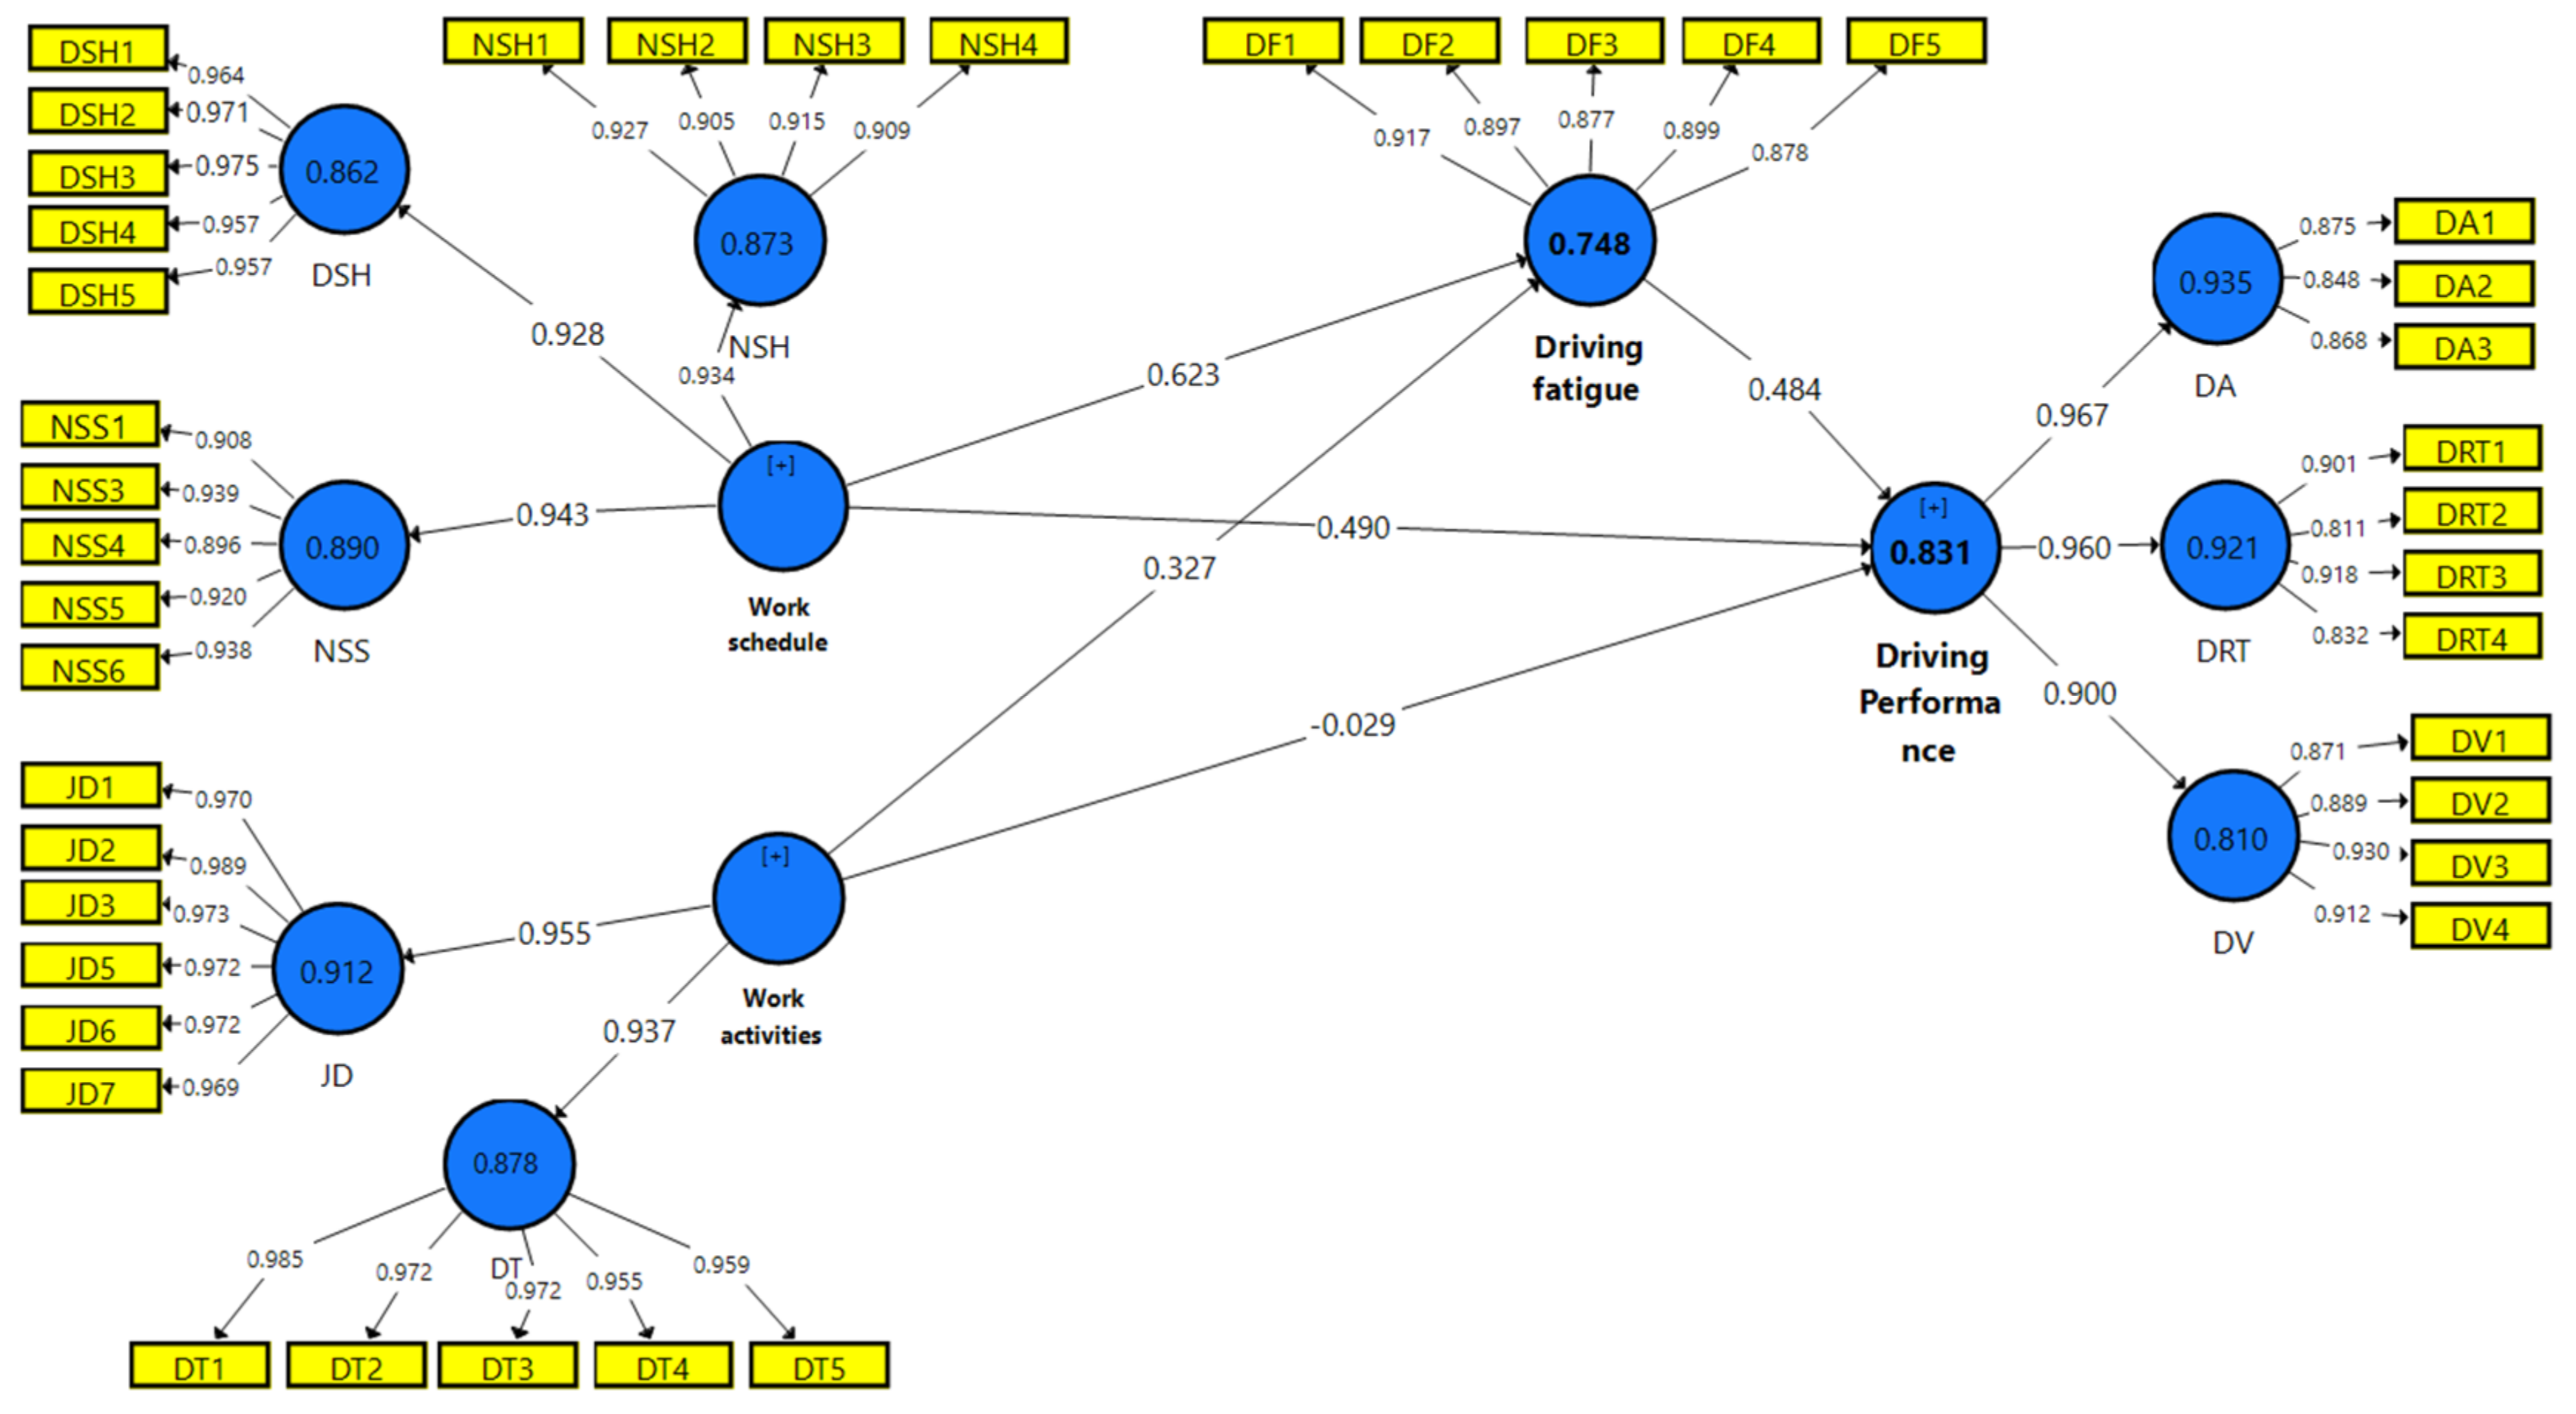
3.1. SEM (Structural Equation Modeling)

SEM is known as a multivariate method for analyzing the accuracy of competing hypotheses and collected samples concerning a concept and theory [74,75]. Covariance-based structural equation modelling (CB-SEM), and partial least squares structural equation modelling (PLS-SEM) are the two major methods for SEM [76,77]. In the context of defining the relationship between items and constructs for the researchers, PLS-SEM is more flexible than CB-SEM [78]. PLS-SEM performs very well in any given sample size but it should meet the minimum criteria of the sample size which makes it possible for variables to be developed with complicated impacts on particular aspects of the model. PLS-SEM deals with constructs or latent variables (composites) which can operate with the measuring models in mode A (reflective), and mode B (formative). Thus, the SEM technique is commonly utilized by researchers [79]. The SEM approach has the following advantages: first, SEM can be utilized to reliably estimate complex hypothesis models based on several observations [80]. Secondly, SEM works well, especially for highly complex models composed of many numbers of latent variables and indicators. It aims, therefore, to obtain models as parsimonious as possible [80]. SEM has currently been used in many areas of social science analysis effectively; for instance, hospitality management [81], construction industry [82,83,84,85], competitive performance [86], the environment and organization [87].
As a result, the PLS-SEM method was utilized to evaluate the seven proposed hypotheses in this study. For this to happen, the Smartpls v3.2.1 (SmartPLS GmbH, Bönning-stedt, Germany) program was used to test the measurement model’s fitting index and path analysis for the model [88]. To test common method bias, SPSS version 25.0 software was utilized to test Harman’s single factor. In order to test multicollinearity, the variance inflation factor (VIF) was utilized to assess multicollinearity issues [88].

3.2. Sampling and Data Collection

The current study utilized a Likert scale which has been used in several studies [89,90], with 43 items as the survey questionnaire [46,91,92,93,94,95,96]. The structure of the study variables is shown in Table 1. In Supplementary Table S1, items of the study questionnaire are shown.
This study applied a stratified random sampling technique to choose the sample from the population of the study. Stratified random sampling is defined as a process of stratification or segregation which is usually followed by randomly selecting the subjects from each stratum [97]. A total of 357 questionnaires were distributed to oil and gas tanker drivers from most of the regions in Malaysia. Distributing and collecting the questionnaire was carried out manually, and the survey time was from 2019–2020. After invalid surveys were excluded, 307 valid surveys were collected; the response rate was 85.9%. The evaluated model consists of five latent variables and 43 observable variables. According to Clemente et al. [98] and Maccallum and Bryant [99], this sample size meets the standard on the sample size in SEM; the minimum sample size was assessed using Gpower software v3.1 University of Dusseldorf, Dusseldorf, Germany. The sample size was estimated with α of 0.05 and power of 1-β = 0.80, and the outcomes specified a sample of (279) as a minimum, that is smaller than the current study included (n = 307). Table 2 shows the descriptive statistics for the sample.
Table 2 shows the proportion of males and females 306 (99.7%) and 1 (0.3%); the survey gender structure showed a higher proportion of men than women, which is in line with the characteristics of the Malaysian oil and gas transportation sector, as the drivers of heavy vehicles are not typically females. From the frequencies of age groups of the sample, 14.7% of them are in the age group 20–29 years old, and 48.2% of total respondents are between 30–39 years, while 26.4% of them are in the age group of 40–49 years and 10.1% of total respondents are in the age group of 50–59 years, while 0.7% were in a group of 60 years and above. Thus, age composition samples were mostly middle-aged and young, which is in line with the requirement to work as a driver in the oil and gas transportation industry. In terms of the marital status of respondents, 84.4% were married, 12.7% were single, and 2.9% were separated. In terms of the background of education, the majority of the respondents 83.7% had secondary education. Meanwhile, 12.7% of the respondents had college diploma degree qualifications. Furthermore, respondents who had a primary education represent 2.6%, and 1% graduate/postgraduate education. Therefore, the proportion of secondary education was very high, which is in line with the criteria of employment in the oil and gas transportation sector.

4. Results

4.1. Tests of Model Fit

To confirm the validity of the PLS-SEM model, the GoF value was measured according to the guidelines laid down by Wetzels [100] who argued that the closer the GoF to 1, the better the fit of the model under consideration GoF = (0 < GoF > 1) will be. The GoF value for the model was precisely determined with the following formula:
Equation (1) GoF value for the model
G o F = ( R 2 ¯ x A V E ) ¯
The observed GoF value was 0.685 in this study (average R2 is 0.831, mean AVE 0.825). R2 is the average R2 value for the endogenous constructs, AVE is the average variance extracted. The baseline values of GoF (small = 0.1, medium = 0.25, high = 0.36) were compared. This showed a sufficient global validity of the PLS model.

4.1.1. Analysis of Reliability

Reliability and validity tests were used to assess the measured model. Four indicators, i.e., standardized indicator loadings (SIL), Cronbach’s alpha (CA), composite reliability (CR), and average variance extracted (AVE), were tested during the reliability test. (i) The values of CA [101], CR [102], SIL [103] must be higher than 0.70. (ii) AVE value, the AVE should be above 0.5 for every construct [104,105]. The degree of explained variance of the endogenous variables is represented by the determination coefficient (R2) [78]. The explanatory power of a structural model can be determined by using the R2 [106]. The R2 must be acceptable, with weak, medium, and substantial values of 0.25, 0.50, and 0.75, respectively, for target constructs [107]. The test results for reliability and R2 are shown in Table 3.
Table 3 reveals that the value of SIL was from 0.700 to 0.989 (above 0.700), the value of CA was from 0.897 to 0.772 (over 0.700), the value of CR ranged from 0.898 to 0.984 (above 0.700), the value of AVE was from 0.680 up to 0.864 (above 0.500) and the value of R2 was from 0.748 to 0.831. (Above 0.50).

4.1.2. Discriminant Validity

To complete the discriminant validity test, the heterotrait–monotrait ratio (HTMT) of correlations was applied [108], as seen in Table 4. The heterotrait–monotrait ratio test of correlations is superior in comparison with Fornell–Larcker criterion and (partial) cross-loadings. The recommended threshold (0.9) was used as the criterion.
Therefore, the results of the measured model demonstrated the high reliability, convergence validity, discrimination validity and verified the constructures were statistically diverse.

4.2. Structural Model Assessment

4.2.1. Direct Effect

For hypotheses testing, seven hypotheses were tested, five of which were tested for direct relationships, and the rest were tested mediating relationships. In a direct relationship, two constructs were under nature of work (work schedule, work activities) as independent variables, driving performance in the structural model framework was one dependent variable, and driving fatigue was the mediating variable. For these higher-order constructs (work schedule, work activities, and driving performance), to estimate the latent variables, a repeated indicator approach was used. Effect size was used to measure the significant impact of an independent variable on a dependent variable [109]. The effect size (F2) of 0.02, 0.15, and 0.35 are regarded as small, moderate, and strong [110]. Table 5 indicates that the effect sizes were moderate and strong between variables. Following the application of the consistent PLS algorithm, Figure 2 shows the outcomes of measured model tests.
First, we maintained both missing values and the PLS-SEM algorithm settings, as with the original model estimate. The next choice to run the 5000 bootstrap samples was chosen for “Sign No Changes” and “Complete Bootstrapping.” Finally, in the bootstrapping procedure, the bias acceleration and correction process was used, and the advanced settings conducted a one-tailed 0.05 significance level test. Table 5 indicates that four hypotheses (i.e., H1, H2, H4, H5) are supported, while one is not supported (H3). There is a strong impact size for three hypotheses supported (i.e., H1, H2, and H5), with a moderate effect on the supported hypothesis (H4).

4.2.2. Mediation Effect Analysis

The present study used the bootstrapping approach to confirm the mediating effect [69]. This approach has been used and suggested by several researchers for studies that aim to evaluate such indirect effects [68]. Besides, bootstrap results are stated to have probability estimates that are more accurate, because this method assists in overcoming mediation problems and lacks normal distribution of the mediator and outcome variables [111]. Thus, the application of this approach is supported by two reasons. The first reason is that it offers a good means to test the significance and confidence intervals in various situations. Another reason is that the use of this method does not need many assumptions. Therefore, the results obtained through this method are more accurate [62]. Table 6 shows the findings of indirect effect, all mediating hypotheses were supported. See Supplementary Table S2 for the full table of mediating impact analysis.

5. Discussion

The driving performance was derived from the literature written in different fields. In this study, seven hypotheses were tested, five of which were critical predictors for direct relationships, while the rest used driving fatigue as a mediating relationship on driving performance. However, Table 5 indicates that the structure of work activities construct failed to predict the driving performance, with four direct hypotheses of statistical significance (H1, H2, H4, and H5). Otherwise, the findings of this analysis revealed a direct hypothesis (H3) that is statistically not significant.
The work schedule has been evaluated from three viewpoints: day shift, night shift, and non-standard shift. The work schedule explored the drivers’ understanding of the effect on their performance during the driving processes. As the drivers spend most of their time on the road, one might argue that, either because of their shift time or non-standard shift, there’s a probability that the drivers will be prone to fatigue or the impairment of physical or mental functions during their driving duty shift. This increases the possibility of road accidents. This study found that in (H1), work schedule affects the driving performance (β = 0.490, t = 8.782, p < 0.000); likewise, in hypothesis (H2), this study found that work schedule affects driving fatigue as well (β = 0.623, t = 13.244, p < 0.000). This finding is aligned with prior findings reported in several prior studies [34,37,48,91]. All these studies reported that the work schedule has a significant impact on driving performance and driving fatigue.
Work activity is represented as one of the core elements in the day system that affects the driver’s performance in the oil and gas transportation sector. Since the drivers’ work specializes in the transportation of oil and gas, the drivers need to carry out many activities besides their usual driving duty, as mentioned in the introduction. However, the outcomes did not find a significant influence between work activities and driving performance in the context of Malaysian oil and gas tanker drivers (β = −0.029, t = 0.716, p > 0.05 = 0.474). Surprisingly, the study revealed that the work activities (H3) (job demand and driving task) had an insignificant impact on driving performance. Further analysis has found that tanker drivers rely rather more on immediate demand during driving duties than management demand. Demands from the superiors and management were expected to be the normal daily routine for the drivers; however, because most of the demands were part of their normal routine, the tanker drivers were required to only follow their everyday duty activities. The drivers’ daily activities are also not stressful to undertake when the activities are balanced and there are no high demands [52].
In contrast, in (H4), work activities had a significant impact on the fatigue of the tanker drivers (β = 0.327, t = 6.532, p < 0.000). This indicates that when tanker drivers are driving, they must be careful and mindful of the surroundings on the road [112]. Kecklund [113] has provided similar reasoning on the relationship of driving activities with vigilance. The driver must be alert to the surrounding environments including signals, illegal trespassers, vehicle distance, and should also ensure that he/she is focused and is paying attention, since driving the tanker for a long journey is monotonous and boring task [113].
Fatigue in (H5) also had a significant influence on the tanker drivers’ driving performance (β = 0.484, t = 7.549, p < 0.000). This result is not surprising because fatigue has a significant correlation with the drivers’ alertness, attention, and reaction time [26,27,114]. Other researchers have also linked fatigue to have a major effect on the driver’s performance [115,116]. This also decreases the level of alertness during driving, thus making it difficult to concentrate on signs, signals, and the surrounding environment. Over time, if fatigue is left unabated, the driver will fall asleep [112,117,118]. Similarly, previous experiments have found that long driving is monotonous and boring, thus inducing fatigue and causing the driver to fall asleep [26,27].
A mediating effect is developed when there is an intervention of a third variable or construct with two other related constructs [78]. The present study used a bootstrapping method to confirm the mediating effect. The driving fatigue constructs mediate two relationships between the nature of work factors (work schedule, work activities) and driving performance constructs [69]. Based on the results in Table 4, it can be seen that there is a significant mediating impact of driving fatigue between IV and DV. The findings of the analysis thus confirmed the two hypotheses (H6, H7) to be statistically significant.
In (H6) indirect effect, Preacher and Hayes [69] indicated that 0.302, 95 percent boot CI: (LL = 0.192, UL = 0.411) does not straddle a 0 in between, which indicates there is a mediation. It can be concluded from the statistical finding that there is a significant mediation effect of the DF between variables. Besides, there is a statistically significant direct effect between WS (IV) and DP (DV) (β = 0.490, t = 8.782, p < 0.000), as shown in Table 5. Accordingly, DF mediates the relationship between WS and DP, and therefore, H6 is supported. The result of the study showed that driving fatigue mediated the relationships between work schedule and driving performance among Malaysian oil and gas tanker drivers. This implies that the work schedule negatively affects the performance of the driver, such as vigilance and attention [30,31]. As a result, this contributes to performance degradation through driver fatigue [26]. In other words, this explanation considers the effects of the shift time on the performance of drivers as mere reactions of the negative drivers’ behaviors toward arranging their shift time and rest time. Therefore, these results are in agreement with the outcomes of previous relevant studies [119,120].
Moreover, in (H7), Preacher and Hayes [69] imply that the 0.158, 95 percent boot CI: (LL = 0.080, UL = 0.237) does not straddle a 0 in between, which implies that there is an existence of mediation. Therefore, this study can conclude that there is a significant mediation effect of the DF between variables. However, the direct effect between WA (IV) and DP (DV) is not significant (β = −0.029, T-value = 0.716, p-value = 0.474). Accordingly, DF mediates the relationship between WA and DP, thus indicating that H7 is supported. The result of the study showed that driving fatigue mediates the relationships between work activities and driving performance among Malaysian oil and gas tanker drivers. This implies that the work activities significantly affect the performance of the driver, such as vigilance and attention [121]. This further contributes to performance degradation through driver fatigue [122]. In other words, this explanation considers the effects of daily work activities on the performance of drivers through driver fatigue and concludes that there is no direct effect between the activities and performance.

6. Conclusions

According to the results and discussion above, this paper investigated the mediating role of driving fatigue in the relationship between the nature of work factors (work schedule and work activities) and driving performance. The results indicate that the relationship between work activities and driving performance has not been significant. The work schedule, however, was found to affect driving performance and driving fatigue significantly. Additionally, fatigue has been shown to affect driving performance significantly. Moreover, the study demonstrated the mediating role of driving fatigue as a mechanism that explains the relationships between work schedule, work activities, and driving performance. The outcomes of this study may also have theoretical and practical implications. From a theoretical point of view, the present study extends the effort composition theory by developing a more comprehensive mediating model that incorporates various driving fatigue perspectives. Furthermore, this study contributes to the existing body of knowledge by investigating the mediating role of fatigue in the relationship between the nature of work factors and driving performance. Otherwise, in practical implications, this study is among the first studies to provide empirical evidence to oil and gas transportation policymakers to support their decision making regarding the design of drivers’ work schedules and determining the activities of drivers to avoid driving fatigue. Moreover, this study provides information on the importance of each factor considered in this study, that encourages the direct supervisors of drivers to set assessment criteria and taking into consideration the importance of the nature of work factors and the degree to which each factor leads to a decrease or increase in driving performance.
Despite the contributions of this study, the inherent limitation related to the data collection method is acknowledged. As this study depended on oil and gas tanker drivers to collect data to examine their perspective toward study variables, this does not reflect a deep understanding of the study issue from all parties involved; therefore, it is recommended for a qualitative method to be employed to identify other elements relating to driving fatigue and driving performance from supervisors’ and administrator’s perspectives in the oil and gas transportation companies to obtain precious results. Considering the outcomes of this study, other interesting issues that can be studied in the future investigation are safety culture and psychosocial hazards among oil and gas tanker drivers.

Supplementary Materials

The following are available online at https://www.mdpi.com/article/10.3390/ijerph18136752/s1, Table S1: Questionnaire items, Table S2: Analysis of mediation.

Author Contributions

The authors have all read and approved the final manuscript, and were all involved in the methodology design, data analysis, literature review and manuscript preparation. All authors have read and agreed to the published version of the manuscript.

Funding

This research was funded by the YUTP project (Cost Center: 015LC0-032), Universiti Teknologi PETRONAS.

Institutional Review Board Statement

Not applicable.

Informed Consent Statement

Informed consent was obtained from all subjects involved in the study.

Data Availability Statement

The data are available for those who want to see it with justified reasons. Kindly contact the corresponding author.

Acknowledgments

Authors would like to thank Universiti Teknologi PETRONAS for funding this study. The authors are grateful to the participants who contributed to the research as well.

Conflicts of Interest

Authors declare no conflict of interest.

References

  1. Meng, F.; Li, S.; Cao, L.; Li, M.; Peng, Q.; Wang, C.; Zhang, W. Driving Fatigue in Professional Drivers: A Survey of Truck and Taxi Drivers. Traffic Inj. Prev. 2015, 16, 474–483. [Google Scholar] [CrossRef]
  2. Sagberg, F. Road accidents caused by drivers falling asleep. Accid. Anal. Prev. 1999, 31, 639–649. [Google Scholar] [CrossRef]
  3. Maycock, G. Sleepiness and driving: The experience of U.K. car drivers. Accid. Anal. Prev. 1997, 29, 453–462. [Google Scholar] [CrossRef]
  4. Fletcher, A.; McCulloch, K.; Baulk, S.D.; Dawson, D. Countermeasures to driver fatigue: a review of public awareness campaigns and legal approaches. Aust. N. Z. J. Public Health 2005, 29, 471–476. [Google Scholar] [CrossRef] [PubMed] [Green Version]
  5. Philip, P.; Sagaspe, P.; Moore, N.; Tail lard, J.; Charles, A.; Guilleminault, C.; Bioulac, B. Fatigue, sleep restriction and driving performance. Accid. Anal. Prev. 2005, 37, 473–478. [Google Scholar] [CrossRef] [PubMed]
  6. Liu, Z.; Yuan, W.; Ma, Y. Drivers’ Attention Strategies before Eyes-off-Road in Different Traffic Scenarios: Adaptation and Anticipation. Int. J. Environ. Res. Public Health 2021, 18, 3716. [Google Scholar] [CrossRef] [PubMed]
  7. Al-Mekhlafi, A.-B.A.; Isha, A.S.N.; Naji, G.M.A. The relationship between fatigue and driving performance: A review and directions for future research. J. Crit. Rev. 2020, 7, 134–141. [Google Scholar]
  8. Chen, S.; Zhang, S.; Xing, Y.; Lu, J. Identifying the Factors Contributing to the Severity of Truck-Involved Crashes in Shanghai River-Crossing Tunnel. Int. J. Environ. Res. Public Health 2020, 17, 3155. [Google Scholar] [CrossRef]
  9. Blair, B.D.; Hughes, J.; Allshouse, W.B.; McKenzie, L.M.; Adgate, J.L. Truck and Multivehicle Truck Accidents with Injuries Near Colorado Oil and Gas Operations. Int. J. Environ. Res. Public Health 2018, 15, 1861. [Google Scholar] [CrossRef] [Green Version]
  10. Yassierli, M.M.; Sutalaksana, I.Z. Fatigue Evaluation of Fuel Truck Drivers. Procedia Manuf. 2015, 4, 352–358. [Google Scholar] [CrossRef] [Green Version]
  11. Vitaterna, M.H.; Takahashi, J.S.; Turek, F.W. Overview of Circadian Rhythms. Alcohol Res. Health 2001, 25, 85–93. [Google Scholar]
  12. Adams-Guppy, J.; Guppy, A. Truck driver fatigue risk assessment and management: a multinational survey. Ergonomics 2003, 46, 763–779. [Google Scholar] [CrossRef] [PubMed]
  13. Selvarajah Krishnan, S.M.H.; Firdhaus, A.; Sarah, S.; Taufiq, A. Analysis of exhaustion related psychological risk factors among oil and gas tanker drivers in Malaysia. Int. J. Adv. Multidiscip. Soc. Sci. 2017, 3, 22–27. [Google Scholar]
  14. Sabir, A.A.; Isha, A.S.N.B. Psychological well-being and fatigue impact on aberrant driving behaviors in oil and gas sector of malaysia. Glob. Bus. Manag. Res. 2017, 9, 110. [Google Scholar]
  15. Sabir, A.A.; Ahmad Shahrul, N.B. Marketing assessing the fatigue related psychological risk factors among oil and gas tankers drivers in Malaysia. Int. Rev. Manag. Mark. 2016, 6, 138–142. [Google Scholar]
  16. Sabir, A.A.; Shahru, A.; Bin Isha, N.; Langove, N.; Javaid, M.U. An Integrative Approach to Study Drivers Perceived Stress on Aberrant Driving Behaviour: The Mediation Role of Driver Fatigue. In Proceedings of the SHS Web of Conferences; EDP Sciences: Les Ulis, France, 2018; Volume 56, p. 02009. [Google Scholar]
  17. Al-Mekhlafi, A.-B.A.; Isha, A.S.N.; Sabir, A.A.; Naji, G.M.A.; Ajmal, M.; Al-Harasi, A.H. Fatigue assessment of oil and gas tanker drivers: Psychomotor vigilance test (PVT-192). Solid State Technol. 2020, 63, 4256–4262. [Google Scholar]
  18. Baines, T.; Asch, R.; Hadfield, L.; Mason, J.; Fletcher, S.; Kay, J. Towards a theoretical framework for human performance modelling within manufacturing systems design. Simul. Model. Pr. Theory 2005, 13, 486–504. [Google Scholar] [CrossRef] [Green Version]
  19. Williamson, A.; Lombardi, D.A.; Folkard, S.; Stutts, J.; Courtney, T.; Connor, J. The link between fatigue and safety. Accid. Anal. Prev. 2011, 43, 498–515. [Google Scholar] [CrossRef]
  20. Paas, F.; Van Merriënboer, J.J.G. The Efficiency of Instructional Conditions: An Approach to Combine Mental Effort and Performance Measures. Hum. Factors J. Hum. Factors Ergon. Soc. 1993, 35, 737–743. [Google Scholar] [CrossRef]
  21. McGehee, D.V.; Mazzae, E.N.; Baldwin, G.S. Driver Reaction Time in Crash Avoidance Research: Validation of a Driving Simulator Study on a Test Track. In Proceedings of the Human Factors and Ergonomics Society Annual Meeting; SAGE Publications: Los Angeles, CA, USA, 2000; Volume 44, pp. 3–320. [Google Scholar]
  22. Oken, B.S.; Salinsky, M.C.; Elsas, S.M. Vigilance, alertness, or sustained attention: physiological basis and measurement. Clin. Neurophysiol. 2006, 117, 1885–1901. [Google Scholar] [CrossRef] [PubMed] [Green Version]
  23. Shahrokhi, M.; Bernard, A. A framework to develop an analysis agent for evaluating human performance in manufacturing systems. CIRP J. Manuf. Sci. Technol. 2009, 2, 55–60. [Google Scholar] [CrossRef]
  24. Genaidy, A.; Salem, S.; Karwowski, W.; Paez, O.; Tuncel, S. The work compatibility improvement framework: an integrated perspective of the human-at-work system. Ergonomics 2007, 50, 3–25. [Google Scholar] [CrossRef] [PubMed]
  25. Schieman, S.; Whitestone, Y.K.; Van Gundy, K.T. The Nature of Work and the Stress of Higher Status. J. Health Soc. Behav. 2006, 47, 242–257. [Google Scholar] [CrossRef]
  26. Dorrian, J.; Baulk, S.D.; Dawson, D. Work hours, workload, sleep and fatigue in Australian Rail Industry employees. Appl. Ergon. 2011, 42, 202–209. [Google Scholar] [CrossRef]
  27. Fletcher, A.; Dawson, D. Field-based validations of a work-related fatigue model based on hours of work. Transp. Res. Part F Traffic Psychol. Behav. 2001, 4, 75–88. [Google Scholar] [CrossRef]
  28. Guo, M.; Li, S.; Wang, L.; Chai, M.; Chen, F.; Wei, Y. Research on the Relationship between Reaction Ability and Mental State for Online Assessment of Driving Fatigue. Int. J. Environ. Res. Public Health 2016, 13, 1174. [Google Scholar] [CrossRef]
  29. Lyu, N.; Xie, L.; Wu, C.; Fu, Q.; Deng, C. Driver’s Cognitive Workload and Driving Performance under Traffic Sign Information Exposure in Complex Environments: A Case Study of the Highways in China. Int. J. Environ. Res. Public Health 2017, 14, 203. [Google Scholar] [CrossRef] [Green Version]
  30. Cho, Y.; Joo, J.-M.; Kim, S.; Sok, S. Effects of Meridian Acupressure on Stress, Fatigue, Anxiety, and Self-Efficacy of Shiftwork Nurses in South Korea. Int. J. Environ. Res. Public Health 2021, 18, 4199. [Google Scholar] [CrossRef] [PubMed]
  31. Savic, M.; Ogeil, R.P.; Sechtig, M.J.; Lee-Tobin, P.; Ferguson, N.; Lubman, D.I. How Do Nurses Cope with Shift Work? A Qualitative Analysis of Open-Ended Responses from a Survey of Nurses. Int. J. Environ. Res. Public Health 2019, 16, 3821. [Google Scholar] [CrossRef] [Green Version]
  32. Folkard, S.; Lombardi, D.A. Modeling the impact of the components of long work hours on injuries and “accidents”. Am. J. Ind. Med. 2006, 49, 953–963. [Google Scholar] [CrossRef]
  33. Longman, D.; Shaw, C.; Varela-Mato, V.; Sherry, A.; Ruettger, K.; Sayyah, M.; Guest, A.; Chen, Y.-L.; Paine, N.; King, J.; et al. Time in Nature Associated with Decreased Fatigue in UK Truck Drivers. Int. J. Environ. Res. Public Health 2021, 18, 3158. [Google Scholar] [CrossRef]
  34. Capanni, C.; Sartori, S.; Carpentiero, G.; Costa, G. Work ability index in a cohort of railway construction workers. Int. Congr. Ser. 2005, 1280, 253–257. [Google Scholar] [CrossRef]
  35. Kim, Y.; Lee, S.; Lim, J.; Park, S.; Seong, S.; Cho, Y.; Kim, H. Factors Associated with Poor Quality of Sleep in Construction Workers: A Secondary Data Analysis. Int. J. Environ. Res. Public Health 2021, 18, 2279. [Google Scholar] [CrossRef]
  36. Jung, M.; Lim, S.; Chi, S. Impact of Work Environment and Occupational Stress on Safety Behavior of Individual Construction Workers. Int. J. Environ. Res. Public Health 2020, 17, 8304. [Google Scholar] [CrossRef] [PubMed]
  37. Folkard, S.; Tucker, P. Shift work, safety and productivity. Occup. Med. 2003, 53, 95–101. [Google Scholar] [CrossRef] [Green Version]
  38. Costa, G.; Tieghi, S.; Chiesi, A. Interferences between commuting and shiftwork. Night Shiftw. Longterm Eff. Prev. 1986, 311–318. [Google Scholar]
  39. Åkerstedt, T. Shift work and disturbed sleep/wakefulness. Occup. Med. 2003, 53, 89–94. [Google Scholar] [CrossRef] [Green Version]
  40. Horne, J.; Raynor, L. Falling Asleep at the Wheel, Rep. No. TRL168; Transportation Research Laboratory: Workingham, UK, 1995. [Google Scholar]
  41. McCartt, A.T.; Hellinga, L.A.; Solomon, M.G. Work schedules of long-distance truck drivers before and after 2004 hours-of-service rule change. Traffic Inj. Prev. 2008, 9, 201–210. [Google Scholar] [CrossRef]
  42. Heslegave, R.; Rhodes, W.; Gil, V. A prospective study examining the changes to worker health and safety after shifting from 9 to 12.5-hour shifts. In Shiftwork in the 21st Century; Peter Lang: Frankfurt, Germany, 2000. [Google Scholar]
  43. Bjerner, B.; Holm, Å.; Swensson, Å. Åke Diurnal Variation in Mental Performance: A Study of Three-shift Workers. Occup. Environ. Med. 1955, 12, 103–110. [Google Scholar] [CrossRef] [PubMed] [Green Version]
  44. Rogers, A.; Holmes, S.; Spencer, M. The effect of shiftwork on driving to and from work. J. Hum. Ergol. 2001, 30, 131–136. [Google Scholar]
  45. Gillberg, M.; Kecklund, G.; Åkerstedt, T. Sleepiness and performance of professional drivers in a truck simulator—Comparisons between day and night driving. J. Sleep Res. 1996, 5, 12–15. [Google Scholar] [CrossRef]
  46. Barger, L.K.; Ogeil, R.P.; Drake, C.L.; O’Brien, C.S.; Ng, K.T.; Rajaratnam, S.M.W. Validation of a Questionnaire to Screen for Shift Work Disorder. Sleep 2012, 35, 1693–1703. [Google Scholar] [CrossRef] [PubMed]
  47. Drake, C.L.; Roehrs, T.; Richardson, G.; Walsh, J.K.; Roth, T. Shift Work Sleep Disorder: Prevalence and Consequences Beyond that of Symptomatic Day Workers. Sleep 2004, 27, 1453–1462. [Google Scholar] [CrossRef] [PubMed]
  48. Culpepper, L. The social and economic burden of shift-work disorder. J. Fam. Pract. 2010, 59, S3. [Google Scholar]
  49. Schwartz, J.R. Recognition of shift-work disorder in primary care. J. Fam. Pr. 2010, 59, S18. [Google Scholar]
  50. Bailey, R.W.; Bailey, R.W. Human Performance Engineering: Designing High Quality, Professional User Interfaces for Computer Products, Applications, and Systems; Prentice Hall PTR: Hoboken, NJ, USA, 1996. [Google Scholar]
  51. Dul, J.; Neumann, W.P. Ergonomics contributions to company strategies. Appl. Ergon. 2009, 40, 745–752. [Google Scholar] [CrossRef] [Green Version]
  52. Schaufeli, W.; Bakker, A.B. Job demands, job resources, and their relationship with burnout and engagement: a multi-sample study. J. Organ. Behav. 2004, 25, 293–315. [Google Scholar] [CrossRef] [Green Version]
  53. Ajmal, M.; Isha, A.S.N.; Nordin, S.M.; Kanwal, N.; Al-Mekhlafi, A.-B.A.; Naji, G.M.A. A conceptual framework for the determinants of organizational agility: does safety commitment matters? Solid State Technol. 2020, 63, 4112–4119. [Google Scholar]
  54. Naji, G.M.A.; Isha, A.S.N.; Alzoraiki, M.; Al-Mekhlafi, A.B.A.; Sharafaddin, O.; Saleem, M.S. Impact of safety culture and psychosocial hazard on safety performance among upstream employees in malaysia at oil and gas industry. Solid State Technol. 2020, 63, 4120–4126. [Google Scholar]
  55. Hessels, J.; Rietveld, C.A.; van der Zwan, P. Self-employment and work-related stress: The mediating role of job control and job demand. J. Bus. Ventur. 2017, 32, 178–196. [Google Scholar] [CrossRef]
  56. Naji, G.M.A.; Isha, A.S.N.; Al-Mekhlafi, A.B.A.; Sharafaddin, O.; Ajmal, M. Implementation of leading and lagging indicators to improve safety performance in the upstream oil and gas industry. J. Crit. Rev. 2020, 7, 265–269. [Google Scholar]
  57. Haigney, D.; Taylor, R.; Westerman, S. Concurrent mobile (cellular) phone use and driving performance: task demand characteristics and compensatory processes. Transp. Res. Part F Traffic Psychol. Behav. 2000, 3, 113–121. [Google Scholar] [CrossRef]
  58. Ponds, R.W.H.M.; Brouwer, W.H.; Van Wolffelaar, P.C. Age Differences in Divided Attention in a Simulated Driving Task. J. Gerontol. 1988, 43, P151–P156. [Google Scholar] [CrossRef]
  59. Reimer, B.; D’Ambrosio, L.A.; Coughlin, J.F.; Fried, R.; Biederman, J. Task-Induced Fatigue and Collisions in Adult Drivers with Attention Deficit Hyperactivity Disorder. Traffic Inj. Prev. 2007, 8, 290–299. [Google Scholar] [CrossRef]
  60. Kecklund, L.M.; Ingre, G.; Kecklund, M.; Söderström, T.; Åkerstedt, E.; Lindberg, A.; Jansson, E.; Olsson, B.S.; Almqvist, P. The TRAIN–project: Railway safety and the train driver information environment and work situation-A summary of the main results. Signal. Saf. 2001, 50, 26–27. [Google Scholar]
  61. Jap, B.T.; Lal, S.; Fischer, P. Inter-hemispheric electroencephalography coherence analysis: Assessing brain activity during monotonous driving. Int. J. Psychophysiol. 2010, 76, 169–173. [Google Scholar] [CrossRef] [PubMed] [Green Version]
  62. MacKinnon, D.P. Integrating Mediators and Moderators in Research Design. Res. Soc. Work. Pr. 2011, 21, 675–681. [Google Scholar] [CrossRef] [Green Version]
  63. Hamidun, R.; Hoong, A.P.W.; Roslan, A.; Shabadin, A.; Jamil, H. Characteristics of heavy goods vehicles (HGV) accidents in Malaysia. In Proceedings of the IOP Conference Series: Materials Science and Engineering; IOP Publishing: Bristol, UK, 2019; Volume 512, p. 012021. [Google Scholar]
  64. Davey, J.; Richards, N.; Freeman, J. Fatigue and Beyond: Patterns of and Motivations for Illicit Drug Use Among Long-Haul Truck Drivers. Traffic Inj. Prev. 2007, 8, 253–259. [Google Scholar] [CrossRef] [PubMed] [Green Version]
  65. Butlewski, M.; Hankiewicz, K. Psychomotor Performance Monitoring System in the Context of Fatigue and Accident Prevention. Procedia Manuf. 2015, 3, 4860–4867. [Google Scholar] [CrossRef] [Green Version]
  66. Tanaka, M.; Ishii, A.; Watanabe, Y. Neural effect of mental fatigue on physical fatigue: A magnetoencephalography study. Brain Res. 2014, 1542, 49–55. [Google Scholar] [CrossRef]
  67. Meyer, R.M.; Li, A.; Klaristenfeld, J.; Gold, J.I. Pediatric Novice Nurses: Examining Compassion Fatigue as a Mediator Between Stress Exposure and Compassion Satisfaction, Burnout, and Job Satisfaction. J. Pediatr. Nurs. 2015, 30, 174–183. [Google Scholar] [CrossRef]
  68. Hayes, A.F. Beyond Baron and Kenny: Statistical Mediation Analysis in the New Millennium. Commun. Monogr. 2009, 76, 408–420. [Google Scholar] [CrossRef]
  69. Preacher, K.J.; Hayes, A.F. Asymptotic and resampling strategies for assessing and comparing indirect effects in multiple mediator models. Behav. Res. Methods 2008, 40, 879–891. [Google Scholar] [CrossRef]
  70. Sullman, M.J.; Stephens, A.N.; Yong, M. Driving anger in Malaysia. Accid. Anal. Prev. 2014, 71, 1–9. [Google Scholar] [CrossRef] [PubMed]
  71. Malaysian Institute of Road Safety Research (MIROS). 2015; Report no. 239. Available online: https://miros.gov.my/xs/penerbitan.php?pagetype=15.
  72. Hockey, G.R.J. Compensatory control in the regulation of human performance under stress and high workload: A cognitive-energetical framework. Biol. Psychol. 1997, 45, 73–93. [Google Scholar] [CrossRef]
  73. Bauer, I.M.; Baumeister, R.F. Self-regulatory strength. In Handbook of Self-Regulation: Research, Theory, and Applications; Guilford Publications: New York, NY, USA, 2011; Volume 2, pp. 64–82. [Google Scholar]
  74. Williams, L.J.; Vandenberg, R.J.; Edwards, J.R. 12 structural equation modeling in management research: A guide for improved analysis. Acad. Manag. Ann. 2009, 3, 543–604. [Google Scholar] [CrossRef]
  75. Lei, P.-W.; Wu, Q. Introduction to Structural Equation Modeling: Issues and Practical Considerations. Educ. Meas. Issues Pr. 2007, 26, 33–43. [Google Scholar] [CrossRef]
  76. Astrachan, C.B.; Patel, V.K.; Wanzenried, G. A comparative study of CB-SEM and PLS-SEM for theory development in family firm research. J. Fam. Bus. Strat. 2014, 5, 116–128. [Google Scholar] [CrossRef]
  77. Jöreskog, K.G. Structural analysis of covariance and correlation matrices. Psychometrika 1978, 43, 443–477. [Google Scholar] [CrossRef]
  78. Hair, J.F., Jr.; Hult, G.T.M.; Ringle, C.; Sarstedt, M. A Primer on Partial Least Squares Structural Equation Modeling (PLS-SEM); Sage Publications: Thousand Oaks, CA, USA, 2016. [Google Scholar]
  79. Hair, J.F.; Sarstedt, M.; Ringle, C.M.; Mena, J.A. An assessment of the use of partial least squares structural equation modeling in marketing research. J. Acad. Mark. Sci. 2012, 40, 414–433. [Google Scholar] [CrossRef]
  80. Sarstedt, M.; Ringle, C.M.; Smith, D.; Reams, R.; Hair, J.F., Jr. Partial least squares structural equation modeling (PLS-SEM): A useful tool for family business researchers. J. Fam. Bus. Strategy 2014, 5, 105–115. [Google Scholar] [CrossRef]
  81. Ali, F.; Rasoolimanesh, S.M.; Sarstedt, M.; Ringle, C.M.; Ryu, K. An assessment of the use of partial least squares structural equation modeling (PLS-SEM) in hospitality research. Int. J. Contemp. Hosp. Manag. 2018, 30, 514–538. [Google Scholar] [CrossRef] [Green Version]
  82. Aibinu, A.A.; Al-Lawati, A.M. Using PLS-SEM technique to model construction organizations’ willingness to participate in e-bidding. Autom. Constr. 2010, 19, 714–724. [Google Scholar] [CrossRef]
  83. Kineber, A.F.; Othman, I.; Oke, A.E.; Chileshe, N.; Buniya, M.K. Impact of Value Management on Building Projects Success: Structural Equation Modeling Approach. J. Constr. Eng. Manag. 2021, 147, 04021011. [Google Scholar] [CrossRef]
  84. Kineber, A.F.; Othman, I.; Oke, A.E.; Chileshe, N.; Zayed, T. Exploring the value management critical success factors for sustainable residential building – A structural equation modelling approach. J. Clean. Prod. 2021, 293, 126115. [Google Scholar] [CrossRef]
  85. Oke, A.; Kineber, A.; Albukhari, I.; Othman, I.; Kingsley, C. Assessment of Cloud Computing Success Factors for Sustainable Construction Industry: The Case of Nigeria. Buildings 2021, 11, 36. [Google Scholar] [CrossRef]
  86. Mikalef, P.; Pateli, A. Information technology-enabled dynamic capabilities and their indirect effect on competitive performance: Findings from PLS-SEM and fsQCA. J. Bus. Res. 2017, 70, 1–16. [Google Scholar] [CrossRef]
  87. Aboelmaged, M. The drivers of sustainable manufacturing practices in Egyptian SMEs and their impact on competitive capabilities: A PLS-SEM model. J. Clean. Prod. 2018, 175, 207–221. [Google Scholar] [CrossRef]
  88. Henseler, J.; Ringle, C.M.; Sarstedt, M. A new criterion for assessing discriminant validity in variance-based structural equation modeling. J. Acad. Mark. Sci. 2015, 43, 115–135. [Google Scholar] [CrossRef] [Green Version]
  89. Kineber, A.F.; Othman, I.; Oke, A.E.; Chileshe, N.; Alsolami, B. Critical Value Management Activities in Building Projects: A Case of Egypt. Buildings 2020, 10, 239. [Google Scholar] [CrossRef]
  90. Buniya, M.K.; Othman, I.; Durdyev, S.; Sunindijo, R.Y.; Ismail, S.; Kineber, A.F. Safety Program Elements in the Construction Industry: The Case of Iraq. Int. J. Environ. Res. Public Health 2021, 18, 411. [Google Scholar] [CrossRef] [PubMed]
  91. Barger, L.K.; Cade, B.; Ayas, N.T.; Cronin, J.W.; Rosner, B.; Speizer, F.E.; Czeisler, C.A. Extended Work Shifts and the Risk of Motor Vehicle Crashes among Interns. N. Engl. J. Med. 2005, 352, 125–134. [Google Scholar] [CrossRef]
  92. Ryan, B.; Wilson, J.R.; Sharples, S.; Morrisroe, G.; Clarke, T. Developing a Rail Ergonomics Questionnaire (REQUEST). Appl. Ergon. 2009, 40, 216–229. [Google Scholar] [CrossRef]
  93. Austin, A.; Drummond, P. Work problems associated with suburban train driving. Appl. Ergon. 1986, 17, 111–116. [Google Scholar] [CrossRef]
  94. Ortiz, C.; Castro, J.J.; Alarcón, A.; Soler, M.; Anera, R.G. Quantifying age-related differences in visual-discrimination capacity: Drivers with and without visual impairment. Appl. Ergon. 2013, 44, 523–531. [Google Scholar] [CrossRef]
  95. Owsley, C.; Stalvey, B.; Wells, J.; Sloane, M.E. Older Drivers and Cataract: Driving Habits and Crash Risk. J. Gerontol. Ser. A Biol. Sci. Med Sci. 1999, 54, M203–M211. [Google Scholar] [CrossRef] [PubMed] [Green Version]
  96. Gradisar, M.; Lack, L.; Richards, H.; Harris, J.; Gallasch, J.; Boundy, M.; Johnston, A. The Flinders Fatigue Scale: Preliminary Psychometric Properties and Clinical Sensitivity of a New Scale for Measuring Daytime Fatigue associated with Insomnia. J. Clin. Sleep Med. 2007, 3, 722–728. [Google Scholar] [CrossRef] [Green Version]
  97. Sekaran, U.; Bougie, R. Research Methods for Business: A skill Building Approach; John Wiley & Sons: Hoboken, NJ, USA, 2016. [Google Scholar]
  98. Clemente, F.M.; Silva, A.F.; Alves, A.R.; Nikolaidis, P.T.; Ramirez-Campillo, R.; Lima, R.; Söğüt, M.; Rosemann, T.; Knechtle, B. Variations of estimated maximal aerobic speed in children soccer players and its associations with the accumulated training load: Comparisons between non, low and high responders. Physiol. Behav. 2020, 224, 113030. [Google Scholar] [CrossRef] [PubMed]
  99. Maccallum, F.; Bryant, R.A. An investigation of approach behaviour in Prolonged Grief. Behav. Res. Ther. 2019, 119, 103405. [Google Scholar] [CrossRef]
  100. Wetzels, M.; Odekerken-Schröder, G.; Van Oppen, C. Using PLS Path Modeling for Assessing Hierarchical Construct Models: Guidelines and Empirical Illustration. MIS Q. 2009, 33, 177. [Google Scholar] [CrossRef]
  101. Garver, M.S.; Mentzer, J.T. Logistics research methods: Employing structural equation modeling to test for construct validity. J. Bus. Logist. 1999, 20, 33. [Google Scholar]
  102. Bagozzi, R.P.; Yi, Y. On the evaluation of structural equation models. J. Acad. Mark. Sci. 1988, 16, 74–94. [Google Scholar] [CrossRef]
  103. Hulland, J. Use of partial least squares (PLS) in strategic management research: A review of four recent studies. Strateg. Manag. J. 1999, 20, 195–204. [Google Scholar] [CrossRef]
  104. Fornell, C.; Larcker, D.F. Evaluating structural equation models with unobservable variables and measurement error. J. Mark. Res. 1981, 18, 39–50. [Google Scholar] [CrossRef]
  105. Chin, W.W. The partial least squares approach to structural equation modeling. Mod. Methods Bus. Res. 1998, 295, 295–336. [Google Scholar]
  106. Ringle, C.M.; da Silva, D.; Bido, D.D. Modelagem de equações estruturais com utilização do SmartPLS. Rev. Bras. Mark. 2014, 13, 56–73. [Google Scholar] [CrossRef]
  107. Hock, M.; Ringle, C.M. Local strategic networks in the software industry: an empirical analysis of the value continuum. Int. J. Knowl. Manag. Stud. 2010, 4, 132. [Google Scholar] [CrossRef]
  108. Nunnally, J.C. Psychometric Theory 3E; Tata McGraw-Hill Education: New York, NY, USA, 1994. [Google Scholar]
  109. Urbach, N.; Ahlemann, F. Structural equation modeling in information systems research using partial least squares. J. Inf. Technol. Theory Appl. 2010, 11, 5–40. [Google Scholar]
  110. Hair, J.F.; Ringle, C.M.; Sarstedt, M. Partial Least Squares Structural Equation Modeling: Rigorous Applications, Better Results and Higher Acceptance. Long Range Plan. 2013, 46, 1–12. [Google Scholar] [CrossRef]
  111. Shrout, P.E.; Bolger, N. Mediation in experimental and nonexperimental studies: New procedures and recommendations. Psychol. Methods 2002, 7, 422. [Google Scholar] [CrossRef]
  112. Hamilton, W.I.; Clarke, T. Driver performance modelling and its practical application to railway safety. Appl. Ergon. 2005, 36, 661–670. [Google Scholar] [CrossRef]
  113. Jap, B.T.; Lal, S.; Fischer, P. Comparing combinations of EEG activity in train drivers during monotonous driving. Expert Syst. Appl. 2011, 38, 996–1003. [Google Scholar] [CrossRef]
  114. Dorrian, J.; Roach, G.; Fletcher, A.; Dawson, D. Simulated train driving: Fatigue, self-awareness and cognitive disengagement. Appl. Ergon. 2007, 38, 155–166. [Google Scholar] [CrossRef]
  115. Horrey, W.J.; Noy, Y.I.; Folkard, S.; Popkin, S.M.; Howarth, H.D.; Courtney, T. Research needs and opportunities for reducing the adverse safety consequences of fatigue. Accid. Anal. Prev. 2011, 43, 591–594. [Google Scholar] [CrossRef]
  116. Williamson, A.M.; Feyer, A.-M.; Mattick, R.P.; Friswell, R.; Finlay-Brown, S. Developing measures of fatigue using an alcohol comparison to validate the effects of fatigue on performance. Accid. Anal. Prev. 2001, 33, 313–326. [Google Scholar] [CrossRef]
  117. Lamond, N.; Dawson, D.; Roach, G.D. Fatigue assessment in the field: validation of a hand-held electronic psychomotor vigilance task. Aviat. Space Environ. Med. 2005, 76, 486–489. [Google Scholar] [PubMed]
  118. Strahan, C.; Watson, B.; Lennonb, A. Can organisational safety climate and occupational stress predict work-related driver fatigue? Transp. Res. Part F Traffic Psychol. Behav. 2008, 11, 418–426. [Google Scholar] [CrossRef] [Green Version]
  119. Barker, L.M.; Nussbaum, M. Fatigue, performance, and the work environment: a survey of registered nurses. J. Adv. Nurs. 2011, 67, 1370–1382. [Google Scholar] [CrossRef]
  120. Estryn-Béhar, M.; van der Heijden, B.I. Effects of extended work shifts on employee fatigue, health, satisfaction, work/family balance, and patient safety. Work 2012, 41 (Suppl. 1), 4283–4290. [Google Scholar] [CrossRef] [Green Version]
  121. Benedetto, S.; Pedrotti, M.; Minin, L.; Baccino, T.; Re, A.; Montanari, R. Driver workload and eye blink duration. Transp. Res. Part F Traffic Psychol. Behav. 2011, 14, 199–208. [Google Scholar] [CrossRef]
  122. Bedarkar, M.; Pandita, D. A Study on the Drivers of Employee Engagement Impacting Employee Performance. Procedia-Soc. Behav. Sci. 2014, 133, 106–115. [Google Scholar] [CrossRef] [Green Version]
Figure 1. Driving performance hypothetical model.
Ijerph 18 06752 g001
Figure 2. Measurement model test.
Ijerph 18 06752 g002
Table 1. Structure of the study instrument.
ConstructsDimensionsNo. of ItemsReference
Work schedule 15[46,91]
Night shift (NSH)4
Day shift (DSH)5
Non-standard shift (NSS)6
Work activities 12[92,93]
Job demand (JD)7
Driving Task (DT)5
Driving performance 11[94,95]
Attention (DA)3
Reaction time (DRT)4
Vigilance (DV)4
Driving fatigue (DF) 5[96]
Table 2. Demographic variables (n = 307).
ConstructCategoryFrequencyPercentage
GenderMale30699.7%
Female10.3%
Age20–29 years4514.7%
30–39 years14848.2%
40–49 years8126.4%
50–59 years3110.1%
60 years and above20.7%
MaritalSingle3912.7%
Married25984.4%
Separated92.9%
EducationGraduate/Postgraduate31%
College/Polytechnic3912.7%
Secondary25783.7%
Primary82.6%
Table 3. Validity, reliability, and value of R2.
ConstructsPath RelationshipsSILCACRAVER2
ValueLEP
WS0.9760.8980.746--
NSH1 ←WS0.927
NSH2 ← WS0.905
NSH3 ← WS0.915
NSH4 ← WS0.909
DSH1 ← WS0.964
DSH2 ← WS0.971
DSH3 ← WS0.975
DSH4 ← WS0.957
DSH5 ← WS0.957
NSS1 ← WS0.908
NSS3 ← WS0.939
NSS4 ← WS0.896
NSS5 ← WS0.920
NSS6 ← WS0.938
NSS1 ← WS0.908
WA0.9820.9840.846--
JD1 ← WA0.970
JD2 ← WA0.989
JD3 ← WA0.973
JD5 ← WA0.972
JD6 ← WA0.972
JD7 ← WA0.969
DT1 ← WA0.985
DT2 ← WA0.972
DT3 ← WA0.972
DT4 ← WA0.955
DT5 ← WA0.959
DF0.9370.9520.7990.748 Medium
DF1 ←DF0.917
DF2 ← DF0.897
DF3 ← DF0.877
DF4 ← DF0.899
DF5 ← DF0.878
DP0.9530.9590.6800.831Substantial
DA1 ← DP0.875
DA2 ← DP0.848
DA3 ← DP0.868
DRT1 ← DP0.901
DRT2 ← DP0.811
DRT3 ← DP0.918
DRT4 ← DP0.832
DV1 ← DP0.871
DV2 ← DP0.889
DV3 ← DP0.930
DV4 ← DP0.912
SIL: standardized indicator loadings, CA: Cronbach’s alpha, CR: composite reliability, AVE: average variance extracted, LEP: level of explanatory power, WS: work schedule, NSH: night shift, DSH: day shift, NNS: non-standard shift, WA: work activities, JD: job demand, DT: driving task, DF: driving fatigue, DP: driving performance, DA: driving attention, DRT: driver reaction time, DV: driver vigilance.
Table 4. Values of heterotrait–monotrait ratio (HTMT).
DADRTDSHDTDVDFJDNSHNSS
DA
DRT0.408
DSH0.8330.614
DT0.6140.5780.559
DV0.7790.7230.7540.652
DF0.7170.6740.7870.7480.603
JD0.6000.5580.5190.8010.5630.664
NSH0.6430.4720.8260.6450.8210.7670.622
NSS0.7580.7360.8150.5610.8130.8040.5230.311
Table 5. Direct effect summary.
HypothesesH1H2H3H4H5
Path RelationshipsWS → DPWS → DFWA → DPWA → DFDF → DP
Path coefficient (β)0.4900.623−0.0290.3270.484
Standard Error0.0560.0470.0400.0500.064
F2 Value0.4490.9480.0020.2610.350
EffectStrongStrongNo Effect SizeModerateStrong
t Values8.78213.2440.7166.5327.549
p Values0.0000.0000.4740.0000.000
Significance level
*** p < 0.001
******-******
ResultSupportedSupportedNot SupportedSupportedSupported
Table 6. Analysis of mediation.
RelationshipIndirect EffectBootstrapped Confidence IntervalDecision
Path CoeffSEt-Value95% LL95% UL
H6WS-DF-DP0.302 **0.0565.3850.1920.411Partial mediation
H7WA-DF-DP0.158 **0.0403.9570.0800.237Full mediation
Note: ** = p < 0.01, LL: lower level, UL: upper level.
Publisher’s Note: MDPI stays neutral with regard to jurisdictional claims in published maps and institutional affiliations.

