
Computational Intelligence-Based Model for Mortality Rate Prediction in COVID-19 Patients

 , ,
, ,
Abstract
:1. Introduction
2. Background Section
3. Related Studies
3.1. Machine Learning Based Approach
3.2. Deep Learning (DL) Based Approach
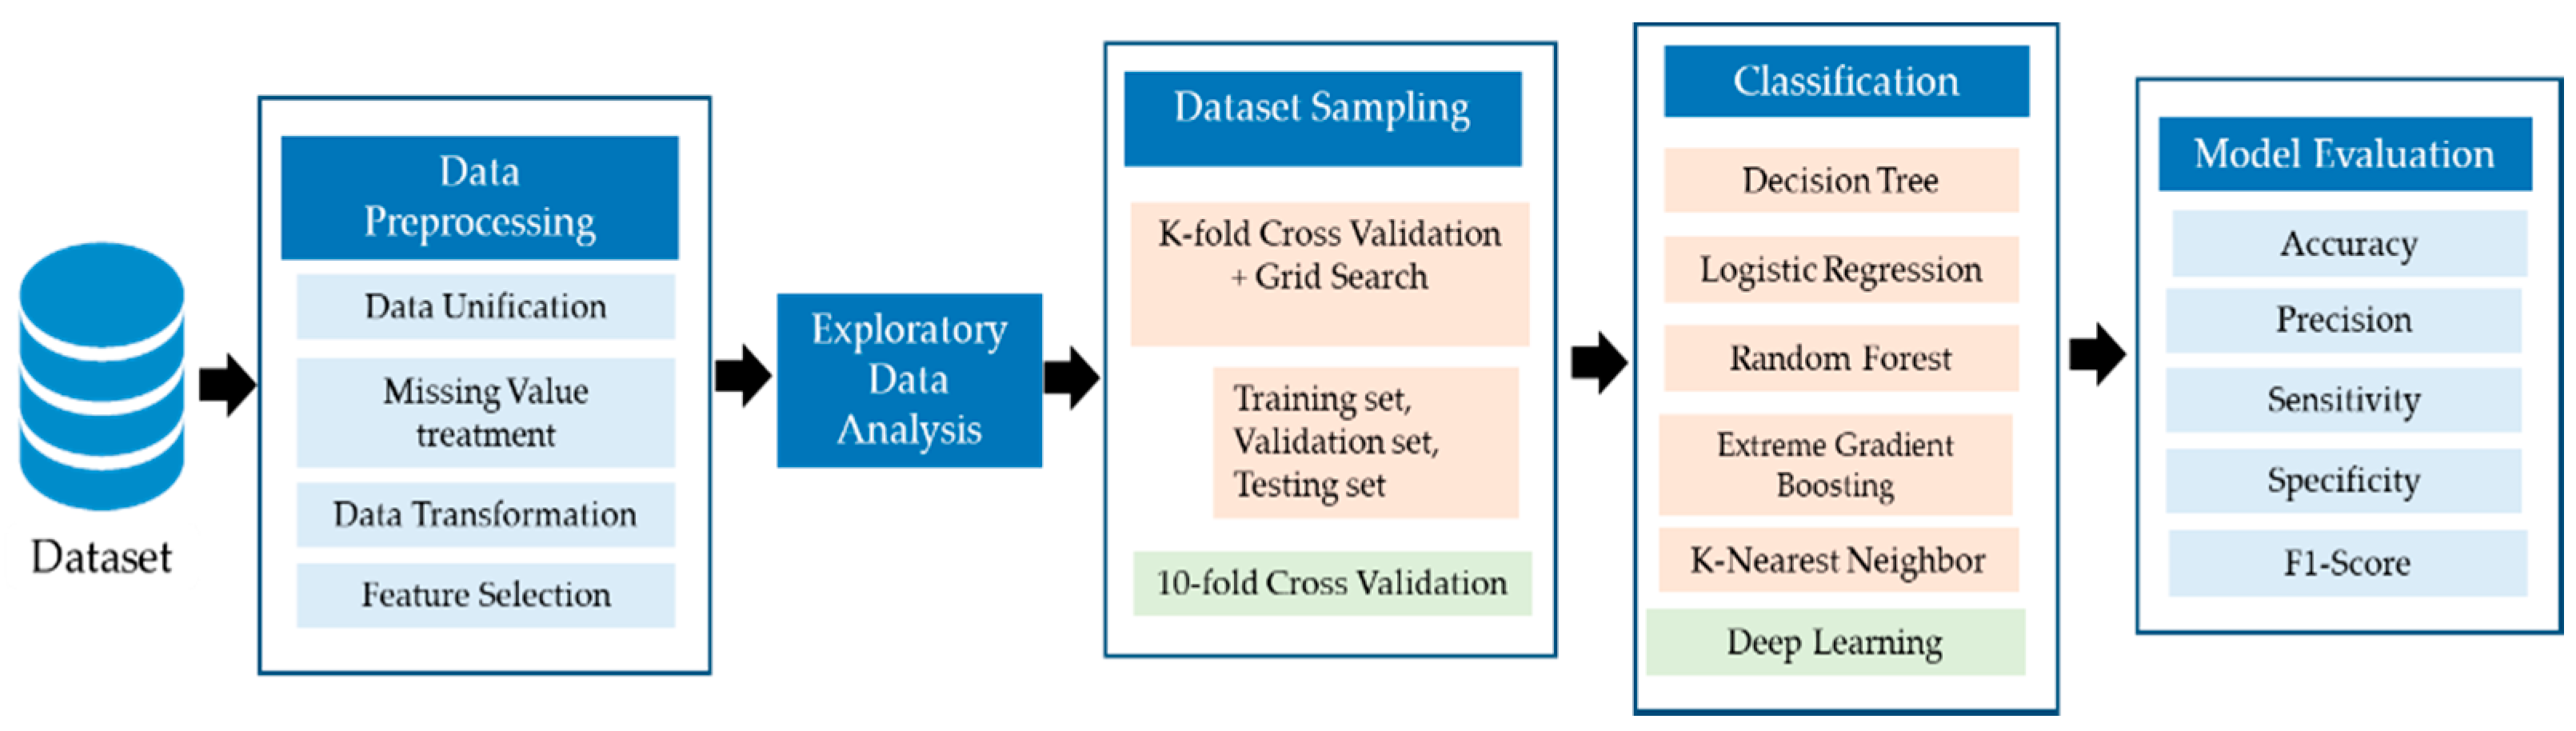
4. Materials and Methods
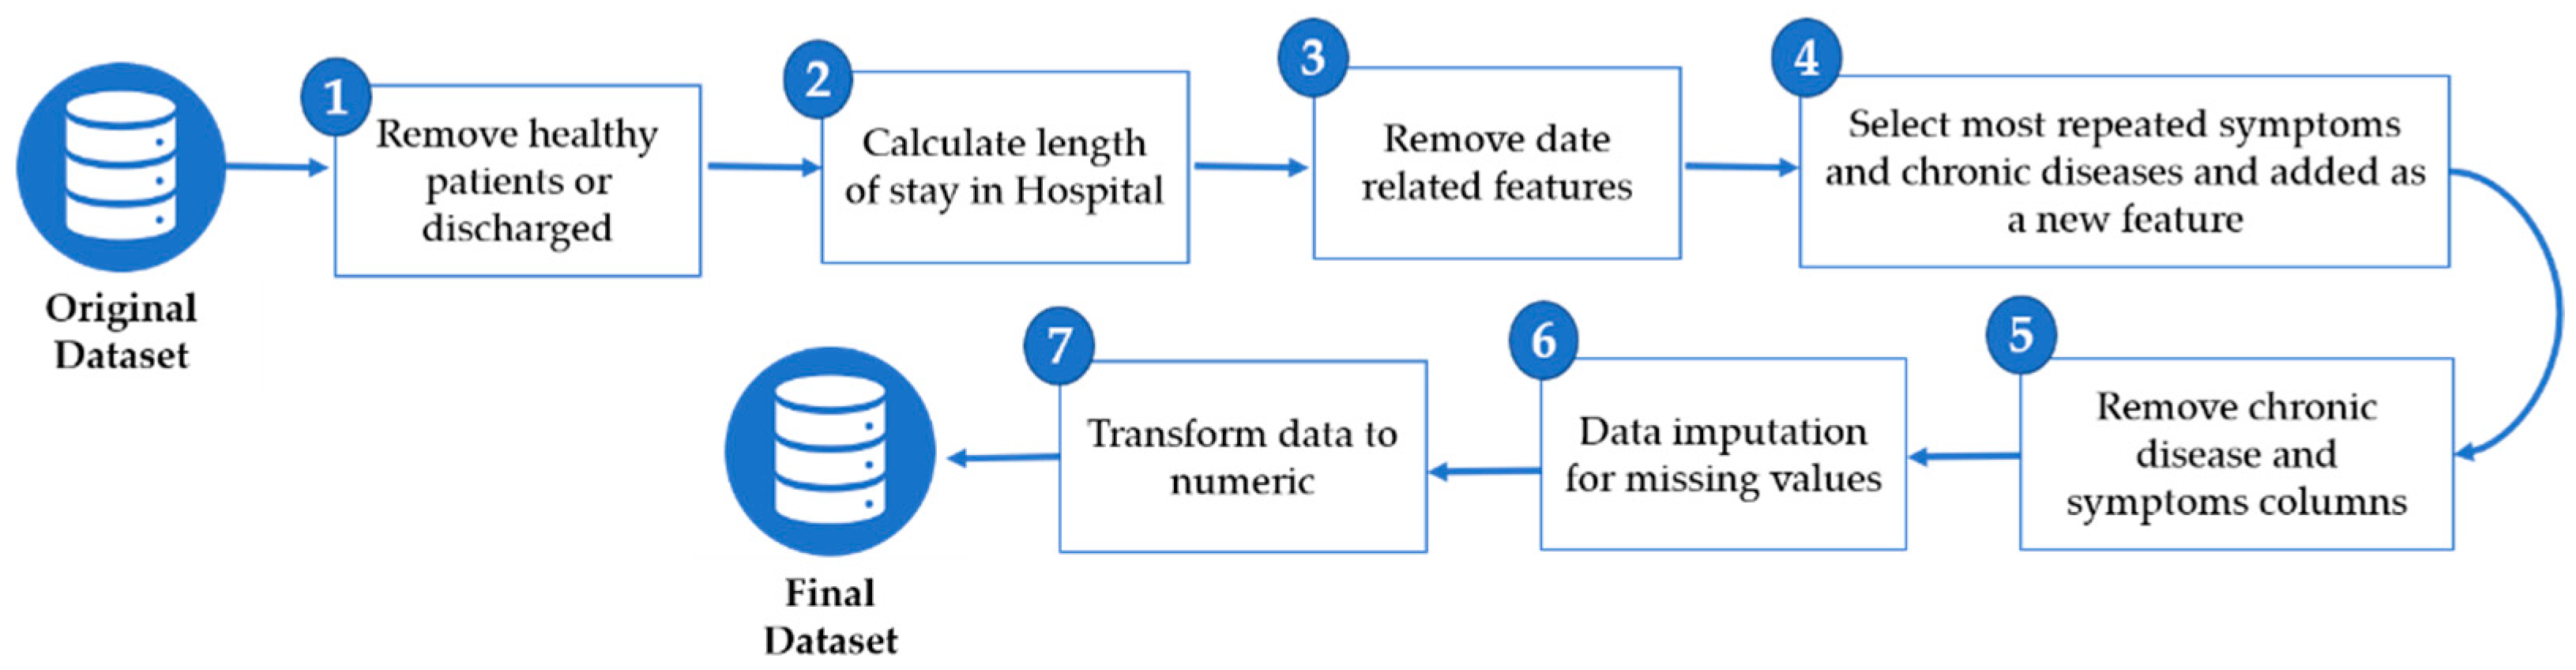
4.1. Data Preprocessing
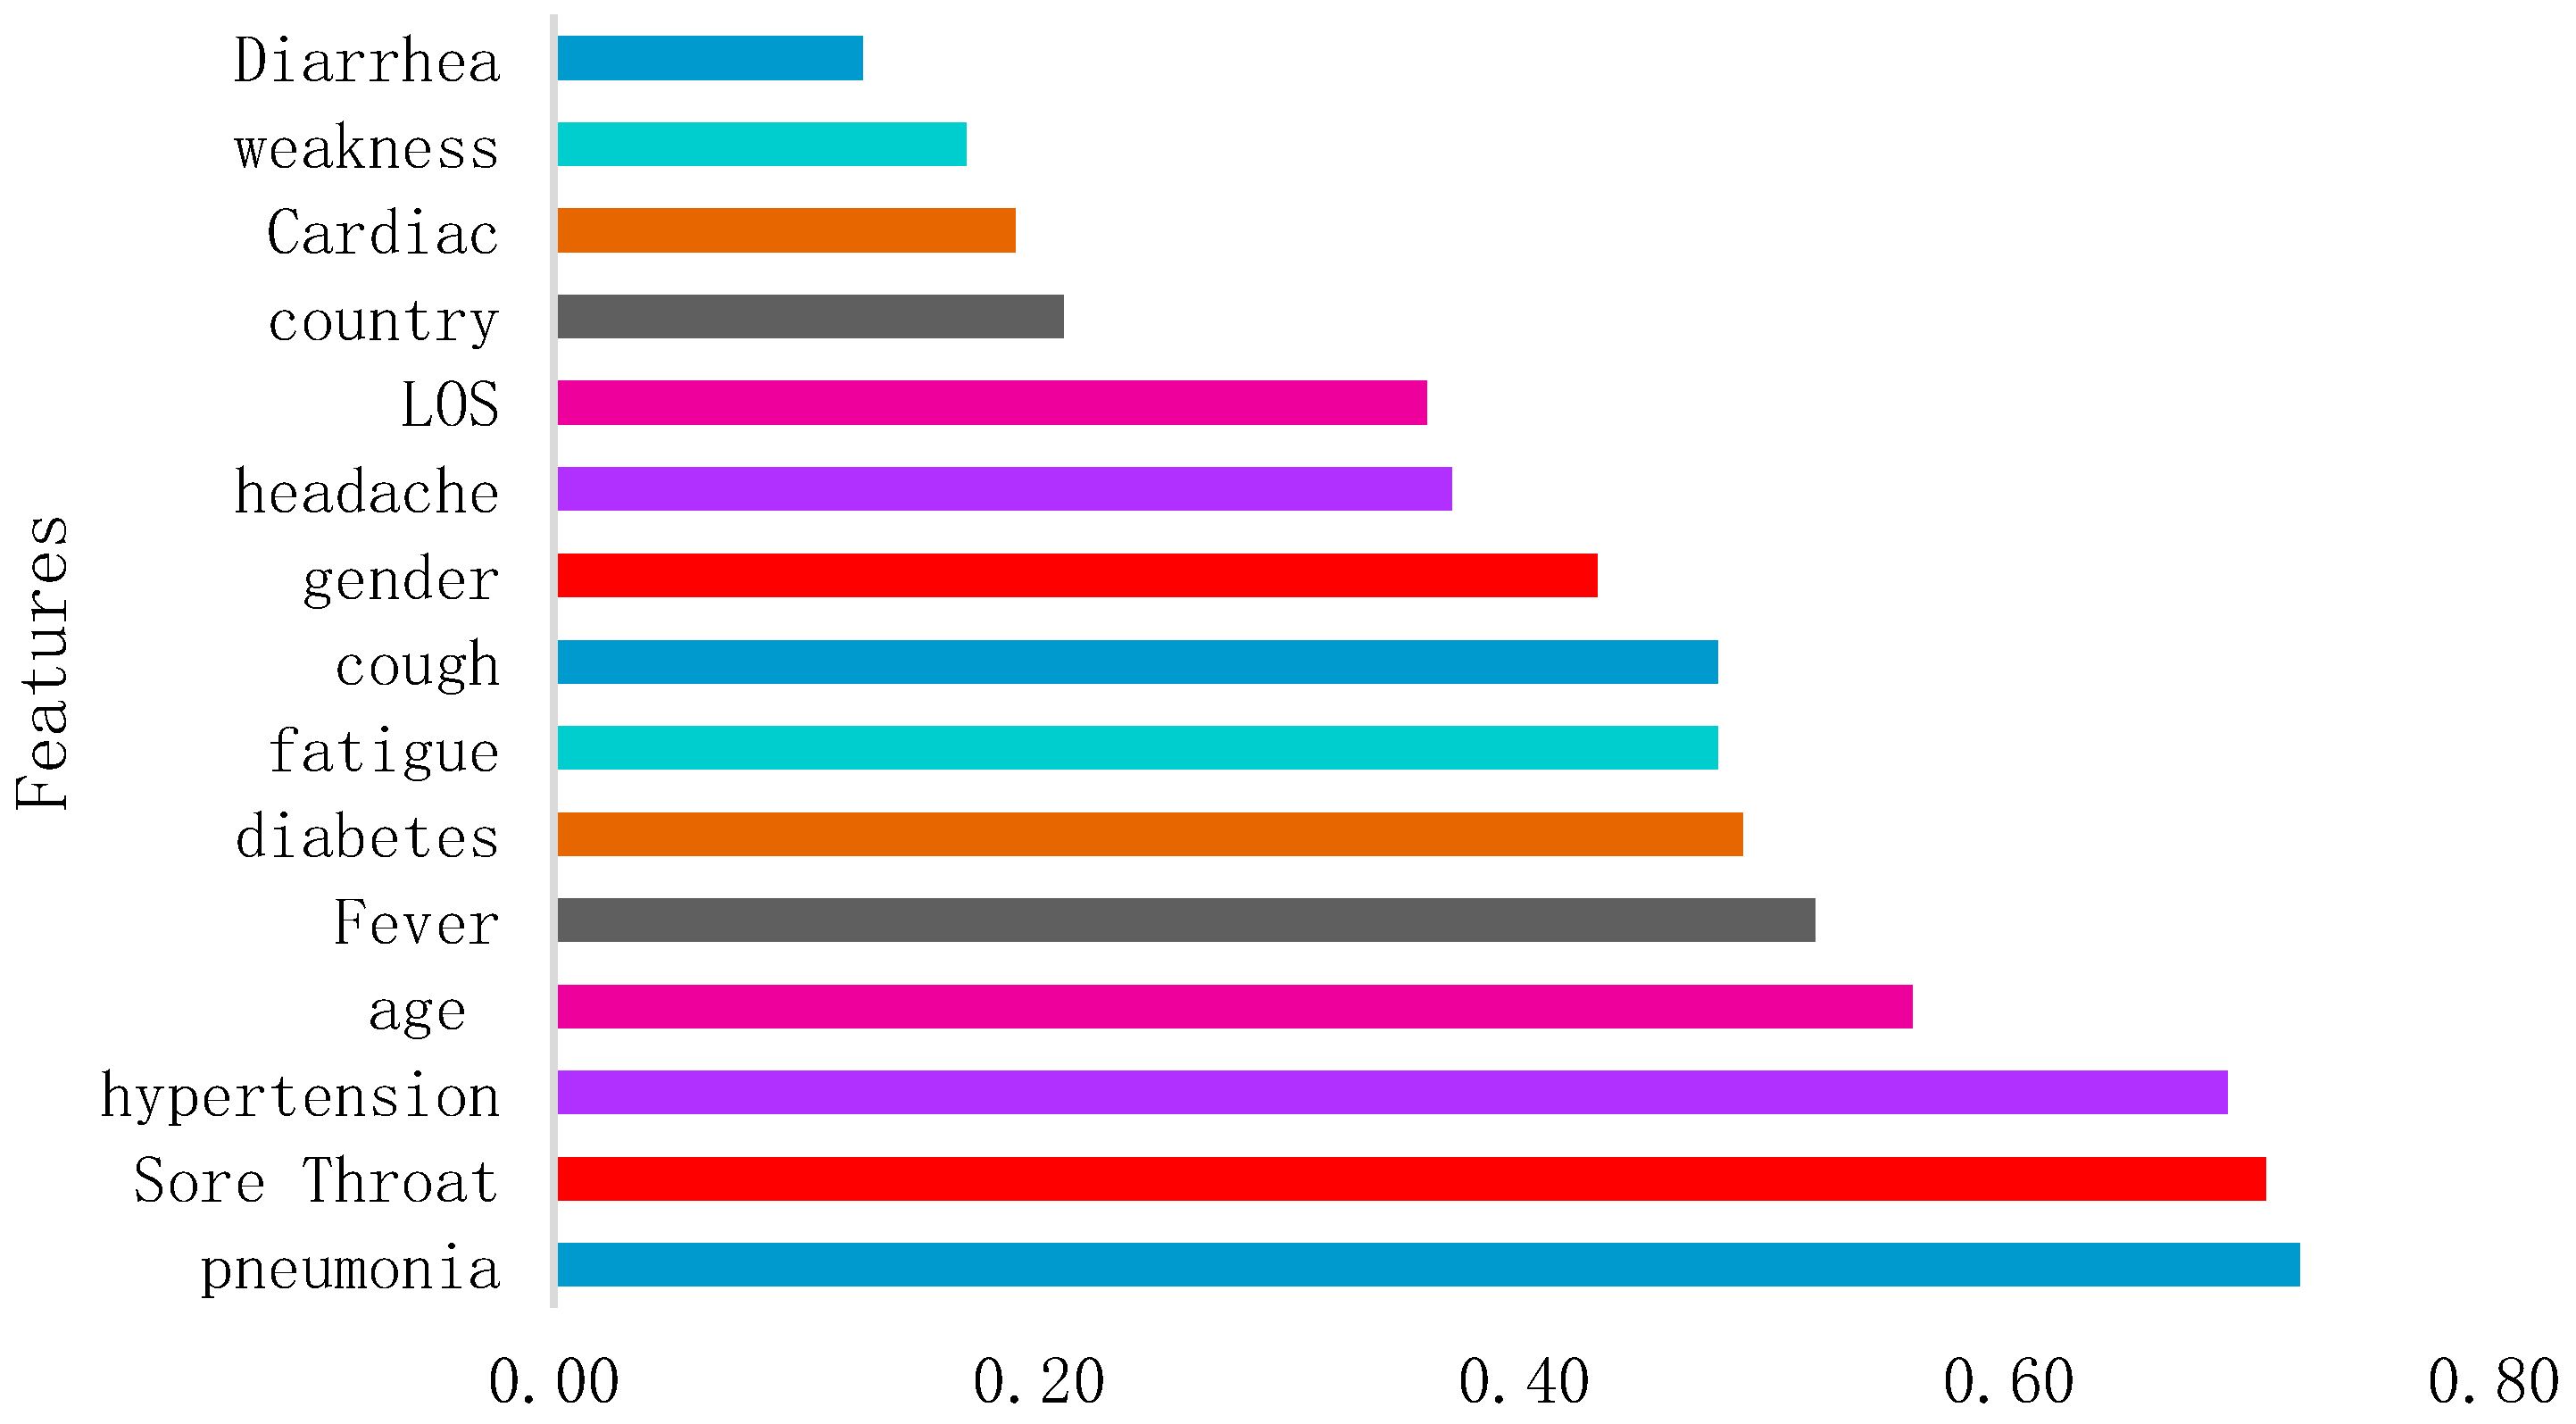
4.2. Exploratory Data Analysis
4.3. Predictive Algorithms
- Decision Tree (DT)
- ○
- The explanatory models provide a useful description about a phenomenon, unlike more complex models such as neural networks, where extracting knowledge is complex.
- ○
- The non-parametric model assumes that the distribution of data is not defined by a finite set of parameters. During the learning process, the tree can grow depending on the problem’s complexity.
- Logistic Regression (LR)
- penalty: to specify the penalization norm;
- random_state: for shuffling the data;
- max_iter: the maximum number of iterations for the algorithm to converge;
- tol: this refers to the tolerance for the stopping criteria [31].
- Random Forest (RF)
- n_estimators: the number of generated trees;
- max_depth: the maximum levels in each tree;
- min_samples_split: the minimum number of node data before it splits;
- min_samples_leaf: the minimum amount of data that can populate the leaf node [33].
- Extreme Gradient Boosting (XGBoost)
- K-Nearest Neighbor (KNN)
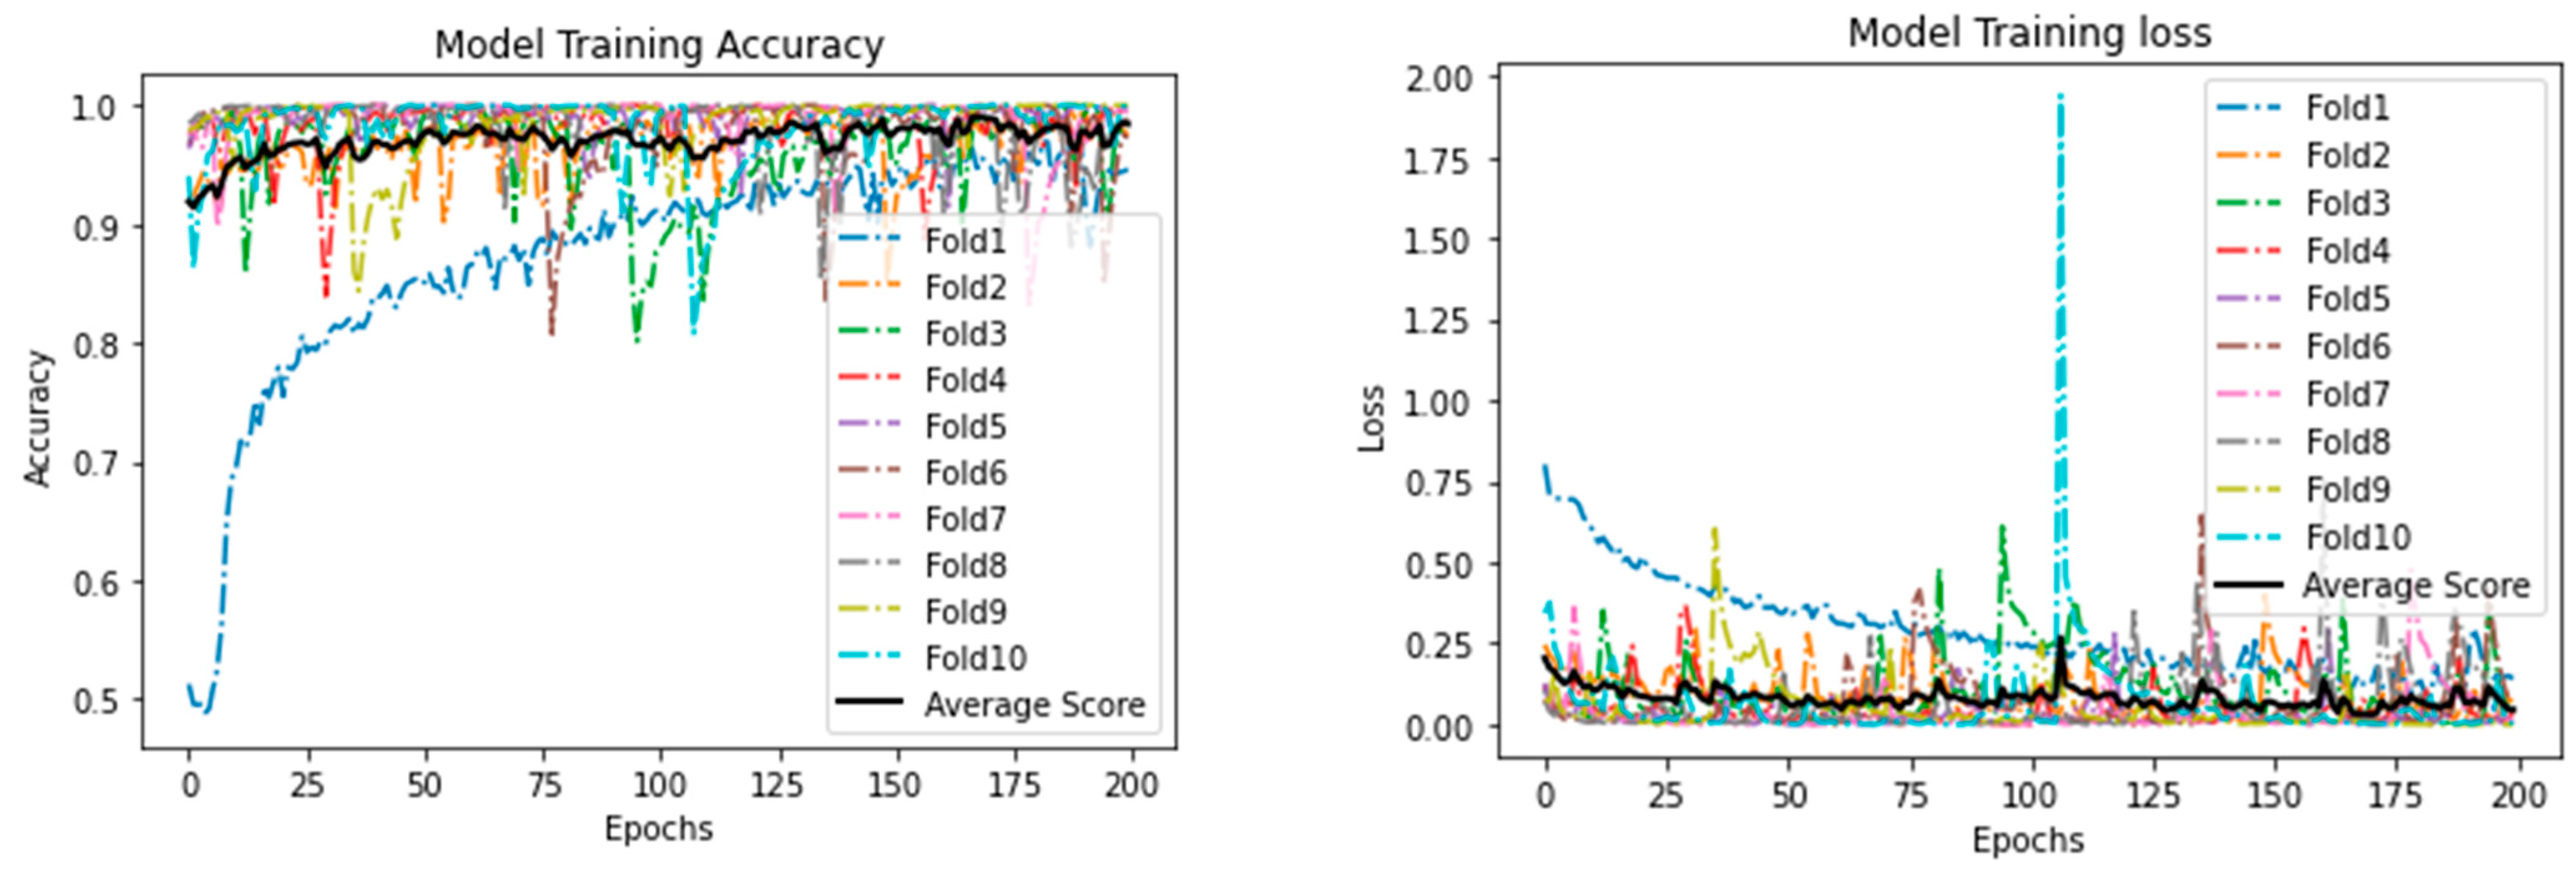
- Deep Learning Model
- ○
- Input layer: in this layer, the values of inputs xn enter the neural network. For each input, the weight wn is applied, before their summation is sent to the hidden layer in which the activation function ƒ is used.
- ○
- Hidden layer: in this layer, the activation function ƒ uses the summation from the input layer including a bias b and sends it to all nodes in the next hidden layer, which eventually produces the output variable yn.
- ○
- Output layer: in this layer, the output value is determined with the lowest error rate possible, and backpropagation is applied to reduce the error rate by using the gradient descent algorithm to adjust new weights Wn.
4.4. Evaluation Measures
5. Results and Discussion
6. Conclusions and Recommendation
- Comparative analysis of the DL and ML models in predicting the mortality rate of COVID-19 patients;
- The study proposed a model to achieve better results with reduced number of features as compared to the baseline study;
- In general, the proposed DL model outperformed the baseline study in terms of all performance evaluation measures. The model can be an effective tool for the early prediction of at-risk COVID-19 patients.
Author Contributions
Funding
Institutional Review Board Statement
Informed Consent Statement
Data Availability Statement
Conflicts of Interest
References
- Coronavirus. Available online: https://www.who.int/health-topics/coronavirus#tab=tab_1 (accessed on 16 February 2021).
- WHO. Weekly Operational Update on COVID-19. World Heal. Organ. 2021, 1–10. Available online: https://www.who.int/publications/m/item/weekly-update-on-covid-19---16-october-2020 (accessed on 18 April 2021).
- Did Hospital Capacity Affect Mortality during the Pandemic’s First Wave—The Health Foundation. Available online: https://www.health.org.uk/news-and-comment/charts-and-infographics/did-hospital-capacity-affect-mortality-during-the-pandemic (accessed on 16 February 2021).
- Du, R.-H.; Liang, L.-R.; Yang, C.-Q.; Wang, W.; Cao, T.-Z.; Li, M.; Guo, G.-Y.; Du, J.; Zheng, C.-L.; Zhu, Q.; et al. Predictors of mortality for patients with COVID-19 pneumonia caused by SARSCoV- 2: A prospective cohort study. Eur. Respir. J. 2020, 55. [Google Scholar] [CrossRef] [PubMed] [Green Version]
- Chen, Z.-L.; Zhang, W.-J.; Lu, Y.; Guo, C.; Guo, Z.-M.; Liao, C.-H.; Zhang, X.; Zhang, Y.; Han, X.-H.; Li, Q.-L.; et al. From severe acute respiratory syndrome-associated coronavirus to 2019 novel coronavirus outbreak: Similarities in the early epidemics and prediction of future trends. Chin. Med. J. Engl. 2020, 133, 1112–1114. [Google Scholar] [CrossRef] [PubMed]
- OECD. Using Artificial Intelligence to Help Combat COVID-19; OECD: Paris, France, 2020; pp. 1–5. Available online: https://www.oecd.org/coronavirus/policy-responses/using-artificial-intelligence-to-help-combat-covid-19-ae4c5c21/ (accessed on 18 April 2021).
- AI and Control of Covid-19 Coronavirus. Available online: https://www.coe.int/en/web/artificial-intelligence/ai-and-control-of-covid-19-coronavirus (accessed on 16 February 2021).
- Laudanski, K.; Shea, G.; DiMeglio, M.; Restrepo, M.; Solomon, C. What Can COVID-19 Teach Us about Using AI in Pandemics? Healthcare 2020, 8, 527. [Google Scholar] [CrossRef]
- Aljameel, S.S.; Khan, I.U.; Aslam, N.; Aljabri, M.; Alsulmi, E.S. Machine Learning-Based Model to Predict the Disease Severity and Outcome in COVID-19 Patients. Sci. Program. 2021, 2021. [Google Scholar] [CrossRef]
- Ko, H.; Chung, H.; Kang, W.S.; Park, C.; Kim, D.W.; Kim, S.E.; Chung, C.R.; Ko, R.E.; Lee, H.; Seo, J.H.; et al. An Artificial Intelligence Model to Predict the Mortality of COVID-19 Patients at Hospital Admission Time Using Routine Blood Samples: Development and Validation of an Ensemble Model. J. Med. Internet. Res. 2020, 22. [Google Scholar] [CrossRef]
- Yadaw, A.S.; Li, Y.C.; Bose, S.; Iyengar, R.; Bunyavanich, S.; Pandey, G. Clinical features of COVID-19 mortality: Development and validation of a clinical prediction model. Lancet Digit. Health 2020, 2, e516–e525. [Google Scholar] [CrossRef]
- Bertsimas, D.; Lukin, G.; Mingardi, L.; Nohadani, O.; Orfanoudaki, A.; Stellato, B.; Wiberg, H.; Gonzalez-Garcia, S.; Parra-Calderón, C.L.; Robinson, K.; et al. COVID-19 mortality risk assessment: An international multi-center study. PLoS ONE 2020, 15, e0243262. [Google Scholar] [CrossRef]
- Karthikeyan, A.; Garg, A.; Vinod, P.K.; Priyakumar, U.D. Machine learning based clinical decision support system for early COVID-19 mortality prediction. medRxiv 2020. [Google Scholar] [CrossRef]
- Vaid, A.; Somani, S.; Russak, A.J.; De Freitas, J.K.; Chaudhry, F.F.; Paranjpe, I.; Johnson, K.W.; Lee, S.J.; Miotto, R.; Richter, F.; et al. Machine learning to predict mortality and critical events in a cohort of patients with COVID-19 in New York City: Model development and validation. J. Med. Internet Res. 2020, 22, 1–19. [Google Scholar] [CrossRef]
- Das, S.S.G.A.K.; Mishra, S. Predicting CoVID-19 community mortality risk using machine learning and development of an online prognostic tool. Peer J. 2020, 8. [Google Scholar] [CrossRef]
- An, C.; Lim, H.; Kim, D.W.; Chang, J.H.; Choi, Y.J.; Kim, S.W. Machine learning prediction for mortality of patients diagnosed with COVID-19: A nationwide Korean cohort study. Sci. Rep. 2020, 10. [Google Scholar] [CrossRef] [PubMed]
- Sánchez-Montañés, M.; Rodríguez-Belenguer, P.; Serrano-López, A.J.; Soria-Olivas, E.; Alakhdar-Mohmara, Y. Machine learning for mortality analysis in patients with COVID-19. Int. J. Environ. Res. Public Health 2020, 17, 8386. [Google Scholar] [CrossRef] [PubMed]
- Ryan, L.; Lam, C.; Mataraso, S.; Allen, A.; Green-Saxena, A.; Pellegrini, E.; Hoffman, J.; Barton, C.; McCoy, A.; Das, R. Mortality prediction model for the triage of COVID-19, pneumonia, and mechanically ventilated ICU patients: A retrospective study. Ann. Med. Surg. 2020, 59, 207–216. [Google Scholar] [CrossRef]
- Parchure, P.; Joshi, H.; Dharmarajan, K.; Freeman, R.; Reich, D.L.; Mazumdar, M.; Timsina, P.; Kia, A. Development and validation of a machine learning-based prediction model for near-term in-hospital mortality among patients with COVID-19. BMJ Support. Palliat. Care 2020, 1–8. [Google Scholar] [CrossRef]
- Agbelusi, O.; Olufunke, O. Prediction of Mortality Rate of COVID-19 Patients using Machine Learning Techniques in Nigeria. Int. J. Comput. Sci. Softw. Eng. 2020, 9, 30–34. [Google Scholar]
- Tezza, F.; Lorenzoni, G.; Azzolina, D.; Barbar, S.; Leone, L.A.C.; Gregori, D. Predicting in-Hospital Mortality of Patients with COVID-19 Using Machine Learning Techniques. J. Pers. Med. 2021, 11, 343. [Google Scholar] [CrossRef]
- Ferreira, A.T.; Fernandes, C.; Vieira, J.; Portela, F. Pervasive Intelligent Models to Predict the Outcome of COVID-19 Patients. Future Internet 2021, 13, 102. [Google Scholar] [CrossRef]
- López-Escobar, A.; Madurga, R.; Castellano, J.; Velázquez, S.; del Villar, R.S.; Menéndez, J.; Peixoto, A.; Jimeno, S.; Ventura, P.; de Aguiar, S.R. Risk Score for Predicting In-Hospital Mortality in COVID-19 (RIM Score). Diagnostics 2021, 11, 596. [Google Scholar] [CrossRef]
- Pourhomayoun, M.; Shakibi, M. Predicting mortality risk in patients with COVID-19 using artificial intelligence to help medical decision-making. medRxiv 2020. [Google Scholar] [CrossRef] [Green Version]
- Li, X.; Ge, P.; Zhu, J.; Li, H.; Graham, J.; Singer, A.; Richman, P.S.; Duong, T.Q. Deep learning prediction of likelihood of ICU admission and mortality in COVID-19 patients using clinical variables. Peer J. 2019, 8, 1–19. [Google Scholar] [CrossRef] [PubMed]
- Dhamodharavadhani, J.M.C.S.; Rathipriya, R. COVID-19 Mortality Rate Prediction for India Using Statistical Neural Network Models. Front. Public Health 2020, 8, 441. [Google Scholar] [CrossRef] [PubMed]
- Zhu, J.S.; Ge, P.; Jiang, C.; Zhang, Y.; Li, X.; Zhao, Z.; Zhang, L.; Duong, T.Q. Deep-learning artificial intelligence analysis of clinical variables predicts mortality in COVID-19 patients. J. Am. Coll. Emerg. Physicians Open 2020, 1, 1364–1373. [Google Scholar] [CrossRef] [PubMed]
- Li, Z.; Ding, C.; Wang, S.; Wen, W.; Zhou, Y.; Liu, C.; Qiu, Q.; Xu, W.; Lin, X.; Qian, X.; et al. Efficient Recurrent Neural Networks: Design Optimization for Efficient Recurrent Neural Networks in FPGAs. Available online: https://arxiv.org/abs/1812.07106 (accessed on 12 December 2018).
- Xu, B.; Gutierrez, B.; Mekaru, S.; Sewalk, K.; Goodwin, L.; Loskill, A.; Cohn, E.L.; Hswen, Y.; Hill, S.C.; Cobo, M.M.; et al. Epidemiological data from the COVID-19 outbreak, real-time case information. Sci. Data 2020, 7. [Google Scholar] [CrossRef]
- Bowlee, J. Logistic Regression for Machine Learning; Machine Learning Mastery: San Juan, Puerto Rico, 2016. [Google Scholar]
- Sklearn.linear_model.LogisticRegression—Scikit-learn 0.24.1 Documentation. Available online: https://scikit-learn.org/stable/modules/generated/sklearn.linear_model.LogisticRegression.html (accessed on 18 April 2021).
- Here, S. How to Implement Random Forest from Scratch in Python; Machine Learning Mastery: San Juan, Puerto Rico, 2017; pp. 1–23. [Google Scholar]
- Koehrsen, W. Hyperparameter Tuning the Random Forest in Python; Towards Data Science: Toronto, CA, Canada, 2018. [Google Scholar]
- Brownlee, J. A Gentle Introduction to XGBoost for Applied Machine Learning; Machine Learning Mastery: San Juan, Puerto Rico, 2016; pp. 1–20. [Google Scholar]
- Chen, T.; Guestrin, C. XGBoost: A scalable tree boosting system. In Proceedings of the 22nd ACM SIGKDD International Conference on Knowledge Discovery and Data Mining, San Francisco, CA, USA, 13–17 August 2016; pp. 785–794. [Google Scholar] [CrossRef] [Green Version]
- Zhang, L.; Zhan, C. Machine Learning in Rock Facies Classification: An Application of XGBoost. In Proceedings of the International Geophysical Conference, Qingdao, China, 17–20 April 2017; pp. 1371–1374. [Google Scholar] [CrossRef]
- Agarwal, S. Data mining: Data mining concepts and techniques. In Proceedings of the 2013 International Conference on Machine Intelligence and Research Advancement (ICMIRA), Katra, India, 21–23 December 2013. [Google Scholar]
- Joshi, R. Accuracy, Precision, Recall & F1 Score: Interpretation of Performance Measures; Exsilio Inc.: Irvine, CA, USA, 2016. [Google Scholar]
- Swift, A.; Heale, R.; Twycross, A. What are sensitivity and specificity? Evid. Based. Nurs. 2020, 23, 2–4. [Google Scholar] [CrossRef] [PubMed] [Green Version]


| Reference | Technique | Dataset Size | Feature Selection | Results |
|---|---|---|---|---|
| [9] | RF | 287 COVID-19 patients | Extra tree classifiers | ACC:0.95 AUC: 0.99 |
| [10] | Ensemble based on RF and DNN. | 467 COVID-19 patients | ANOVA, ADR | ACC: 0.92 SPE: 0.91 SEN: 1 |
| [11] | SVM, RF, LR, XGBoost | 3841 COVID-19 patients | Recursive feature elimination | AUC: 0.91 |
| [12] | XGBoost | 3062 COVID-19 patients | - | AUC: 0.901 ACC: 0.85 NPV: 0.93 |
| [13] | NN | 370 COVID-19 patients | backward step-down | ACC: 0.965 F1 score: 0.969 AUC: 0.989 |
| [14] | XGBoost | 4098 COVID-19 patients | SHAP, LASSO | AUC: 0.89 |
| [15] | LR | 3524 COVID-19 patients | - | ACC: 0.968 AUC: 0.830 |
| [16] | SVM(Linear) | 10,237 COVID-19 patients | L1-norm | AUC: 0.963 ACC: 0.911 |
| [17] | LR | 2307 COVID-19 patients | - | AUC: 0.89 SEN: 0.81 SPE: 0.81 |
| [18] | XGBoost | ~60,000 patients | - | AUC: 0.91 |
| [19] | RF | 567 COVID-19 patients | Gini importance criteria | ACC: 0.655 AUC: 0.855 |
| [20] | MLP | 302 responses from an online survey | - | ACC: 0.85 |
| [21] | RF | 341 COVID-19 patients | - | ROC: 0.84 |
| [22] | DT | - | - | SEN: 0.95 ACC: 0.90 SPE: 0.86 |
| [23] | LR | 1955 COVID-19 patients | - | AUC: 0.891 |
| [24] | ANN | 3,073,82l COVID-19 patients | - | ACC: 0.8998 |
| Reference | Technique | Dataset Size | Feature Selection | Results |
|---|---|---|---|---|
| [25] | DL with 5 condensed layers | 1108 COVID-19 patients | Boruta | AUC: 0.844 ACC: 0.853 |
| [26] | RBFNN, PNN | - | - | RMSE:7.89 R:0.99 |
| [27] | DL | 181 COVID-19 patients | - | risk score AUC: 0.968 severity score AUC: 0.756 PSI AUC: 0.838 CURB-65 score AUC: 0.67 |
| [28] | RNN | 3780 and 2307 COVID-19 confirmed cases from 2 datasets | Entropy, information gain, Gini index, chi-square | SEN: 0.84 |
| Feature Type | Feature Name | Datatype | Values (Unique) |
|---|---|---|---|
| Demographic | Age | Numeric | 101 |
| Sex | Categorical | 3 | |
| Country | Categorical | 76 | |
| Hospital Attribute | LOS | Numeric | 34 |
| Symptoms | Fatigue | Categorical | 2 |
| Fever | Categorical | 2 | |
| Weakness | Categorical | 2 | |
| Pneumonia | Categorical | 2 | |
| Cough | Categorical | 2 | |
| Diarrhoea | Categorical | 2 | |
| Sore Throat | Categorical | 2 | |
| Headache | Categorical | 2 | |
| Chronic Disease | Hypertension | Categorical | 2 |
| Diabetes | Categorical | 2 | |
| Cardiac | Categorical | 2 | |
| Target | Outcome | Categorical | 2 |
| Parameter | Value |
|---|---|
| Penalty | l2 |
| Random_state | 777 |
| Max_iter | 10,000 |
| Tol | 10 |
| Parameter | Value |
|---|---|
| n_estimators | 100 |
| max_depth | 15 |
| min_samples_split | 5 |
| min_samples_leaf | 1 |
| Parameter | Value |
|---|---|
| Objective | binary: logistic |
| Random_state | 42 |
| Classifier | Accuracy | Precision | Sensitivity | Specificity | F1-Score |
|---|---|---|---|---|---|
| Decision Tree | 0.945 | 0.998 | 0.947 | 0.799 | 0.972 |
| Logistic Regression | 0.945 | 0.998 | 0.946 | 0.777 | 0.972 |
| Random Forest | 0.946 | 0.998 | 0.947 | 0.807 | 0.972 |
| XGBoost | 0.946 | 0.998 | 0.947 | 0.810 | 0.972 |
| K-Nearest Neighbors | 0.944 | 0.997 | 0.947 | 0.699 | 0.971 |
| DNN | 0.970 | 1.000 | 0.970 | 1.000 | 0.985 |
| Reference | Year | Techniques | Features Used | Accuracy |
|---|---|---|---|---|
| [24] | 2021 | NN | 57 features | 0.8998 |
| Proposed study | 2021 | DNN | 15 features | 0.970 |
Publisher’s Note: MDPI stays neutral with regard to jurisdictional claims in published maps and institutional affiliations. |
© 2021 by the authors. Licensee MDPI, Basel, Switzerland. This article is an open access article distributed under the terms and conditions of the Creative Commons Attribution (CC BY) license (https://creativecommons.org/licenses/by/4.0/).
Share and Cite
Khan, I.U.; Aslam, N.; Aljabri, M.; Aljameel, S.S.; Kamaleldin, M.M.A.; Alshamrani, F.M.; Chrouf, S.M.B. Computational Intelligence-Based Model for Mortality Rate Prediction in COVID-19 Patients. Int. J. Environ. Res. Public Health 2021, 18, 6429. https://doi.org/10.3390/ijerph18126429
Khan IU, Aslam N, Aljabri M, Aljameel SS, Kamaleldin MMA, Alshamrani FM, Chrouf SMB. Computational Intelligence-Based Model for Mortality Rate Prediction in COVID-19 Patients. International Journal of Environmental Research and Public Health. 2021; 18(12):6429. https://doi.org/10.3390/ijerph18126429
Chicago/Turabian StyleKhan, Irfan Ullah, Nida Aslam, Malak Aljabri, Sumayh S. Aljameel, Mariam Moataz Aly Kamaleldin, Fatima M. Alshamrani, and Sara Mhd. Bachar Chrouf. 2021. "Computational Intelligence-Based Model for Mortality Rate Prediction in COVID-19 Patients" International Journal of Environmental Research and Public Health 18, no. 12: 6429. https://doi.org/10.3390/ijerph18126429
APA StyleKhan, I. U., Aslam, N., Aljabri, M., Aljameel, S. S., Kamaleldin, M. M. A., Alshamrani, F. M., & Chrouf, S. M. B. (2021). Computational Intelligence-Based Model for Mortality Rate Prediction in COVID-19 Patients. International Journal of Environmental Research and Public Health, 18(12), 6429. https://doi.org/10.3390/ijerph18126429