Article

Boredom Makes Me Sick: Adolescents’ Boredom Trajectories and Their Health-Related Quality of Life

1
Department of Psychology, Ludwig-Maximilians-Universität München, 80539 Munich, Germany
2
Department of Developmental and Educational Psychology, Faculty of Psychology, University of Vienna, 1010 Vienna, Austria
3
Department of Psychology, University of Essex, Colchester CO4 3SQ, UK
4
Institute for Positive Psychology and Education, Australian Catholic University, North Sydney, NSW 2060, Australia
*
Author to whom correspondence should be addressed.
Int. J. Environ. Res. Public Health 2021, 18(12), 6308; https://doi.org/10.3390/ijerph18126308
Submission received: 19 April 2021 / Revised: 8 June 2021 / Accepted: 8 June 2021 / Published: 10 June 2021
(This article belongs to the Special Issue Boredom in Health, Education and Sports)

Abstract

:
Existing research shows consistent links between boredom and depression, somatic complaints, substance abuse, or obesity and eating disorders. However, comparatively little is known about potential psychological and physical health-related correlates of academic boredom. Evidence for such a relationship can be derived from the literature, as boredom has adverse consequences in both work and achievement-related settings. The present study investigates latent correlations of 1.484 adolescents’ (Mage = 13.23) mathematics boredom scores at three time points during a semester in 2018/19 and their Rasch scaled health-related quality of life (HRQoL). Moreover, we applied latent growth curve modeling to estimate boredom trajectories across the semester and determined the relationship between the latent growth parameters of student boredom and HRQoL in bivariate correlation analyses. Our results show that boredom is significantly negatively linked with all HRQoL dimensions (physical well-being, psychological well-being, autonomy and parent relation, social support and peers, school environment [SCH], and general HRQoL [GH]). Furthermore, stronger increases in boredom across the semester were negatively associated with SCH scores and GH. In conclusion, given that boredom is negatively linked with HRQoL and that stronger boredom growth is linked with more severe health-related problems, signs of academic boredom could be an early warning signal for adolescents’ potentially severe problems.

1. Introduction

While there are several different definitions of boredom, most of them agree that boredom experiences are typically characterized by a certain degree of negative valence, coupled with attentional issues, the perception of time passing slowly, and insufficient and dissatisfactory stimulation, challenge and meaning [1]. Boredom is one of the most commonly experienced emotions in educational settings [2,3]. Particularly during the adolescent years, students report elevated levels of academic boredom [4], and among U.S. adolescents, the overall experience of boredom increased steadily from 2008 to 2017 [5]. Some philosophical notions of boredom emphasized its benefits [6,7] and also in the psychological literature, it has been argued that boredom can be considered functional, for example, in the context of willpower [8]. However, academic boredom in particular, has been shown to be a largely adverse emotional experience [6] and there is consistent empirical evidence that academic boredom is linked with a multitude of problematic academic outcomes, including higher levels of achievement-related anger, anxiety, and shame [9,10], reduced motivation and effort [11,12,13], lower academic achievement [10,14,15,16,17], and dropping out of school [18,19].
Similarly, in the context of work, there is evidence that boring, monotonous working conditions are associated with emotional health complaints [20] and physical health problems, such as visual and musculoskeletal complaints, asthma, bronchitis, and hand tremors [20,21], as well as stress-related health issues such as cardiovascular diseases [22]. Furthermore, there is ample empirical evidence that general boredom proneness and leisure boredom are linked with depression [23,24,25,26,27], somatic complaints [26], substance abuse [28,29,30,31], obesity, eating disorders [32,33], and borderline personality disorder diagnosis [34,35].
However, for educational settings, evidence on psychological and physical health correlates of boredom is largely lacking. Hypotheses on such correlates can be derived from the above-mentioned literature as boredom is likely to have similar adverse consequences in work and education. Within this literature, it is discussed that boredom may exacerbate health problems, such as increased food consumption in obese individuals [32]. Conversely, it can also be the case that unhealthy behaviors such as substance abuse intensify experiences of boredom [28]. It is therefore conceivable that boredom and health are linked through reciprocal effects. Furthermore, the boredom cascade model suggests that boredom results in frustration and maladaptive escape behaviors (such as impulsive behavior induced by identity disturbance) that fuel chronic feelings of emptiness, which, in turn, generate boredom [35].
Given the lack of studies on health correlates of boredom in education, we aimed to explore whether academic boredom is linked with general psychological and physical health problems. If academic boredom is linked with psychological and physical health-related variables, then students’ boredom experienced in school could be interpreted as an early warning signal for potentially severe health problems in adolescence. With over 1.3 billion primary and secondary school students worldwide [36], schools play a crucial role in determining not only educational outcomes but also health [37], thus making them primary agents to protect and improve public health.
Boredom in school has been shown to be highly domain-specific [38]. Many recent studies on academic boredom focused on the subject of mathematics, as this subject takes an outstanding role in modern societies. Scholastic success in mathematics is important for a wide range of professions [39] and a predictor of participation in secondary education and expected future salary [40]. For example, research on mathematics boredom addressed the antecedents of boredom, such as control-value appraisals [12,41], links between boredom and achievement [10], and behavioral and personality correlates among highly bored low and high achievers [42]. In line with these studies, we operationalize academic boredom in a domain-specific way, focusing on the domain of mathematics. We conceptualized mathematics boredom as an individual differences construct [43], proposing that individuals systematically differ in their tendency to experience boredom in mathematics. We asked secondary school students about their habitual tendencies to experience mathematics boredom three times across a semester, as we aimed to assess a construct that is between trait and state dimensions, albeit more on the trait side.
The key goal of the present longitudinal study was to expand our knowledge on the relevance of mathematics boredom, by investigating whether such domain-specific boredom was linked with students’ health-related quality of life (HRQoL), as measured with the KIDSCREEN at the end of the semester [44]. Here, HRQoL is described as a multidimensional construct covering physical, emotional, mental, social, and behavioral components of well-being, functioning as perceived by the individual [45]. Developed simultaneously in several countries and validated in a large representative sample across 13 European countries, the KIDSCREEN is considered a valid measure of HRQoL and can be used to identify children and adolescents who are at increased risk of developing health problems [46]. We based our first hypothesis on this literature.
Hypothesis 1.
Trait mathematics boredom is negatively linked with HRQoL.
In addition to exploring concurrent links of boredom and HRQoL, a second important goal of the present study was to explore if changes in boredom across a semester were linked with HRQoL. Scattered prior research has shown that trajectories of academic boredom show an upward trend over time [47,48,49], with substantial changes between grades 5 and 7 [50], which is also in line with the decline in students’ interest in mathematics during adolescence [51]. We expected to replicate those findings.
Hypothesis 2.
Boredom increases across a semester for secondary school students.
Additionally, prior research has shown that there is variance in adolescents’ boredom growth trajectories. Changes in boredom were linked with contextual and individual factors such as task value, learning style, effort regulation, and academic engagement [49,52]. No study to date seems to have explored whether changes in academic boredom are related to psychological and physical health symptoms. However, based on the existing evidence on concurrent psychological and physiological correlates of boredom, it is conceivable that stronger increases in boredom are linked with lower HRQoL in adolescents, hence our third hypothesis.
Hypothesis 3.
A greater increase in boredom across a semester is associated with lower subsequent HRQoL.

2. Materials and Methods

2.1. Study Design and Procedure

To test our hypotheses that levels and growth trajectories of boredom are linked with HRQoL, we employed data collected in the context of a longitudinal field study in the subject of mathematics. The study included three assessments (T1–T3) which took place at the beginning of the semester (September 2018, T1), in November (T2), and in February 2019 (T3). Boredom was assessed at all three time points and HRQoL was measured at T3. As such, boredom and health outcomes were linked through a prospective design. At T1, the questionnaires were handed out in class, filled out at home by the students, and collected again inside sealed envelopes. At T2 and T3, the data collection was administered by undergraduate research assistants and all questionnaires were filled out in class.

2.2. Sample

The overall sample consisted of N = 1.484 (nT1 = 1.400, nT2 = 1.262, nT3 = 1.260) secondary school students from 99 classes in 30 schools in Bavaria, Germany. Due to being absent from class, missing consent forms, or a belated decision to participate in the study, 84 participants were missing at T1, 222 at T2, and 224 at T3. Ten participants were missing at both T1 and T2, 6 at T1 and T3, and 68 at T2 and T3. Missing data were handled by using the full information likelihood method (FIML; [53]). At T1, students were 9 to 18 years old, with a mean age of 13.23 years (SDage = 1.32; 52% girls, n = 770; 48% boys, n = 714). All tracks of the Bavarian three-track general secondary school system were represented, with 48% (n = 708 students) from the upper (Gymnasium), 27% (n = 397) from the middle (Realschule), and 26% (n = 379) from the lower track (Mittelschule). This distribution across tracks is equivalent with the Bavarian secondary student statistics, with a slight overrepresentation of the Gymnasium student population [54]. The students were in the fifth (n = 194), sixth (n = 204), seventh (n = 613), eighth (n = 305), ninth (n = 143), and 10th grade (n = 25). The majority of the students (86%, n = 1.275) were born in Germany, while 26% of them had at least one foreign-born parent (nmother = 195, nfather = 188, nboth = 256).

2.3. Measures

The measures were assessed as part of a more comprehensive self-report survey, assessing behavioral and personality variables.

2.3.1. Boredom

Students’ class-related, habitual (i.e., trait-like) boredom was assessed using the six-item class-related boredom scale of the Achievement Emotions Questionnaire-Mathematics (AEQ-M; [9,55]). For this subscale of the AEQ-M, instructions prompt students to “Please indicate how you feel, typically, during math class.” A sample item is “I am so bored that I can’t stay awake” (see Table A1 in the Appendix A for the full set of items used in this study, in the original German and the English versions). Students responded using a 5-point Likert scale ranging from 1 (not at all true) to 5 (completely true). The scale showed good internal consistency for all time points, with Cronbach’s α coefficients greater than 0.86 (see Table A2).

2.3.2. Health-Related Quality of Life

The German version of the KIDSCREEN-27 for children and adolescents was used to measure HRQoL [44]. Students were asked “How are you? How do you feel? This is what we would like you to tell us. Please read every question carefully. What answer comes to your mind first? Choose the box that fits your answer best and cross it. Please try to remember the last week, i.e., the last seven days.” The items comprised of five dimensions: physical well-being (PH, 5 items, e.g., “Have you felt fit and well?”), psychological well-being (PW, 7 items, e.g., “Have you felt sad?”), autonomy and parent relation (PAR, 7 items, e.g., “Have you had enough time for yourself?”), social support and peers (SOC, 4 items, e.g., “Have you been able to rely on your friends?”), and school environment (SCH, 4 items, e.g., “Have you got on well at school?”). Participants responded to all items on a 5-point Likert scale ranging from 1 (not at all) to 5 (extremely), except for the first item of PH (“In general, how would you say your health is?”) which was scored from 1 (excellent) to 5 (poor). Negatively worded items were reverse-coded, so that higher scores depict better HRQoL. The scale showed adequate internal consistency for all five dimensions; Cronbach’s α coefficients were all greater than 0.80 (see Table A2). In addition, we also obtained a general HRQoL score from the ten KIDSCREEN-27 items that constitute the KIDSCREEN-10, as suggested by the authors [45]. The development of the KIDSCREEN was based on the probabilistic partial credit model (PCM), from the Rasch family of models [56]. Both the subscale scores and the general HRQoL score have been confirmed to be valid measures of HRQoL across 13 European countries [46]. Accordingly, we also submitted our data to the probabilistic partial credit model, applying an SPSS syntax provided by the KIDSCREEN authors [45]. Next, we translated the obtained Rasch scores into T-values, using the norms provided by the KIDSCREEN authors [45]. Comparing our sample with the KIDSCREEN reference population (12 to 18-year-old adolescents), the students in our sample showed average scores within the suggested thresholds for classifying test-values as “normal” or “noticeable” (±½ SD—i.e., 5–around the mean T scores of 50) on all scales (see Table A2). As such, our sample can be considered to demonstrate “normal” physical and psychological health on average [45].

2.4. Statistical Analysis
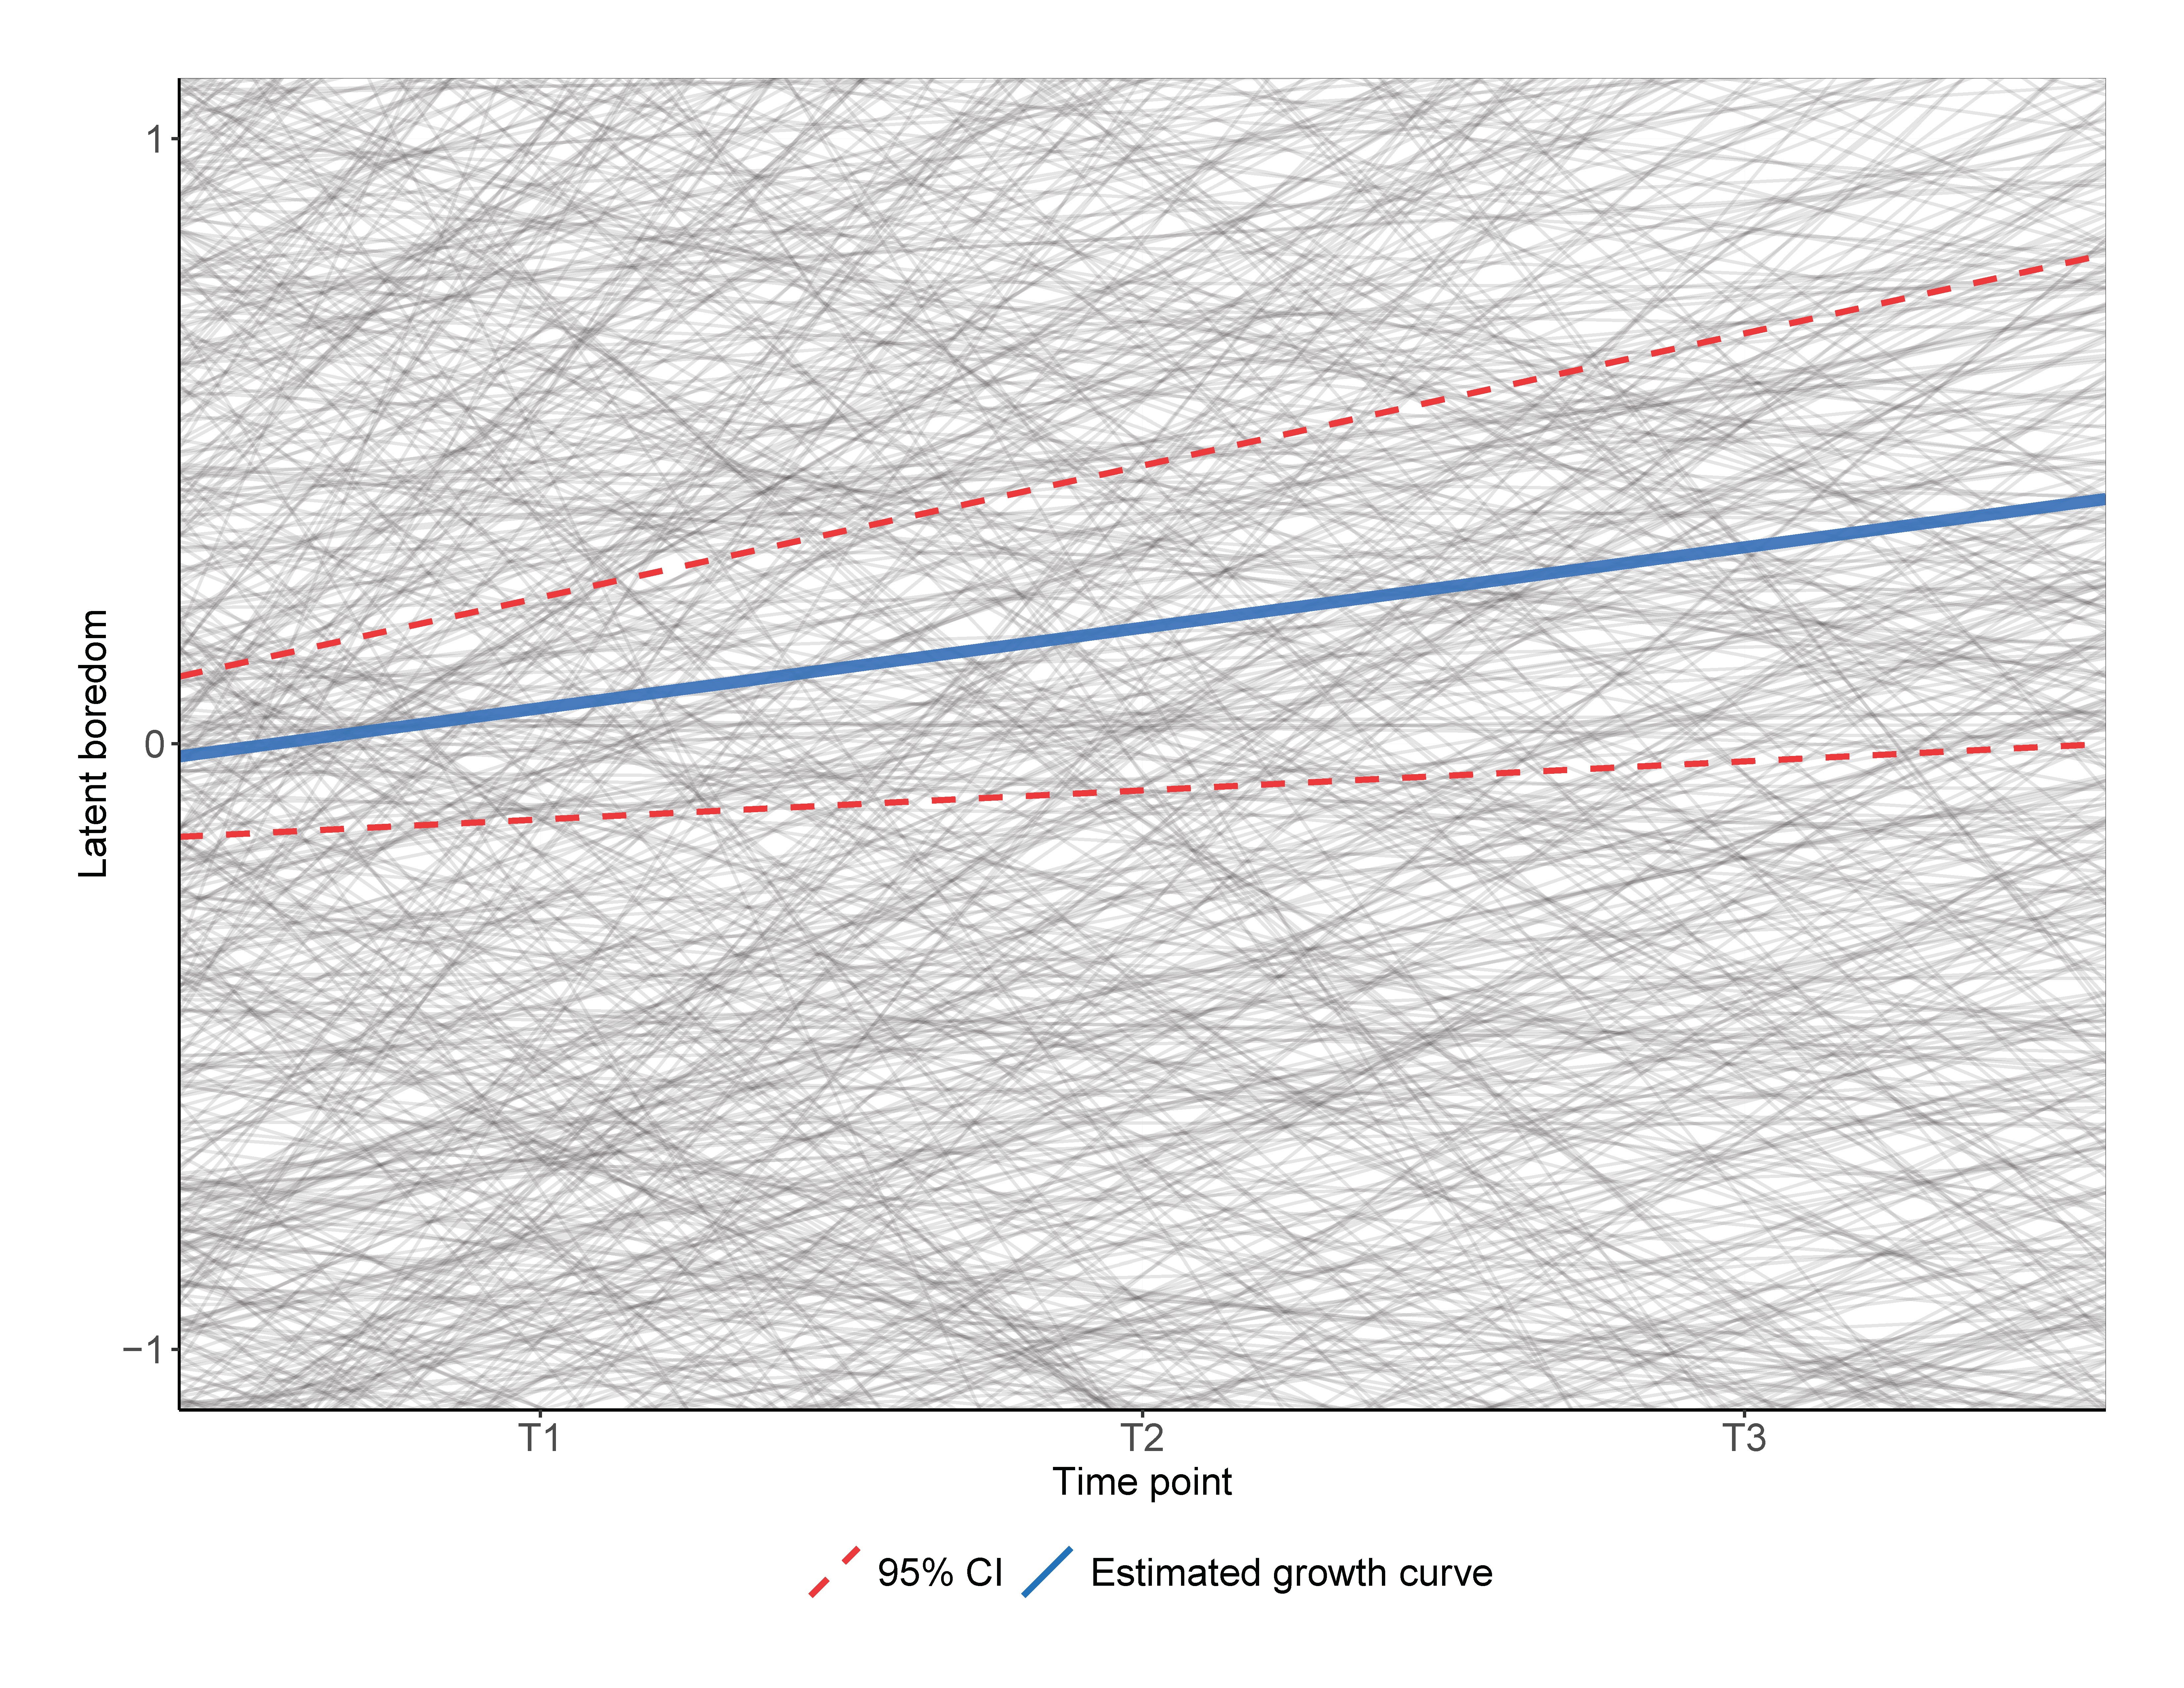
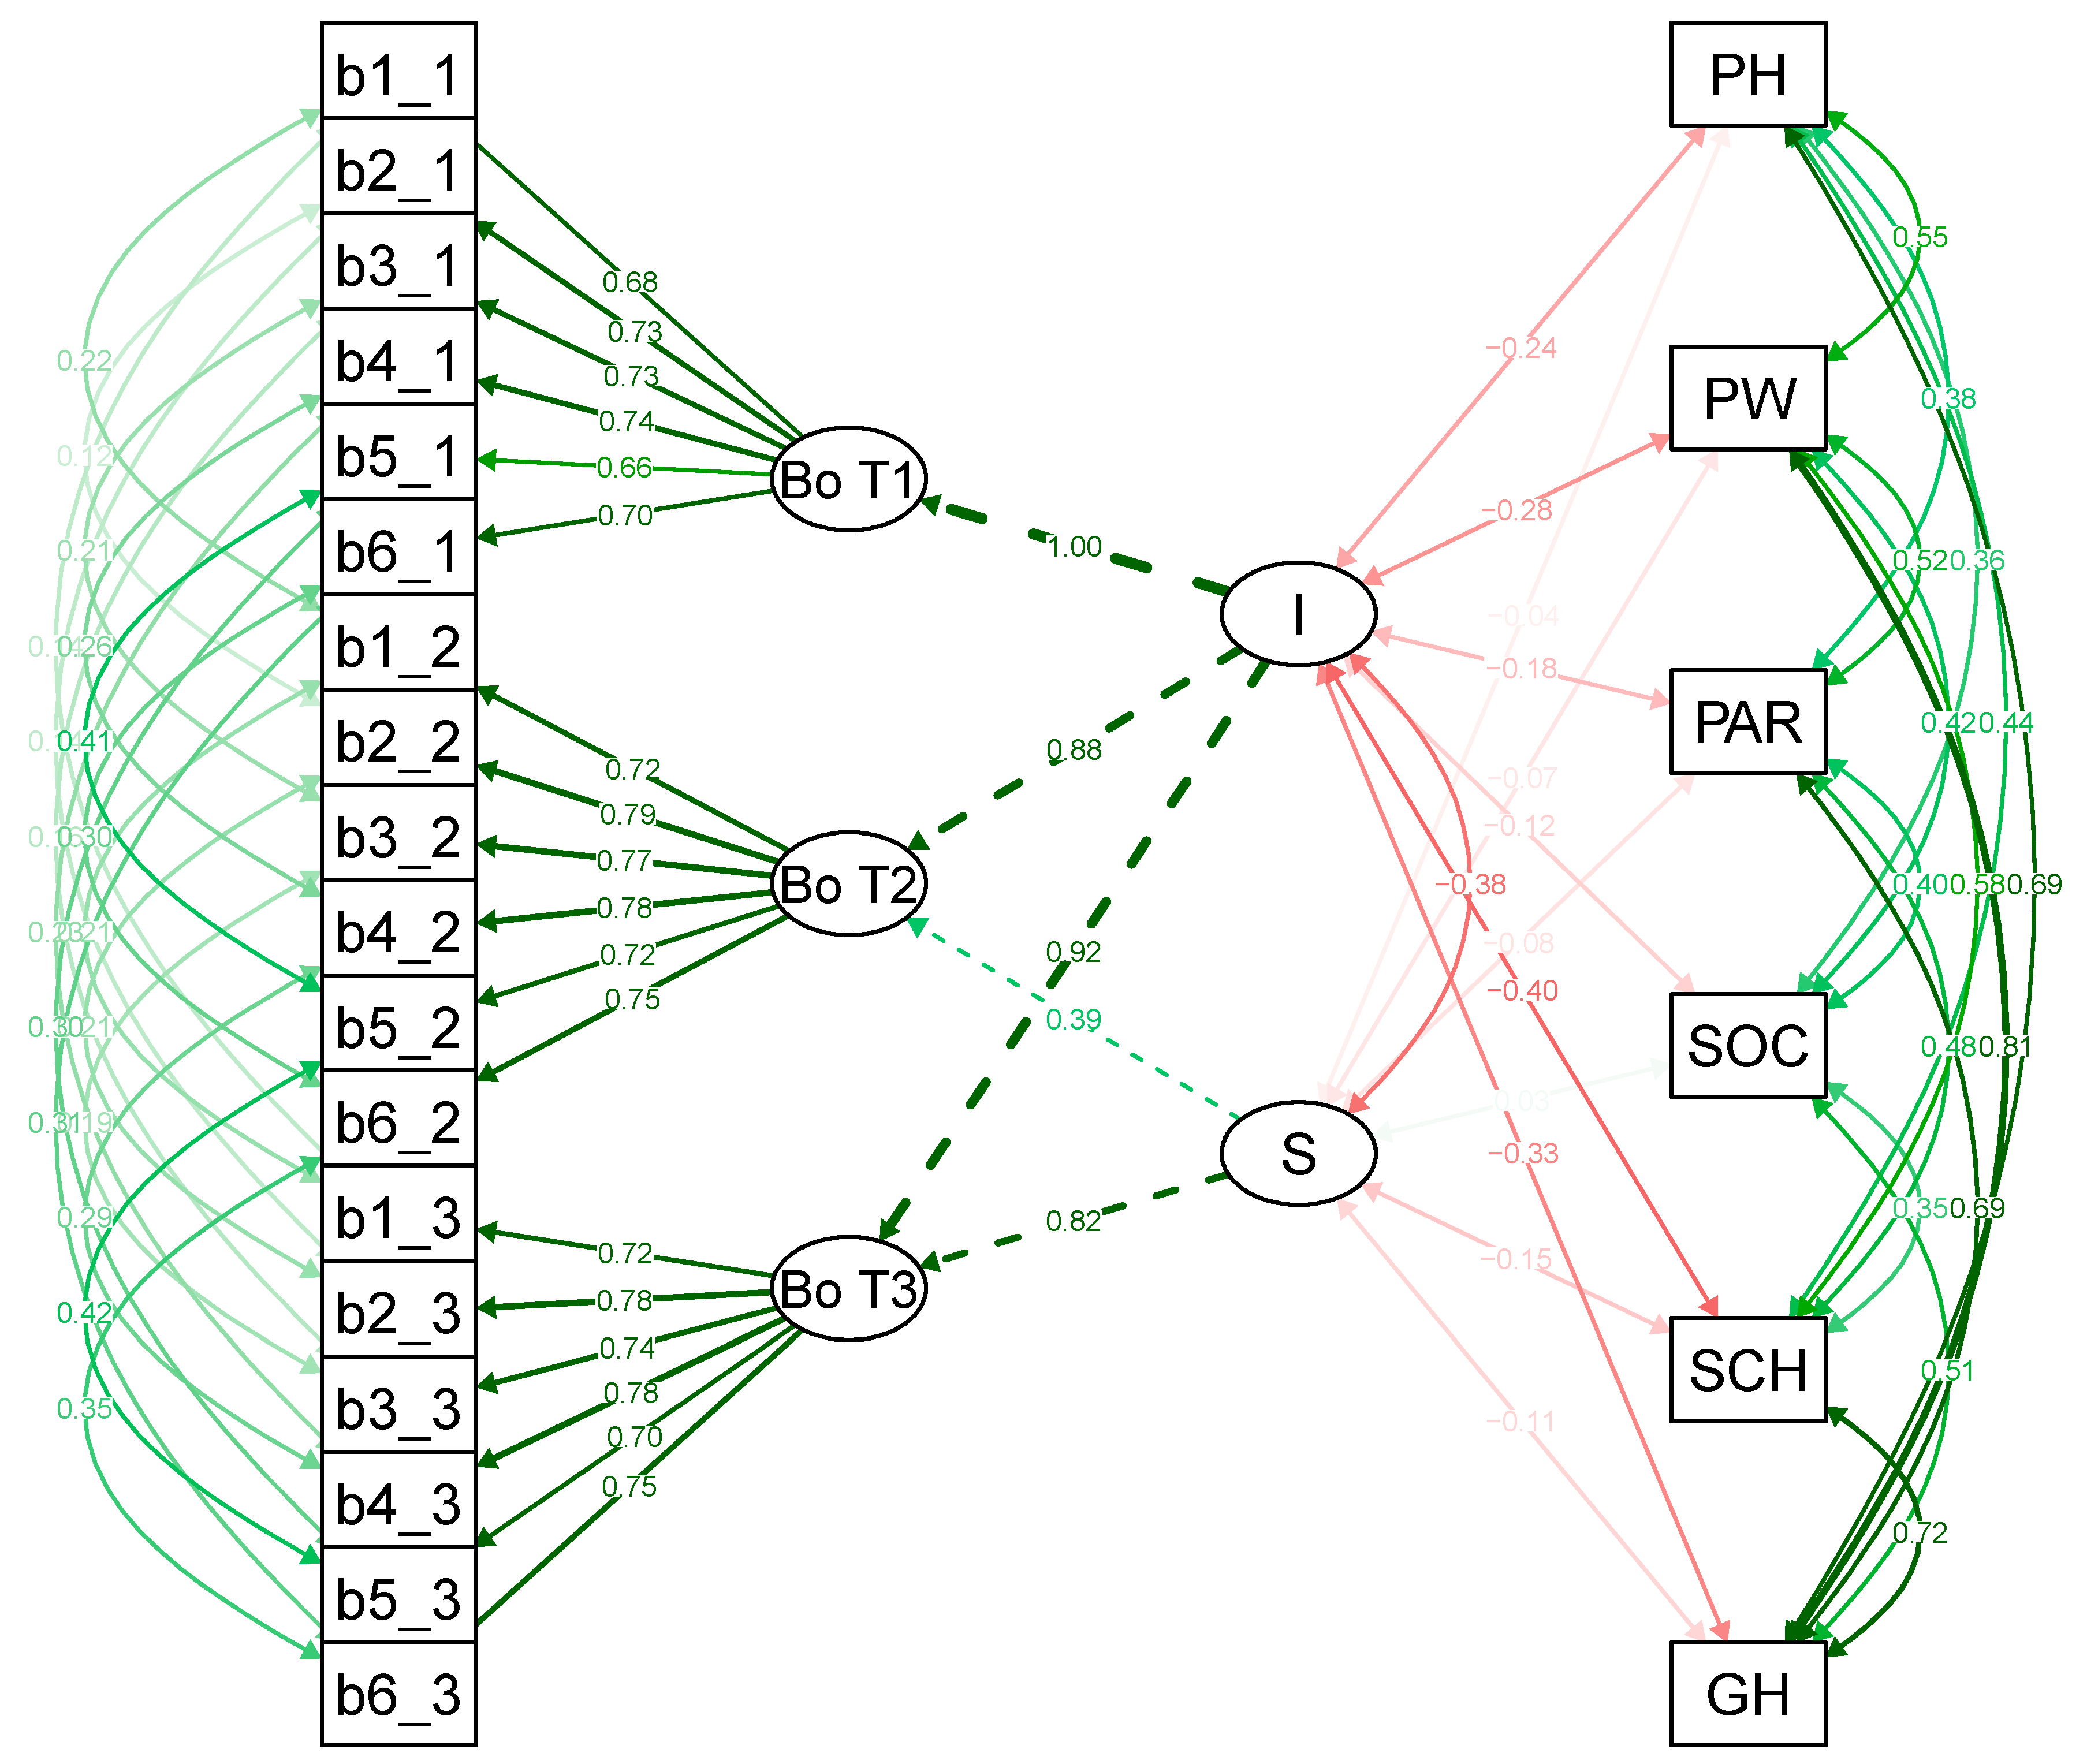
We used R 3.6.1 [57], except for the Rasch scale score and norm-related T-score calculation for the KIDSCREEN dimensions for which we used SPSS 26 [58]. The full R code of our analyses is available in the OSF (see data availability statement). The KIDSCREEN score calculation syntaxes can be obtained from the KIDSCREEN authors [45].
Boredom was modeled as a latent construct using the Lavaan package in R [59]. We applied the full information likelihood method (FIML; [53]) to deal with missing data. The MLR estimator (maximum likelihood estimation with robust (Huber–White) standard errors and a scaled test statistic that is (asymptotically) equal to the Yuan–Bentler test statistic), was used to account for non-normal distributions of the data. As a preliminary analysis step, we tested for measurement invariance using the SemTools R package, to make sure that the latent boredom scores were comparable over time [60]. Since χ2, and correspondingly also delta χ2, are overly sensitive to sample size, we evaluated differences in practical fit indices [61,62,63,64]. We sequentially tested increasingly constrained longitudinal measurement models, namely equivalence of model form (configural), equivalence of factor loadings (metric), and equivalence of item intercepts or thresholds (scalar; [65]). The differences in CFI (−0.002), RMSEA (−0.001), and SRMR (0.001 to 0.004) were clearly below commonly recommended thresholds [66], indicating scalar equivalence. This implies that the latent boredom construct was equally represented by the scale items across the three time points used in the present analyses [67]. In other words, changes in the factor level can be interpreted as reflecting actual differences in the students’ reported experiences of boredom.
To test hypothesis 1, we obtained latent correlations between the boredom scores at T1, T2, and T3 and the HRQoL scores. Concerning hypothesis 2, we applied doubly latent growth curve modeling to estimate boredom trajectories across the semester by using a stepwise confirmatory approach comparing an intercept only (non-growth) with a linear growth model [68]. It is worth noting that our 3-wave-repeated measures design allowed for meaningfully estimating only linear, but not nonlinear (e.g., quadratic) growth [69]. To test hypothesis 3, we determined the relationship between the latent growth parameters of boredom and the HRQoL dimensions, using the growth parameters of boredom (intercept and slope) in bivariate correlation analyses. To account for multiple testing, we adjusted p-values using Holm’s method [70], a procedure that has been shown to be more powerful than the original Bonferroni method [71].
Students who did not participate at T3 (n = 224) and therefore, have no HRQoL data did not differ from the overall sample in terms of gender, t(294.73) = 0.85, pHolm = 1.; age, t(298.84) = −2.68, pHolm = 0.055; school type, t(300.19) = 2.53, pHolm = 0.072; math grade, t(301.08) = −2.05, pHolm = 0.204; country of birth, t(256.78) = −0.07, pHolm = 1.; boredom T1, t(287.49) = −0.72, pHolm = 1.; and boredom T2, t(192.37) = −1.04, pHolm = 1. As such, missingness at T3 was not systematically related with any of those variables.

3. Results

Table 1 shows the bivariate correlations between boredom and the HRQoL dimensions. It is worth noting that the correlations between the boredom scores across time were relatively large (rs > 0.61), indicating that boredom showed considerable stability over time. Furthermore, confirming hypothesis 1, boredom was significantly negatively linked with all HRQoL dimensions, with the strongest correlations observed for school environment and general HRQoL (rs = −0.319 to −0.487). All correlations remained virtually the same when including age and gender as covariates. The correlations imply that boredom was negatively associated with physical well-being (feeling physically exhausted, physically unwell, unfit, having low energy), psychological well-being (having no pleasure in life, feeling depressed, feeling unhappy, having low self-esteem), autonomy and parent relation (feeling restricted, feeling overlooked, not appreciated, feeling finances are restricting life style), social support and peers (feeling excluded, not accepted by peers), school environment (disliking school, negative feelings about school, not doing well at school), and general HRQoL (feeling unhappy, unfit and dissatisfied with regard to family life, peers and school life; [45].
Concerning the growth trajectory of boredom across the semester (hypothesis 2), we used latent growth curve analysis to compare intercept-only (χ2 = 860.39, df = 137, AIC = 64,693, BIC = 64,968, RMSEA = 0.058) and linear growth models (χ2 = 815.53, df = 134, AIC = 64,654, BIC = 64,945, RMSEA = 0.057). We settled for the linear growth model as it showed a significantly better fit to the data (χ2diff = 38.739, dfdiff = 3, p < 0.001). This linear growth model implied that there was a significant, yet small-sized increase in boredom over the three time points (slope = 0.15, 95% CI [0.05, 0.22], SE = 0.04, p = 0.002, see Figure 1). The variance of this slope also proved to be significantly different from zero (τ2 = 0.76, p = 0.049). In fact, while the overall latent slope parameter estimate was small and positive, the individual estimates ranged from −2.17 to 2.71. Slope and intercept were negatively correlated (r = −0.38, p < 0.001).
Having established growth curve parameters of the development of boredom over time, we explored the correlative links between the latent intercept and growth parameters and the HRQoL dimensions next (see Figure A1). In line with the results from the concurrent correlation analyses reported above, the intercept (given our model specification interpretable as students’ levels of boredom at the first measurement T1) was significantly negatively correlated with all HRQoL dimensions, indicating that higher boredom levels were linked with lower values on all HRQoL dimensions. Furthermore, and partially in line with hypothesis 3, the slope was significantly linked with the school environment and general HRQoL scores (rs = −0.15 and −0.11, respectively). By implication, stronger increases in boredom across the semester were associated with more negative feelings about school and lower general HRQoL (see Table 2). In line with previous studies that showed gender universality of achievement emotion-outcome links [72,73], these relationships proved to be equivalent across genders (see Figure S1).

4. Discussion

The present study raised two important questions as to whether levels and change of mathematics boredom across a semester are linked with HRQoL. Confirming our first hypothesis, we provided empirical evidence that high levels of boredom were negatively associated with poorer self-reported physical well-being, psychological well-being, autonomy, parent relations, social support and peer relations, school environment, and general HRQoL, which supports and extends earlier findings on adverse consequences of academic boredom [9,10,11,12,13,15,17,18,19,38,74,75]. Remarkably, context-specifically experienced boredom in mathematics demonstrated substantial negative links with context-transcending health indicators.
Specifically, high boredom in mathematics was substantially associated with lack of pleasure in life, feeling depressed, feeling unhappy, having low self-esteem (PW), disliking school, negative feelings about school, not doing well (SCH), and feeling unhappy, unfit, and generally dissatisfied with regard to family life, peers, and school life (GH). Following Brunswik’s symmetry principles, it is likely that correlations are attenuated if constructs are operationalized at different levels of domain specificity [76]. The pattern of our findings supports the notion of stronger links between contextually closer concepts, as mathematics boredom was most closely linked with the school-related HRQoL dimension (SCH). Furthermore, above and beyond concurrent links, this study also sought to explore the links between trajectories of mathematics boredom and HRQoL. Confirming our second hypothesis and in line with previous research on academic boredom [47,49,50], we observed an increase in boredom during the semester. Boredom intercept and slope proved to be negatively correlated, implying that students who started the schoolyear on higher levels tended to show smaller increases in boredom and vice versa. Confirming hypothesis 3, the dynamics of boredom across the semester were linked with students’ HRQoL. Stronger increases in boredom were linked with more severe health-related problems, specifically with the dimension of school environment (disliking school, negative feelings about school, not doing well), but also with general HRQoL.
Given that our findings are correlational, the mechanisms generating the observed correlations remain open to discussion. On the one hand, boredom and particularly, an increase in boredom across a semester, could be drivers of an adverse health development. It has been shown that boredom during math class occurs when lessons are experienced as either over- or under-challenging and thus, lack meaningful opportunities for engagement [77]. If students repeatedly experience such lessons across the semester and their boredom levels increase over time, they then may withdraw from classes and start to engage in maladaptive escape behaviors. Based on the above-mentioned boredom cascade model, the experience of boredom can then lead to such maladaptive escapes, prompting issues regarding individuals’ mental and physical health [35]. More specifically, repeated and increasingly intense experiences of boredom in mathematics, a subject typically judged as highly important by relevant others (e.g., parents, teachers, society), are likely to increase the use of avoidant and anger-related or acting-out strategies of emotion regulation [50]. Such maladaptive coping and emotion regulation strategies, in turn, are likely to fuel more general psychological and physical health issues, such as vulnerability to infection or cardiovascular disease [78,79].
In contrast to other emotions, where intensity is associated with high value (importance) of the events triggering emotion, boredom is linked to lack of meaning and value—exemplified in the question, “What is it all for?” [6,43,80]. This quest for value expresses an individuals’ lack of purpose or perspective and resembles the core position of meaning in Frankl’s (1959) work on depression and suicide prevention. It is a fundamental human need to want one’s life to be meaningful. Lack of meaning and value, as implied by boredom, thwart this need, thus contributing to health problems [23]. While the emotional experience of boredom has been shown to be psychometrically distinct from depression [23,81,82], the correlative link between boredom and psychological well-being (assessed with items such as “Have you felt sad”) as demonstrated again in our study can be interpreted in that strong experiences of boredom might make students vulnerable to depression.
On the other hand, adverse health conditions could be a driver of boredom experiences in achievement contexts. For example, health conditions such as obesity could lead to a lack of energy, social isolation, and lack of popularity with other students as well as teachers, leading to more boredom in class. Finally, there may also be third variables that can generate both maladaptive levels and trajectories of boredom, and poor health among adolescents, such as extraordinary unfortunate environmental circumstances—the current pandemic-implied school lockdowns being a palpable example, e.g., [83,84].

5. Limitations

The present study used a robust latent growth curve modeling approach and yielded consistent findings that supported our hypotheses. Nevertheless, the study has limitations that should be considered in interpreting the findings and can be used to derive directions for future research. As noted, the analysis was correlational; future research should replicate the current findings using predictive models and longitudinal designs involving repeated measures of both boredom and health indicators to model their co-development over time. Given that our design only involved three measurement points, we could meaningfully estimate only an intercept-only against a linear growth model, while it is conceivable that the boredom trajectory over time also forms nonlinear trends, e.g., initially strong increases followed by a flattening of the curve; such quadratic trends have, for example, been found for adolescents’ interest loss trajectories during adolescence. Future research could explore corresponding nonlinear growth also for boredom, but a larger number of measurement time points (at least four) would be necessary to meaningfully estimate such nonlinear trend models [69]. Self-report was used to assess both boredom and health problems; future studies should complement this approach by using other data sources as well, such as physiological and behavioral data to assess boredom and medical records to assess health problems. Furthermore, this study focused on boredom in the domain of mathematics and it was conducted using a sample of German secondary school students. As such, it remains to be explored if the present findings generalize to other cultural and school contexts. Limited research points to cultural differences in the experience of boredom between Irish and U.S. citizens [85] or European Canadians and Chinese [86]. In exploring whether our findings also extend to younger age groups, the elementary school version of the AEQ [87] could be used. Further, given the outstanding societal role of the domain of mathematics, we focused our study on this subject domain, expecting that boredom in mathematics would demonstrate substantial links with students’ more general HRQoL. However, the degree to which boredom in other subject domains is linked with HRQoL, too, remains to be explored. Just as the question of whether domain plays a moderating role for student boredom–health outcome links seems to be an intriguing avenue for future research. Finally, we did not take teaching method or parental expectations into account. Instructional design is one of the most reported reasons for boredom [88] and parental expectations can be positively linked with student academic performance but also their depression [89]. Future research could address the role of teaching methods and parental expectations for boredom–HRQoL links.

6. Conclusions

In conclusion, the present study provided empirical evidence that boredom is negatively linked with HRQoL and that stronger boredom growth within a semester is linked with lower self-reported health-related quality of life. Teachers, parents, and students should pay attention to boredom as a potential early warning signal for potentially severe, context-specific as well as context-transcending health problems.

Supplementary Materials

The following materials are available online at https://www.mdpi.com/article/10.3390/ijerph18126308/s1, Figure S1: Boredom relationship with HRQoL across genders.

Author Contributions

Conceptualization, M.M.S. and A.C.F.; methodology, M.M.S.; software, M.M.S.; validation, M.M.S.; formal analysis, M.M.S. and D.F.; investigation, M.M.S.; resources, A.C.F., C.R.; data curation, M.M.S.; writing—original draft preparation, M.M.S.; writing—review and editing, M.M.S., A.C.F., T.G., R.P., and A.K.G.M.; visualization, M.M.S.; supervision, A.C.F.; project administration, A.C.F., R.P., and C.R.; funding acquisition, A.C.F., R.P., and C.R. Authorship must be limited to those who have contributed substantially to the work reported. All authors have read and agreed to the published version of the manuscript.

Funding

This research was funded by the German Research Foundation (Deutsche Forschungsgemeinschaft), grant number FR 2642/8-1 and RE 2249/4-1.

Institutional Review Board Statement

The study was conducted according to the guidelines of the Declaration of Helsinki and approved by the Institutional Review Board of Ludwig Maximilian University of Munich (5 February 2018).

Informed Consent Statement

Informed consent was obtained from all subjects, parents, or guardians, respectively, involved in the study and no identifiers that could link individual participants to their results were obtained.

Data Availability Statement

The data presented in this study and the R script for the data analysis are openly available in OSF at https://osf.io/s765q, accessed on 8 June 2021, reference number s765q.

Conflicts of Interest

The authors declare no conflict of interest. The funders had no role in the design of the study; in the collection, analyses, or interpretation of data; in the writing of the manuscript, or in the decision to publish the results.

Appendix A

Table A1. Class-related boredom items of the Achievement Emotions Questionnaire-Mathematics (AEQ-M).
Items GermanItems English
Ich finde den Unterricht langweilig.I think the mathematics class is boring.
Vor Langeweile schalte ich ab.I can’t concentrate because I am so bored.
Vor Langeweile kann ich mich kaum wach halten.I am so bored that I can’t stay awake.
Vor Langeweile gehen mir immer wieder Gedanken durch den Kopf, die mit Mathe nichts zu tun haben.I think about what else I might be doing rather than sitting in this boring class.
Ich schaue ständig auf die Uhr, weil die Zeit nicht vergeht.Because of time drags I frequently look at my watch.
Ich werde unruhig, weil ich nur darauf warte, dass die Mathestunde endlich vorüber ist.I get restless because I can’t wait for the class to end.
Note. Instruction: “Please indicate how you feel, typically, during math class”.
Table A2. Manifest means, their standard deviations and confidence intervals, skewness, kurtosis, and Cronbach’s α coefficients for the study variables.
MSD95% CISkewKurtα
LLUL
Boredom T12.390.952.342.440.51−0.380.86
Boredom T22.461.012.402.510.53−0.490.88
Boredom T32.481.012.422.530.49−0.570.88
Physical well-being48.5011.8647.8449.160.070.060.82
Psychological well-being48.6912.7947.9849.400.110.010.87
Autonomy and parent relation53.6711.3553.0354.300.140.480.80
Social support and peers52.2611.6351.6152.90−0.580.200.83
School environment49.69 10.5849.1050.280.090.470.83
General HRQoL49.5911.1148.9850.210.720.990.81
Note. CI = confidence interval; LL = lower limit; UL = upper limit.
Figure A1. Path diagram of boredom growth parameters and HRQoL dimensions. Note. b1_1 to b6_3 = items indicating boredom (first number indicating scale item index, second number indicating measurement time point), Bo T1/2/3 = boredom as measured at time points 1/2/3 (early/mid/end of semester), I = intercept, S = slope, PH = physical well-being, PW = psychological well-being, PAR = autonomy and parent relation, SOC = social support and peers, SCH = school environment, GH = general HRQoL.
Ijerph 18 06308 g0a1

References

  1. Goetz, T.; Frenzel, A.C.; Hall, N.C.; Nett, U.E.; Pekrun, R.; Lipnevich, A.A. Types of boredom: An experience sampling approach. Motiv. Emot. 2014, 38, 401–419. [Google Scholar] [CrossRef]
  2. Healy, S.D. Boredom, Self, and Culture; Fairleigh Dickinson University Press: Rutherford, NJ, USA, 1984. [Google Scholar]
  3. Pekrun, R.; Linnenbrink-Garcia, L. International Handbook of Emotions in Education; Routledge: New York, NY, USA, 2014; ISBN 978-113-651-2-636. [Google Scholar]
  4. Larson, R.W.; Richards, M.H. Boredom in the middle school years: Blaming schools versus blaming students. Am. J. Educ. 1991, 99, 418–443. [Google Scholar] [CrossRef]
  5. Weybright, E.H.; Schulenberg, J.; Caldwell, L.L. More bored today than yesterday? National trends in adolescent boredom from 2008 to 2017. J. Adolesc. Health 2020, 66, 360–365. [Google Scholar] [CrossRef]
  6. Goetz, T.; Frenzel, A.C.; Pekrun, R. Regulation von Langeweile im Unterricht: Was Schülerinnen und Schüler bei der “Windstille der Seele” (nicht) tun [Regulation of boredom in class. What students (do not) do when experiencing the “windless calm of the soul”]. Unterrichtswissenschaft 2007, 35, 312–333. [Google Scholar]
  7. Vodanovich, S.J. On the possible benefits of boredom: A neglected area in personality research. Psychol. Educ. Interdiscip. J. 2003, 40, 28–33. [Google Scholar]
  8. Bieleke, M.; Wolff, W. It’s not a bug, it’s boredom: Effortful willpower balances exploitation and exploration. Behav. Brain Sci. 2021, 44. [Google Scholar] [CrossRef] [PubMed]
  9. Pekrun, R.; Goetz, T.; Frenzel, A.C.; Barchfeld, P.; Perry, R.P. Measuring emotions in students’ learning and performance: The Achievement Emotions Questionnaire (AEQ). Contemp. Educ. Psychol. 2011, 36, 36–48. [Google Scholar] [CrossRef] [Green Version]
  10. Putwain, D.W.; Becker, S.; Symes, W.; Pekrun, R. Reciprocal relations between students’ academic enjoyment, boredom, and achievement over time. Learn. Instr. 2018, 54, 73–81. [Google Scholar] [CrossRef]
  11. Eren, A.; Coskun, H. Students’ level of boredom, boredom coping strategies, epistemic curiosity, and graded performance. J. Educ. Res. 2016, 109, 574–588. [Google Scholar] [CrossRef]
  12. Pekrun, R.; Goetz, T.; Daniels, L.M.; Stupnisky, R.H.; Perry, R.P. Boredom in achievement settings: Exploring control-value antecedents and performance outcomes of a neglected emotion. J. Educ. Psychol. 2010, 102, 531–549. [Google Scholar] [CrossRef] [Green Version]
  13. Pekrun, R.; Goetz, T.; Titz, W.; Perry, R.P. Academic emotions in students’ self-regulated learning and achievement: A program of qualitative and quantitative research. Educ. Psychol. 2002, 37, 91–105. [Google Scholar] [CrossRef]
  14. Camacho-Morles, J.; Slemp, G.R.; Pekrun, R.; Loderer, K.; Hou, H.; Oades, L.G. Activity achievement emotions and academic performance: A meta-analysis. Educ. Psychol. Rev. 2021. [Google Scholar] [CrossRef]
  15. Kügow, E.C.; Stupnisky, R.H.; Nett, U.; Götz, T. Exploring the causes of boredom at school: Development and validation of the Konstanz antecedents to boredom scales. In Proceedings of the American Educational Research Association (AERA), San Diego, CA, USA, 12–19 April 2009. [Google Scholar]
  16. Pekrun, R.; Lichtenfeld, S.; Marsh, H.W.; Murayama, K.; Goetz, T. Achievement emotions and academic performance: Longitudinal models of reciprocal effects. Child Dev. 2017, 88, 1653–1670. [Google Scholar] [CrossRef]
  17. Tze, V.M.C.; Daniels, L.M.; Klassen, R.M. Evaluating the relationship between boredom and academic outcomes: A meta-analysis. Educ. Psychol. Rev. 2015, 28. [Google Scholar] [CrossRef]
  18. Farrell, E.; Peguero, G.; Lindsey, R.; White, R. Giving voice to high school students: Pressure and boredom, ya know what I’m sayin’? Am. Educ. Res. J. 1988, 25, 489–502. [Google Scholar] [CrossRef]
  19. Robinson, W.P. Boredom at school. Br. J. Educ. Psychol. 1975, 45, 141–152. [Google Scholar] [CrossRef]
  20. Smith, M.J.; Cohen, B.G.; Stammerjohn, L.W., Jr. An investigation of health complaints and job stress in video display operations. Hum. Factors 1981, 23, 387–400. [Google Scholar] [CrossRef] [PubMed]
  21. Ferguson, D. A study of occupational stress and health. Ergonomics 1973, 16, 649–664. [Google Scholar] [CrossRef] [PubMed]
  22. Fisher, C.D. Boredom at work: A neglected concept. Hum. Relat. 1993, 46, 395–417. [Google Scholar] [CrossRef]
  23. Fahlman, S.A.; Mercer, K.B.; Gaskovski, P.; Eastwood, A.E.; Eastwood, J.D. Does a lack of life meaning cause boredom? Results from psychometric, longitudinal, and experimental analyses. J. Soc. Clin. Psychol. 2009, 28, 307–340. [Google Scholar] [CrossRef]
  24. Farmer, R.; Sundberg, N.D. Boredom proneness—The development and correlates of a new scale. J. Pers. Assess. 1986, 50, 4–17. [Google Scholar] [CrossRef] [PubMed]
  25. Mercer-Lynn, K.B.; Hunter, J.A.; Eastwood, J.D. Is trait boredom redundant? J. Soc. Clin. Psychol. 2013, 32, 897–916. [Google Scholar] [CrossRef]
  26. Sommers, J.; Vodanovich, S.J. Boredom proneness: Its relationship to psychological- and physical-health symptoms. J. Clin. Psychol. 2000, 56, 149–155. [Google Scholar] [CrossRef]
  27. Vodanovich, S.J.; Verner, K.M.; Gilbride, T.V. Boredom proneness: Its relationship to positive and negative affect. Psychol. Rep. 1991, 69, 1139–1146. [Google Scholar] [CrossRef] [PubMed]
  28. Iso-Ahola, S.E.; Crowley, E.D. Adolescent substance abuse and leisure boredom. J. Leis. Res. 1991, 23, 260–271. [Google Scholar] [CrossRef]
  29. Orcutt, J.D. Contrasting effects of two kinds of boredom on alcohol use. J. Drug Issues 1984, 14, 161–173. [Google Scholar] [CrossRef]
  30. Samuels, D.J.; Samuels, M. Low self-concept as a cause of drug abuse. J. Drug Educ. 1974, 4, 421–438. [Google Scholar] [CrossRef]
  31. Weybright, E.H.; Caldwell, L.L.; Ram, N.; Smith, E.A.; Wegner, L. Boredom prone or nothing to do? Distinguishing between state and trait leisure boredom and its association with substance use in South African adolescents. Leis. Sci. 2015, 37, 311–331. [Google Scholar] [CrossRef] [Green Version]
  32. Abramson, E.E.; Stinson, S.G. Boredom and eating in obese and non-obese individuals. Addict. Behav. 1977, 2, 181–185. [Google Scholar] [CrossRef]
  33. Ganley, R.M. Emotion and eating in obesity: A review of the literature. Int. J. Eat. Disord. 1989, 8, 343–361. [Google Scholar] [CrossRef]
  34. James, A.; Berelowitz, M.; Vereker, M. Borderline personality disorder: A study in adolescence. Eur. Child Adolesc. Psychiatry 1996, 5, 11–17. [Google Scholar] [CrossRef]
  35. Masland, S.R.; Shah, T.V.; Choi-Kain, L.W. Boredom in borderline personality disorder: A lost criterion reconsidered. Psychopathology 2020, 53, 239–253. [Google Scholar] [CrossRef] [PubMed]
  36. UIS UNESCO Institute for Statistics (UIS). Available online: http://data.uis.unesco.org/ (accessed on 13 January 2021).
  37. Kolbe, L.J. School health as a strategy to improve both public health and education. Annu. Rev. Public Health 2019, 40, 443–463. [Google Scholar] [CrossRef] [PubMed] [Green Version]
  38. Goetz, T.; Frenzel, A.C.; Pekrun, R.; Hall, N.C.; Lüdtke, O. Between- and within-domain relations of students’ academic emotions. J. Educ. Psychol. 2007, 99, 715–733. [Google Scholar] [CrossRef] [Green Version]
  39. Bieg, M.; Goetz, T.; Lipnevich, A.A. What students think they feel differs from what they really feel—Academic self-concept moderates the discrepancy between students’ trait and state emotional self-reports. PLoS ONE 2014, 9, e92563. [Google Scholar] [CrossRef] [PubMed] [Green Version]
  40. Organization for Economic Cooperation and Development. PISA 2012 Results in Focus: What 15-Year-Olds Know and What They Can Do with What They Know; OECD: Paris, France, 2014. [Google Scholar]
  41. Putwain, D.W.; Pekrun, R.; Nicholson, L.J.; Symes, W.; Becker, S.; Marsh, H.W. Control-value appraisals, enjoyment, and boredom in mathematics: A longitudinal latent interaction analysis. Am. Educ. Res. J. 2018, 55, 1339–1368. [Google Scholar] [CrossRef]
  42. Schwartze, M.M.; Frenzel, A.C.; Goetz, T.; Marx, A.K.G.; Reck, C.; Pekrun, R.; Fiedler, D. Excessive boredom among adolescents: A comparison between low and high achievers. PLoS ONE 2020, 15, e0241671. [Google Scholar] [CrossRef]
  43. Pekrun, R. The control-value Theory of achievement emotions: Assumptions, corollaries, and implications for educational research and practice. Educ. Psychol. Rev. 2006, 18, 315–341. [Google Scholar] [CrossRef]
  44. Ravens-Sieberer, U.; Gosch, A.; Rajmil, L.; Erhart, M.; Bruil, J.; Duer, W.; Auquier, P.; Power, M.; Abel, T.; Czemy, L.; et al. KIDSCREEN-52 quality-of-life measure for children and adolescents. Expert Rev. Pharmacoecon. Outcomes Res. 2005, 5, 353–364. [Google Scholar] [CrossRef]
  45. Ravens-Sieberer, U.; The KIDSCREEN Group Europe. The KIDSCREEN Questionnaires. Quality of Life Questionnaires for Children and Adolescents—Handbook; Pabst Science Publishers: Lengerich, Germany, 2006; ISBN 978-389-967-3-340. [Google Scholar]
  46. Ravens-Sieberer, U.; Auquier, P.; Erhart, M.; Gosch, A.; Rajmil, L.; Bruil, J.; Power, M.; Duer, W.; Cloetta, B.; Czemy, L.; et al. The KIDSCREEN-27 quality of life measure for children and adolescents: Psychometric results from a cross-cultural survey in 13 European countries. Qual. Life Res. 2007, 16, 1347–1356. [Google Scholar] [CrossRef]
  47. Barkoukis, V.; Ntoumanis, N.; Thøgersen-Ntoumani, C. Developmental changes in achievement motivation and affect in physical education: Growth trajectories and demographic differences. Psychol. Sport Exerc. 2010, 11, 83–90. [Google Scholar] [CrossRef] [Green Version]
  48. Raccanello, D.; Brondino, M.; Moé, A.; Stupnisky, R.; Lichtenfeld, S. Enjoyment, boredom, anxiety in elementary schools in two domains: Relations with achievement. J. Exp. Educ. 2019, 87, 449–469. [Google Scholar] [CrossRef] [Green Version]
  49. Tze, V.M.C.; Klassen, R.M.; Daniels, L.M. Patterns of boredom and its relationship with perceived autonomy support and engagement. Contemp. Educ. Psychol. 2014, 39, 175–187. [Google Scholar] [CrossRef]
  50. Vierhaus, M.; Lohaus, A.; Wild, E. The development of achievement emotions and coping/emotion regulation from primary to secondary school. Learn. Instr. 2016, 42, 12–21. [Google Scholar] [CrossRef]
  51. Frenzel, A.C.; Goetz, T.; Pekrun, R.; Watt, H.M.G. Development of mathematics interest in adolescence: Influences of gender, family, and school context: Development of mathematics interest in adolescence. J. Res. Adolesc. 2010, 20, 507–537. [Google Scholar] [CrossRef]
  52. Pawlak, M.; Kruk, M.; Zawodniak, J. Investigating individual trajectories in experiencing boredom in the language classroom: The case of 11 Polish students of English. Lang. Teach. Res. 2020, 1362168820914004. [Google Scholar] [CrossRef]
  53. Enders, C.K. Applied Missing Data Analysis, 1st ed.; Guilford: New York, NY, USA, 2010; ISBN 978-160-623-6-390. [Google Scholar]
  54. LfStat. Verteilung der Schüler in der Jahrgangsstufe 8 2018/19 nach Schularten und Regierungsbezirken; Bayerisches Landesamt für Statistik: Munich, Germany, 2018. [Google Scholar]
  55. Frenzel, A.C.; Thrash, T.M.; Pekrun, R.; Goetz, T. Achievement emotions in Germany and China: A cross-cultural validation of the Academic Emotions Questionnaire—Mathematics. J. Cross. Cult. Psychol. 2007, 38, 302–309. [Google Scholar] [CrossRef]
  56. Bond, T.G.; Fox, C.M. Applying the Rasch Model: Fundamental Measurement in the Human Sciences; Erlbaum: Mahwah, NJ, USA, 2001; ISBN 978-036-714-1-417. [Google Scholar]
  57. R Core Team. R: A Language and Environment for Statistical Computing; R Foundation: Vienna, Austria, 2019. [Google Scholar]
  58. IBM Corporation. IBM SPSS Statistics for Macintosh; IBM Corporation: Endicott, NY, USA, 2019. [Google Scholar]
  59. Rosseel, Y.; Jorgensen, T.D. Lavaan: Latent Variable Analysis; 2019. R package version 0.6-5. Available online: https://CRAN.R-project.org/package=lavaan (accessed on 8 June 2021).
  60. Jorgensen, T.D.; Pornprasertmanit, S.; Schoemann, A.M.; Rosseel, Y. semTools: Useful Tools for Structural Equation Modeling, 2021. R package version 0.5-4; Available online: https://CRAN.R-project.org/package=semTools (accessed on 9 June 2021).
  61. Putnick, D.L.; Bornstein, M.H. Measurement invariance conventions and reporting: The state of the art and future directions for psychological research. Dev. Rev. 2016, 41, 71–90. [Google Scholar] [CrossRef] [Green Version]
  62. Rutkowski, L.; Svetina, D. Assessing the hypothesis of measurement invariance in the context of large-scale international surveys. Educ. Psychol. Meas. 2014, 74, 31–57. [Google Scholar] [CrossRef]
  63. Van De Schoot, R.; Lugtig, P.; Hox, J. Developmetrics: A checklist for testing measurement invariance. Eur. J. Dev. Psychol. 2012, 9, 486–492. [Google Scholar] [CrossRef]
  64. Widaman, K.F.; Ferrer, E.; Conger, R.D. Factorial invariance within longitudinal structural equation models: Measuring the same construct across time. Child Dev. Perspect. 2010, 4, 10–18. [Google Scholar] [CrossRef]
  65. Meredith, W. Measurement invariance, factor analysis and factorial invariance. Psychometrika 1993, 58, 525–543. [Google Scholar] [CrossRef]
  66. Chen, F.F. Sensitivity of goodness of fit indexes to lack of measurement invariance. Struct. Equ. Model. 2007, 14, 464–504. [Google Scholar] [CrossRef]
  67. Isiordia, M.; Ferrer, E. Curve of factors model: A latent growth modeling approach for educational research. Educ. Psychol. Meas. 2018, 78, 203–231. [Google Scholar] [CrossRef] [PubMed] [Green Version]
  68. Bollen, K.A.; Curran, P.J. Latent Curve Models: A Structural Equation Perspective; Wiley: Hoboken, NJ, USA, 2016; ISBN 978-047-145-5-929. [Google Scholar]
  69. Whittaker, T.A.; Khojasteh, J. Detecting appropriate trajectories of growth in latent growth models: The performance of information-based criteria. J. Exp. Educ. 2017, 85, 215–230. [Google Scholar] [CrossRef]
  70. Holm, S. A simple sequentially rejective multiple test procedure. Scand. Stat. Theory Appl. 1979, 6, 65–70. [Google Scholar]
  71. Wright, S.P. Adjusted p-values for simultaneous inference. Biometrics 1992, 48, 1005–1013. [Google Scholar] [CrossRef]
  72. Pekrun, R.; Stephens, E.J. Achievement emotions: A control-value approach. Soc. Personal. Psychol. Compass 2010, 4, 238–255. [Google Scholar] [CrossRef]
  73. Pekrun, R. Control-Value theory: A social-cognitive approach to achievement emotions. In Big Theories Revisited 2; Liem, G.A.D., McInerney, D.M., Eds.; Information Age Publishing: Charlotte, NC, USA, 2018; pp. 165–190. ISBN 978-164-113-2-701. [Google Scholar]
  74. Niculescu, A.C.; Tempelaar, D.T.; Dailey-Hebert, A.; Segers, M.; Gijselaers, W. Exploring the antecedents of learning-related emotions and their relations with achievement outcomes. Frontline Learn. Res. 2015, 3. [Google Scholar] [CrossRef]
  75. Pekrun, R.; Hall, N.C.; Perry, R.P.; Goetz, T. Boredom and academic achievement: Testing a model of reciprocal causation. J. Educ. Psychol. 2014. [Google Scholar] [CrossRef]
  76. Wittmann, W.W. Multivariate reliability theory. In Handbook of Multivariate Experimental Psychology; Nesselroade, J.R., Cattell, R.B., Eds.; Springer: Boston, MA, USA, 1988; pp. 505–560. ISBN 978-146-130-8-935. [Google Scholar]
  77. Csikszentmihalyi, M. Beyond Boredom and Anxiety; Jossey-Bass Publishers: San Francisco, CA, USA, 1975; ISBN 978-087-589-2-610. [Google Scholar]
  78. Carver, C.S.; Vargas, S. Stress, coping, and health. In The Oxford Handbook of Health Psychology; Friedman, H.S., Ed.; Oxford University Press: Oxford, UK, 2011; ISBN 978-019-534-2-819. [Google Scholar]
  79. DeSteno, D.; Gross, J.J.; Kubzansky, L. Affective science and health: The importance of emotion and emotion regulation. Health Psychol. 2013, 32, 474–486. [Google Scholar] [CrossRef] [PubMed]
  80. Pekrun, R.; Frenzel, A.C.; Goetz, T.; Perry, R.P. The control-value theory of achievement emotions: An integrative approach to emotions in education. In Emotion in Education; Schutz, P.A., Pekrun, R., Eds.; Academic Press: Amsterdam, The Netherlands, 2007; pp. 13–36. ISBN 978-012-372-5-455. [Google Scholar]
  81. Goldberg, Y.K.; Eastwood, J.D.; LaGuardia, J.; Danckert, J. Boredom: An emotional experience distinct from apathy, anhedonia, or depression. J. Soc. Clin. Psychol. 2011, 30, 647–666. [Google Scholar] [CrossRef]
  82. Van Tilburg, W.A.P.; Igou, E.R. Boredom begs to differ: Differentiation from other negative emotions. Emotion 2017, 17, 309–322. [Google Scholar] [CrossRef] [Green Version]
  83. Martarelli, C.S.; Pacozzi, S.G.; Bieleke, M.; Wolff, W. High trait self-control and low boredom proneness help COVID-19 homeschoolers. Front. Psychol. 2021, 12, 594256. [Google Scholar] [CrossRef]
  84. Ravens-Sieberer, U.; Kaman, A.; Erhart, M.; Devine, J.; Schlack, R.; Otto, C. Impact of the COVID-19 pandemic on quality of life and mental health in children and adolescents in Germany. Eur. Child Adolesc. Psychiatry 2021. [Google Scholar] [CrossRef]
  85. Vodanovich, S.J.; Watt, J.D. The relationship between time structure and boredom proneness: An investigation within two cultures. J. Soc. Psychol. 1999, 139, 143–152. [Google Scholar] [CrossRef]
  86. Ng, A.H.; Liu, Y.; Chen, J.-Z.; Eastwood, J.D. Culture and state boredom: A comparison between European Canadians and Chinese. Pers. Individ. Dif. 2015, 75, 13–18. [Google Scholar] [CrossRef]
  87. Lichtenfeld, S.; Pekrun, R.; Stupnisky, R.H.; Reiss, K.; Murayama, K. Measuring students’ emotions in the early years: The Achievement Emotions Questionnaire-Elementary School (AEQ-ES). Learn. Individ. Differ. 2012, 22, 190–201. [Google Scholar] [CrossRef] [Green Version]
  88. Goetz, T.; Pekrun, R.; Hall, N.; Haag, L. Academic emotions from a social-cognitive perspective: Antecedents and domain specificity of students’ affect in the context of Latin instruction. Br. J. Educ. Psychol. 2006, 76, 289–308. [Google Scholar] [CrossRef]
  89. Ma, Y.; Siu, A.; Tse, W.S. The role of high parental expectations in adolescents’ academic performance and depression in Hong Kong. J. Fam. Issues 2018, 39, 2505–2522. [Google Scholar] [CrossRef]
Figure 1. Latent growth trajectory of boredom across the semester. Y-axis truncated for an optimal graphical representation of the overall growth trajectory, depicted boredom values extrapolated beyond the observed time points.
Ijerph 18 06308 g001
Table 1. Latent bivariate correlation coefficients (r) between boredom and HRQoL dimensions.
Bo T1Bo T2Bo T3PHPWPARSOCSCHGH
Boredom T1 (Bo T1)-
Boredom T2 (Bo T2)0.69-
Boredom T3 (Bo T3)0.620.72-
Physical well-being (PH)−0.24−0.18−0.26-
Psychological well-being (PW)−0.28−0.28−0.320.55-
Autonomy and parent relation (PAR)−0.18−0.20−0.230.380.52-
Social support and peers (SOC)−0.13−0.09−0.100.360.420.40-
School environment (SCH)−0.40−0.42−0.490.440.580.480.35-
General HRQoL (GH)−0.33−0.33−0.390.690.810.690.510.72-
p < 0.001 for all coefficients with the exceptions of r(Bo T1/SOC): p = 0.002; r(Bo T2/SOC) and r(Bo T3/SOC): p = 0.013.
Table 2. Latent bivariate correlations between boredom growth parameters and HRQoL dimensions.
Growth Parameter
InterceptSlope
rprp
Physical well-being−0.24<0.001−0.040.771
Psychological well-being−0.28<0.001−0.070.251
Autonomy and parent relation−0.18<0.001−0.080.156
Social support and peers−0.120.0050.030.771
School environment−0.40<0.001−0.15<0.001
General HRQoL−0.33<0.001−0.110.008
Publisher’s Note: MDPI stays neutral with regard to jurisdictional claims in published maps and institutional affiliations.

