
Space–Time Clustering Characteristics of Malaria in Bhutan at the End Stages of Elimination

 ,
,  ,
,  , ,
, ,  and
and 
Abstract
1. Introduction
2. Methods
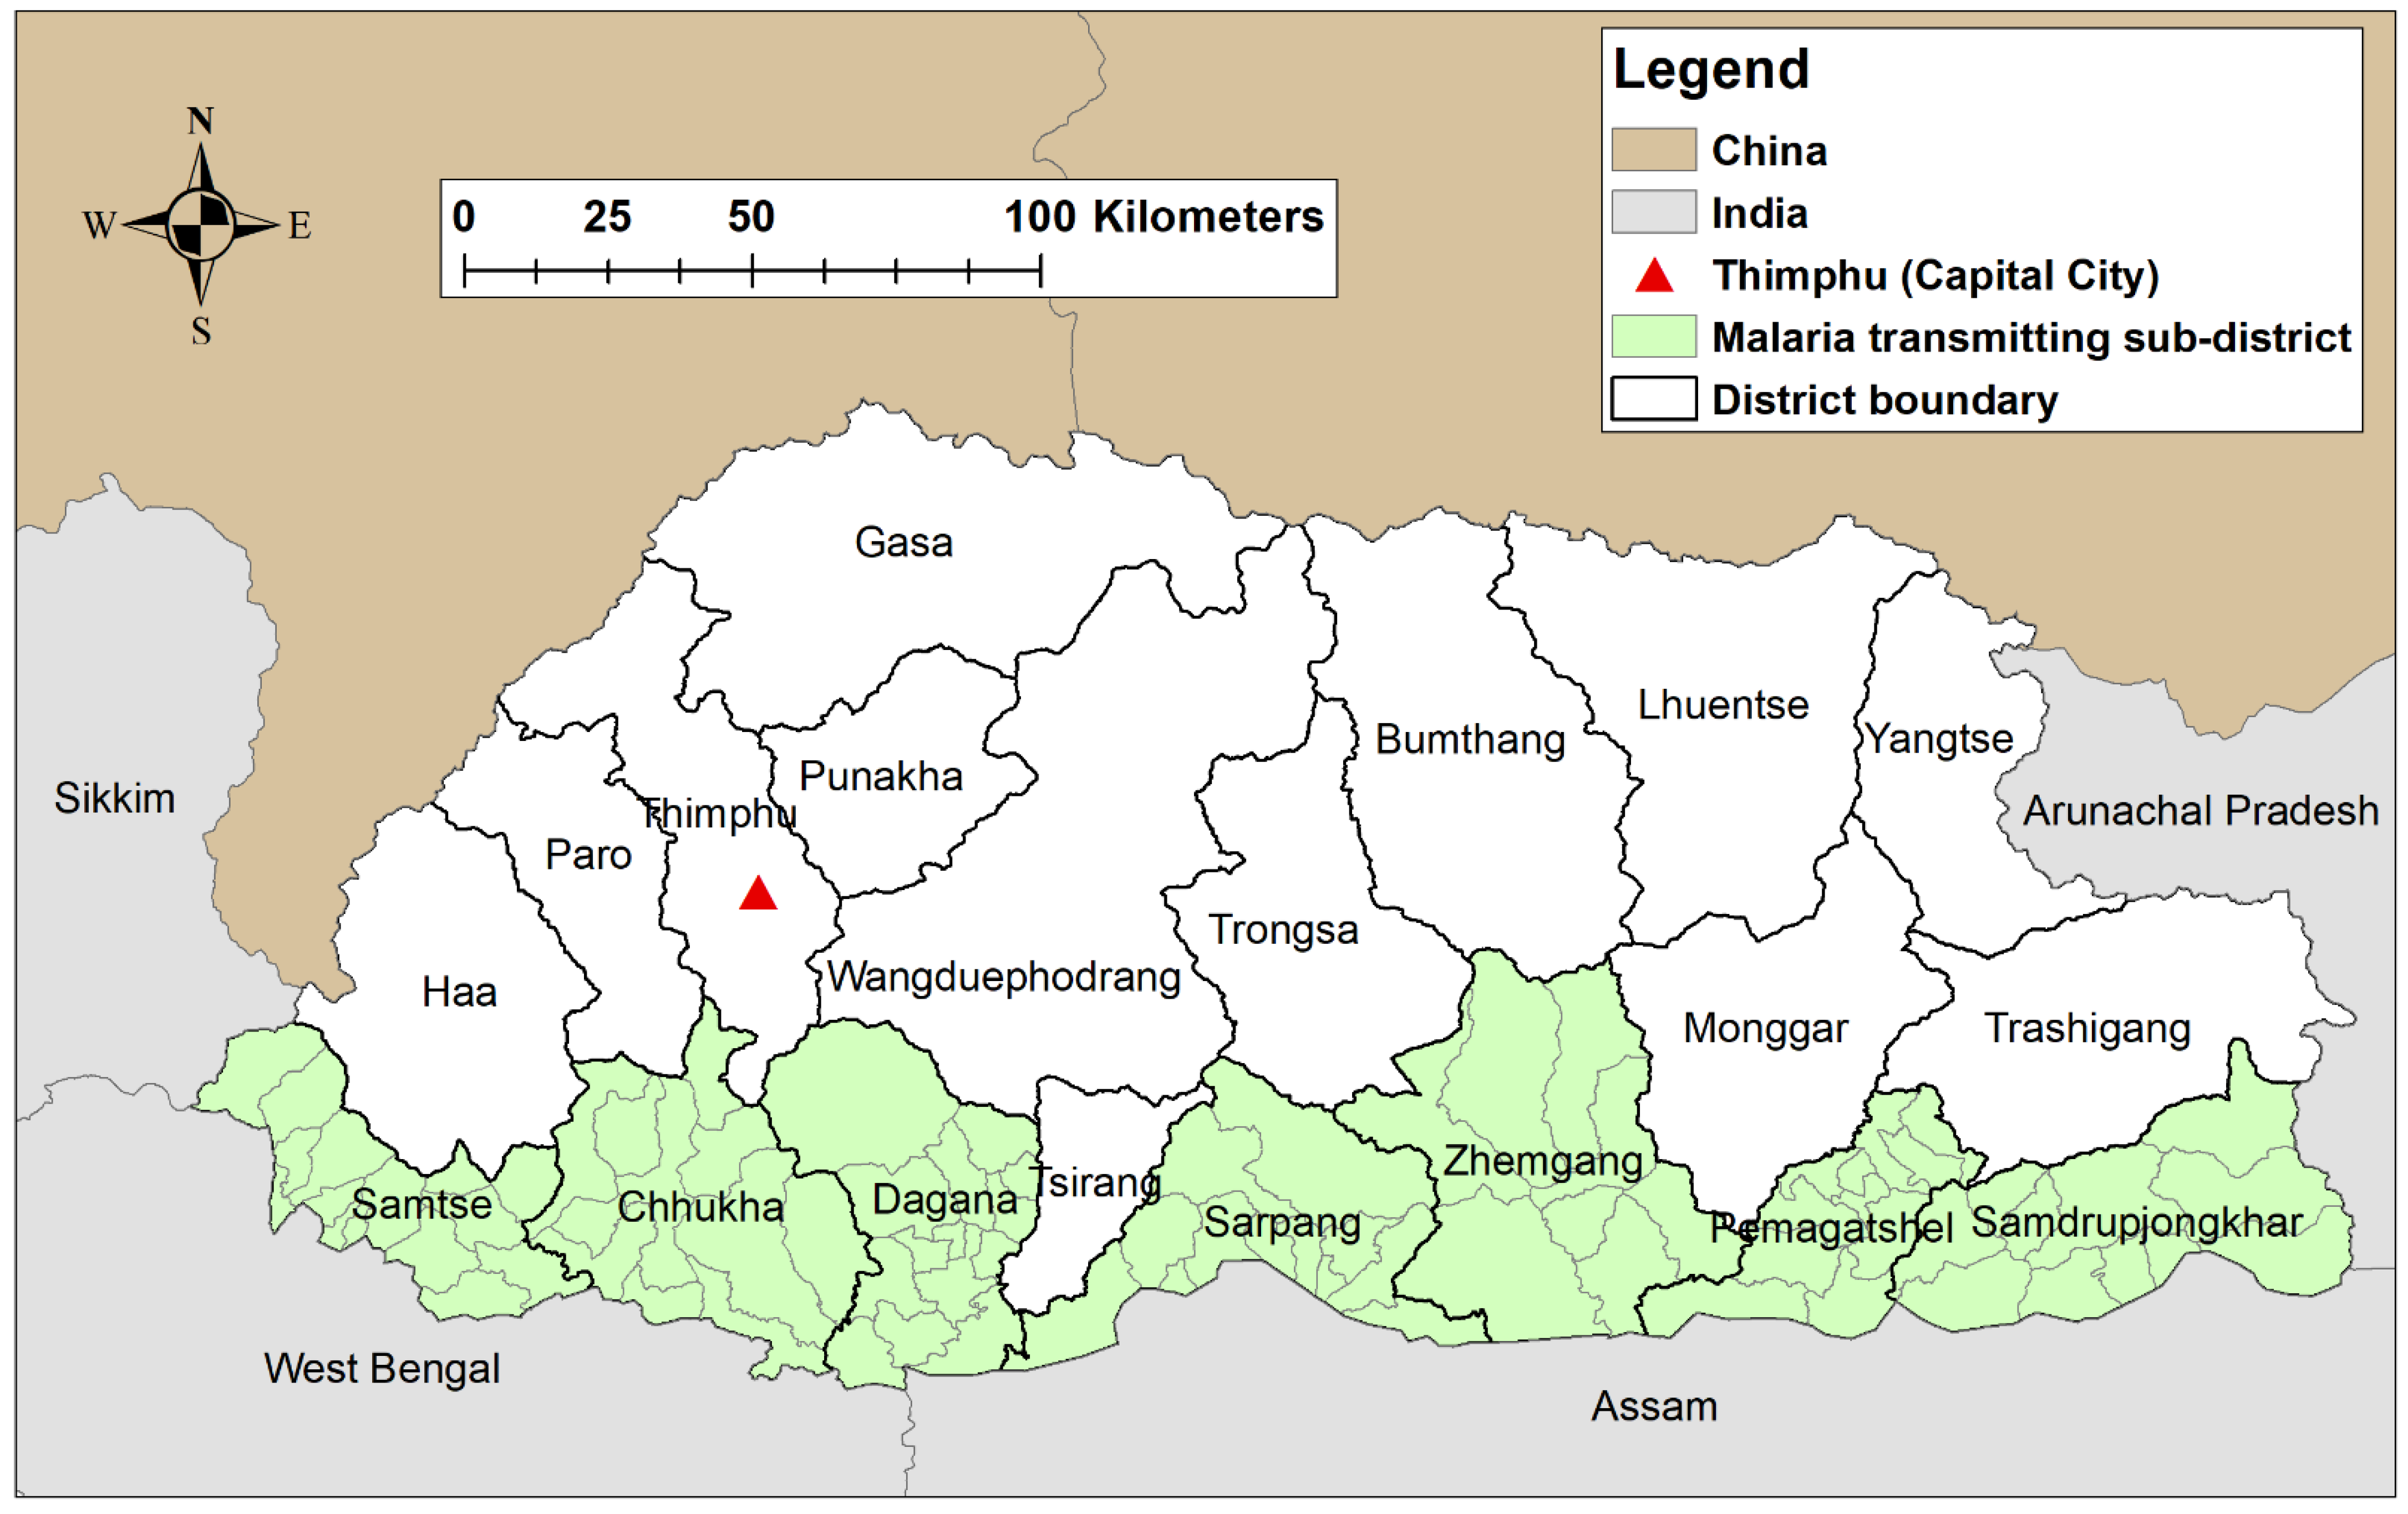
2.1. Study Site
2.2. Data Source
2.3. Exploration of Seasonal Patterns and Inter-Annual Patterns
2.4. Spatial and Spatiotemporal Cluster Analysis
3. Results
3.1. Characteristics of the Study Population
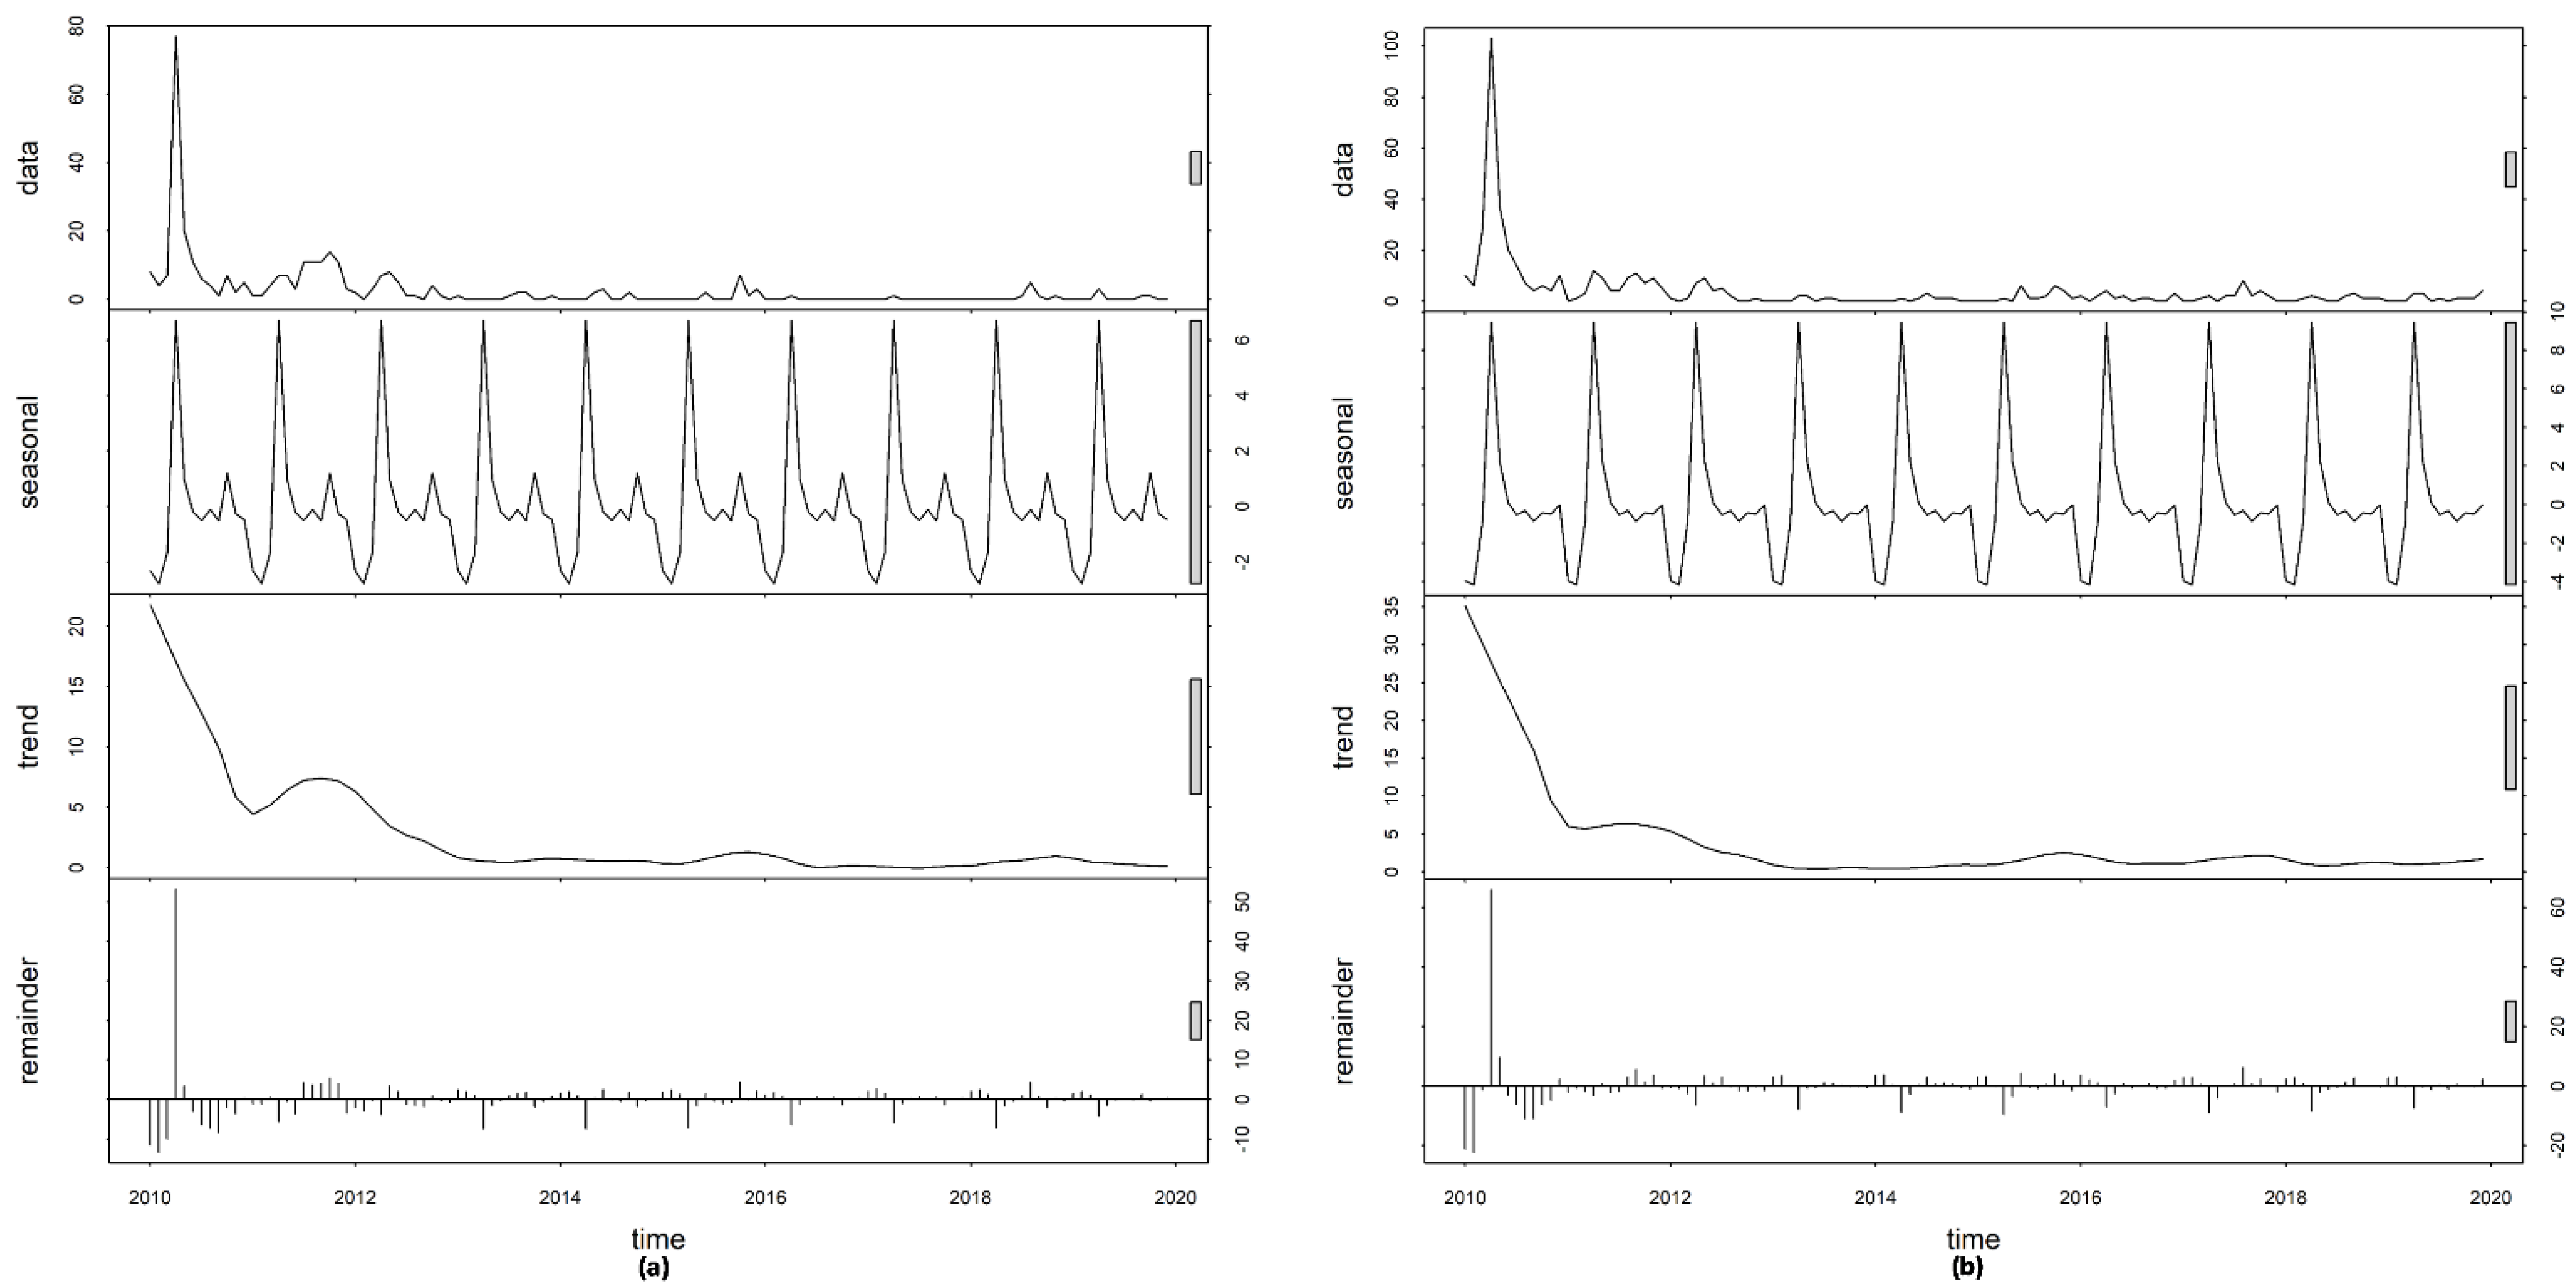
3.2. Time-Series Decompositions
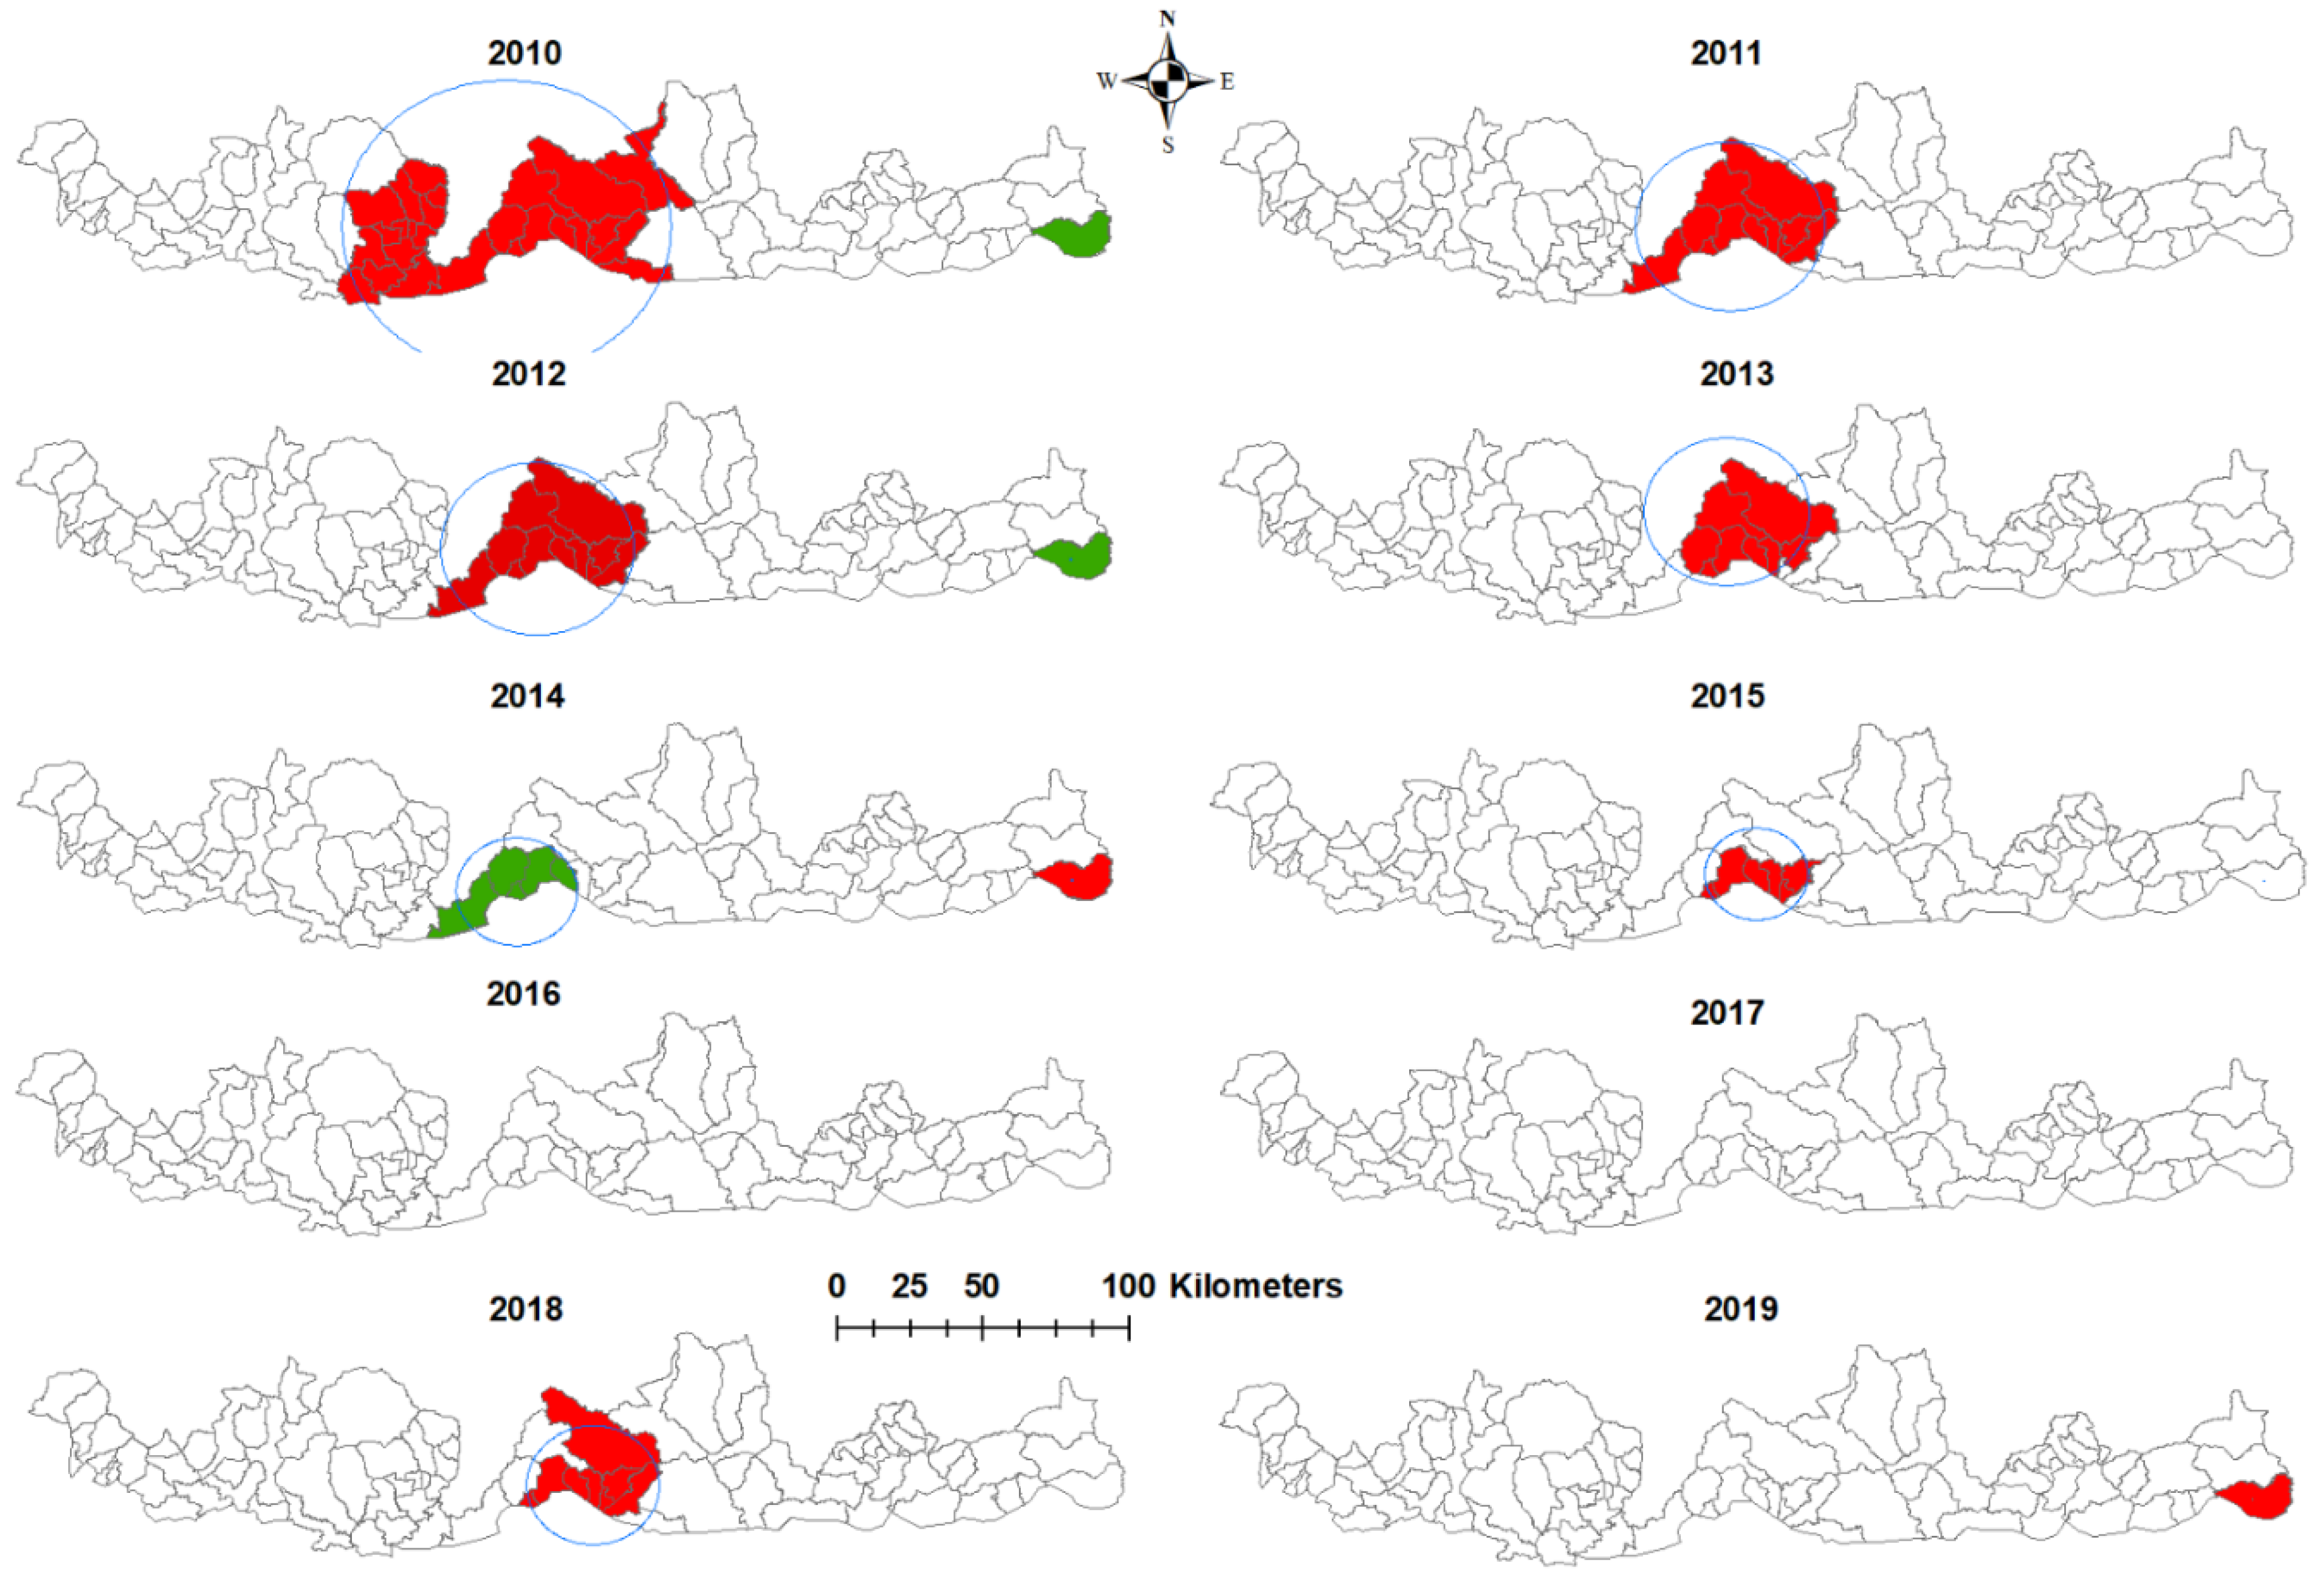
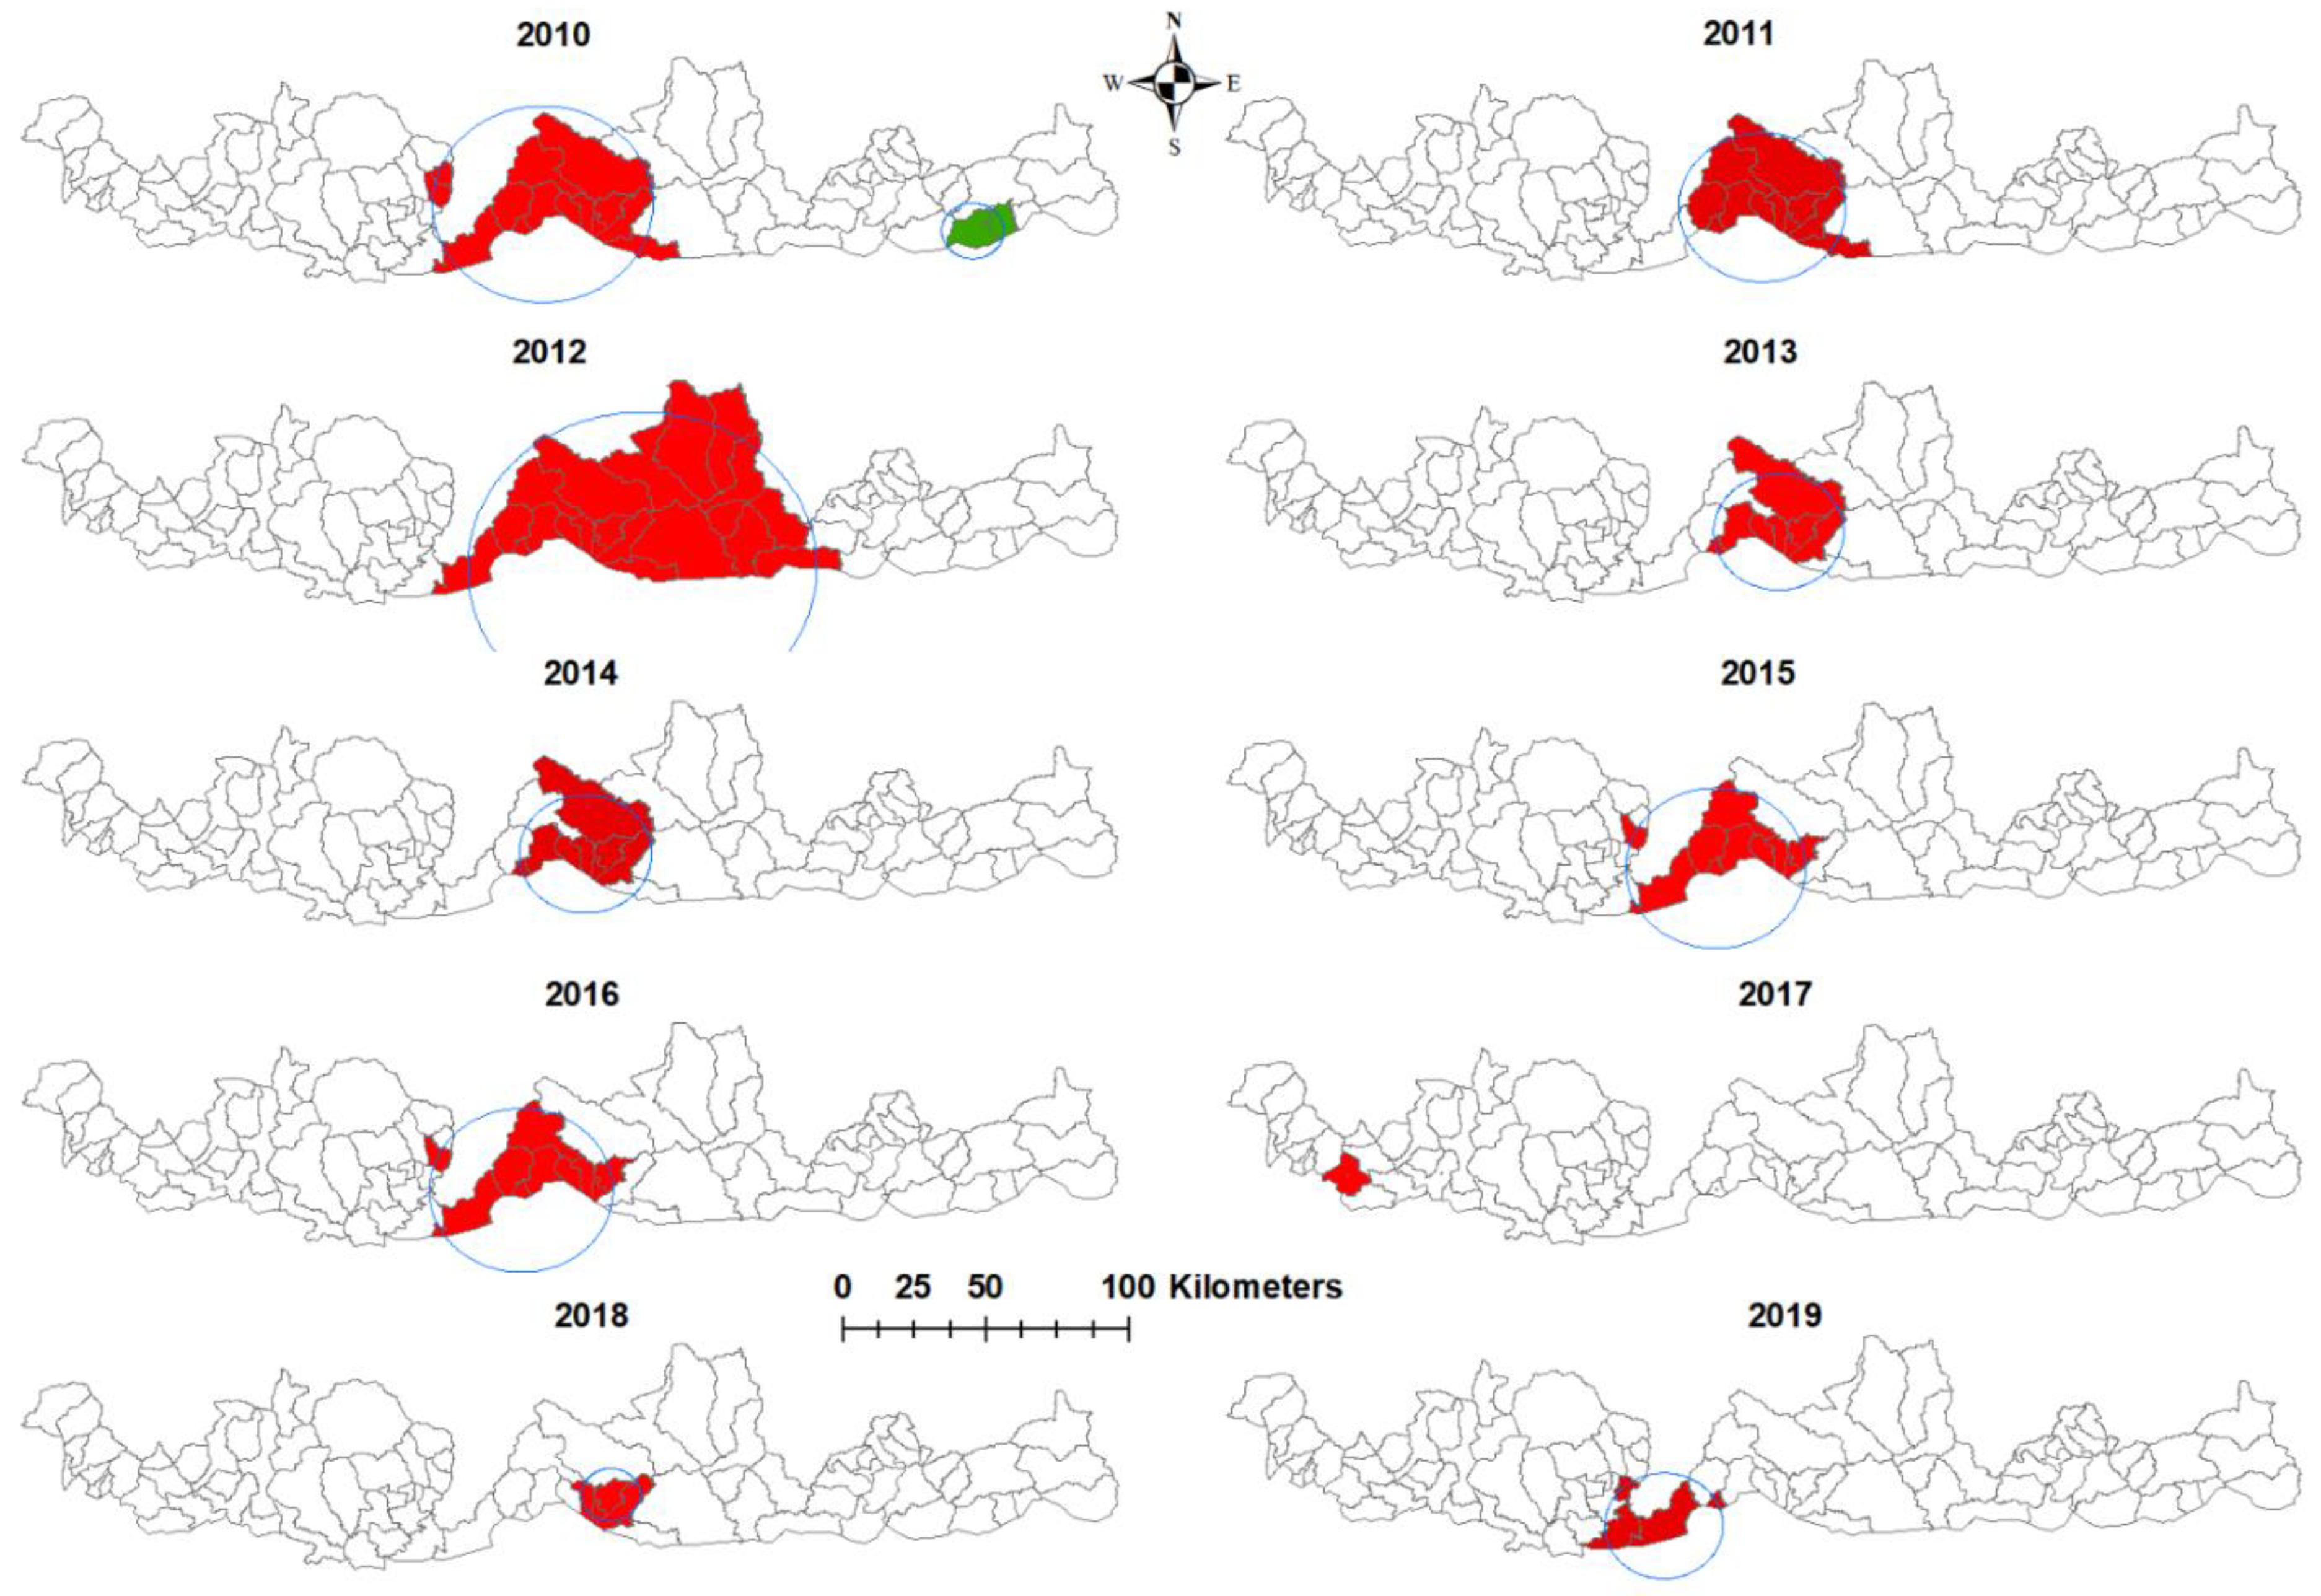
3.3. Purely Spatial Analysis
3.4. Spatiotemporal Analysis
4. Discussion
Supplementary Materials
Author Contributions
Funding
Institutional Review Board Statement
Informed Consent Statement
Data Availability Statement
Acknowledgments
Conflicts of Interest
References
- Wangdi, K.; Kaewkungwal, J.; Singhasivanon, P.; Silawan, T.; Lawpoolsri, S.; White, N.J. Spatio-temporal patterns of malaria infection in Bhutan: A country embarking on malaria elimination. Malar. J. 2011, 10, 89. [Google Scholar] [CrossRef]
- Wangdi, K.; Banwell, C.; Gatton, M.L.; Kelly, G.C.; Namgay, R.; Clements, A.C. Malaria burden and costs of intensified control in Bhutan, 2006–2014: An observational study and situation analysis. Lancet Glob. Health 2016, 4, e336–e343. [Google Scholar] [CrossRef]
- Asia Pacific Malaria Elimination Networks. Bhutan. Available online: https://apmen.org/country/Bhutan/ (accessed on 20 May 2021).
- Vector-Borne Disease Program. Strategic Plan for Elimination of Malaria and Prevention of Re-Introcution in Bhutan 2020–2025; Vector-borne Disease Program, Department of Public Health, Ministry of Health, Royal Government of Bhutan: Gelephu, Bhutan, 2020.
- Wangdi, K.; Gatton, M.L.; Kelly, G.C.; Clements, A.C. Cross-border malaria: A major obstacle for malaria elimination. Adv. Parasitol. 2015, 89, 79–107. [Google Scholar] [PubMed]
- Wangdi, K.; Clements, A.C.A. Ending Malaria Transmission in the Asia Pacific Malaria Elimination Network (APMEN) Countries: Challenges and the Way Forward. In Towards Malaria Elimination: A Leap Forward; IntechOpen: London, UK, 2018. [Google Scholar]
- Bi, Y.; Hu, W.; Yang, H.; Zhou, X.N.; Yu, W.; Guo, Y.; Tong, S. Spatial patterns of malaria reported deaths in Yunnan Province, China. Am. J. Trop. Med. Hyg. 2013, 88, 526–535. [Google Scholar] [CrossRef]
- Soto-Calle, V.; Rosas-Aguirre, A.; Llanos-Cuentas, A.; Abatih, E.; DeDeken, R.; Rodriguez, H.; Rosanas-Urgell, A.; Gamboa, D.; D’Alessandro, U.; Erhart, A.; et al. Spatio-temporal analysis of malaria incidence in the Peruvian Amazon Region between 2002 and 2013. Sci. Rep. 2017, 7, 40350. [Google Scholar] [CrossRef] [PubMed]
- Coleman, M.; Coleman, M.; Mabuza, A.M.; Kok, G.; Coetzee, M.; Durrheim, D.N. Using the SaTScan method to detect local malaria clusters for guiding malaria control programmes. Malar. J. 2009, 8, 68. [Google Scholar] [CrossRef] [PubMed]
- Coulibaly, D.; Rebaudet, S.; Travassos, M.; Tolo, Y.; Laurens, M.; Kone, A.K.; Traore, K.; Guindo, A.; Diarra, I.; Niangaly, A.; et al. Spatio-temporal analysis of malaria within a transmission season in Bandiagara, Mali. Malar. J. 2013, 12, 82. [Google Scholar] [CrossRef]
- Sweeney, A.W. The Application of GIS in Malaria Control Programs. In Proceedings of the 10th Colloquium of the Spatial Information Research Centre, University of Otago, Dunedin, New Zealand, 16–19 November 1998. [Google Scholar]
- Clements, A.C.A.; Reid, H.L.; Kelly, G.C.; Hay, S.I. Further shrinking the malaria map: How can geospatial science help to achieve malaria elimination? Lancet Infect. Dis. 2013, 13, 709–718. [Google Scholar] [CrossRef]
- Wangdi, K.; Pasaribu, A.P.; Clements, A.C.A. Addressing hard-to-reach populations for achieving malaria elimination in the Asia Pacific Malaria Elimination Network countries. Asia Pac. Policy Stud. 2021, 1–13. [Google Scholar] [CrossRef]
- Stuckey, E.M.; Smith, T.; Chitnis, N. Seasonally dependent relationships between indicators of malaria transmission and disease provided by mathematical model simulations. PLoS Comput. Biol. 2014, 10, e1003812. [Google Scholar] [CrossRef]
- Nguyen, M.; Howes, R.E.; Lucas, T.C.D.; Battle, K.E.; Cameron, E.; Gibson, H.S.; Rozier, J.; Keddie, S.; Collins, E.; Arambepola, R.; et al. Mapping malaria seasonality in Madagascar using health facility data. BMC Med. 2020, 18, 26. [Google Scholar] [CrossRef] [PubMed]
- National Statistical Bureau. 2017 Population and Housing Census of Bhutan. In National Stastical Bureau RGoB; Royal Government of Bhutan: Thimphu, Bhutan, 2017. [Google Scholar]
- National Statistics Bureau. Dzongkhag Population Projection 2006–2015; National Statistics Bureau, Royal Government of Bhutan: Thimphu, Bhutan, 2008.
- Office of the Census Commissioner. Results of Population & Housing, Census of Bhutan 2005; Royal Government of Bhutan: Thimphu, Bhutan, 2006.
- Cleveland, R.B. STL: A Seasonal-Trend decomposition Prodecures Based on Loess. J. Off. Stat. 1990, 6, 3–73. [Google Scholar]
- Sang, S.; Gu, S.; Bi, P.; Yang, W.; Yang, Z.; Xu, L.; Yang, J.; Liu, X.; Jiang, T.; Wu, H.; et al. Predicting unprecedented dengue outbreak using imported cases and climatic factors in Guangzhou, 2014. PLoS Negl. Trop. Dis. 2015, 9, e0003808. [Google Scholar] [CrossRef] [PubMed]
- Wangdi, K.; Clements, A.C.A.; Du, T.; Nery, S.V. Spatial and temporal patterns of dengue infections in Timor-Leste, 2005–2013. Parasites Vectors 2018, 11, 9. [Google Scholar] [CrossRef] [PubMed]
- Kulldorff, M. A spatial scan statistic. Commun. Stat. Theory Methods 1997, 26, 1481–1496. [Google Scholar] [CrossRef]
- Ozdenerol, E.; Williams, B.L.; Kang, S.Y.; Magsumbol, M.S. Comparison of spatial scan statistic and spatial filtering in estimating low birth weight clusters. Int. J. Health Geogr. 2005, 4, 19. [Google Scholar] [CrossRef]
- Kim, S.; Jung, I. Optimizing the maximum reported cluster size in the spatial scan statistic for ordinal data. PLoS ONE 2017, 12, e0182234. [Google Scholar] [CrossRef] [PubMed]
- Wangdi, K.; Xu, Z.; Suwannatrai, A.T.; Kurscheid, J.; Lal, L.; Namgay, R.; Glass, K.; Gray, D.J.; Archie, C.A. Clements A spatio-temporal analysis to identify the drivers of malaria transmission in Bhutan. Sci. Rep. 2020, 10, 7060. [Google Scholar] [CrossRef]
- Wangdi, K.; Singhasivanon, P.; Silawan, T.; Lawpoolsri, S.; White, N.J.; Kaewkungwal, J. Development of temporal modelling for forecasting and prediction of malaria infections using time-series and ARIMAX analyses: A case study in endemic districts of Bhutan. Malar. J. 2010, 9, 251. [Google Scholar] [CrossRef]
- Wangdi, K.; Gatton, M.; Kelly, G.; Clements, A. Prevalence of asymptomatic malaria and bed net ownership and use in Bhutan, 2013: A country earmarked for malaria elimination. Malar. J. 2014, 13, 352. [Google Scholar] [CrossRef][Green Version]
- Wangdi, K.; Gatton, M.L.; Kelly, G.C.; Banwell, C.; Dev, V.; Clements, A.C. Malaria elimination in India and regional implications. Lancet Infect. Dis. 2016, 16, e214–e224. [Google Scholar] [CrossRef]
- Nath, D.C.; Mwchahary, D.D. Association between climatic variables and malaria incidence: A study in Kokrajhar district of Assam, India. Glob. J. Health Sci. 2012, 5, 90–106. [Google Scholar] [CrossRef] [PubMed][Green Version]
- World Health Organization-South-East Asia Regional Office. Meeting on cross Border Collaboration on Malaria Elimination along the India-Bhutan Border; World Health Organization: Geneva, Switzerland, 2019. [Google Scholar]
- Wangchuk, S.; Drukpa, T.; Penjor, K.; Peldon, T.; Dorjey, Y.; Dorji, K.; Chhetri, V.; Trimarsanto, H.; To, S.; Murphy, A.; et al. Where chloroquine still works: The genetic make-up and susceptibility of Plasmodium vivax to chloroquine plus primaquine in Bhutan. Malar. J. 2016, 15, 277. [Google Scholar] [CrossRef] [PubMed]
- Douglas, N.M.; Poespoprodjo, J.R.; Patriani, D.; Malloy, M.J.; Kenangalem, E.; Sugiarto, P.; Simpson, J.A.; Soenarto, Y.; Anstey, N.M.; Price, R.N. Unsupervised primaquine for the treatment of Plasmodium vivax malaria relapses in southern Papua: A hospital-based cohort study. PLoS Med. 2017, 14, e1002379. [Google Scholar] [CrossRef] [PubMed]


| Characteristics | Plasmodium falciparum (%) | Plasmodium vivax (%) | Total (%) |
|---|---|---|---|
| Age (years) | |||
| ≤1 | 5 (1.6) | 5 (1.1) | 10 (1.3) |
| 2–12 | 63 (20.1) | 75 (16.5) | 138 (18.0) |
| 13–20 | 61 (19.4) | 75 (16.5) | 136 (17.7) |
| 21–45 | 127 (40.5) | 203 (44.7) | 330 (43.0) |
| >45 | 58 (18.5) | 96 (21.2) | 154 (20.1) |
| Sex | |||
| Female | 107 (34.1) | 161 (35.5) | 268 (34.9) |
| Male | 207 (65.9) | 293 (64.5) | 500 (65.1) |
| Occupation | |||
| Business | 4 (1.3) | 9 (2.0) | 13 (1.7) |
| Dependent | 23 (7.3) | 23 (5.1) | 46 (6.0) |
| Farmer | 146 (46.5) | 217 (47.8) | 363 (47.3) |
| House wife | 24 (7.6) | 40 (8.8) | 64 (8.3) |
| Labour | 5 (1.6) | 11 (2.4) | 16 (2.1) |
| Monk | 2 (0.6) | 4 (0.9) | 6 (0.8) |
| Public servant | 7 (2.2) | 26 (8.1) | 33 (4.3) |
| Armed forces | 17 (5.4) | 18 (2.4) | 35 (4.6) |
| Student | 86 (27.4) | 106 (23.4) | 192 (25.0) |
| Year | |||
| 2010 | 152 (48.4) | 249 (54.9) | 401 (52.2) |
| 2011 | 84 (26.8) | 74 (16.3) | 158 (20.6) |
| 2012 | 32 (10.2) | 30 (6.6) | 62 (8.1) |
| 2013 | 6 (1.9) | 6 (1.3) | 12 (1.6) |
| 2014 | 11 (3.5) | 8 (1.8) | 19 (2.5) |
| 2015 | 13 (4.1) | 22 (4.9) | 35 (4.6) |
| 2016 | 2 (0.6) | 17 (3.7) | 19 (2.5) |
| 2017 | 1 (0.3) | 23 (5.1) | 24 (3.1) |
| 2018 | 8 (2.6) | 12 (2.6) | 20 (2.6) |
| 2019 | 5 (1.6) | 13 (2.9) | 18 (2.3) |
| District | |||
| Chukha | 5 (1.6) | 22 (4.9) | 27 (3.5) |
| Dagana | 26 (8.3) | 17 (3.7) | 43 (5.6) |
| Pemagatshel | 6 (1.9) | 13 (2.9) | 19 (2.5) |
| Samdrup Jongkhar | 43 (13.7) | 36 (7.9) | 79 (10.3) |
| Samtse | 13 (4.1) | 52 (11.5) | 65 (8.5) |
| Sarpang | 217 (69.1) | 306 (67.4) | 523 (68.1) |
| Zhemgang | 4 (1.3) | 8 (1.8) | 12 (1.6) |
| Year | SaTScan Statistics | Long | Lat | Radius (km) | Population | Number of Cases | Expected Cases | No of Sub-Districts | RR | LLR | p-Value |
|---|---|---|---|---|---|---|---|---|---|---|---|
| 2010 | Most likely cluster | 90.2587 | 26.9402 | 50.36 | 70,171 | 120 | 36.51 | 26 | 11.86 | 101.71 | <0.001 |
| Secondary cluster | 91.9991 | 26.9079 | 0 | 2067 | 13 | 1.08 | 1 | 13.12 | 20.96 | <0.001 | |
| 2011 | Most likely cluster | 90.3536 | 26.9405 | 29.51 | 41,701 | 60 | 11.79 | 11 | 15.31 | 71.18 | <0.001 |
| 2012 | Most likely cluster | 90.3536 | 26.9405 | 29.51 | 42,535 | 26 | 4.51 | 11 | 26.44 | 36.44 | <0.001 |
| Secondary cluster | 91.9991 | 26.9079 | 0 | 2143 | 4 | 0.23 | 1 | 19.99 | 7.94 | <0.001 | |
| 2013 | Most likely cluster | 90.3435 | 27.0545 | 25.79 | 37,861 | 6 | 0.74 | 8 | Infinity | 12.56 | <0.001 |
| 2014 | Most likely cluster | 91.9991 | 26.9079 | 0 | 2220 | 6 | 0.078 | 1 | 167.64 | 22.14 | <0.001 |
| Secondary cluster | 90.3536 | 26.9405 | 9.4 | 14,771 | 5 | 0.52 | 3 | 16.79 | 7.97 | <0.016 | |
| 2015 | Most likely cluster | 90.4328 | 26.9283 | 15.71 | 32,603 | 11 | 1.33 | 6 | 48.10 | 19.68 | <0.001 |
| 2016 | No cluster | ||||||||||
| 2017 | No cluster | ||||||||||
| 2018 | Most likely cluster | 90.4845 | 26.9197 | 20.26 | 410,140 | 7 | 0.98 | 8 | 50.01 | 11.80 | <0.001 |
| 2019 | Most likely cluster | 90.5214 | 26.8637 | 0 | 2428 | 3 | 0.036 | 1 | 208.35 | 11.47 | <0.001 |
| Year | SaTScan Statistics | Long | Lat | Radius (km) | Population | Number of Cases | Expected Cases | No of Sub-Districts | RR | LLR | p-Value |
|---|---|---|---|---|---|---|---|---|---|---|---|
| 2010 | Most likely cluster | 90.3536 | 26.9405 | 33.61 | 45,511 | 1166 | 38.79 | 14 | 10.84 | 164.19 | <0.001 |
| Secondary cluster | 91.6777 | 26.8583 | 9.49 | 4652 | 19 | 3.97 | 2 | 5.10 | 15.21 | <0.001 | |
| 2011 | Most likely cluster | 90.4328 | 26.9283 | 26.02 | 40,946 | 45 | 10.2 | 11 | 9.71 | 43.93 | <0.001 |
| 2012 | Most likely cluster | 90.6599 | 26.8108 | 53.39 | 65,886 | 28 | 6.54 | 26 | 50.19 | 35.78 | <0.001 |
| 2013 | Most likely cluster | 90.4845 | 26.9197 | 20.26 | 37,147 | 6 | 0.73 | 8 | Infinity | 12.78 | <0.001 |
| 2014 | Most likely cluster | 90.4845 | 26.99197 | 20.26 | 37,913 | 7 | 0.97 | 8 | 50.68 | 11.88 | <0.001 |
| 2015 | Most likely cluster | 90.2869 | 26.8729 | 28.05 | 42,318 | 20 | 2.93 | 10 | 65.08 | 33.90 | <0.001 |
| 2016 | Most likely cluster | 90.2869 | 26.8729 | 28.05 | 43,161 | 14 | 2.27 | 10 | 30.26 | 20.69 | <0.001 |
| 2017 | Most likely cluster | 89.1271 | 26.9157 | 0 | 9974 | 10 | 0.70 | 1 | 24.56 | 19.60 | <0.001 |
| 2018 | Most likely cluster | 90.5628 | 26.9293 | 8.99 | 24,825 | 8 | 0.89 | 4 | 24.91 | 13.47 | <0.001 |
| 2019 | Most likely cluster | 90.1291 | 26.7959 | 18.46 | 8678 | 7 | 0.33 | 4 | 44.50 | 16.85 | <0.001 |
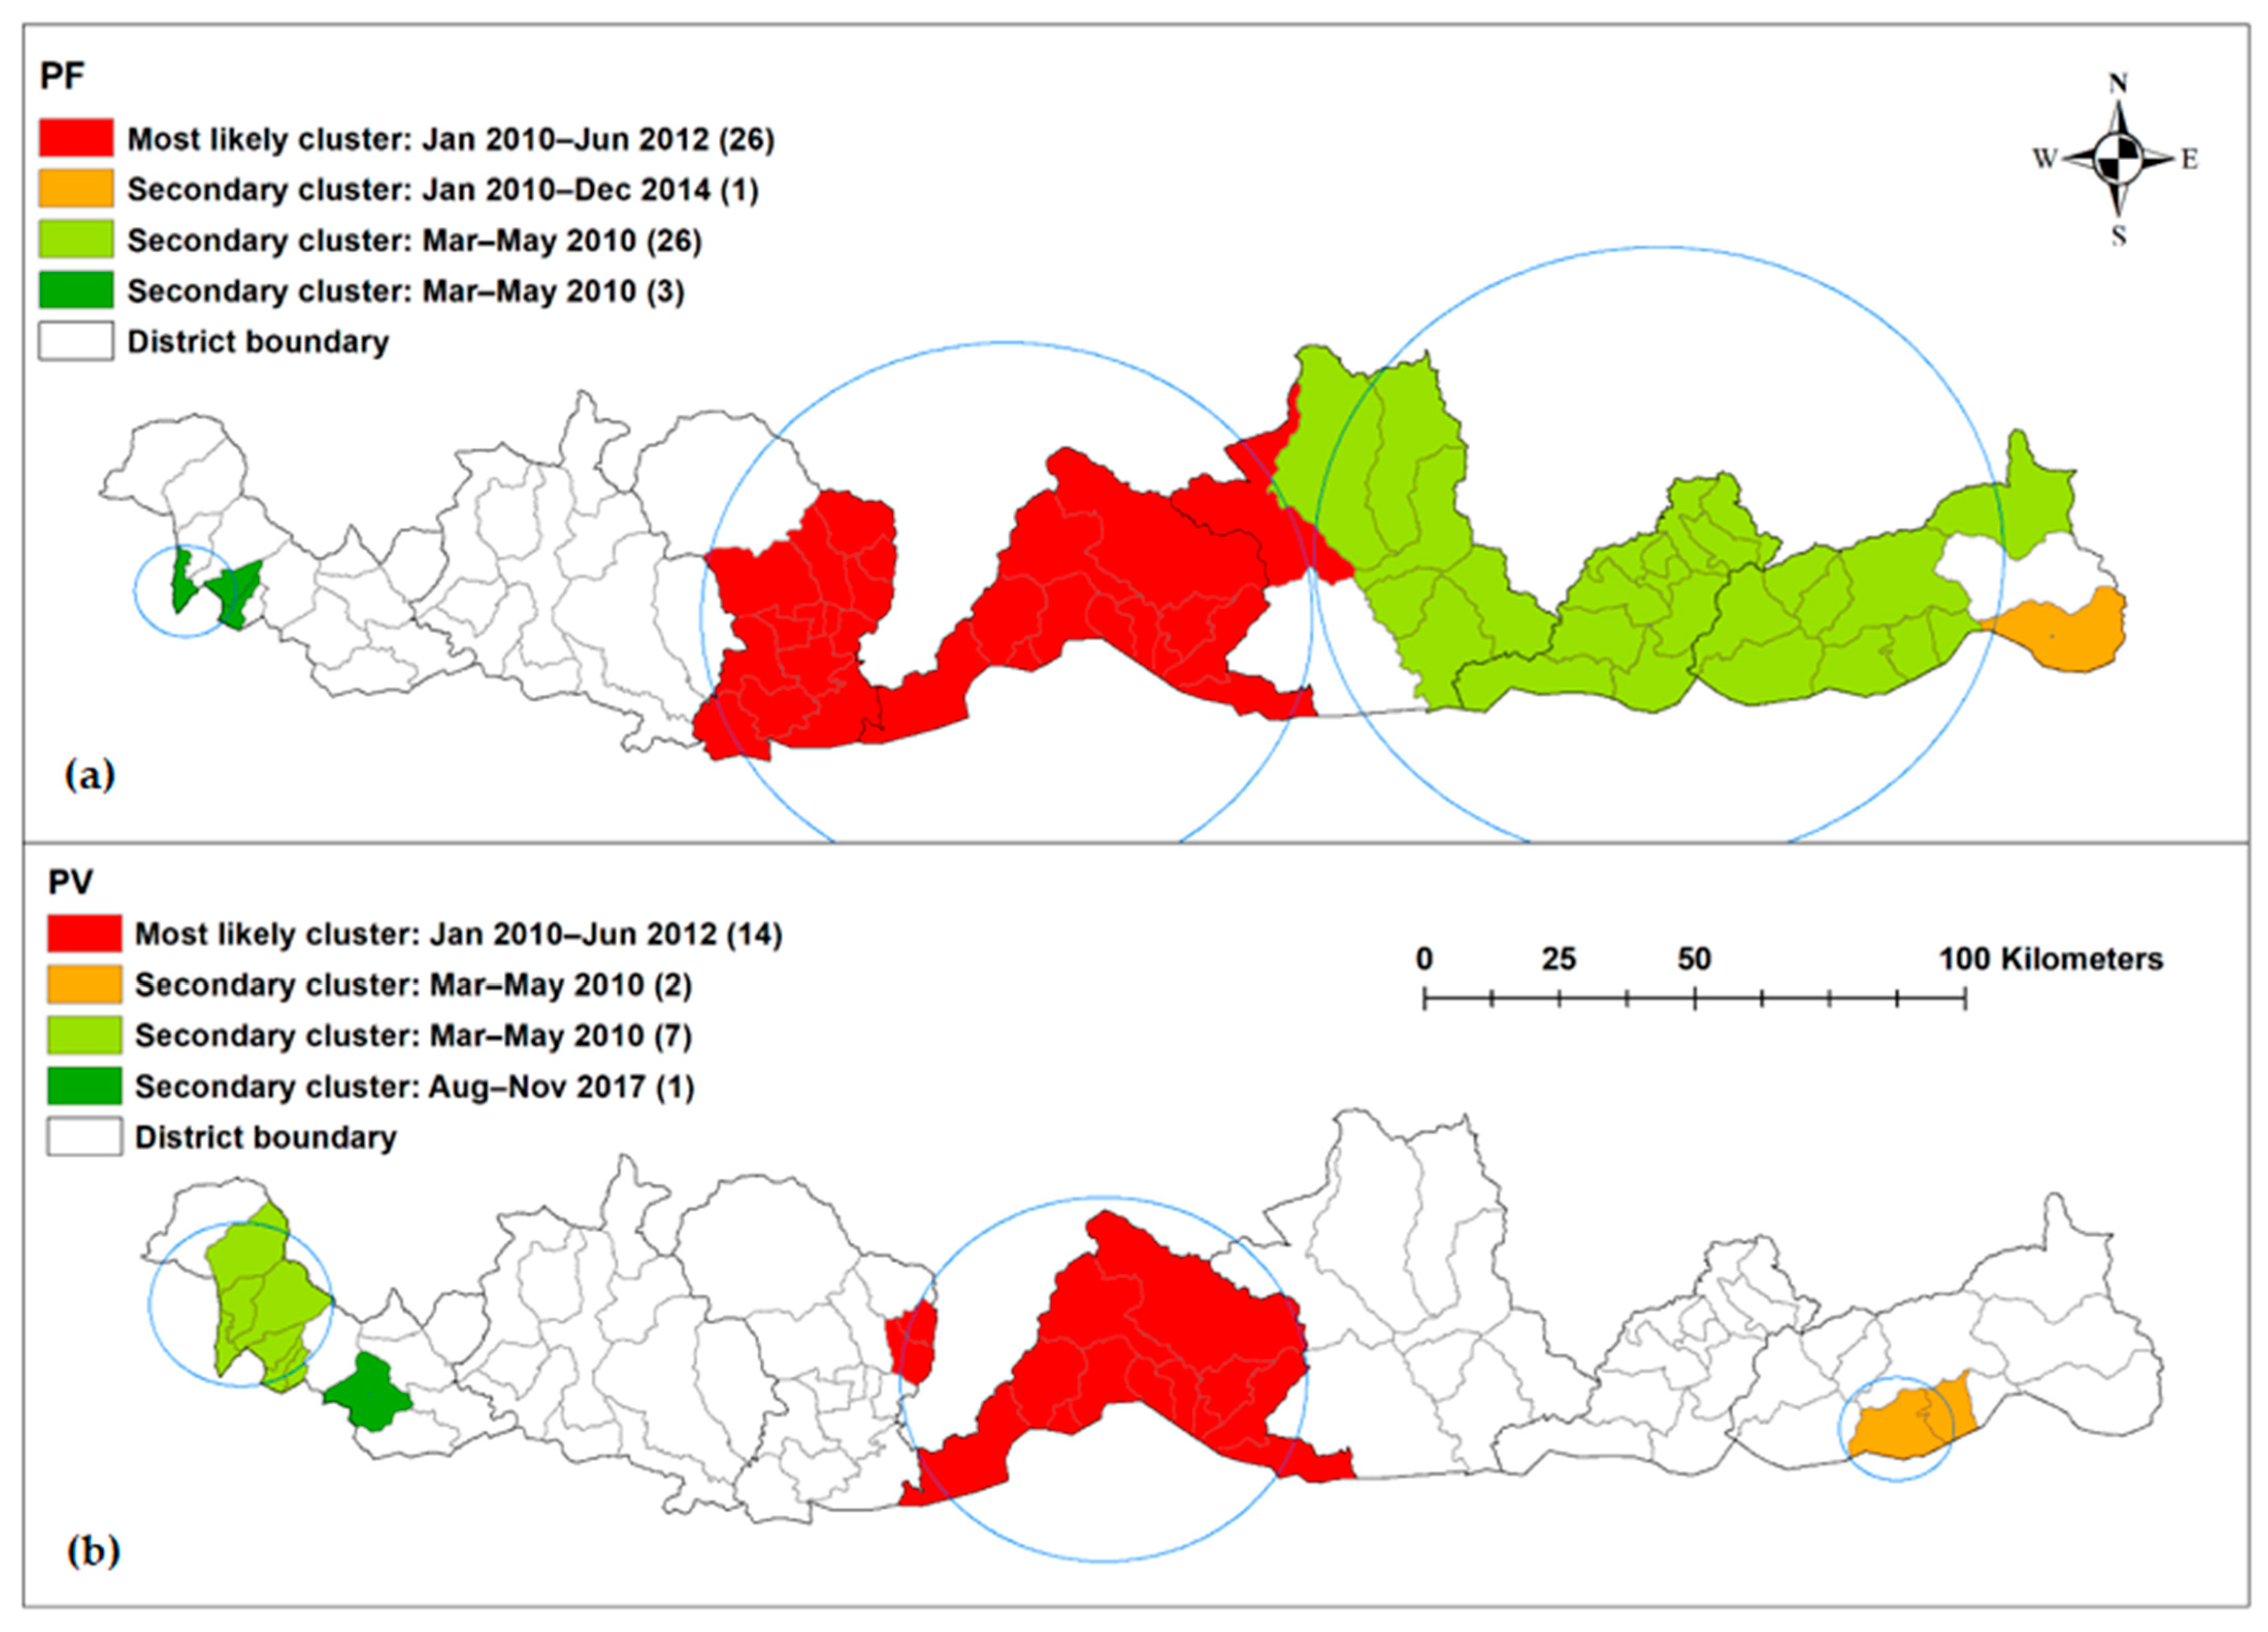
| Time Period (Month Year) | SaTScan Statistics | Long | Lat | Radius (km) | Population | Number of Cases | Expected Cases | No of Sub-Districts | RR | LLR | p-Value |
|---|---|---|---|---|---|---|---|---|---|---|---|
| January 2010–June 2012 | Most likely cluster | 90.2587 | 26.9402 | 50.36 | 76,572 | 207 | 17.71 | 26 | 32.66 | 399.91 | <0.001 |
| January 2010–December 2014 | Secondary cluster | 91.9991 | 26.9079 | 0 | 2243 | 25 | 1.07 | 1 | 25.37 | 55.86 | <0.001 |
| April 2010 | Secondary cluster | 91.3444 | 27.0405 | 56.81 | 72,597 | 9 | 0.55 | 26 | 16.69 | 16.76 | <0.001 |
| April 2010 | Secondary cluster | 88.8911 | 26.9823 | 8.33 | 11,685 | 5 | 0.089 | 3 | 57.15 | 15.28 | 0.0057 |
| Time Period (Month Year) | SaTScan Statistics | Long | Lat | Radius (km) | Population | Number of Cases | Expected Cases | No of Sub-Districts | RR | LLR | p-Value |
|---|---|---|---|---|---|---|---|---|---|---|---|
| January 2010–June 2012 | Most likely cluster | 90.3536 | 26.9405 | 33.61 | 49,858 | 233 | 16.62 | 11 | 27.74 | 464.34 | <0.001 |
| March–May 2010 | Secondary cluster | 91.6777 | 26.8583 | 9.49 | 5048 | 17 | 0.17 | 2 | 104.65 | 61.91 | <0.001 |
| March–May 2010 | Secondary cluster | 88.9128 | 27.0651 | 13.09 | 25,715 | 15 | 0.87 | 7 | 17.85 | 28.85 | <0.001 |
| August–November 2017 | Secondary cluster | 89.1271 | 26.9157 | 0 | 9596 | 10 | 0.48 | 1 | 21.30 | 20.95 | <0.001 |
Publisher’s Note: MDPI stays neutral with regard to jurisdictional claims in published maps and institutional affiliations. |
© 2021 by the authors. Licensee MDPI, Basel, Switzerland. This article is an open access article distributed under the terms and conditions of the Creative Commons Attribution (CC BY) license (https://creativecommons.org/licenses/by/4.0/).
Share and Cite
Wangdi, K.; Penjor, K.; Tobgyal; Lawpoolsri, S.; Price, R.N.; Gething, P.W.; Gray, D.J.; Da Silva Fonseca, E.; Clements, A.C.A. Space–Time Clustering Characteristics of Malaria in Bhutan at the End Stages of Elimination. Int. J. Environ. Res. Public Health 2021, 18, 5553. https://doi.org/10.3390/ijerph18115553
Wangdi K, Penjor K, Tobgyal, Lawpoolsri S, Price RN, Gething PW, Gray DJ, Da Silva Fonseca E, Clements ACA. Space–Time Clustering Characteristics of Malaria in Bhutan at the End Stages of Elimination. International Journal of Environmental Research and Public Health. 2021; 18(11):5553. https://doi.org/10.3390/ijerph18115553
Chicago/Turabian StyleWangdi, Kinley, Kinley Penjor, Tobgyal, Saranath Lawpoolsri, Ric N. Price, Peter W. Gething, Darren J. Gray, Elivelton Da Silva Fonseca, and Archie C. A. Clements. 2021. "Space–Time Clustering Characteristics of Malaria in Bhutan at the End Stages of Elimination" International Journal of Environmental Research and Public Health 18, no. 11: 5553. https://doi.org/10.3390/ijerph18115553
APA StyleWangdi, K., Penjor, K., Tobgyal, Lawpoolsri, S., Price, R. N., Gething, P. W., Gray, D. J., Da Silva Fonseca, E., & Clements, A. C. A. (2021). Space–Time Clustering Characteristics of Malaria in Bhutan at the End Stages of Elimination. International Journal of Environmental Research and Public Health, 18(11), 5553. https://doi.org/10.3390/ijerph18115553