1. Introduction
Though
Legionella spp. exist ubiquitously in natural water environments and as a pollutant in artificial water systems, isolation of the elusive opportunistic pathogen
Legionella pneumophila (
L. pneumophila) remains a strenuous task [
1].
L. pneumophila serogroup (sg) 1 is the most common infectious agent in Legionnaires Disease and in its milder form (Pontiac Fever) in Europe [
2]), however, other
Legionella spp. are also known to cause disease [
3].
Legionella isolation requires laboratories with long experience in cultivation of the organism, as various factors such as the complex steps necessary for culture and competing microbial flora in the sample can influence culture accuracy [
4,
5,
6]. The first differentiation of isolates of
Legionella spp. from other bacteria happens by selection for L-cysteine auxotrophy via buffered charcoal yeast extract (BCYE) agar, containing cysteine and iron salts, as well as α-ketoglutarate [
7]. The slow growth of the
Legionella spp. isolates further necessitates the elimination of competing microbial flora, using harsh methods, such as heat and acid treatment, which are also thought to have a negative impact on the cultivability of the
Legionellae and might lead to significant losses [
6,
7]. Additionally, it was shown that culture according to ISO 11731 is not very sensitive to the detection of
Legionella non-
pneumophila [
4,
8]. Culture requires long incubation periods of up to ten days, which constitute a problem in time-sensitive cases such as outbreak situations [
2,
5,
7]. The high tolerance of
Legionella to biocides, heat, and even acid, and its ability to persist, makes the constant monitoring of risk sources, such as cooling towers, hot, and cold-water systems or spa pools, essential [
9,
10].
All of the above-mentioned difficulties lead various scientists to the development of new methods for the detection and quantification of
Legionella in water samples, one of the techniques suggested by numerous scientists being quantitative polymerase chain reaction (qPCR) [
2,
11,
12]. Different assays were developed for this purpose, with some relying on intercalating fluorescent dyes such as SYBR Green for quantification, and others using molecular hybridization probe-based detection methods, such as TaqMan assays [
13]. These methods enable the detection and quantification via the total DNA isolated from the sample, thus allowing precise quantification of low amounts of target gene [
13]. The standard method ISO/TS 12869:2012-Water quality—detection and quantification of
Legionella spp. or
Legionella pneumophila by concentration and genic amplification by quantitative polymerase chain reaction (qPCR) was published as the reference guideline for laboratories using qPCR-based detection methods.
In order to improve the detection in the culture-based method, an updated version of the standard method ISO 11731:2017-Water quality and Enumeration of Legionella, referenced in most guidelines for drinking water, cooling towers, etc., implementing a decision matrix for sample analysis, was recently released. This reference method for detection of Legionella proposes three different methods for analyzing water samples, depending on the accompanying microbial flora in the water samples. One method, described as Matrix A, was recommended for the analysis of samples with low accompanying microbial flora, such as potable water. Matrix B was recommended for the analysis of samples with high accompanying microbial flora, such as cooling towers, cooling water, etc. Matrix C was recommended for samples with extremely high levels of accompanying flora, such as sewage.
Our study aimed at comparing the results for the detection of Legionella in water samples (detection of Legionella spp., L. pneumophila as well as L. pneumophila sg 1) obtained from the updated ISO 11731:2017, with results obtained by qPCR based on ISO/TS 12869:2012 for two different sample groups (samples with presumed low or high accompanying microbial flora), to gain further insights into their compatibility and usefulness in water sample valuation, for the difficult-to-handle Legionella.
2. Materials and Methods
2.1. Water Samples
From March to May 2018, routine water samples (n = 64) screened for Legionella contamination were collected from the water laboratory at the Institute for Hygiene, Microbiology and Environmental Medicine at the Medical University of Graz. The samples were of mixed origin, with one category (n = 46) being samples with presumably low accompanying bacterial flora, such as water supply samples (n = 32) and water circuit samples of bathing water (n = 14), and the other category being samples with an expected high accompanying bacterial flora (n = 18), coming from cooling towers (n = 3), cooling water (n = 6), car wash facilities (n = 7), and system water (n = 2). All were analyzed for possible Legionella contamination by culture, as well as by qPCR.
2.2. Sample Preparation and DNA Extraction
Samples were collected in multiple, sterile 100 mL plastic bottles (VWR International, Vienna, Austria), 500 mL aliquots were used for quantification by culture, and 50–100 mL aliquots, depending on the amount of sample sent to the water laboratory, were used for quantification by qPCR. Samples were either analyzed immediately after arrival in the laboratory or within 24 h after arrival with storage at 4 °C, until preparation. For DNA extraction, aliquots were filtered through a 45 mm polycarbonate membrane with a 0.2 µm pore size (Isopore™ Membrane Filters, Merck Millipore Ltd., Darmstadt, Germany). Filters were stored until DNA extraction at −80 °C. DNA extraction was performed using the Qiagen PowerWater Kit (QIAGEN GmbH, Hilden, Germany), according to the manufacturer’s protocol. The quantity and purity of the DNA extracts were measured by the NanoDrop2000 instrument (Thermo Fisher Scientific Inc., Waltham, MA, USA).
2.3. Quantification by Culture
The quantification of
L. pneumophila sg 2–15 and sg 1 by culture was performed according to ISO 11731:2017. Sample handling was performed according to the decision matrix described in the standard method ISO 11731:2017 (see
Table 1), with the exception of applying Matrix A as well as Matrix B, regardless of presumed accompanying microbial flora to compare both. No samples requiring Matrix C were included in this study.
For water supply samples and water circuit samples (presumed low burden of accompanying microbial flora), samples were analyzed using Matrix A as well as Matrix B. In brief, for Matrix A, 1 mL as well as 100 mL of the sample were filtered through a 47 mm mixed cellulose esters filter with a 0.45 µm pore size (EZ-Pak® Membrane Filters, Millipore, Darmstadt, Germany). The filters were then directly placed on BCYE agar plates (VWR International, Vienna, Austria) (Method A). For Method B, 1 mL and 100 mL of the samples were filtered and microorganisms were subsequently recovered from the membrane filters using 5 mL of 2.5% Ringer’s solution, by vortexing and 0.250 mL of the rinsate were plated on GVPC agar (VWR International, Vienna, Austria) or the filters were treated with acid buffer (30 mL 0.2 mol·L−1 hydrochloric acid and 0.2 mol·L−1 potassium chloride acid solution; pH level of 2.2) for 5 min and then rinsed with 20 mL 2.5% Ringer’s solution, and the filters were then placed on GVPC agar (VWR International, Vienna, Austria). For heat treatment, 1 mL rinsate was heated for 30 min at 50 °C and 0.25 mL were then plated on GVPC agar (VWR International, Vienna, Austria).
For Matrix B, 100 mL of the sample were filtered through a 47-mm polycarbonate filter with a 0.2 µm pore size (Supor® Membrane Filters, Pall Corporation, Dreieich, Germany), and microorganisms were subsequently recovered from the membrane filters, using 5 mL of 2.5% Ringer’s solution through vortexing. A total of 0.25 mL of the recovered sample were then plated on the GVPC agar plates (VWR International, Vienna, Austria). For heat treatment, another 0.25 mL of the recovered sample was incubated for 30 min at 50 °C and then plated on GVPC agar plates (VWR International, Vienna, Austria). For acid treatment, another 0.25 mL of the recovered sample was filtered through a 47-mm mixed cellulose esters filter with a 0.45 µm pore size (EZ-Pak® Membrane Filters, Millipore, Darmstadt, Germany), which was then subjected to the acid buffer treatment, as described above. Afterwards, filters were rinsed with 20 mL of 2.5% Ringer’s solution. The rinsed filters were then placed on the GVPC agar plates (VWR International, Vienna, Austria).
For the cooling tower, cooling water, car wash facility water, system water, and bath water samples (presumed high burden of accompanying microbial flora), the samples were also analyzed using Matrix A and B, with the following modifications. For Matrix A, 0.01 mL, 0.1 mL, 1 mL, and 100 mL of the sample were filtered through a 47-mm mixed cellulose esters filter with a 0.45-µm pore size (EZ-Pak® Membrane Filters, Millipore, Darmstadt, Germany) and was handled as described above. Matrix B was performed in the same manner as for the other sample types.
All plates were incubated at 36 °C for 7 to 10 days in a box (GENbox, bioMérieux, Vienna, Austria), and the colonies were counted at the end of the incubation period. Five or more presumptive Legionella-colonies were confirmed to be Legionella spp. by sub-culturing on Columbia blood agar plates (bioMérieux, Vienna, Austria) as well as the BCYE agar plates (VWR International, Vienna, Austria). The colonies were defined as Legionella spp. if no growth on cysteine-free Columbia blood agar plates, but growth on the BCYE agar plates occurred.
Legionella colonies growing on the BCYE agar plates (VWR International, Vienna, Austria) were further differentiated via latex agglutination testing in L. pneumophila sg 1, L. pneumophila sg 2–14, as well as Legionella non-pneumophila (L. longbeachae sg 1 and 2, L. bozemanii sg 1 and 2, L. dumoffii, L. gormanii, L. jordanis, L. micdadei, and L. anisa), using the LEGIONELLA LATEX TEST (Oxoid Deutschland GmbH, Vienna, Austria), according to the manufacturer’s instructions. For the final enumeration of Legionella, plates with the highest count of confirmed Legionella colonies were used.
2.4. Quantification by Legionella-Specific qPCR
2.4.1. qPCR Primers and Probe Sets
Primer and probe sets specific for
ssrA,
mip,
wzm, and
egfp (all primers as well as probes for
mip,
wzm, and
egfp from Eurofins Genomics, Ebersberg, Germany; probe for
ssrA from Applied Biosystems
®, Warrington, Cheshire, UK) were selected from the current literature and used as previously described by Collins et al., 2015 [
2] and Bliem et al., 2015 [
14], with modification of fluorescent dyes or fluorescence quenchers (see
Table 2). All gene targets occurred as a single copy in the
Legionella genome.
2.4.2. qPCR Conditions
Quantitative PCR was carried out according to ISO/TS 12869:2012, Collins et al., 2015 [
2] and Toplitsch et al., 2018 [
15], with the exception of using a simplex assay for each gene. For all reactions, the Luna
® Universal Probe qPCR Master Mix (New England Biolabs
® Inc., Frankfurt am Main, Germany) was used, and the reactions were carried out in a 20-µL reaction mix containing 400 nmol·L
−1 of each
Legionella-specific primer (600 nmol·L
−1 primer for 5′-GGCGACCTGGCTTC-3′ for
ssrA), 200 nmol·L
−1 of the IAC plasmid primers, 150 nmol·L
−1 of each
Legionella specific probe, 75 nmol·L
−1 IAC probe, and 0.4 µg/µL BSA. 5 µL of either extracted DNA from the samples or genomic DNA for the positive control were taken as a template. Thermal cycling conditions were 95 °C for 10 min, followed by 45 cycles of 95 °C for 15 s and 60 °C for 1 min. A positive control of
L. pneumophila sg 1 DSM 7513 (Leibnitz Institute DSMZ- German Collection of Microorganisms and Cell Cultures, Braunschweig, Germany) genomic DNA diluted to 65.1 pg/µL in the PCR grade water (Promega Corporation, Vienna, Austria) and a non-template control (NTC) PCR grade water (Promega Corporation, Vienna, Austria) were included in all assays. To determine the detection sensitivity of the qPCR, as well as for the generation of standard curves, calibration standards derived from the certified external reference material SRM_LEGDNA_01 ranging from 2.5 × 10
5 to 2.5 × 10
0 target gene copies (LEGIONELLES Centres Nationaux de Référence, Lyon, France) were included in every qPCR run. qPCR was performed in a LightCycler 480 II System (Roche Austria GmbH, Vienna, Austria).
Legionella spp. (
ssrA) positive samples underwent further testing for
L. pneumophila (
mip), and
L. pneumophila positive samples were further analyzed for
L. pneumophila sg 1 (
wzm). Samples were analyzed in duplicates. Samples that tested positive were repeated.
2.4.3. Positive Control
For the positive control, L. pneumophila sg 1 DSM 7513 (Leibnitz Institute DSMZ- German Collection of Microorganisms and Cell Cultures, Braunschweig, Germany) genomic DNA was prepared using the DNeasy Blood and Tissue Kit (QIAGEN GmbH, Hilden, Germany), according to the manufacturer’s protocol, with the following modifications: L. pneumophila sg 1 DSM 7513 was grown on the BCYE agar plates (VWR International, Vienna, Austria) 36 °C, for seven to 10 days, under CO2 pressure (GENbox CO2, bioMérieux, Vienna, Austria). Two sterile inoculation loops with 1 µL volume (Greiner Bio-One International GmbH, Kremsmünster, Austria) were mixed into 180 µL buffer ATL, 20 µL proteinase K were added, vortexed, and incubated for 45 min at 56 °C. The quantity and purity of the DNA extracts were measured with a NanoDrop2000 instrument (Thermo Fischer Scientific Inc., Waltham, MA, USA). The extracted genomic DNA was then diluted to 65.1 pg/µL in PCR grade water (Promega Corporation, Vienna, Austria) and included as a positive control in all qPCR assays.
2.4.4. DNA Extraction Control and qPCR Target Specificity Control
In order to test for DNA extraction quality as well as qPCR precision, two one liter samples of sterilized, deionized water were spiked with one LENTICULE DISC each (FEPTU, Public Health England, London, UK). One sample (sample A) contained 1.3 × 10² GU/100 mL L. bozemanii, as well as unknown concentrations of Acinetobacter junii and Pseudomonas lundensis. The other sample (sample B) contained 3.9 × 10³ GU/100 mL L. pneumophila sg 1, as well as an unknown concentration of Citrobacter brakii. Experimental procedure was performed the same as described above for all samples. To further investigate the DNA extraction performance, 100 mL of three separate cooling water samples as well as 100 mL of deionized, sterilized water were each spiked with one LENTICULE DISC containing around 4.12 × 10⁴ CFU L. pneumophila NCTC12821 (Culture Collections, Public Health England, London, UK) and the experimental procedure was performed in the same manner as that for other samples.
2.4.5. Amplification Inhibition Control
The
egfp gene was selected as an internal amplification control (IAC), as described by Bliem et al. [
14]. A pJET1.2 vector (Thermo Fischer Scientific Inc., Waltham, MA, USA) containing the
egfp insert was kindly provided by Bliem et al., and was cloned into
Escherichia coli DH5α competent cells (Thermo Fischer Scientific Inc., Waltham, MA, USA). The plasmid was purified using the QIAprep Spin Miniprep Kit (QIAGEN GmbH, Hilden, Germany) and the quantity and purity of the plasmid was measured using a NanoDrop2000 instrument (Thermo Fischer Scientific Inc., Waltham, MA, USA). The plasmid was diluted to 250 copies/µL in PCR grade water (Promega Corporation, Vienna, Austria) and stored at −20 °C until use.
2.4.6. Data Analysis
The LightCycler 480 software (Roche Austria GmbH, Vienna, Austria) automatically calculated threshold baselines, slopes, and efficiency, by running the corresponding bacterial gene standard derived from the standard reference material SRM_LEGDNA_01, in a range of 2.5 × 10
5 to 2.5 × 10
0 target gene copies. Furthermore, the software automatically calculated mean crossing point (cp) values for replicates, which were used for the final calculations. The cp value of the last detectable standard was set as the limit of detection (LOD) of the qPCR, as the non-template control was not detectable 1 [
1].
Statistical analysis was performed using Microsoft Excel and the online program MEDCALC
® statistical software [
16]. Predictive values were calculated considering the culture method as the reference method for the detection of
Legionella in environmental water samples.
3. Results
3.1. Positive Control and qPCR Precision
For the positive control, L. pneumophila sg 1 DSM 7513 genomic DNA with 65.1 pg/µL was used. Cp values for Legionella spp. were 29.59 ± 0.21 cycles, for L. pneumophila, there were 27.85 ± 0.04 cycles, and for L. pneumophila sg there were 1 28.47 ± 0 cycles.
3.2. DNA Extraction Control and qPCR Target-Specificity Control
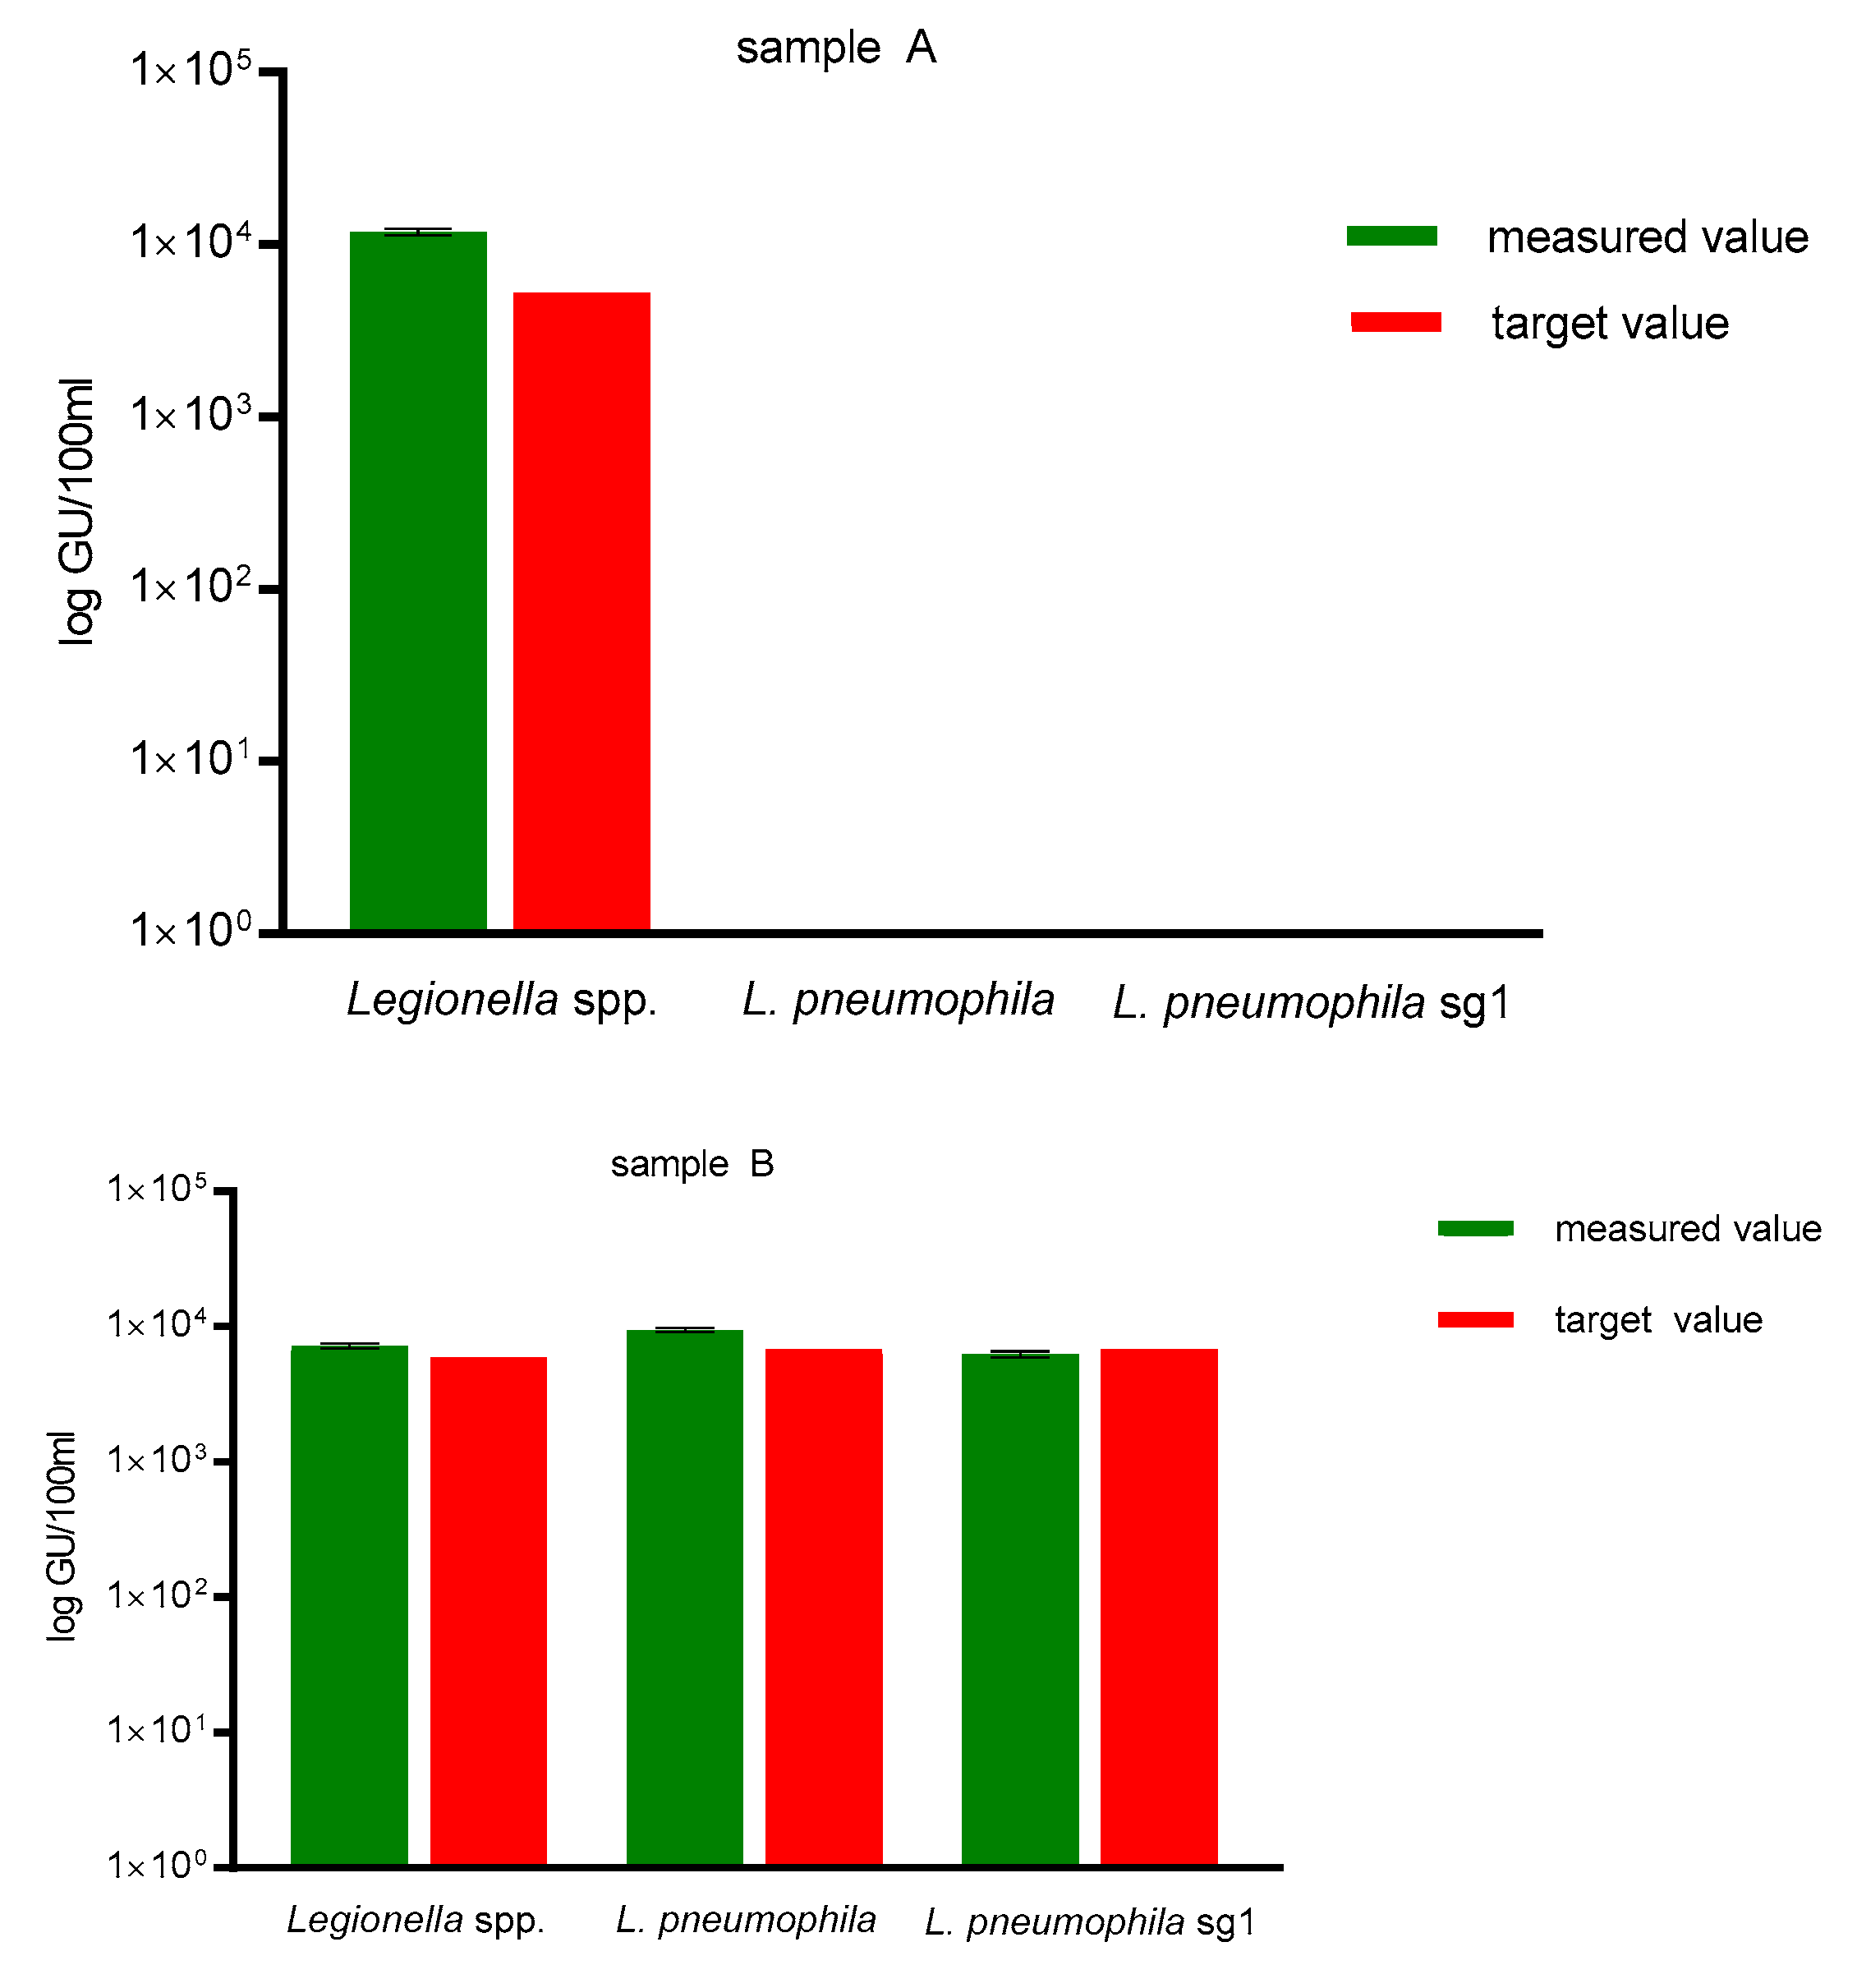
The DNA recovery by the Qiagen PowerWater Kit ranged between 92 to 225% (mean 144%), therefore, exceeding the minimum recovery of 25% recommended in ISO/TS 12869:2012 (see
Figure 1). No unspecific amplification for the NTC was observed.
As a DNA extraction control and qPCR specificity control, sample A contained a defined concentration of 1.3 × 10
2 GU/100 mL
L. bozemanii and sample B contained a defined concentration of 3.9 × 10
3 GU/100 mL
L. pneumophila sg 1 (samples obtained via FEPTU, Public Health England, United Kingdom). As shown in
Figure 1, sample A showed no amplification for
L. pneumophila and
L. pneumophila sg 1, but correct amplification for
Legionella spp. Measured values for sample B showed correct amplification for all three assays, corresponding to the target value of 3.9 × 10
3 GU/100 mL
L. pneumophila sg 1 for sample B.
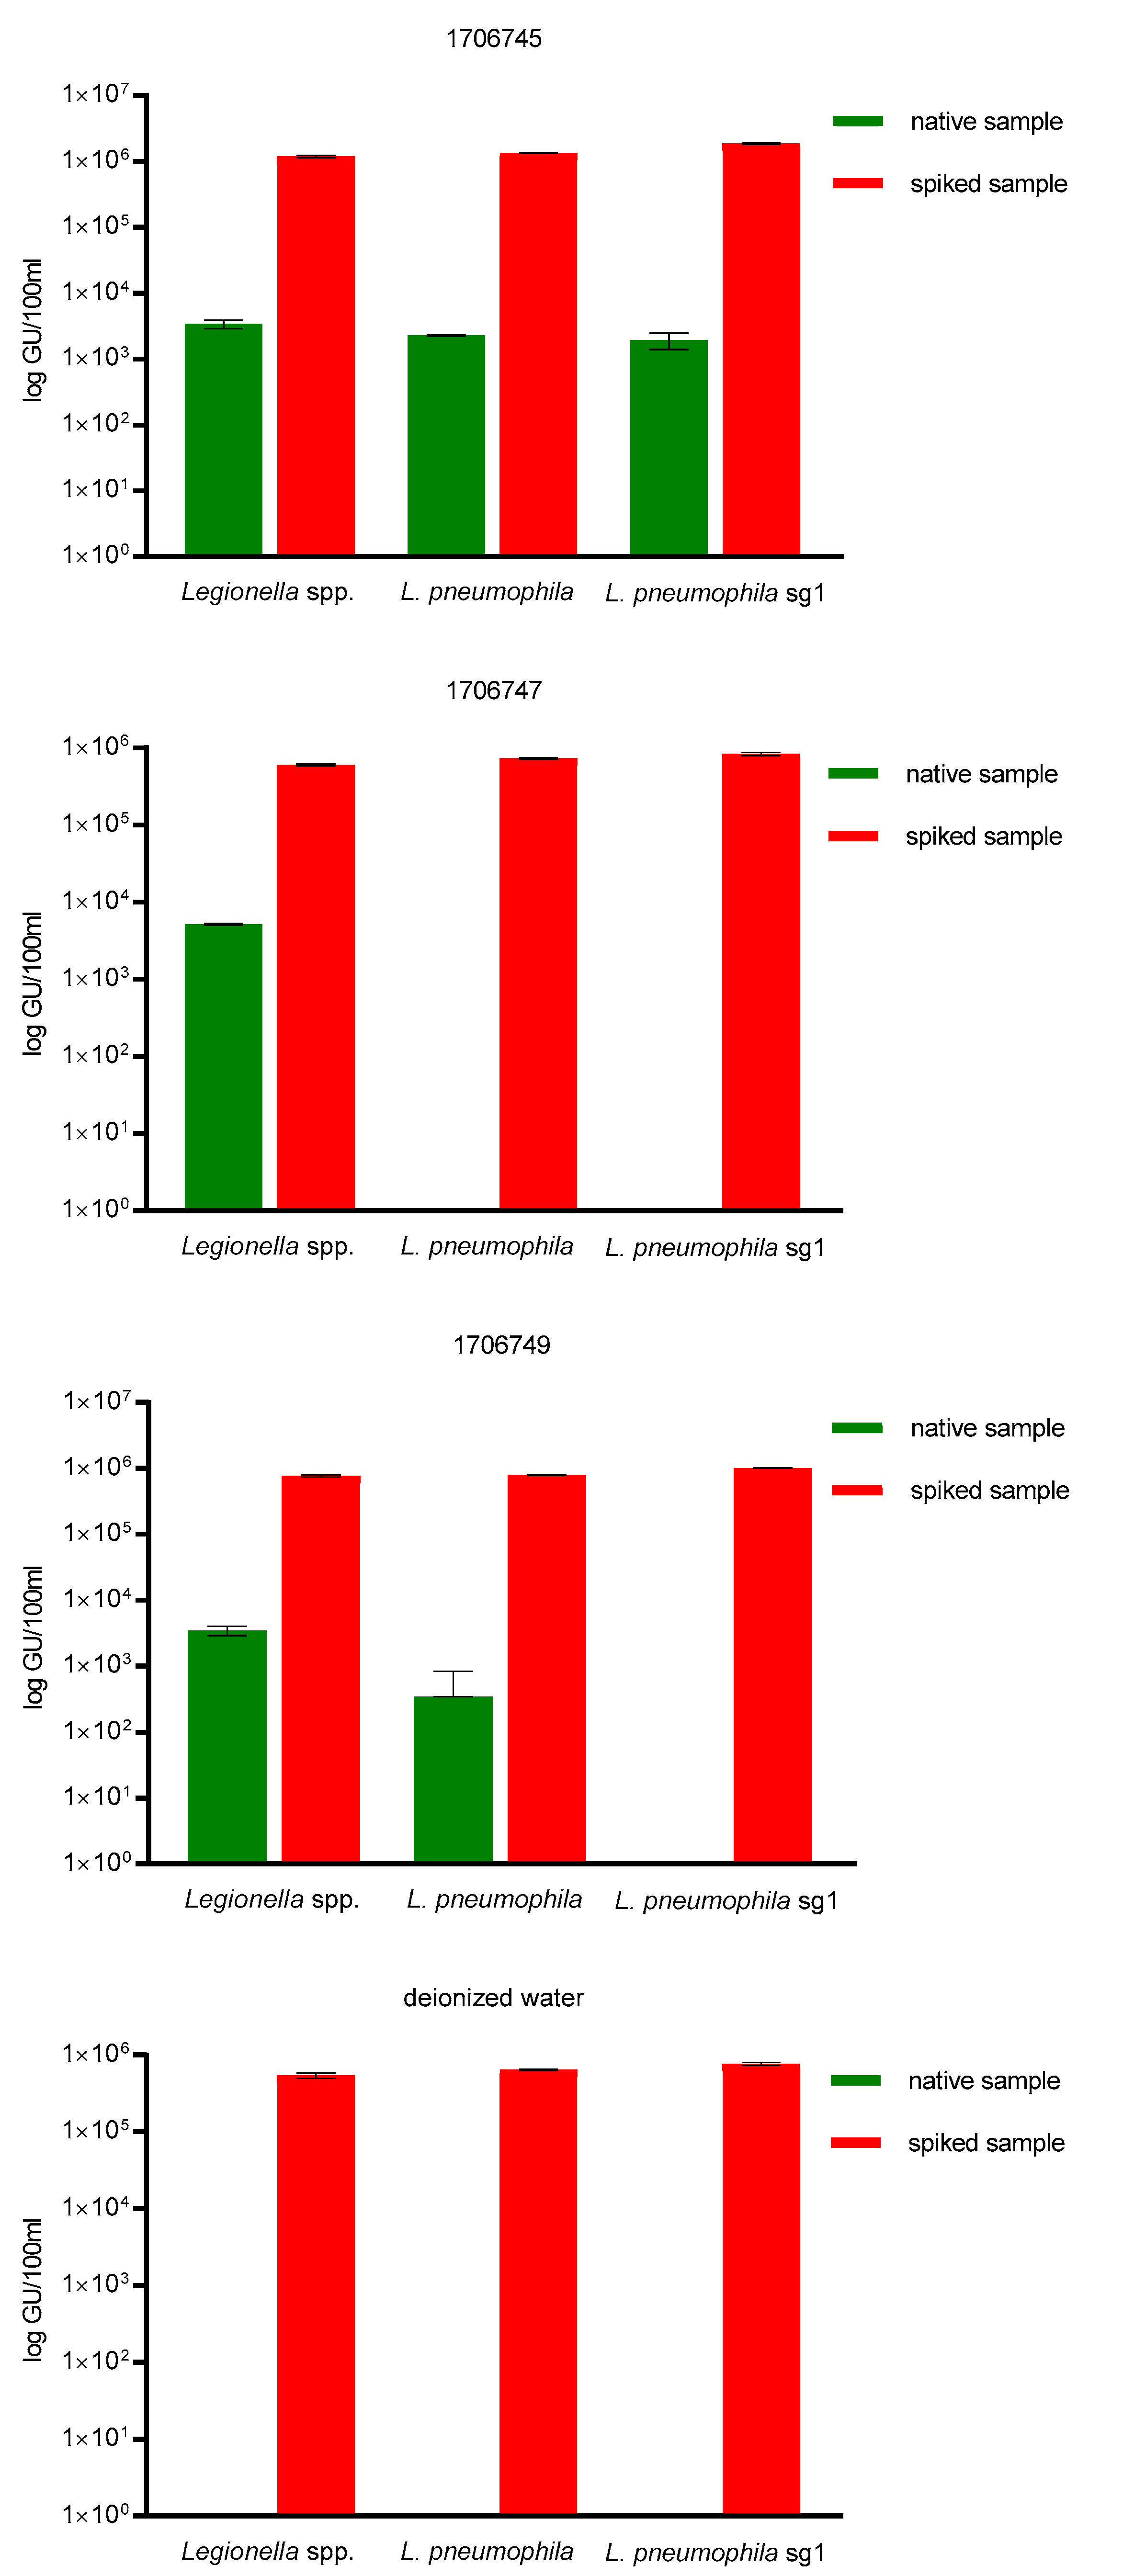
To further determine qPCR target specificity, three cooling water samples as well as sterilized, deionized water were spiked with one LENTICULE DISC containing around ~9.25 × 10
5 GU/100 mL (±1.45 × 10
5 GU/100 mL)
L. pneumophila sg 1. For this purpose, the samples coming from the cooling waters were used, as they represent a difficult sample matrix, due to the potential use of biocides. Water systems that produce aerosols are especially under inspection for Legionella contamination, e.g., cooling towers, hot- and cold-water systems or spa pools, which provide comfortable temperatures for bacterial growth ranging from 20 to 45 °C, due to their heat-exchanging function and thus serve as ‘bacterial amplifiers’, which is why biocides, e.g., bromide and chlorine derivatives or quaternary ammonium compounds might be present in the sample, and could lead to inhibiton of qPCR. No inhibition of qPCR in the spiked samples was observed and the mean recovery of the spiked samples was ~9.25 × 10
5 GU/100 mL (±1.45 × 10
5 GU/100 mL)
L. pneumophila sg 1 for all three qPCR assays was 100% (
Figure 2).
3.3. Amplification Inhibition Control
The Qiagen PowerWater Kit allowed for efficient removal of possible inhibitors during DNA extraction, as no inhibition of qPCR in the samples was observed and the samples were therefore used undiluted in the qPCR assays. Mean cp values for the IAC were 30.63 ± 0.21 cycles. Samples were considered to be inhibited if the ct values shifted higher than 2 cycles, as compared to the IAC in the NTC, in this case, the samples were repeated diluted.
3.4. Linearity and Limits of Detection of qPCR
Quantification of Legionella spp. as well as L. pneumophila and L. pneumophila sg 1 was linear between the 2.5 × 100 and 2.5 × 10⁵ GU/reaction. The LightCycler 480 software (Roche Austria GmbH, Vienna, Austria) automatically calculated reaction efficiencies (E = 10−1/slope), which ranged from 1.954 to 2.11 for all assays, with the expected systematical error (2n/En − 1) × 100 staying below 0.0345 for all three qPCR assays. LOD was 2.5 × 100 GU/reaction, corresponding to an LOD of 5 × 101 GU/100 mL for all three assays used. No amplification of the NTC was observed.
3.5. Limits of Detection for Culture
For culture performed according to ISO 11731:2017, the LOD was 1 CFU/100 mL for the culture Matrix A, whereas for Matrix B, the LOD was 20 CFU/100 mL. The LOD of the culture methods was dependent on the volume filtrated for either of the Matrix procedures, which was 1 as well as 100 mL for Matrix A; or for Matrix B, from a filtration volume of 100 mL that was recovered in 5 mL, 0.25 mL were plated.
3.6. Comparison of Culture Matrix A and B
Thirteen water supply samples (20.31%) tested positive for L. pneumophila contamination, with one of those samples (7.69%) testing positive via Matrix B and nine samples (69.23%) testing positive via Matrix A. In combination, two samples (15.83%) tested positive for L. pneumophila using Matrix A as well as Matrix B.
3.7. Culture (ISO 11731:2017) and qPCR (ISO/TS 1286:2012) in Comparison for Environmental Water Samples
Culture according to ISO 11731:2017 and qPCR based on ISO/TS 1286:2012 were carried out for environmental water samples (n = 64) analyzed routinely for Legionella contamination. Of the analyzed samples in this study, 31 samples (48.44%) were negative for Legionella spp. using both culture and qPCR. qPCR detected Legionella spp. via the ssrA gene in 29 out of 64 samples (45.31%).
For samples with a presumed low burden of the accompanying microbial flora (
n = 46),
L. pneumophila sg 2–15 was detected using culture Matrix A in nine samples (19.57%), whereas none were positive using culture Matrix B. qPCR found
L. pneumophila DNA contamination in four samples (8.70%). There were eight culture positive-qPCR negative samples (17.39%) and three qPCR positive-culture negative samples (6.52%) (see
Table 3). This results for samples with an expected low burden of accompanying microbial flora in a PPV of 75.00%, and an NPV of 82.22% for the
mip-based qPCR (see
Table 4).
For samples with a presumed high burden of accompanying microbial flora (
n = 18),
L. pneumophila sg 2–15 was detected using culture Matrix A in two (11.11%) samples, whereas only one was positive only by culture Matrix B (5.56%). qPCR found
L. pneumophila DNA contamination in five samples (27.78%) samples. There were no culture positive-qPCR negative samples and three qPCR positive-culture negative samples (16.67%) (see
Table 3). This results for samples with an expected high burden of accompanying microbial flora in a PPV of 40.00%, and an NPV was 100.00% for the
mip-based qPCR (see
Table 4).
For samples with a presumed low burden of accompanying microbial flora (n = 46), culture did not detect L. pneumophila sg 1 in any sample, which corresponded with qPCR results and did not find L. pneumophila sg 1 DNA contamination, and therefore no PPV could be predicted.
For samples with a presumed high burden of accompanying microbial flora (n = 18), culture detected L. pneumophila sg 1 in one sample (5.56%), and qPCR found L. pneumophila sg 1 DNA in five samples (27.78%). There were no culture positive-qPCR negative samples and four qPCR positive-culture negative samples (22.23%). This resulted in a PPV of 17.00% and a NPV of 100.00% for the wzm-based qPCR.
qPCR detected Legionella spp. via the ssrA gene in concentrations ranging 4.41 × 10² GU/100 mL to 1.15 × 10⁶ GU/100 mL in 29 samples, L. pneumophila via the mip gene in nine samples, in concentrations ranging from 6.56 × 10² GU/100 mL to 3.88 × 10⁵ GU/100 mL and in L. pneumophila sg 1 via the wzm gene, in concentrations ranging from 1.32 × 10² GU/100 mL to 1.47 × 10⁵ GU/100 mL in five samples.
On the other end, the culture identified L. pneumophila in concentrations ranging from 2 CFU/100 mL to 1 × 10² CFU/100 mL for Matrix A in eleven samples. For L. pneumophila sg 1, the culture detected one sample using only Matrix B at and detected concentrations of 7.2 × 10² CFU/100 mL.
4. Discussion
qPCR is considered to be a fast and convenient method for rapid
Legionella detection from environmental water samples, providing a high specificity for the amplified target. However, qPCR comes with its own set of limitations, one being the possible presence of inhibiting substances in the samples of interest (such as humic acids or ferric ions), and the other being the detection of not only viable, but also dead bacteria and bacterial cells being in the viable-but-non-culturable (VBNC) state [
13]. As of now, it is difficult to compare qPCR results with those obtained by culture, as the qPCR results are expressed in genomic units (GU) and the culture results are in colony forming units (CFU), which is the format given in most guideline documents. There are some calculations available, such as Lee et al. (2011), who reported that qPCR results are four- to five-fold higher than culture results. Yaradou et al. (2007) also described five-fold higher qPCR results than the culture and Ditommaso et al. (2015) proposed a conversion factor of 28-fold from qPCR to culture [
10,
12,
17]. However, no conversion factor between GU and CFU is yet implemented into the guideline documents and the standard methods [
15]. Authors such as Hamilton et al. (2019) suggest the necessity of additional datasets for this conversion factor for statistical models before implementation of such a conversion factor [
18].
As previously reported, DNA extraction efficiencies and PCR inhibitor removal are dependent on the extraction and purification method used [
14]. In this study, we used a commercially available kit for DNA extraction for all different water samples, which provided good DNA recovery as well as inhibitor removal and allowed the undiluted use of DNA extracts during qPCR (see
Figure 1).
Our study confirmed numerous previous investigations [
2,
4,
9,
12,
19,
20,
21,
22] that showed more qPCR positive than culture positive results, which could be explained by the difficulty of
Legionella cultivation, the existence of cells being in the VBNC state, dead bacteria, and a higher sensitivity of qPCR. This, in turn, leads to a conceivably low PPV of qPCR for culture results [
4]. As alternative solutions, recent studies propose the use of propidium monoazide or ethidium monoazide nucleic acid dyes, prior to DNA extraction for qPCR, to inhibit DNA amplification from dead bacterial cells to further improve qPCR comparability with culture methods [
10]. Other methods to detect viable and virulent
Legionella at low concentrations might be amoebic co-culture prior to qPCR, as their ability to invade and multiply within
Acanthamoeba might indicate their pathogenicity [
23], or immunomagnetic separation, which is a method not affected by competing microbial flora or inhibitors present in the sample, and can show success of biocide treatment, as it detects only viable
Legionella and would, therefore, be very useful for risk assessment and water safety plans [
24].
In our study, culture-negative–qPCR-positive occurred with a rate of 17.39% in samples with an expected low accompanying microbial flora, with all samples giving results of 2 CFU/100 mL in the culture. Other studies also observed the phenomenon that samples with a low CFU/100 mL count might give qPCR-negative results, and these authors imply that samples with a low concentration have little chance of causing disease [
25]. From a public health view, the Austrian standard ÖNORM B 5019:2020-3
Hygienerelevante Planung, Ausführung, Betrieb, Überwachung und Sanierung von zentralen Trinkwasser-Erwärmungsanlagen states an alert level of 10
4 CFU/L, which requires immediate sanitation of the site, and this concentration can be reliably detected in our study, which goes in line with the guidelines in other countries such as Spain, Denmark, or Italy, which also apply an alert level of 10
4 CFU/L [
26]. However, so far, no direct relationship was established between
Legionella load and disease, but a quantitative microbial risk assessment calculated by Hamilton et al. (2019), estimated a critical concentration of 10
3 CFU/L [
18]. Disease and finding
L. pneumophila sg 1, no matter if via qPCR or culture, is an indicator that further investigation and preventive measures for rehabilitation of the affected source might be advisable [
4,
27].
As previously recognized [
5,
8], the serotyping of
L. pneumophila isolates as well as the culture methods in ISO 11731:2017 introduce a bias towards isolation of
L. pneumophila and possibly neglects other
Legionella spp. present in the sample, which was also shown to be especially prevalent in water samples taken from sources with temperatures below 37 °C [
4]. Similar to other studies, all isolated strains in this study were
L. pneumophila, and 92.31% of the
L. pneumophila isolates belonged to serogroups 2–14, which accounted for about 15–20% of the community-acquired Legionellosis cases [
28]. However,
L. pneumophila is thought to be the causative agent in 95% of all cases of Legionnaires disease worldwide and
L. pneumophila sg 1 for about 70% of cases in Europe [
2,
4]. The qPCR assay for the detection of
L. pneumophila sg 1 proved to be reliable and specific in detection for samples with an expected high burden of accompanying microbial flora, such as cooling towers, etc.
As repeatedly stated in previous studies, one of the pitfalls of culture-based
Legionella detection is the long turnover time for the generation of results (up to ten days) [
2,
4,
7,
9]. In our study, qPCR shows a high NPV for
L. pneumophila sg 1 for samples, independent of their presumed accompanying microbial flora, which indicates a high reliability of qPCR for a possible combined use of qPCR and culture. In an outbreak setting, where detection of
L. pneumophila sg 1 is time-sensitive, qPCR could be done in as little as one day, which in turn could lead to faster public alert and preventive measures could be taken quickly, and the culture could still be performed on positive samples for confirmation and strain isolation, as also suggested in the literature [
2,
4,
9].
With regards to the updated ISO 11731:2017, internal validation of the method in our laboratory showed that Matrix B could lead to significantly lower results in comparison with Matrix A, as the harsh treatments used in Matrix B not only eliminate the accompanying microbial flora, but also low numbers of Legionellae. In addition to the filtered volume of 100 mL required in in most guidelines, we further recommend the additional filtration of 1 mL for Matrix A to assess the competing microbial flora and prevent plate overgrowth, as often the filter of the 100 mL filtration sample could be overgrown. It might also be useful to inspect the plates earlier than the ten days incubation for filter overgrowth prevention, as ISO 8199 Water quality—General requirements and guidance for microbiological examinations by culture defines the upper LOD as 80 CFU per filter, which could be exceeded if there is a high microbial flora present in the sample, and the filter is directly placed onto the GVPC agar after filtration. According to this, inspecting the agar plates earlier on day 2, 5, 7, and 10, could help detect Legionella before the plates are overgrown.
The limitations of our study lie in the low numbers of samples included in the study as well as the low volume filtrated for qPCR, which could have led to more qPCR-negative results. However, this limitation could be easily overcome by implementing the collection of larger (or multiple smaller flasks) volumes into the standard protocols. The strength of the study lies in the use of the different matrices described in the ISO standard to routine water samples and the additional evaluation by qPCR.


 ,
, 


