Short-Term Exposure to Fine Particulate Matter and Hospitalizations for Acute Lower Respiratory Infection in Korean Children: A Time-Series Study in Seven Metropolitan Cities

 ,
,  , ,
, ,
Abstract
1. Introduction
2. Methods
2.1. Number of Daily Children’s ALRI Hospitalization
2.2. PM2.5 Modeling Data
2.3. Air Pollution Monitoring Data and Environmental Variables
2.4. Statistical Analysis
2.5. Two-Pollutant Model
3. Results
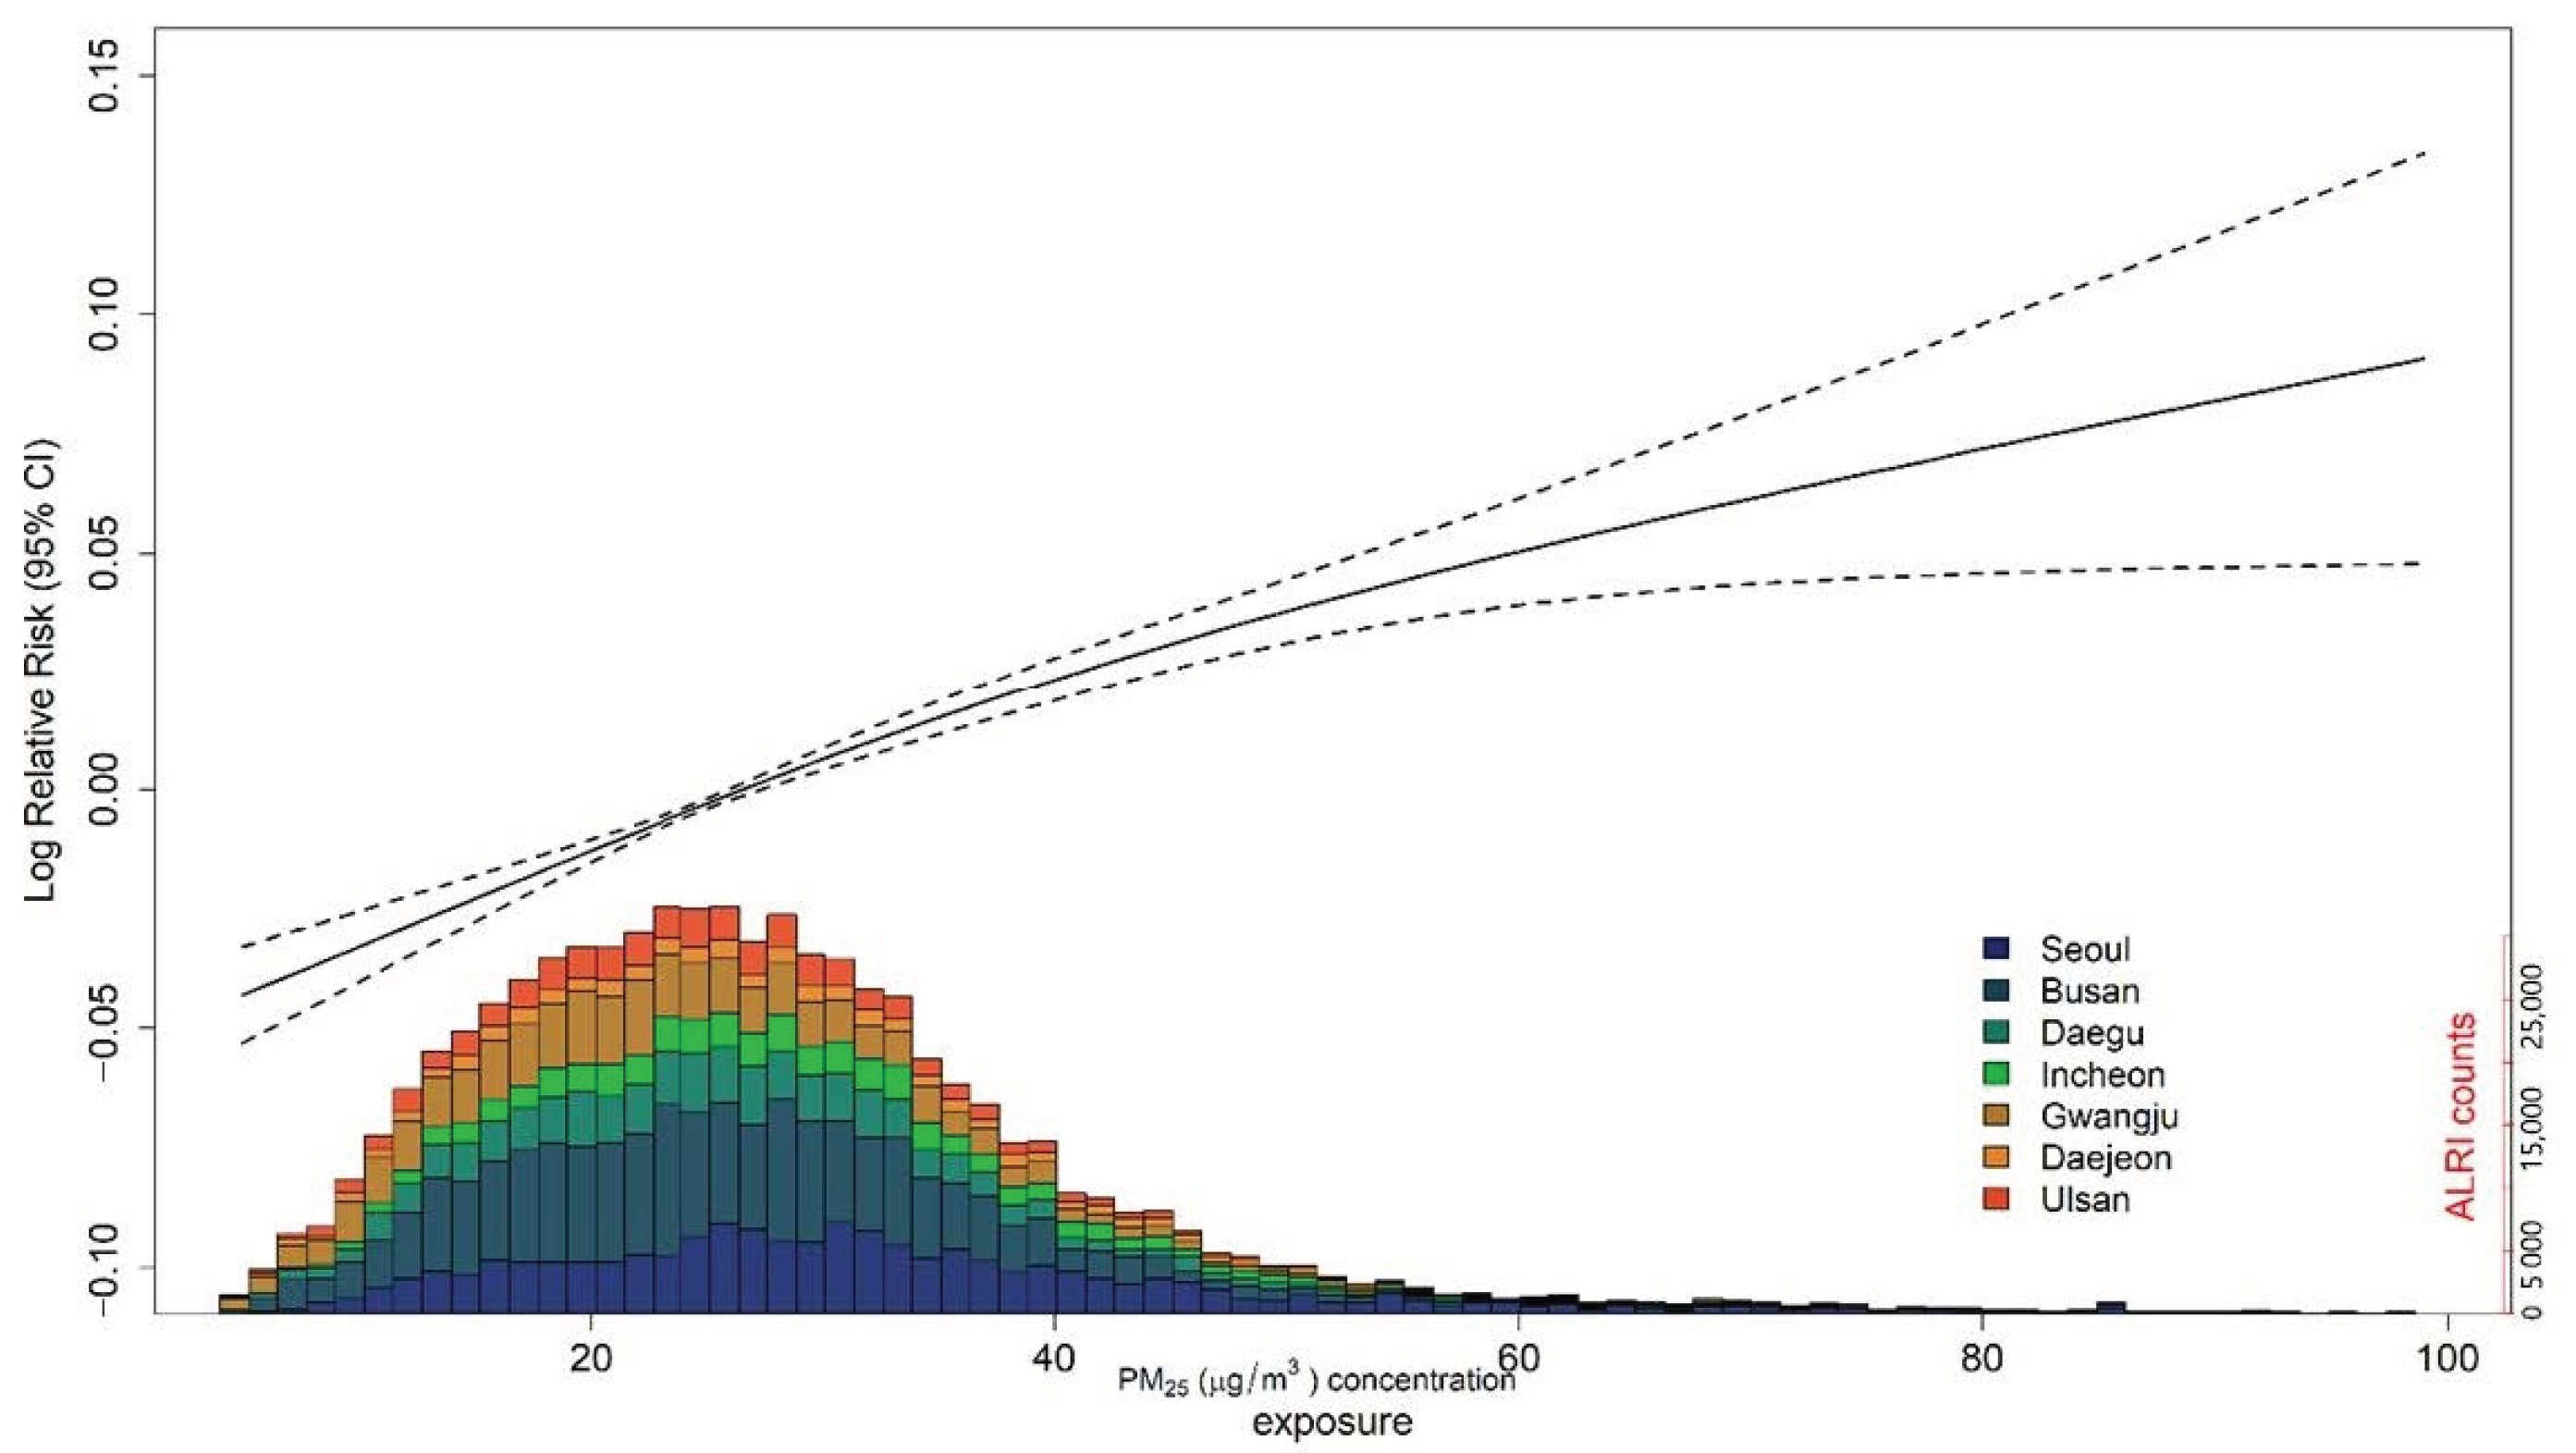
3.1. Main Results
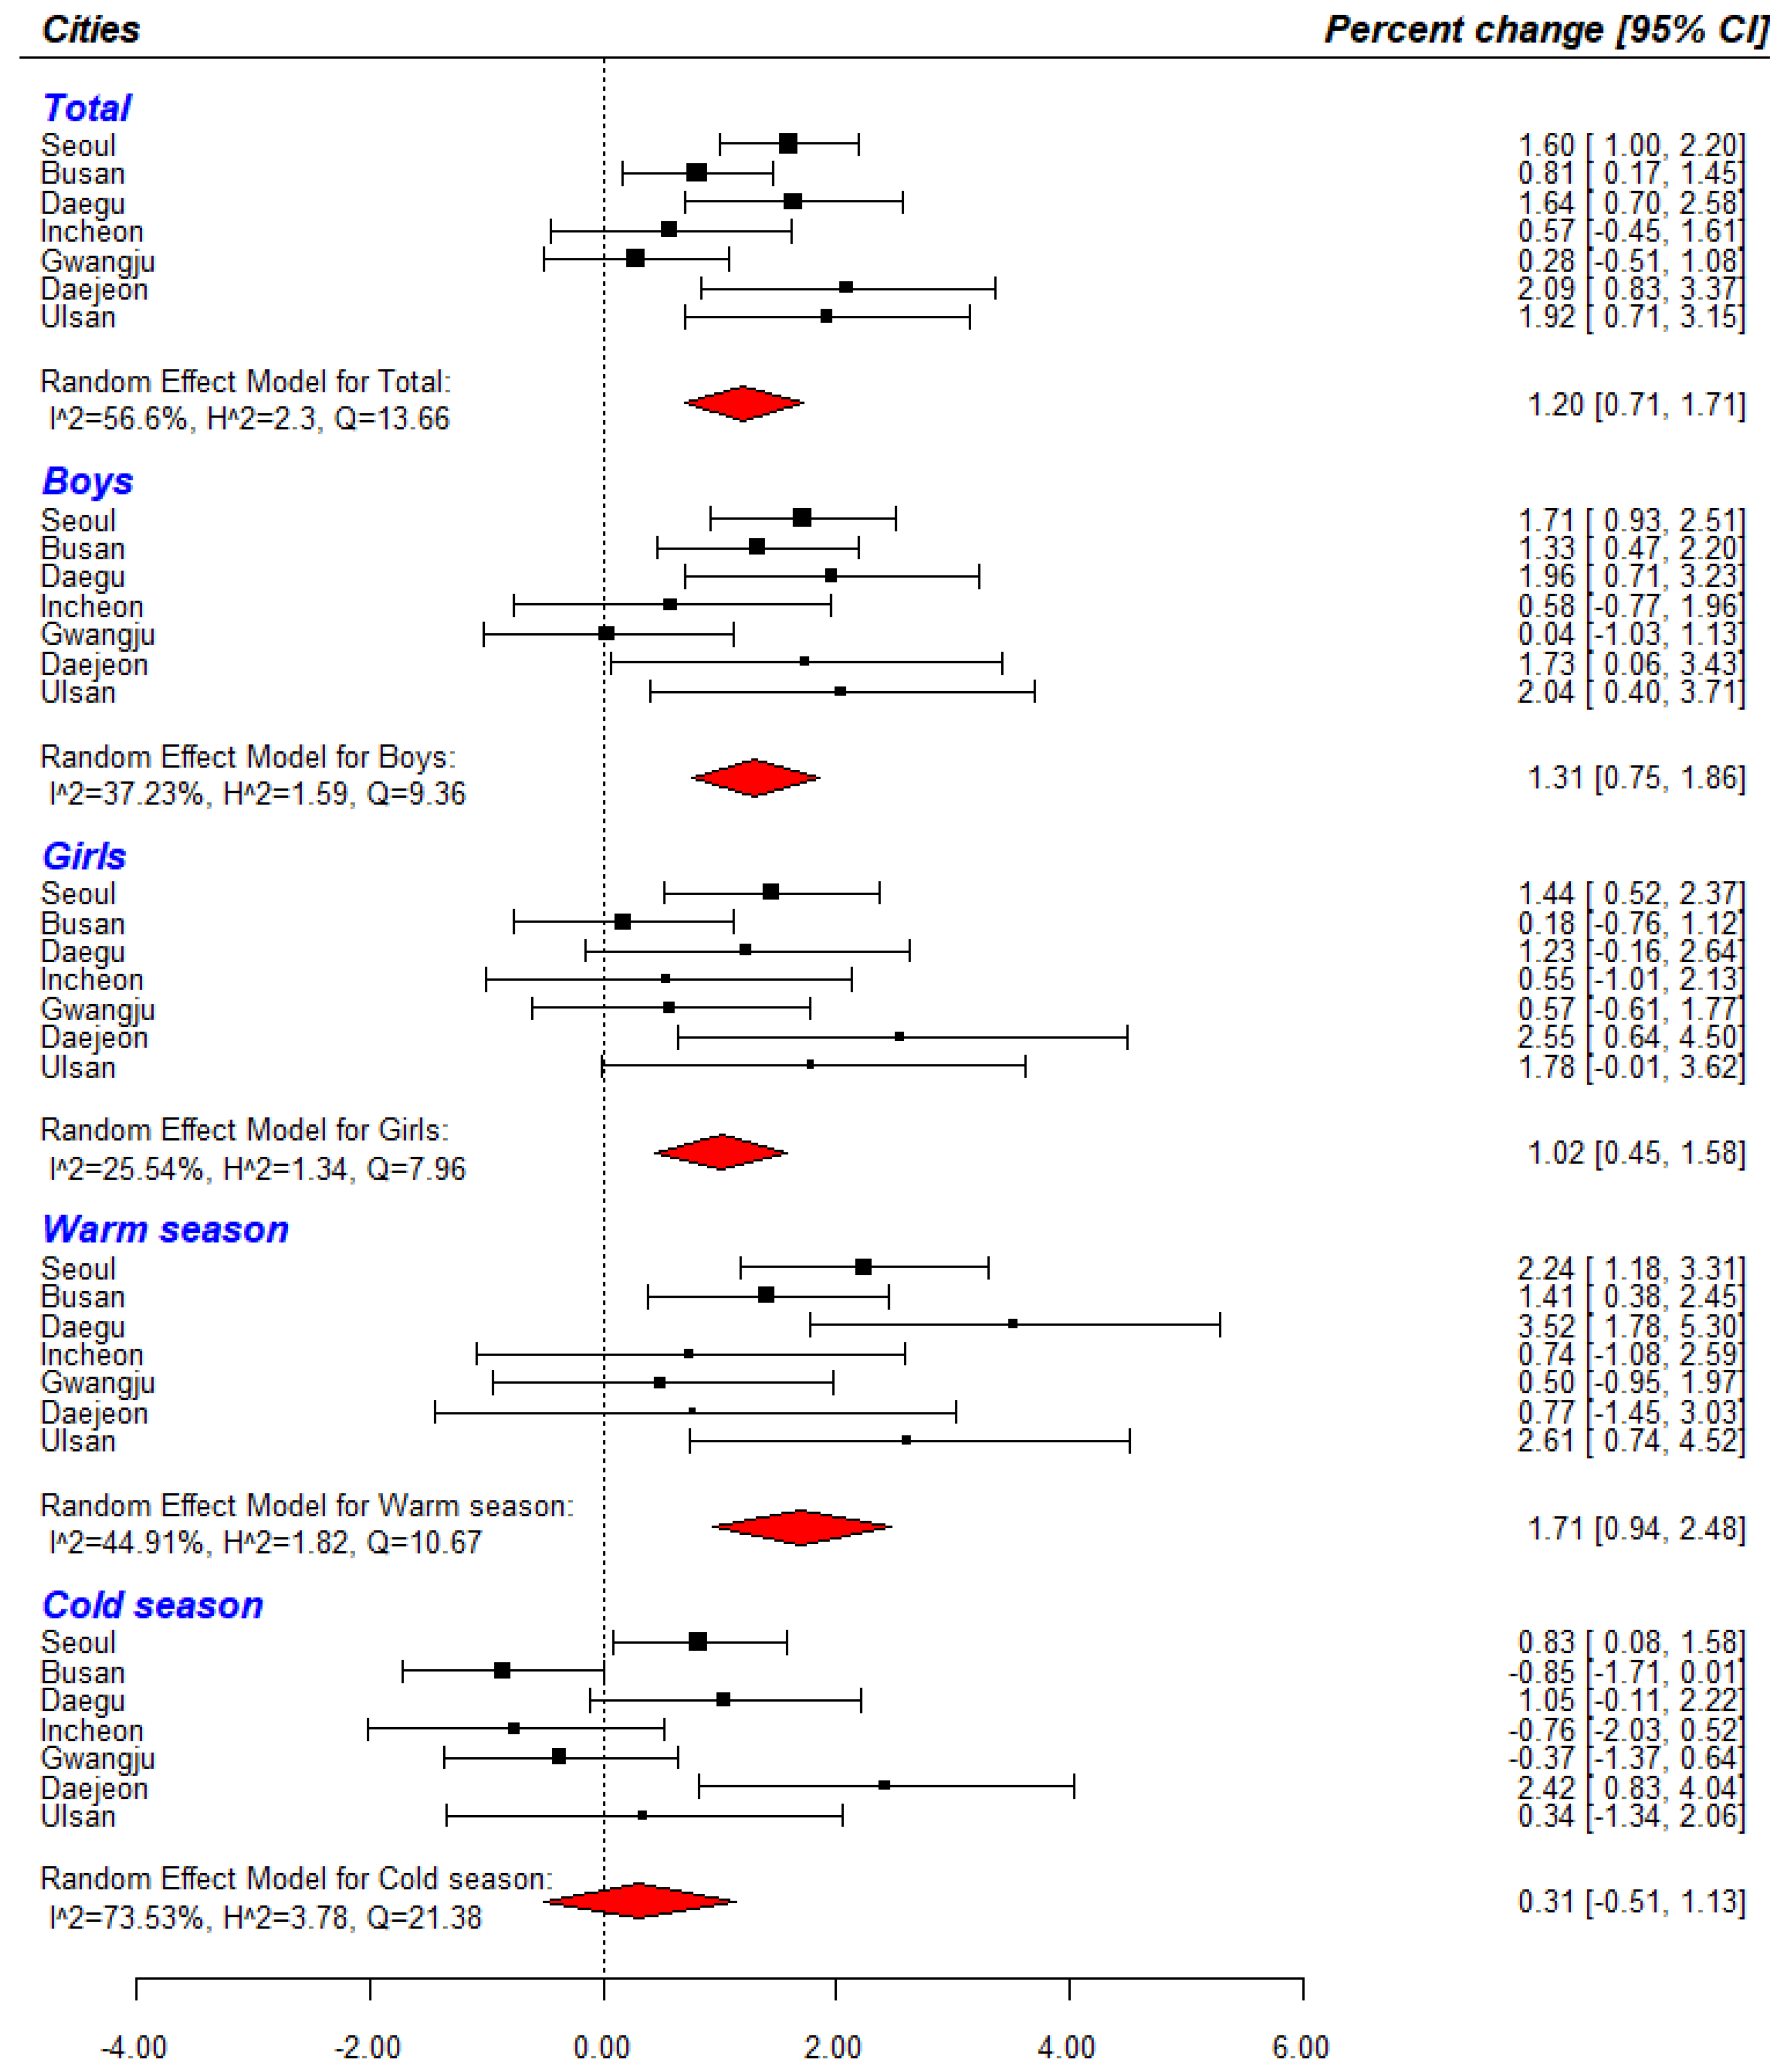
3.2. Subgroup Analysis
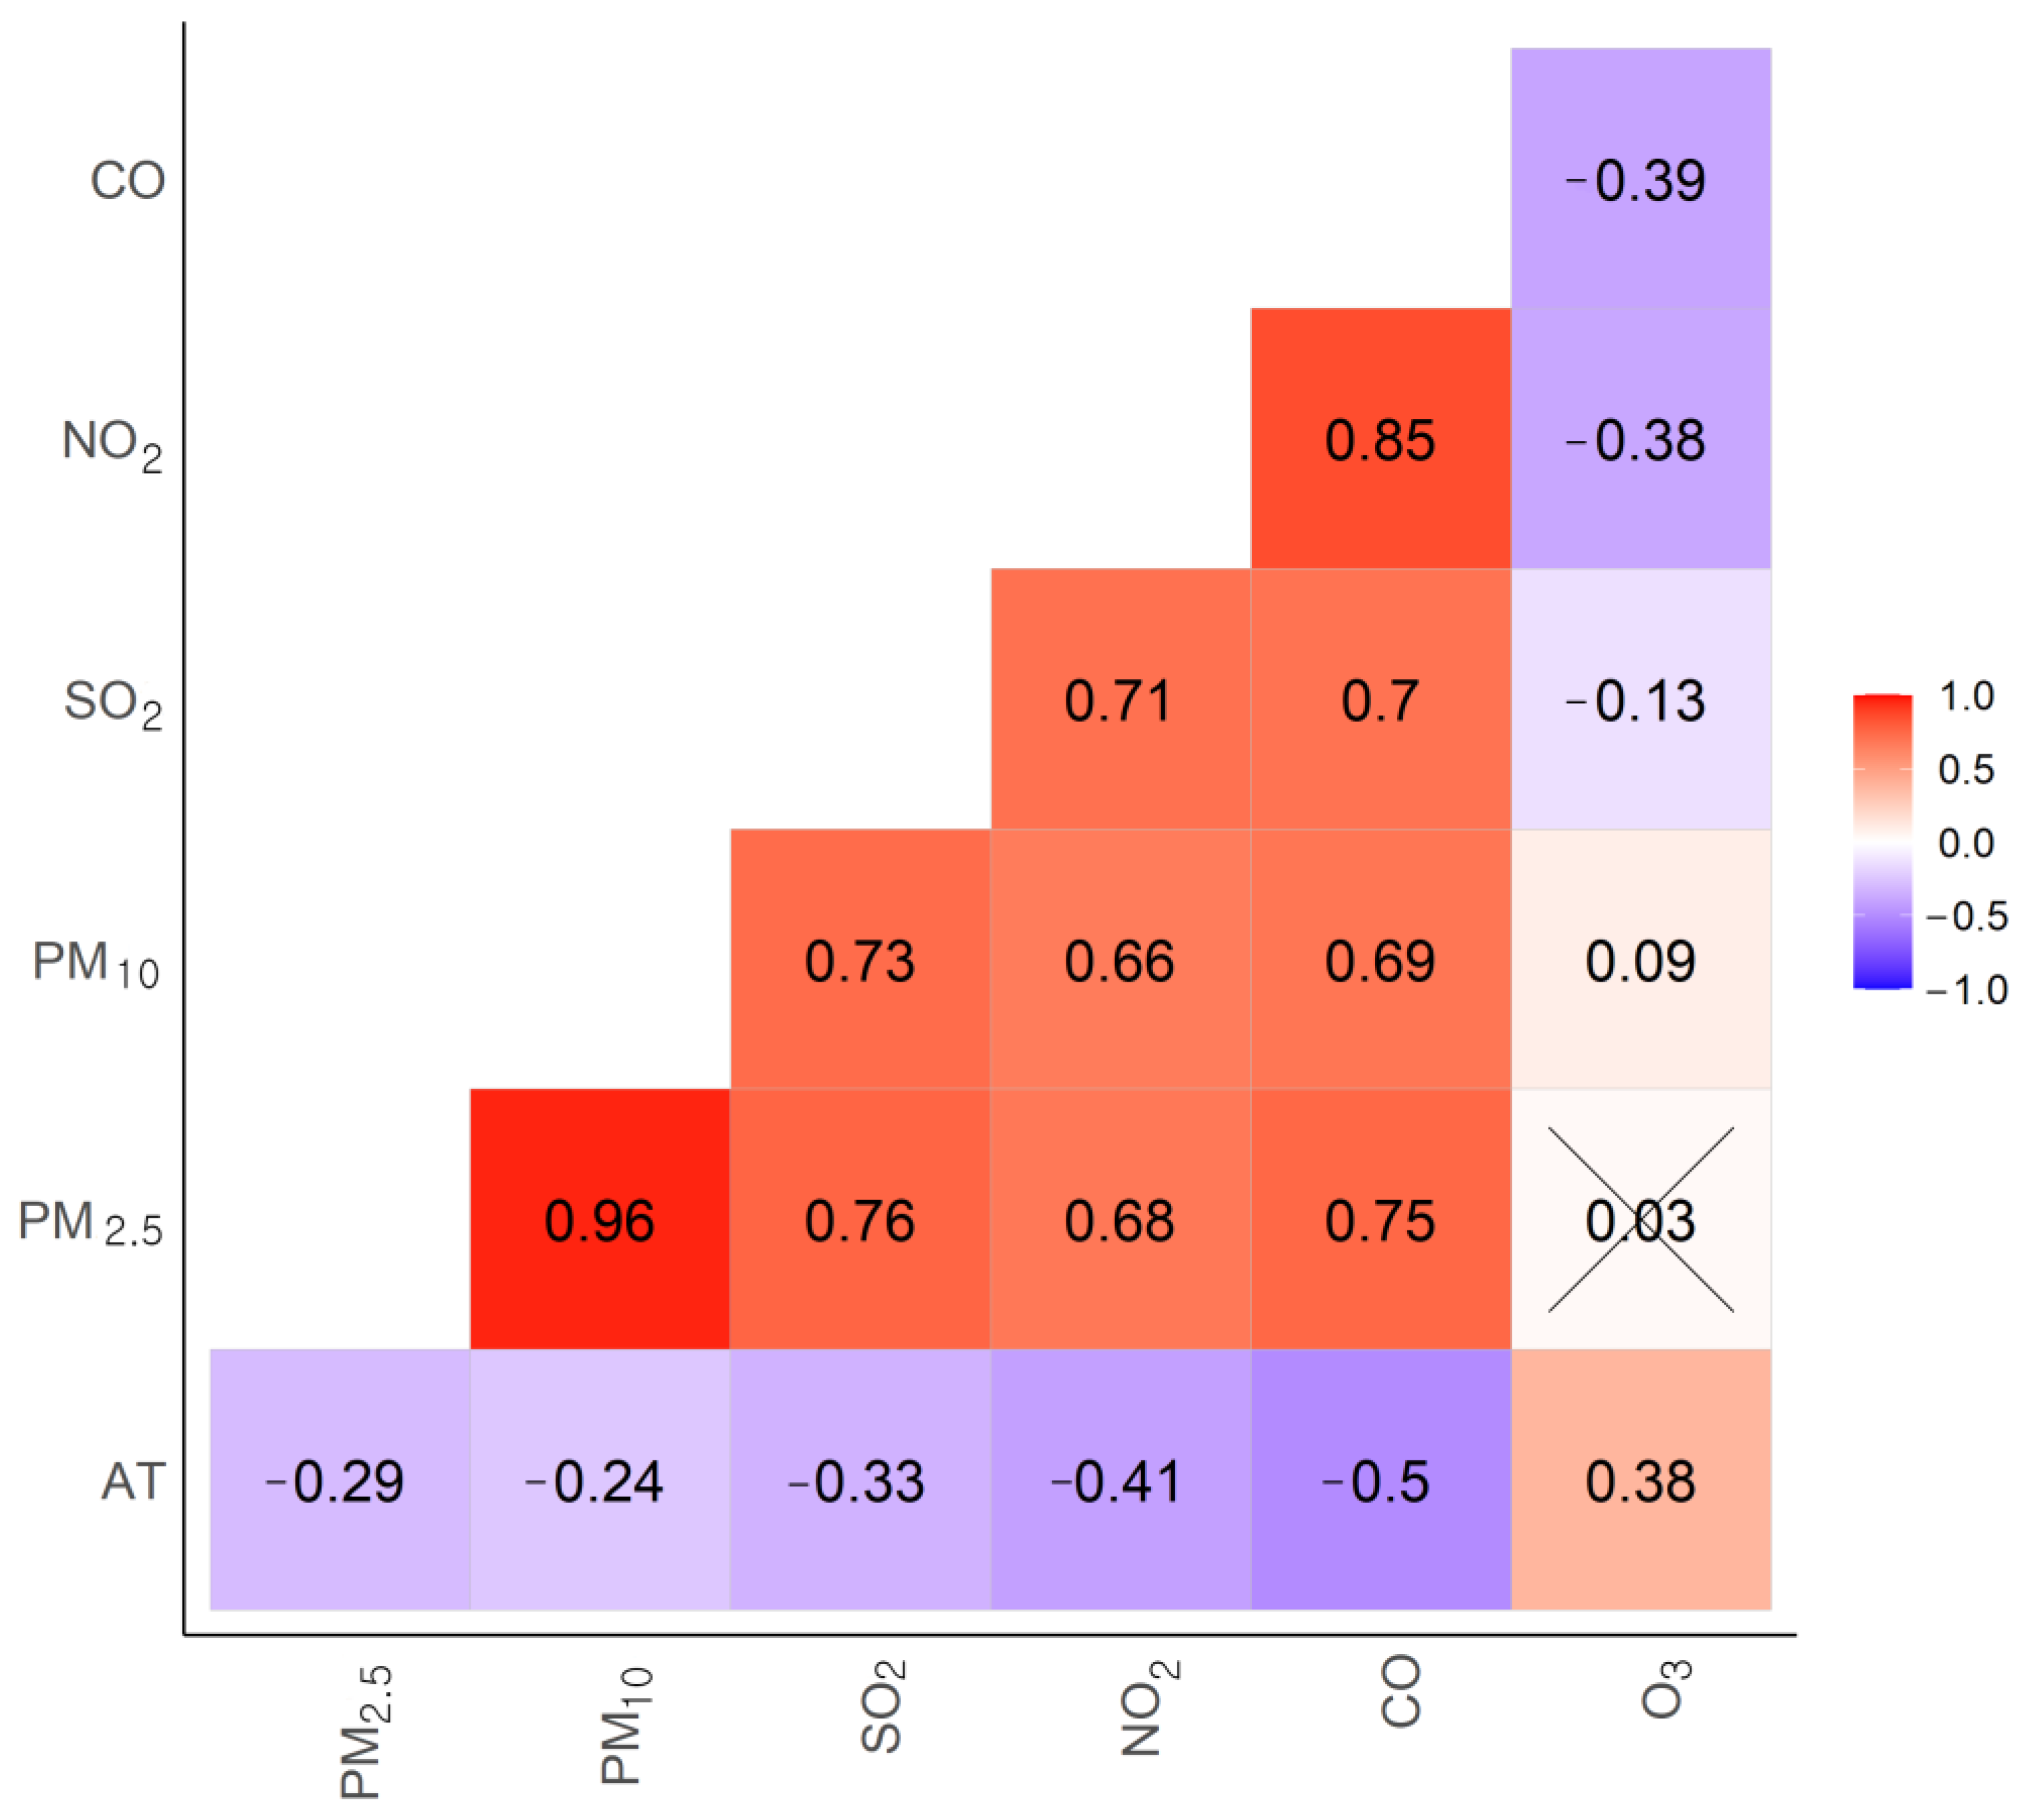
3.3. Two-Pollutants Model
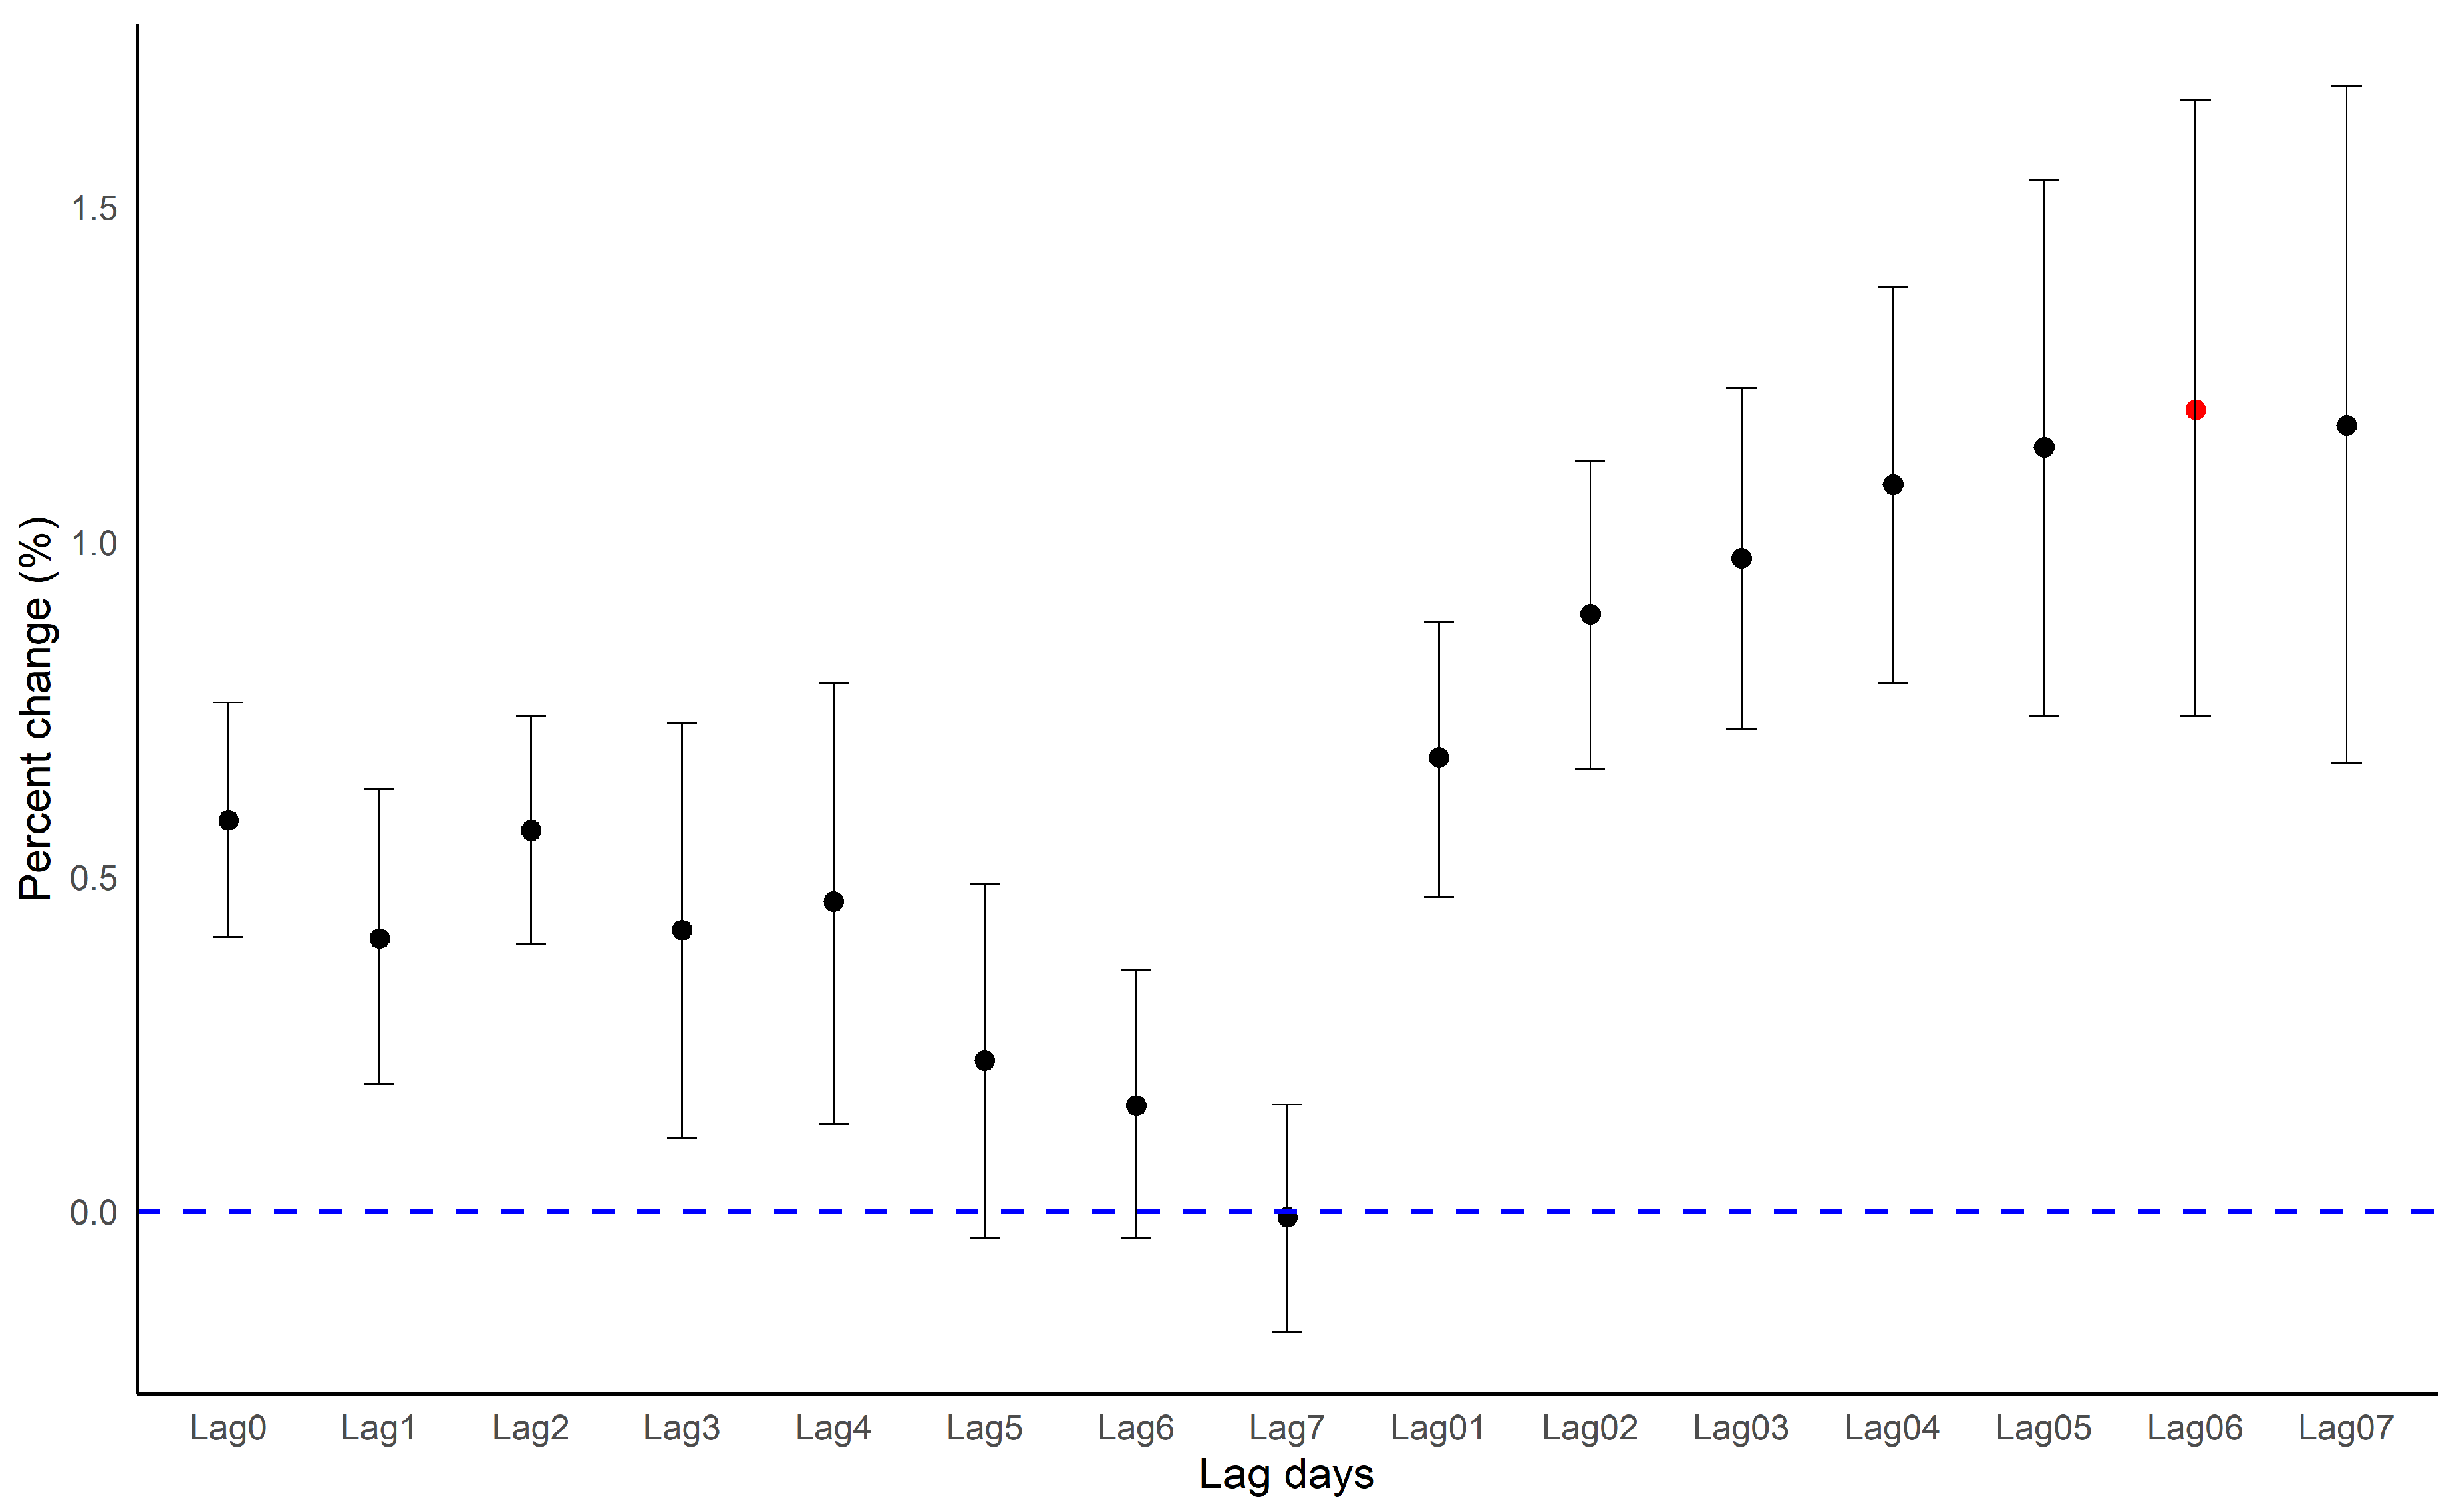
3.4. Sensitivity Analysis
4. Discussion
5. Conclusions
Supplementary Materials
Author Contributions
Funding
Institutional Review Board Statement
Informed Consent Statement
Data Availability Statement
Acknowledgments
Conflicts of Interest
Abbreviations
| PM2.5 | particulate matter with a diameter equal to or less than 2.5 μm |
| ALRI | acute lower respiratory infection |
| GAM | generalized additive model |
| RR | relative risk |
| CI | confidence interval |
References
- Apte, J.S.; Marshall, J.D.; Cohen, A.J.; Brauer, M. Addressing Global Mortality from Ambient PM2.5. Environ. Sci. Technol. 2015, 49, 8057–8066. [Google Scholar] [CrossRef] [PubMed]
- Ostro, B.; Roth, L.; Malig, B.; Marty, M. The effects of fine particle components on respiratory hospital admissions in children. Environ. Health Perspect. 2009, 117, 475–480. [Google Scholar] [CrossRef] [PubMed]
- Koenig, J.Q.; Larson, T.V.; Hanley, Q.S.; Rebolledo, V.; Dumler, K.; Checkoway, H.; Wang, S.Z.; Lin, D.; Pierson, W.E. Pulmonary function changes in children associated with fine particulate matter. Environ. Res. 1993, 63, 26–38. [Google Scholar] [CrossRef] [PubMed]
- Grigg, J. Particulate matter exposure in children: Relevance to chronic obstructive pulmonary disease. Proc. Am. Thorac. Soc. 2009, 6, 564–569. [Google Scholar] [CrossRef] [PubMed]
- Tecer, L.H.; Alagha, O.; Karaca, F.; Tuncel, G.; Eldes, N. Particulate matter (PM(2.5), PM(10-2.5), and PM(10)) and children’s hospital admissions for asthma and respiratory diseases: A bidirectional case-crossover study. J. Toxicol. Environ. Health A 2008, 71, 512–520. [Google Scholar] [CrossRef]
- Guarnieri, M.; Balmes, J.R. Outdoor air pollution and asthma. Lancet 2014, 383, 1581–1592. [Google Scholar] [CrossRef]
- Mehta, S.; Shin, H.; Burnett, R.; North, T.; Cohen, A.J. Ambient particulate air pollution and acute lower respiratory infections: A systematic review and implications for estimating the global burden of disease. Air Qual. Atmos. Health 2013, 6, 69–83. [Google Scholar] [CrossRef]
- Colley, J.R.; Douglas, J.W.; Reid, D.D. Respiratory disease in young adults: Influence of early childhood lower respiratory tract illness, social class, air pollution, and smoking. Br. Med. J. 1973, 3, 195–198. [Google Scholar] [CrossRef]
- Spears, D.; Dey, S.; Chowdhury, S.; Scovronick, N.; Vyas, S.; Apte, J. The association of early-life exposure to ambient PM2.5 and later-childhood height-for-age in India: An observational study. Environ. Health 2019, 18, 62. [Google Scholar] [CrossRef]
- Horne, B.D.; Joy, E.A.; Hofmann, M.G.; Gesteland, P.H.; Cannon, J.B.; Lefler, J.S.; Blagev, D.P.; Korgenski, E.K.; Torosyan, N.; Hansen, G.I.; et al. Short-Term Elevation of Fine Particulate Matter Air Pollution and Acute Lower Respiratory Infection. Am. J. Respir. Crit. Care Med. 2018, 198, 759–766. [Google Scholar] [CrossRef]
- GBD. Estimates of the global, regional, and national morbidity, mortality, and aetiologies of lower respiratory tract infections in 195 countries: A systematic analysis for the Global Burden of Disease Study 2015. Lancet Infect. Dis. 2015, 17, 1133–1161. [Google Scholar] [CrossRef]
- Bruce, N. Indoor air pollution from unprocessed solid fuel use and pneumonia risk in children aged under five years: A systematic review and meta-analysis. Bull. World Health Organ. 2008, 86, 390–398. [Google Scholar] [CrossRef] [PubMed]
- Rahman, I.; MacNee, W. Role of oxidants/antioxidants in smoking-induced lung diseases. Free Radic. Biol. Med. 1996, 21, 669–681. [Google Scholar] [CrossRef]
- Greenwell, L.L.; Moreno, T.; Jones, T.P.; Richards, R.J. Particle-induced oxidative damage is ameliorated by pulmonary antioxidants. Free Radic. Biol. Med. 2002, 32, 898–905. [Google Scholar] [CrossRef]
- Donaldson, K.; Beswick, P.H.; Gilmour, P.S. Free radical activity associated with the surface of particles: A unifying factor in determining biological activity? Toxicol. Lett. 1996, 88, 293–298. [Google Scholar] [CrossRef]
- Zheng, P.W.; Wang, J.B.; Zhang, Z.Y.; Shen, P.; Chai, P.F.; Li, D.; Jin, M.J.; Tang, M.L.; Lu, H.C.; Lin, H.B.; et al. Air pollution and hospital visits for acute upper and lower respiratory infections among children in Ningbo, China: A time-series analysis. Environ. Sci. Pollut. Res. Int. 2017, 24, 18860–18869. [Google Scholar] [CrossRef]
- Darrow, L.A.; Klein, M.; Flanders, W.D.; Mulholland, J.A.; Tolbert, P.E.; Strickland, M.J. Air pollution and acute respiratory infections among children 0-4 years of age: An 18-year time-series study. Am. J. Epidemiol. 2014, 180, 968–977. [Google Scholar] [CrossRef]
- Karr, C.; Lumley, T.; Shepherd, K.; Davis, R.; Larson, T.; Ritz, B.; Kaufman, J. A case-crossover study of wintertime ambient air pollution and infant bronchiolitis. Environ. Health Perspect. 2006, 114, 277–281. [Google Scholar] [CrossRef]
- Health Effects Institute. State of Global Air 2017: A Special Report on Global Exposure to Air Pollution and Its Disease Burden; Health Effect Institute: Boston, MA, USA, 2017. [Google Scholar]
- Park, J.-E.; Lee, S.-Y.; Kang, J.H. Common Disease Codes in Pediatric Inpatients (1997–2008). Korean J. Pediatric Infect. Dis. 2011, 18. [Google Scholar] [CrossRef]
- Kim, K.N.; Kim, S.; Lim, Y.H.; Song, I.G.; Hong, Y.C. Effects of short-term fine particulate matter exposure on acute respiratory infection in children. Int. J. Hyg. Environ. Health 2020, 229, 113571. [Google Scholar] [CrossRef]
- Luong, L.T.M.; Dang, T.N.; Thanh Huong, N.T.; Phung, D.; Tran, L.K.; Van Dung, D.; Thai, P.K. Particulate air pollution in Ho Chi Minh city and risk of hospital admission for acute lower respiratory infection (ALRI) among young children. Environ. Pollut. 2020, 257. [Google Scholar] [CrossRef] [PubMed]
- Seong, S.C.; Kim, Y.Y.; Khang, Y.H.; Heon Park, J.; Kang, H.J.; Lee, H.; Do, C.H.; Song, J.S.; Hyon Bang, J.; Ha, S.; et al. Data Resource Profile: The National Health Information Database of the National Health Insurance Service in South Korea. Int. J. Epidemiol. 2017, 46, 799–800. [Google Scholar] [CrossRef]
- Oh, J.; Lee, S.; Kim, M.H.; Kwag, Y.; Kim, H.S.; Kim, S.; Ye, S.; Ha, E. The impact of PM2.5 on acute otitis media in children (aged 0–3): A time series study. Environ. Int. 2020, 145, 106133. [Google Scholar] [CrossRef] [PubMed]
- Han, C.; Kim, S.; Lim, Y.H.; Bae, H.J.; Hong, Y.C. Spatial and Temporal Trends of Number of Deaths Attributable to Ambient PM2.5 in the Korea. J. Korean Med Sci. 2018, 33, e193. [Google Scholar] [CrossRef]
- Tolbert, P.E.; Klein, M.; Peel, J.L.; Sarnat, S.E.; Sarnat, J.A. Multipollutant modeling issues in a study of ambient air quality and emergency department visits in Atlanta. J. Expo. Sci. Environ. Epidemiol. 2007, 17, S29–S35. [Google Scholar] [CrossRef]
- Seo, J.; Kim, J.Y.; Youn, D.; Lee, J.Y.; Kim, H.; Lim, Y.B.; Kim, Y.; Jin, H.C. On the multiday haze in the Asian continental outflow: The important role of synoptic conditions combined with regional and local sources. Atmos. Chem. Phys. 2017, 17, 9311–9332. [Google Scholar] [CrossRef]
- Zanobetti, A.; Schwartz, J. Temperature and Mortality in Nine US Cities. Epidemiology 2008, 19, 563–570. [Google Scholar] [CrossRef]
- Nguyen, J.L.; Schwartz, J.; Dockery, D.W. The relationship between indoor and outdoor temperature, apparent temperature, relative humidity, and absolute humidity. Indoor Air 2014, 24, 103–112. [Google Scholar] [CrossRef]
- Bhaskaran, K.; Gasparrini, A.; Hajat, S.; Smeeth, L.; Armstrong, B. Time series regression studies in environmental epidemiology. Int. J. Epidemiol. 2013, 42, 1187–1195. [Google Scholar] [CrossRef]
- Alessandrini, E.; Sajani, S.Z.; Scotto, F.; Miglio, R.; Marchesi, S.; Lauriola, P. Emergency ambulance dispatches and apparent temperature: A time series analysis in Emilia-Romagna, Italy. Environ. Res. 2011, 111, 1192–1200. [Google Scholar] [CrossRef]
- Rucker, G.; Schwarzer, G.; Carpenter, J.R.; Schumacher, M. Undue reliance on I(2) in assessing heterogeneity may mislead. BMC Med. Res. Methodol. 2008, 8, 79. [Google Scholar] [CrossRef] [PubMed]
- Borenstein, M.; Hedges, L.V.; Higgins, J.P.; Rothstein, H.R. A basic introduction to fixed-effect and random-effects models for meta-analysis. Res. Synth. Methods 2010, 1, 97–111. [Google Scholar] [CrossRef] [PubMed]
- Melsen, W.G.; Bootsma, M.C.; Rovers, M.M.; Bonten, M.J. The effects of clinical and statistical heterogeneity on the predictive values of results from meta-analyses. Clin. Microbiol. Infect. 2014, 20, 123–129. [Google Scholar] [CrossRef] [PubMed]
- Dwivedi, S.N. Which is the Preferred Measure of Heterogeneity in Meta-Analysis and Why? A Revisit. Biostat. Biom. Open Access J. 2017, 1. [Google Scholar] [CrossRef]
- Kulinskaya, E.; Dollinger, M.B. An accurate test for homogeneity of odds ratios based on Cochran’s Q-statistic. BMC Med. Res. Methodol. 2015, 15, 49. [Google Scholar] [CrossRef]
- Ito, K.; Thurston, G.D.; Silverman, R.A. Characterization of PM2.5, gaseous pollutants, and meteorological interactions in the context of time-series health effects models. J. Expo. Sci. Environ. Epidemiol. 2007, 17, S45–S60. [Google Scholar] [CrossRef]
- Vatcheva, K.P.; Lee, M.; McCormick, J.B.; Rahbar, M.H. Multicollinearity in Regression Analyses Conducted in Epidemiologic Studies. Epidemiology (Sunnyvale) 2016, 6. [Google Scholar] [CrossRef]
- Braga, A.L.; Saldiva, P.H.; Pereira, L.A.; Menezes, J.J.; Conceicao, G.M.; Lin, C.A.; Zanobetti, A.; Schwartz, J.; Dockery, D.W. Health effects of air pollution exposure on children and adolescents in Sao Paulo, Brazil. Pediatr. Pulmonol. 2001, 31, 106–113. [Google Scholar] [CrossRef]
- Segala, C.; Poizeau, D.; Mesbah, M.; Willems, S.; Maidenberg, M. Winter air pollution and infant bronchiolitis in Paris. Environ. Res. 2008, 106, 96–100. [Google Scholar] [CrossRef]
- Barnett, A.G.; Williams, G.M.; Schwartz, J.; Neller, A.H.; Best, T.L.; Petroeschevsky, A.L.; Simpson, R.W. Air pollution and child respiratory health: A case-crossover study in Australia and New Zealand. Am. J. Respir. Crit. Care Med. 2005, 171, 1272–1278. [Google Scholar] [CrossRef]
- Ismail, S.N.S.; Abdul Rahman, S.R.; Sahani, M.; Firuz, R.; Latif, M.T. A case crossover analysis of primary air pollutants association on acute respiratory infection (ARI) among children in urban region of Klang valley, Malaysia. Ann. Trop. Med. Public Health 2017, 10. [Google Scholar] [CrossRef]
- Ha, E.H.; Lee, J.T.; Kim, H.; Hong, Y.C.; Lee, B.E.; Park, H.S.; Christiani, D.C. Infant Susceptibility of Mortality to Air Pollution in Seoul, South Korea. Pediatrics 2003, 111, 284–290. [Google Scholar] [CrossRef] [PubMed]
- Nhung, N.T.T.; Schindler, C.; Dien, T.M.; Probst-Hensch, N.; Perez, L.; Kunzli, N. Acute effects of ambient air pollution on lower respiratory infections in Hanoi children: An eight-year time series study. Environ. Int. 2018, 110, 139–148. [Google Scholar] [CrossRef] [PubMed]
- Gordon, C.J. Role of environmental stress in the physiological response to chemical toxicants. Environ. Res. 2003, 92, 1–7. [Google Scholar] [CrossRef]
- Kalkstein, L.S.; Greene, J.S. An evaluation of climate/mortality relationships in large U.S. cities and the possible impacts of a climate change. Environ. Health Perspect. 1997, 105, 84–93. [Google Scholar] [CrossRef]
- Gold, D.R.; Litonjua, A.; Schwartz, J.; Lovett, E.; Larson, A.; Nearing, B.; Allen, G.; Verrier, M.; Cherry, R.; Verrier, R. Ambient Pollution and Heart Rate Variability. Circulation 2000, 101, 1267–1273. [Google Scholar] [CrossRef]
- Creason, J.; Neas, L.; Walsh, D.; Williams, R.O.N.; Sheldon, L.; Liao, D.; Shy, C. Particulate matter and heart rate variability among elderly retirees: The Baltimore 1998 PM study. J. Expo. Sci. Environ. Epidemiol. 2001, 11, 116–122. [Google Scholar] [CrossRef]
- Ren, C.; O’Neill, M.S.; Park, S.K.; Sparrow, D.; Vokonas, P.; Schwartz, J. Ambient Temperature, Air Pollution, and Heart Rate Variability in an Aging Population. Am. J. Epidemiol. 2011, 173, 1013–1021. [Google Scholar] [CrossRef]
- Ren, C.; Tong, S. Temperature modifies the health effects of particulate matter in Brisbane, Australia. Int. J. Biometeorol. 2006, 51, 87–96. [Google Scholar] [CrossRef]
- Kenney, M.J.; Ganta, C.K. Autonomic Nervous System and Immune System Interactions. Compr Physiol 2014, 4, 1177–1200. [Google Scholar]
- Gouveia, N.; Fletcher, T. Time series analysis of air pollution and mortality: Effects by cause, age and socioeconomic status. J. Epidemiol. Community Health 2000, 54, 750–755. [Google Scholar] [CrossRef] [PubMed]
- Cox, L.A.T.; Liu, X.; Shi, L.; Zu, K.; Goodman, J. Applying Nonparametric Methods to Analyses of Short-Term Fine Particulate Matter Exposure and Hospital Admissions for Cardiovascular Diseases among Older Adults. Int. J. Environ. Res. Public Health 2017, 14, 1051. [Google Scholar] [CrossRef] [PubMed]
- Cesari, D.; De Benedetto, G.E.; Bonasoni, P.; Busetto, M.; Dinoi, A.; Merico, E.; Chirizzi, D.; Cristofanelli, P.; Donateo, A.; Grasso, F.M.; et al. Seasonal variability of PM2.5 and PM10 composition and sources in an urban background site in Southern Italy. Sci. Total Environ. 2018, 612, 202–213. [Google Scholar] [CrossRef] [PubMed]
- Chen, R.; Cheng, J.; Lv, J.; Wu, L.; Wu, J. Comparison of chemical compositions in air particulate matter during summer and winter in Beijing, China. Environ. Geochem. Health 2016, 39, 913–921. [Google Scholar] [CrossRef] [PubMed]
- Park, J.; Park, E.H.; Schauer, J.J.; Yi, S.-M.; Heo, J. Reactive oxygen species (ROS) activity of ambient fine particles (PM2.5) measured in Seoul, Korea. Environ. Int. 2018, 117, 276–283. [Google Scholar] [CrossRef] [PubMed]
- Li, J.; Woodward, A.; Hou, X.Y.; Zhu, T.; Zhang, J.L.; Brown, H.; Yang, J.; Qin, R.N.; Gao, J.H.; Gu, S.H.; et al. Modification of the effects of air pollutants on mortality by temperature: A systematic review and meta-analysis. Sci. Total Environ. 2017, 575, 1556–1570. [Google Scholar] [CrossRef] [PubMed]
- Lepeule, J.; Litonjua, A.A.; Gasparrinie, A.; Koutrakis, P.; Sparrows, D.; Vokonas, P.S.; Schwartz, J. Lung function association with outdoor temperature and relative humidity and its interaction with air pollution in the elderly. Environ. Res. 2018, 165, 110–117. [Google Scholar] [CrossRef]
- Zhu, L.; Ge, X.; Chen, Y.; Zeng, X.; Pan, W.; Zhang, X.; Ben, S.; Yuan, Q.; Xin, J.; Shao, W.; et al. Short-term effects of ambient air pollution and childhood lower respiratory diseases. Sci. Rep. 2017, 7, 4414. [Google Scholar] [CrossRef]
- Lodovici, M.; Bigagli, E. Oxidative Stress and Air Pollution Exposure. J. Toxicol. 2011, 2011, 1–9. [Google Scholar] [CrossRef]
- Sigaud, S.; Goldsmith, C.A.; Zhou, H.; Yang, Z.; Fedulov, A.; Imrich, A.; Kobzik, L. Air pollution particles diminish bacterial clearance in the primed lungs of mice. Toxicol. Appl. Pharmacol. 2007, 223, 1–9. [Google Scholar] [CrossRef]
- Miyata, R.; van Eeden, S.F. The innate and adaptive immune response induced by alveolar macrophages exposed to ambient particulate matter. Toxicol. Appl. Pharmacol. 2011, 257, 209–226. [Google Scholar] [CrossRef] [PubMed]
- Jalava, P.I.; Salonen, R.O.; Pennanen, A.S.; Sillanpaa, M.; Halinen, A.I.; Happo, M.S.; Hillamo, R.; Brunekreef, B.; Katsouyanni, K.; Sunyer, J.; et al. Heterogeneities in inflammatory and cytotoxic responses of RAW 264.7 macrophage cell line to urban air coarse, fine, and ultrafine particles from six European sampling campaigns. Inhal. Toxicol. 2007, 19, 213–225. [Google Scholar] [CrossRef] [PubMed]
- Bae, M.; Kim, B.-U.; Kim, H.C.; Kim, S. A Multiscale Tiered Approach to Quantify Contributions: A Case Study of PM2.5 in South Korea during 2010–2017. Atmosphere 2020, 11, 141. [Google Scholar] [CrossRef]
- Kim, J.-H.; Choi, D.-R.; Koo, Y.-S.; Lee, J.-B.; Park, H.-J. Analysis of Domestic and Foreign Contributions using DDM in CMAQ during Particulate Matter Episode Period of February 2014 in Seoul. J. Korean Soc. Atmos. Environ. 2016, 32, 82–99. [Google Scholar] [CrossRef]
- VanderWeele, T.J.; Arah, O.A. Bias Formulas for Sensitivity Analysis of Unmeasured Confounding for General Outcomes, Treatments, and Confounders. Epidemiology 2011, 22, 42–52. [Google Scholar] [CrossRef]
- Peng, R.D.; Dominici, F. Statistical Methods for Environmental Epidemiology with R: A Case Study in Air Pollution and Health; Springer: Berlin/Heidelberg, Germany, 2008. [Google Scholar]


| Category | Total | Seoul | Busan | Daegu | Incheon | Gwangju | Daejeon | Ulsan |
|---|---|---|---|---|---|---|---|---|
| Sex | ||||||||
| Boys | 397,333 | 19,855 | 85,099 | 116,538 | 61,456 | 34,358 | 49,815 | 30,212 |
| Girls | 316,255 | 15,059 | 62,126 | 96,798 | 50,740 | 26,248 | 40,514 | 24,740 |
| Seasons | ||||||||
| Warm | 334,766 | 66,075 | 102,548 | 41,269 | 29,095 | 52,887 | 16,566 | 26,326 |
| Cold | 378,822 | 81,150 | 110,788 | 49,060 | 31,511 | 59,309 | 18,378 | 28,626 |
| Total | 713,588 | 147,225 | 213,336 | 90,329 | 60,606 | 112,196 | 34,944 | 54,952 |
| Category | Total | Season | Cities | |||||||
|---|---|---|---|---|---|---|---|---|---|---|
| Warm | Cold | Seoul | Busan | Daegu | Incheon | Gwangju | Daejeon | Ulsan | ||
| PM2.5 (μg/m3) | 29.0 (7.6) | 24.2 (13.4) | 30.1 (17.2) | 30.6 (8.3) | 25.3 (6.1) | 26.4 (6.9) | 29.1 (8.3) | 24.8 (7.9) | 28.6 (9.2) | 25.6 (6.2) |
| PM10 (μg/m3) | 46.9 (23.7) | 43.1 (23.9) | 50.6 (28.5) | 47.7 (29.4) | 47.3 (24.0) | 47.0 (25.7) | 52.6 (28.9) | 43.0 (26.7) | 43.1 (24.8) | 47.4 (24.9) |
| SO2 (ppm) | 0.005 (0.002) | 0.005 (0.003) | 0.006 (0.002) | 0.005 (0.002) | 0.006 (0.002) | 0.004 (0.002) | 0.007 (0.002) | 0.004 (0.001) | 0.004 (0.002) | 0.008 (0.003) |
| NO2 (ppm) | 0.024 (0.009) | 0.021 (0.009) | 0.028 (0.011) | 0.033 (0.012) | 0.021 (0.007) | 0.023 (0.011) | 0.028 (0.012) | 0.020 (0.008) | 0.021 (0.009) | 0.023 (0.008) |
| CO (ppm) | 0.500 (0.163) | 0.419 (0.114) | 0.581 (0.221) | 0.544 (0.210) | 0.398 (0.108) | 0.481 (0.202) | 0.588 (0.218) | 0.501 (0.180) | 0.492 (0.212) | 0.494 (0.141) |
| O3 (ppm) | 0.025 (0.010) | 0.031 (0.011) | 0.019 (0.009) | 0.021 (0.011) | 0.028 (0.010) | 0.025 (0.012) | 0.024 (0.011) | 0.027 (0.012) | 0.024 (0.013) | 0.026 (0.010) |
| Mean apparent temperature (°C) | 13.9 (11.5) | 22.8 (7.7) | 4.9 (6.8) | 12.7 (11.9) | 15.2 (10.2) | 14.5 (11.2) | 12.7 (12.2) | 14.3 (11.9) | 13.1 (12.2) | 14.5 (10.7) |
| Mean temperature (°C) | 13.9 (9.7) | 21.4 (5.2) | 6.3 (6.9) | 12.8 (10.8) | 15.1 (8.3) | 14.7 (9.7) | 12.6 (10.1) | 14.4 (9.6) | 13.2 (10.2) | 14.4 (8.8) |
| Mean relative humidity (%) | 64.6 (16.7) | 69.7 (15.3) | 59.5 (16.4) | 60.2 (14.9) | 62.4 (18.3) | 57.8 (16.9) | 71.7 (16.2) | 67.5 (13.7) | 67.8 (14.4) | 64.9 (17.6) |
| Mean dew point (°C) | 6.5 (11.6) | 14.9 (7.3) | −1.9 (8.7) | 4.5 (12.1) | 7.2 (11.6) | 5.3 (11.8) | 7.1 (11.8) | 7.7 (10.7) | 6.6 (11.4) | 7.1 (11.6) |
| Cities | Single Pollutant (95% C.I) | Two-Pollutant (95% C.I) | ||
|---|---|---|---|---|
| PM2.5 | PM2.5 + SO2 | PM2.5 + NO2 | PM2.5 + O3 | |
| Seoul | 1.60 (1.00, 2.20) | 1.58 (0.80, 2.37) | 1.84 (1.09, 2.60) | 1.56 (0.96, 2.16) |
| Busan | 0.81 (0.17, 1.45) | −0.96 (−1.71, −0.19) | 0.31 (−0.48, 1.10) | 0.94 (0.28, 1.60) |
| Daegu | 1.64 (0.70, 2.58) | 1.60 (0.45, 2.77) | 1.15 (0.00. 2.32) | 1.55 (0.60, 2.50) |
| Incheon | 0.57 (−0.45, 1.61) | −0.98 (−2.26. 0.32) | 0.62 (−0.61, 1.87) | 0.45 (−0.59, 1.50) |
| Gwangju | 0.28 (−0.51, 1.08) | −0.09 (−1.04, 0.86) | 0.14 (−0.79, 1.08) | −0.01 (−0.84, 0.83) |
| Daejeon | 2.09 (0.83, 3.37) | 2.70 (1.09, 4.34) | 3.01 (1.55, 4.49) | 1.74 (0.44, 3.05) |
| Ulsan | 1.92 (0.71, 3.15) | 1.45 (0.00, 2.92) | 1.40 (−0.16, 2.99) | 1.91 (0.66, 3.17) |
| Total | 1.20 (0.71, 1.71) | 0.69 (−0.34, 1.74) | 1.14 (0.43, 1.85) | 1.11 (0.60, 1.64) |
Publisher’s Note: MDPI stays neutral with regard to jurisdictional claims in published maps and institutional affiliations. |
© 2020 by the authors. Licensee MDPI, Basel, Switzerland. This article is an open access article distributed under the terms and conditions of the Creative Commons Attribution (CC BY) license (http://creativecommons.org/licenses/by/4.0/).
Share and Cite
Oh, J.; Han, C.; Lee, D.-W.; Jang, Y.; Choi, Y.-J.; Bae, H.J.; Kim, S.; Ha, E.; Hong, Y.-C.; Lim, Y.-H. Short-Term Exposure to Fine Particulate Matter and Hospitalizations for Acute Lower Respiratory Infection in Korean Children: A Time-Series Study in Seven Metropolitan Cities. Int. J. Environ. Res. Public Health 2021, 18, 144. https://doi.org/10.3390/ijerph18010144
Oh J, Han C, Lee D-W, Jang Y, Choi Y-J, Bae HJ, Kim S, Ha E, Hong Y-C, Lim Y-H. Short-Term Exposure to Fine Particulate Matter and Hospitalizations for Acute Lower Respiratory Infection in Korean Children: A Time-Series Study in Seven Metropolitan Cities. International Journal of Environmental Research and Public Health. 2021; 18(1):144. https://doi.org/10.3390/ijerph18010144
Chicago/Turabian StyleOh, Jongmin, Changwoo Han, Dong-Wook Lee, Yoonyoung Jang, Yoon-Jung Choi, Hyun Joo Bae, Soontae Kim, Eunhee Ha, Yun-Chul Hong, and Youn-Hee Lim. 2021. "Short-Term Exposure to Fine Particulate Matter and Hospitalizations for Acute Lower Respiratory Infection in Korean Children: A Time-Series Study in Seven Metropolitan Cities" International Journal of Environmental Research and Public Health 18, no. 1: 144. https://doi.org/10.3390/ijerph18010144
APA StyleOh, J., Han, C., Lee, D.-W., Jang, Y., Choi, Y.-J., Bae, H. J., Kim, S., Ha, E., Hong, Y.-C., & Lim, Y.-H. (2021). Short-Term Exposure to Fine Particulate Matter and Hospitalizations for Acute Lower Respiratory Infection in Korean Children: A Time-Series Study in Seven Metropolitan Cities. International Journal of Environmental Research and Public Health, 18(1), 144. https://doi.org/10.3390/ijerph18010144