Bayesian Network-Based Risk Assessment of Single-Phase Grounding Accidents of Power Transmission Lines

Abstract
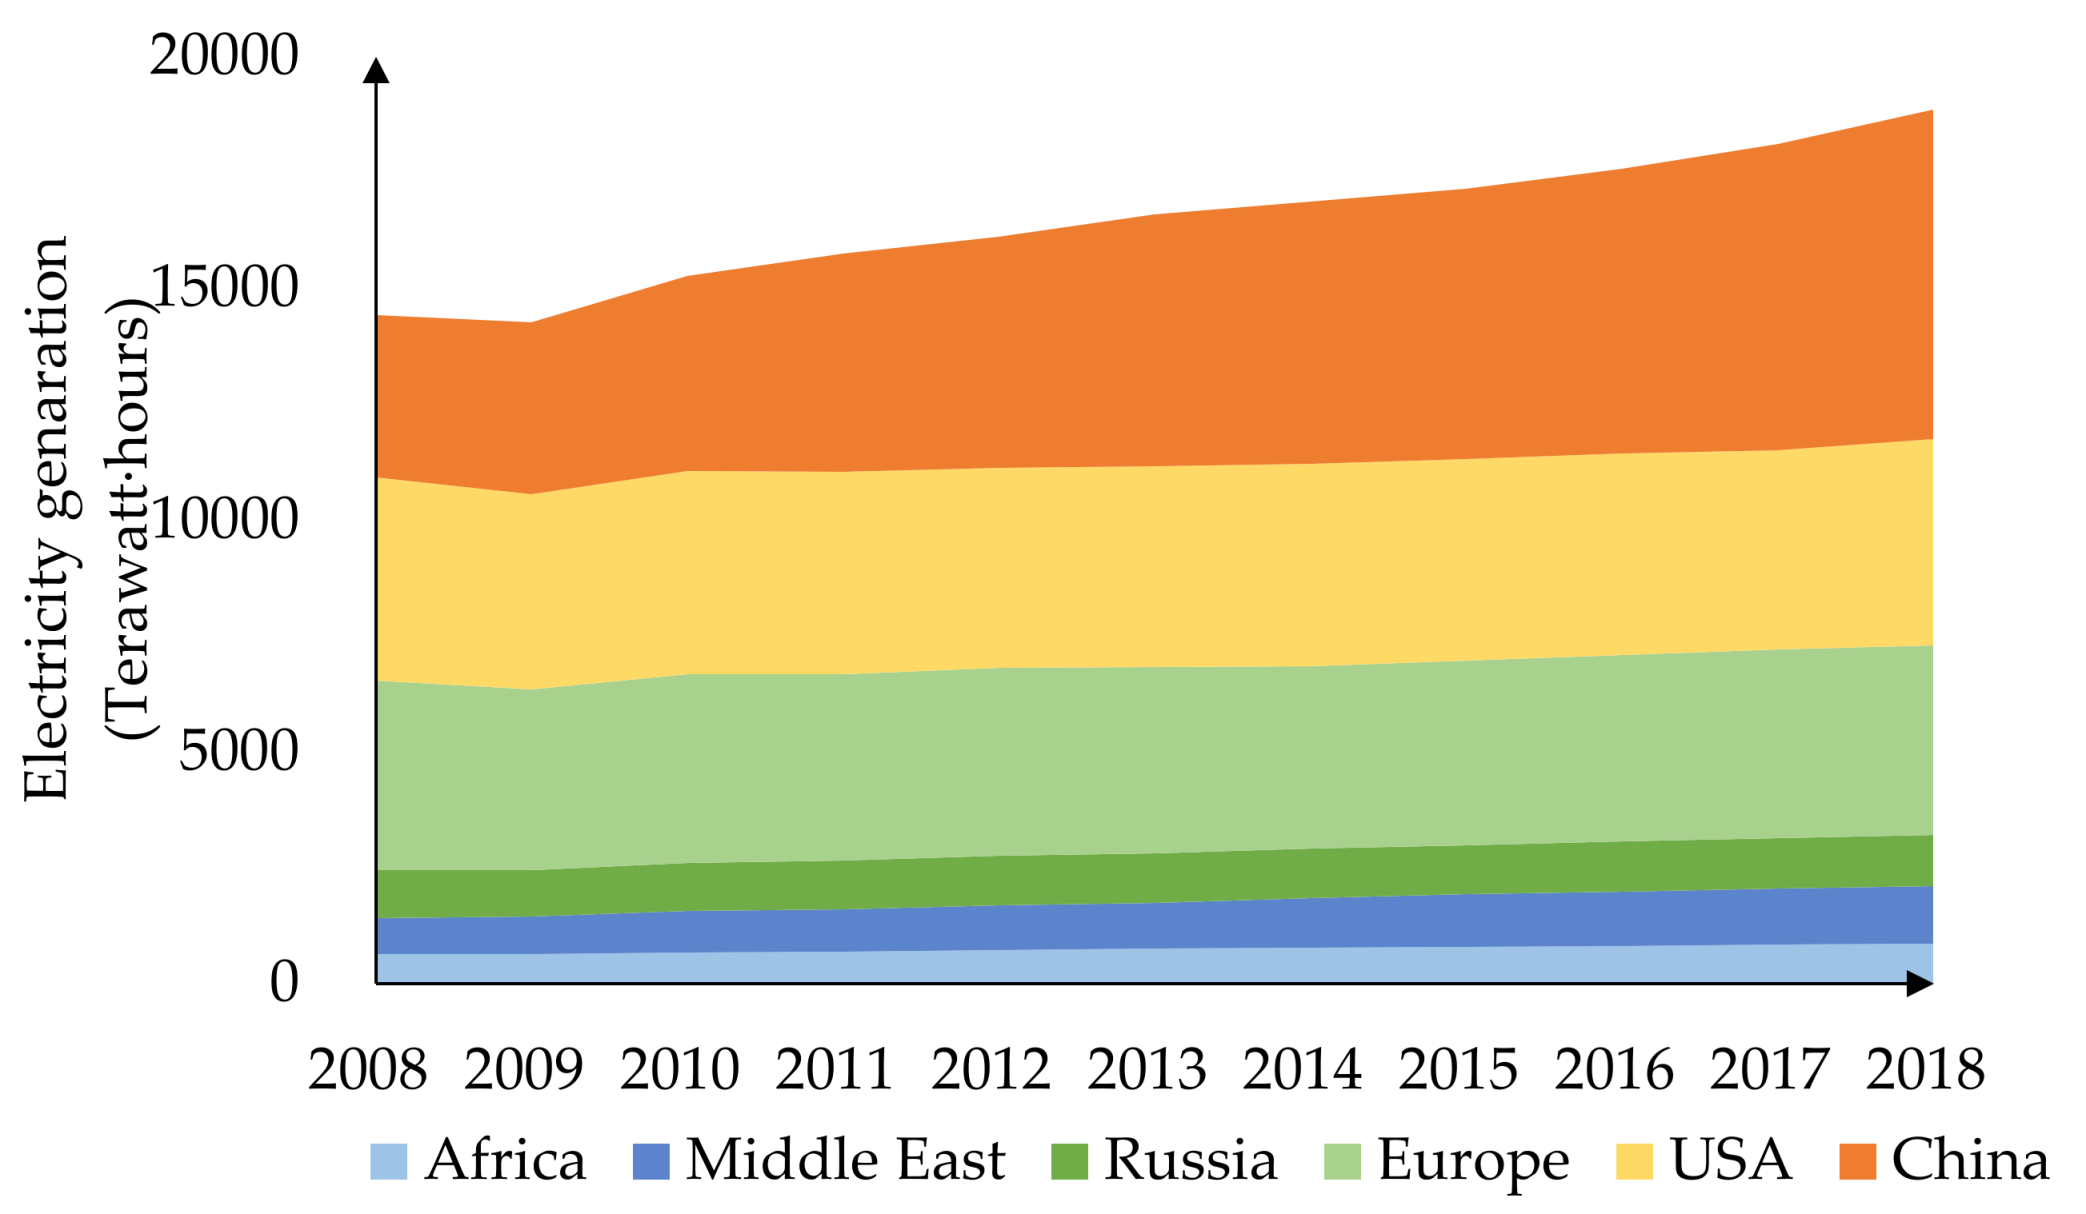
1. Introduction
2. Methods
2.1. Bayesian Networks (BN)
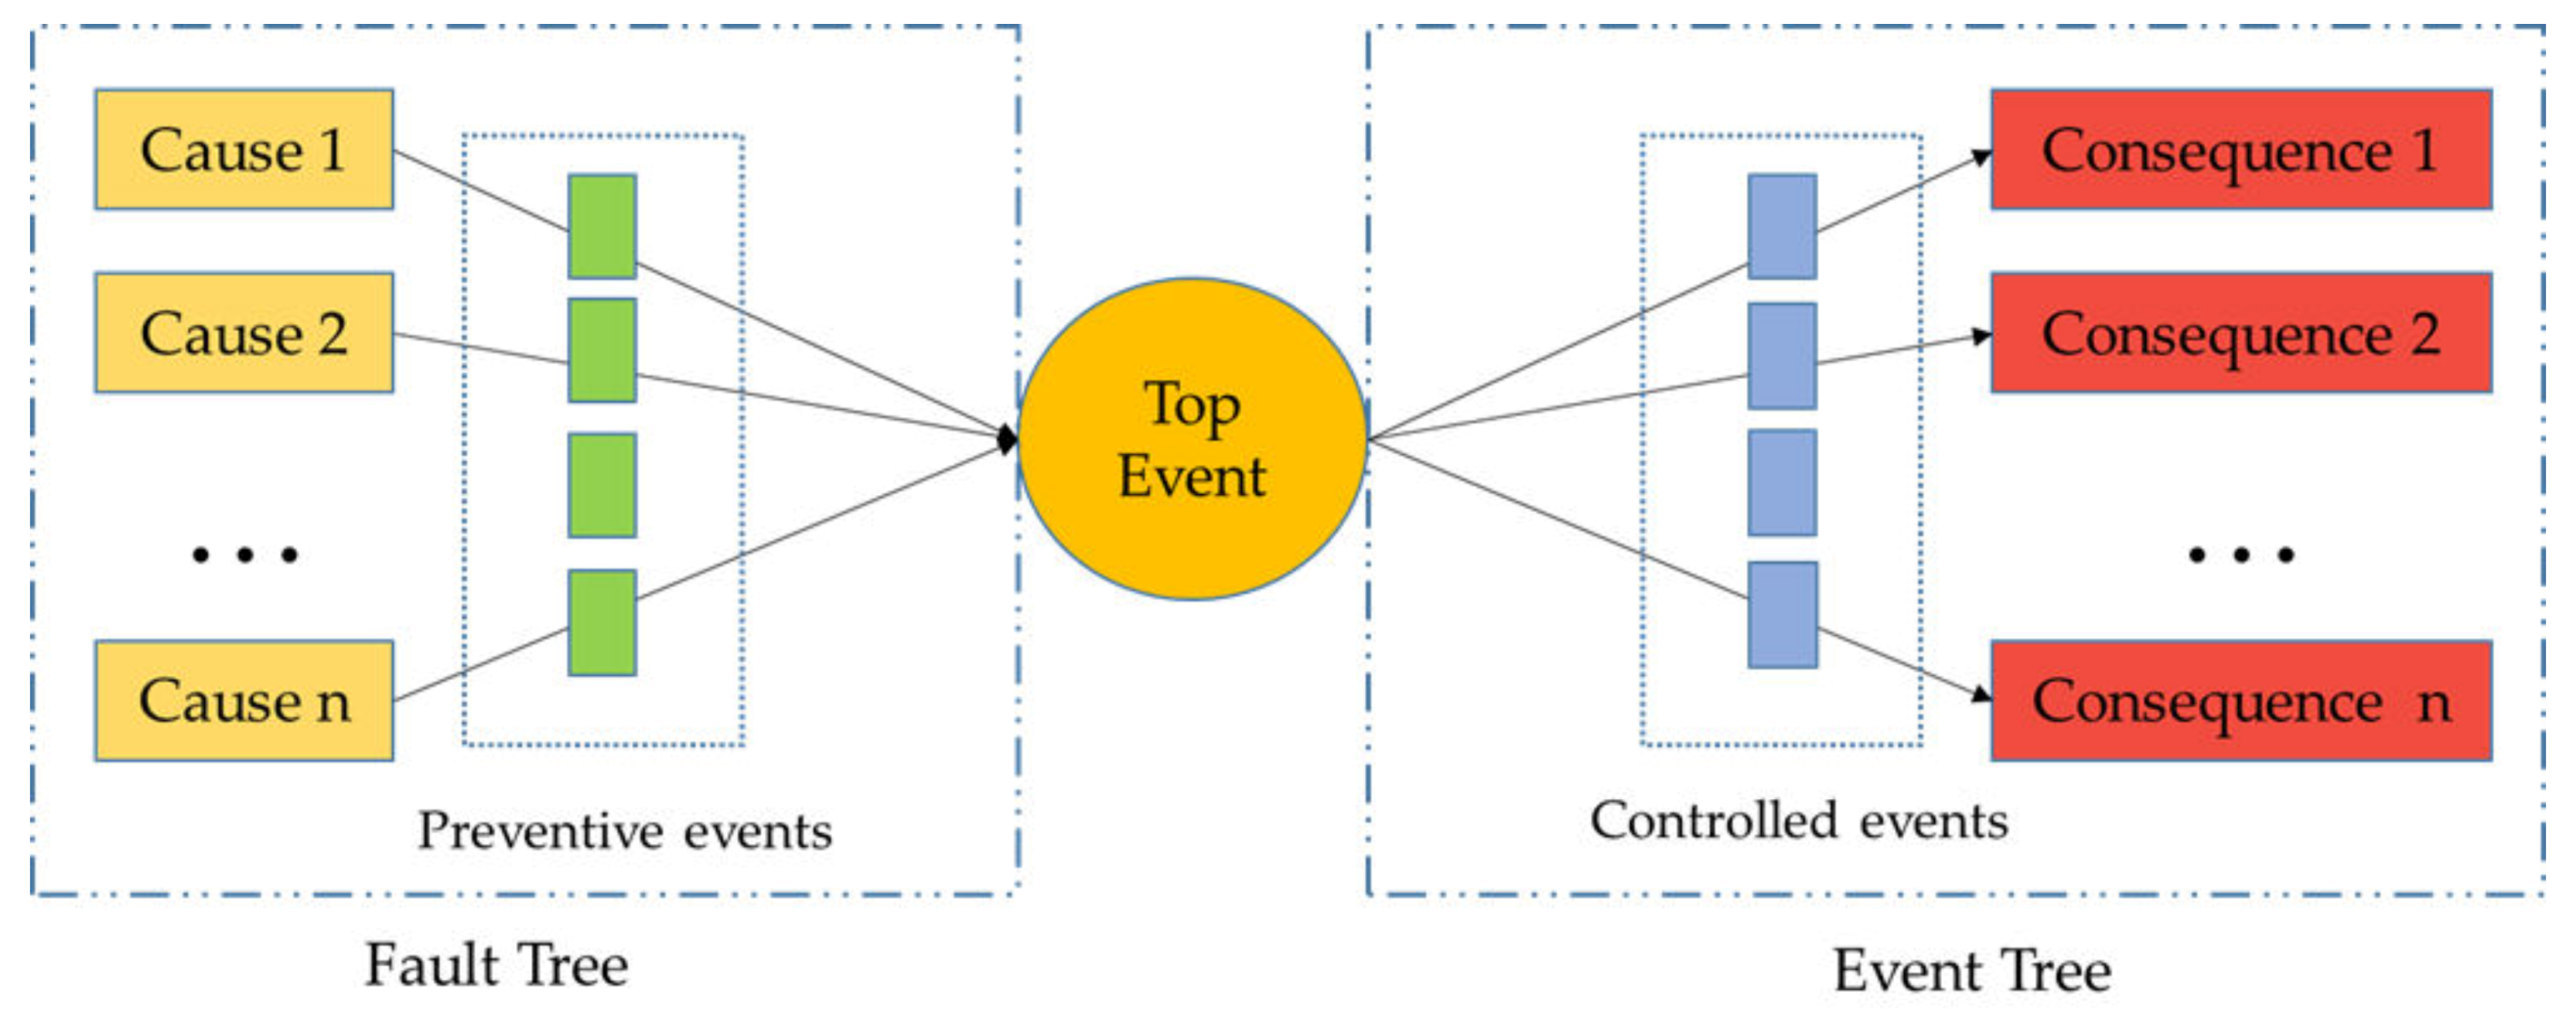
2.2. Bow-Tie Model
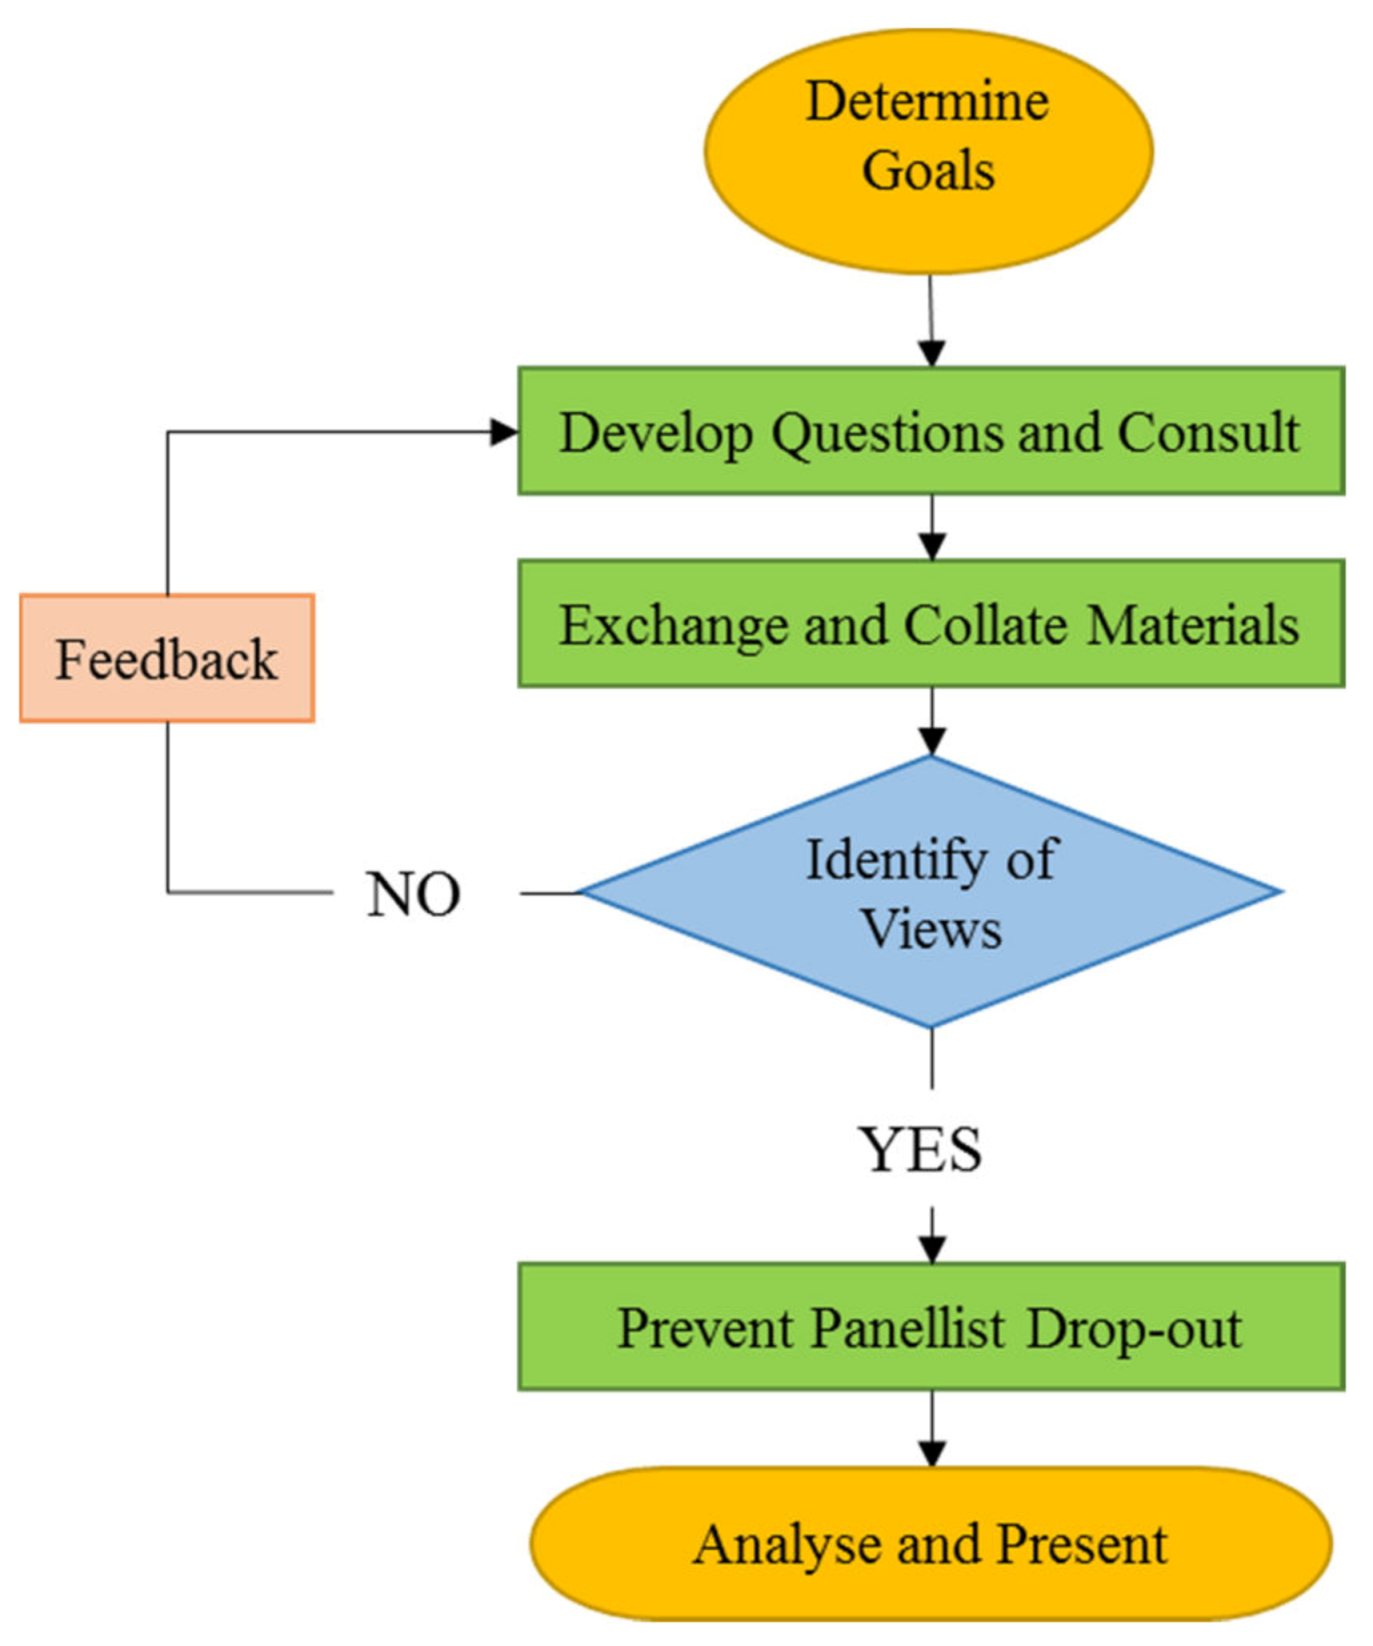
2.3. Delphi Method
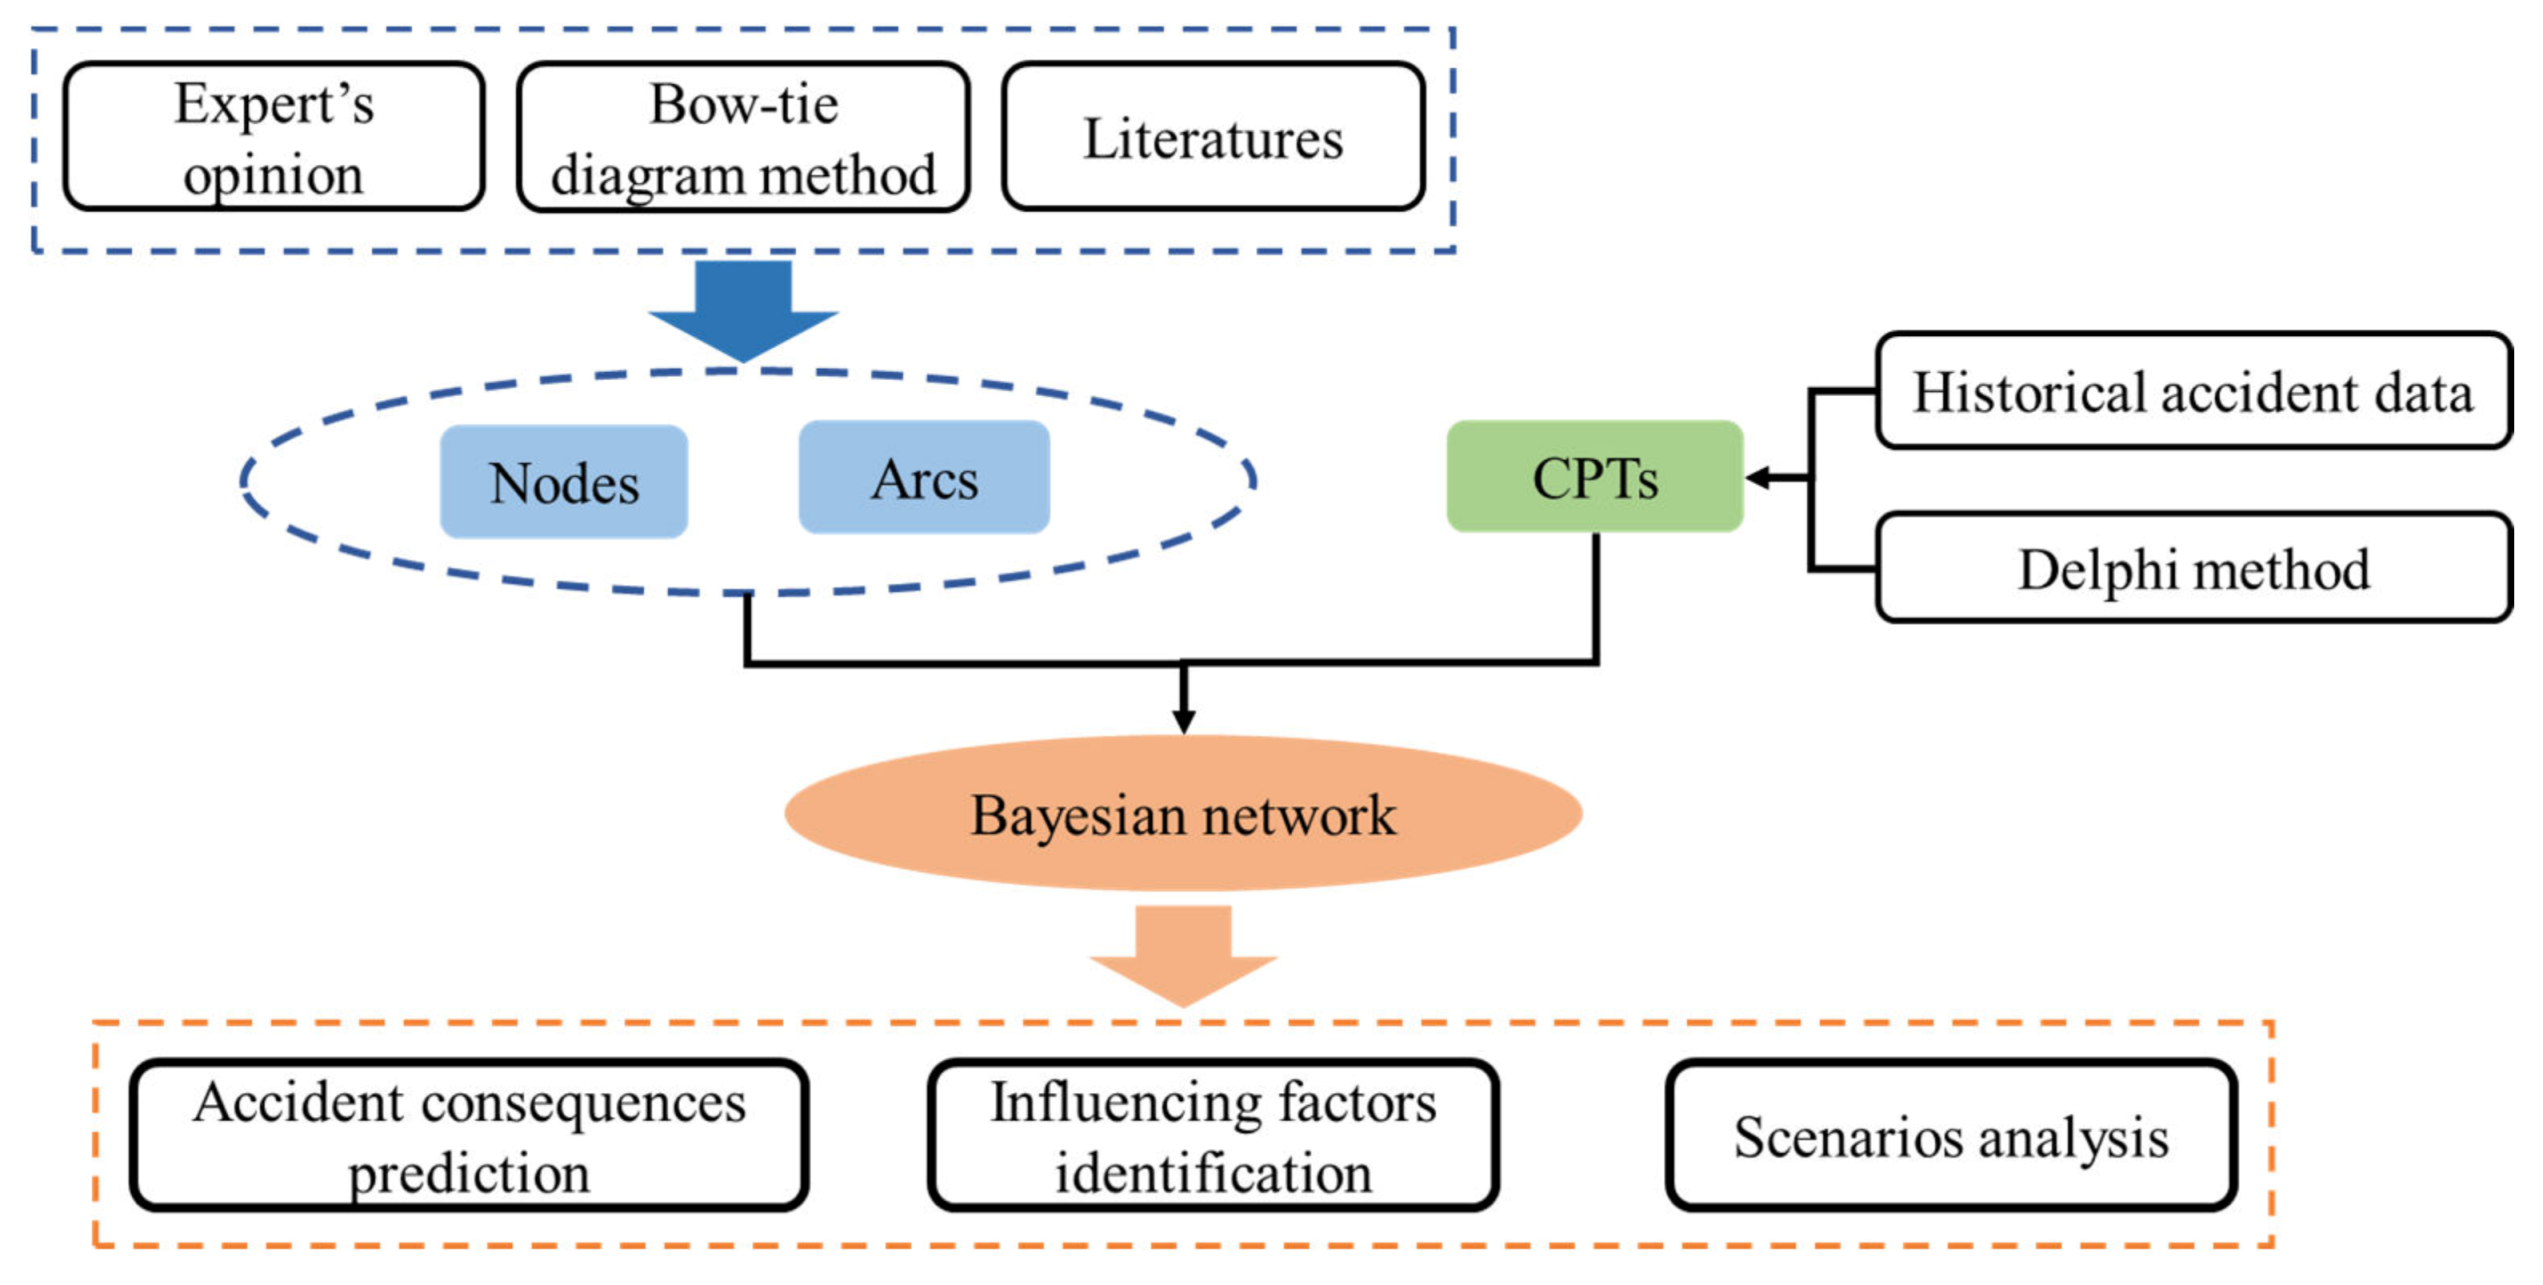
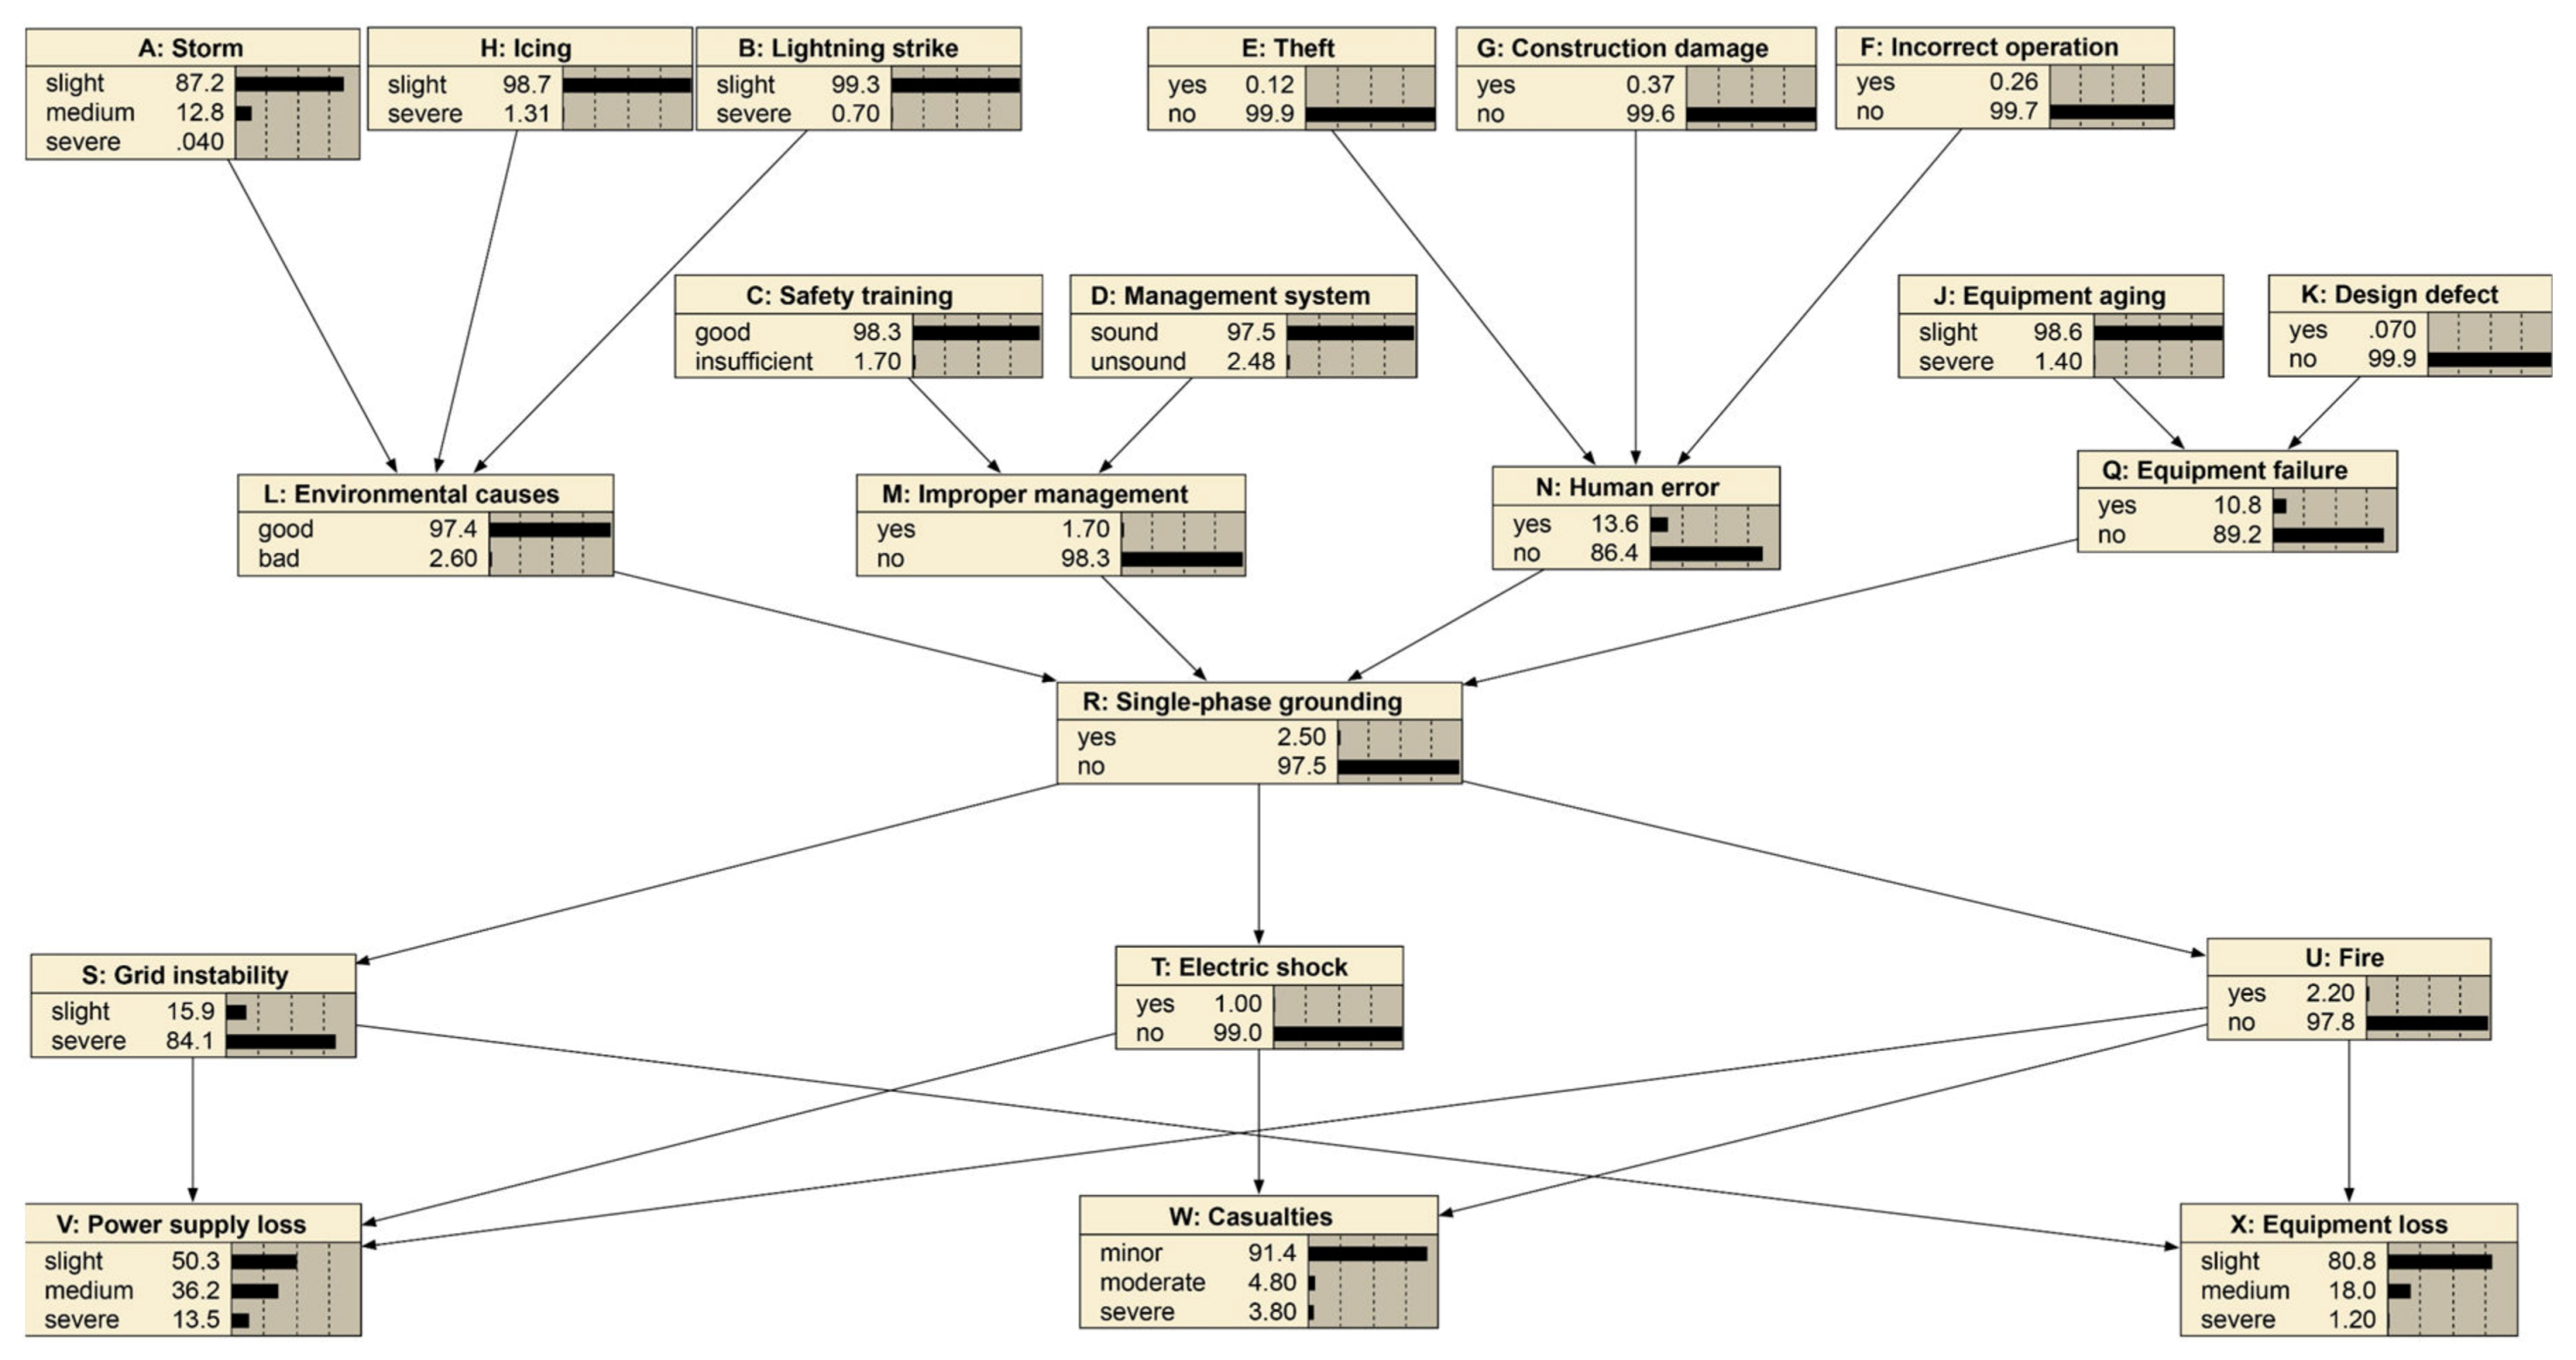
3. Establishing a Bayesian Network
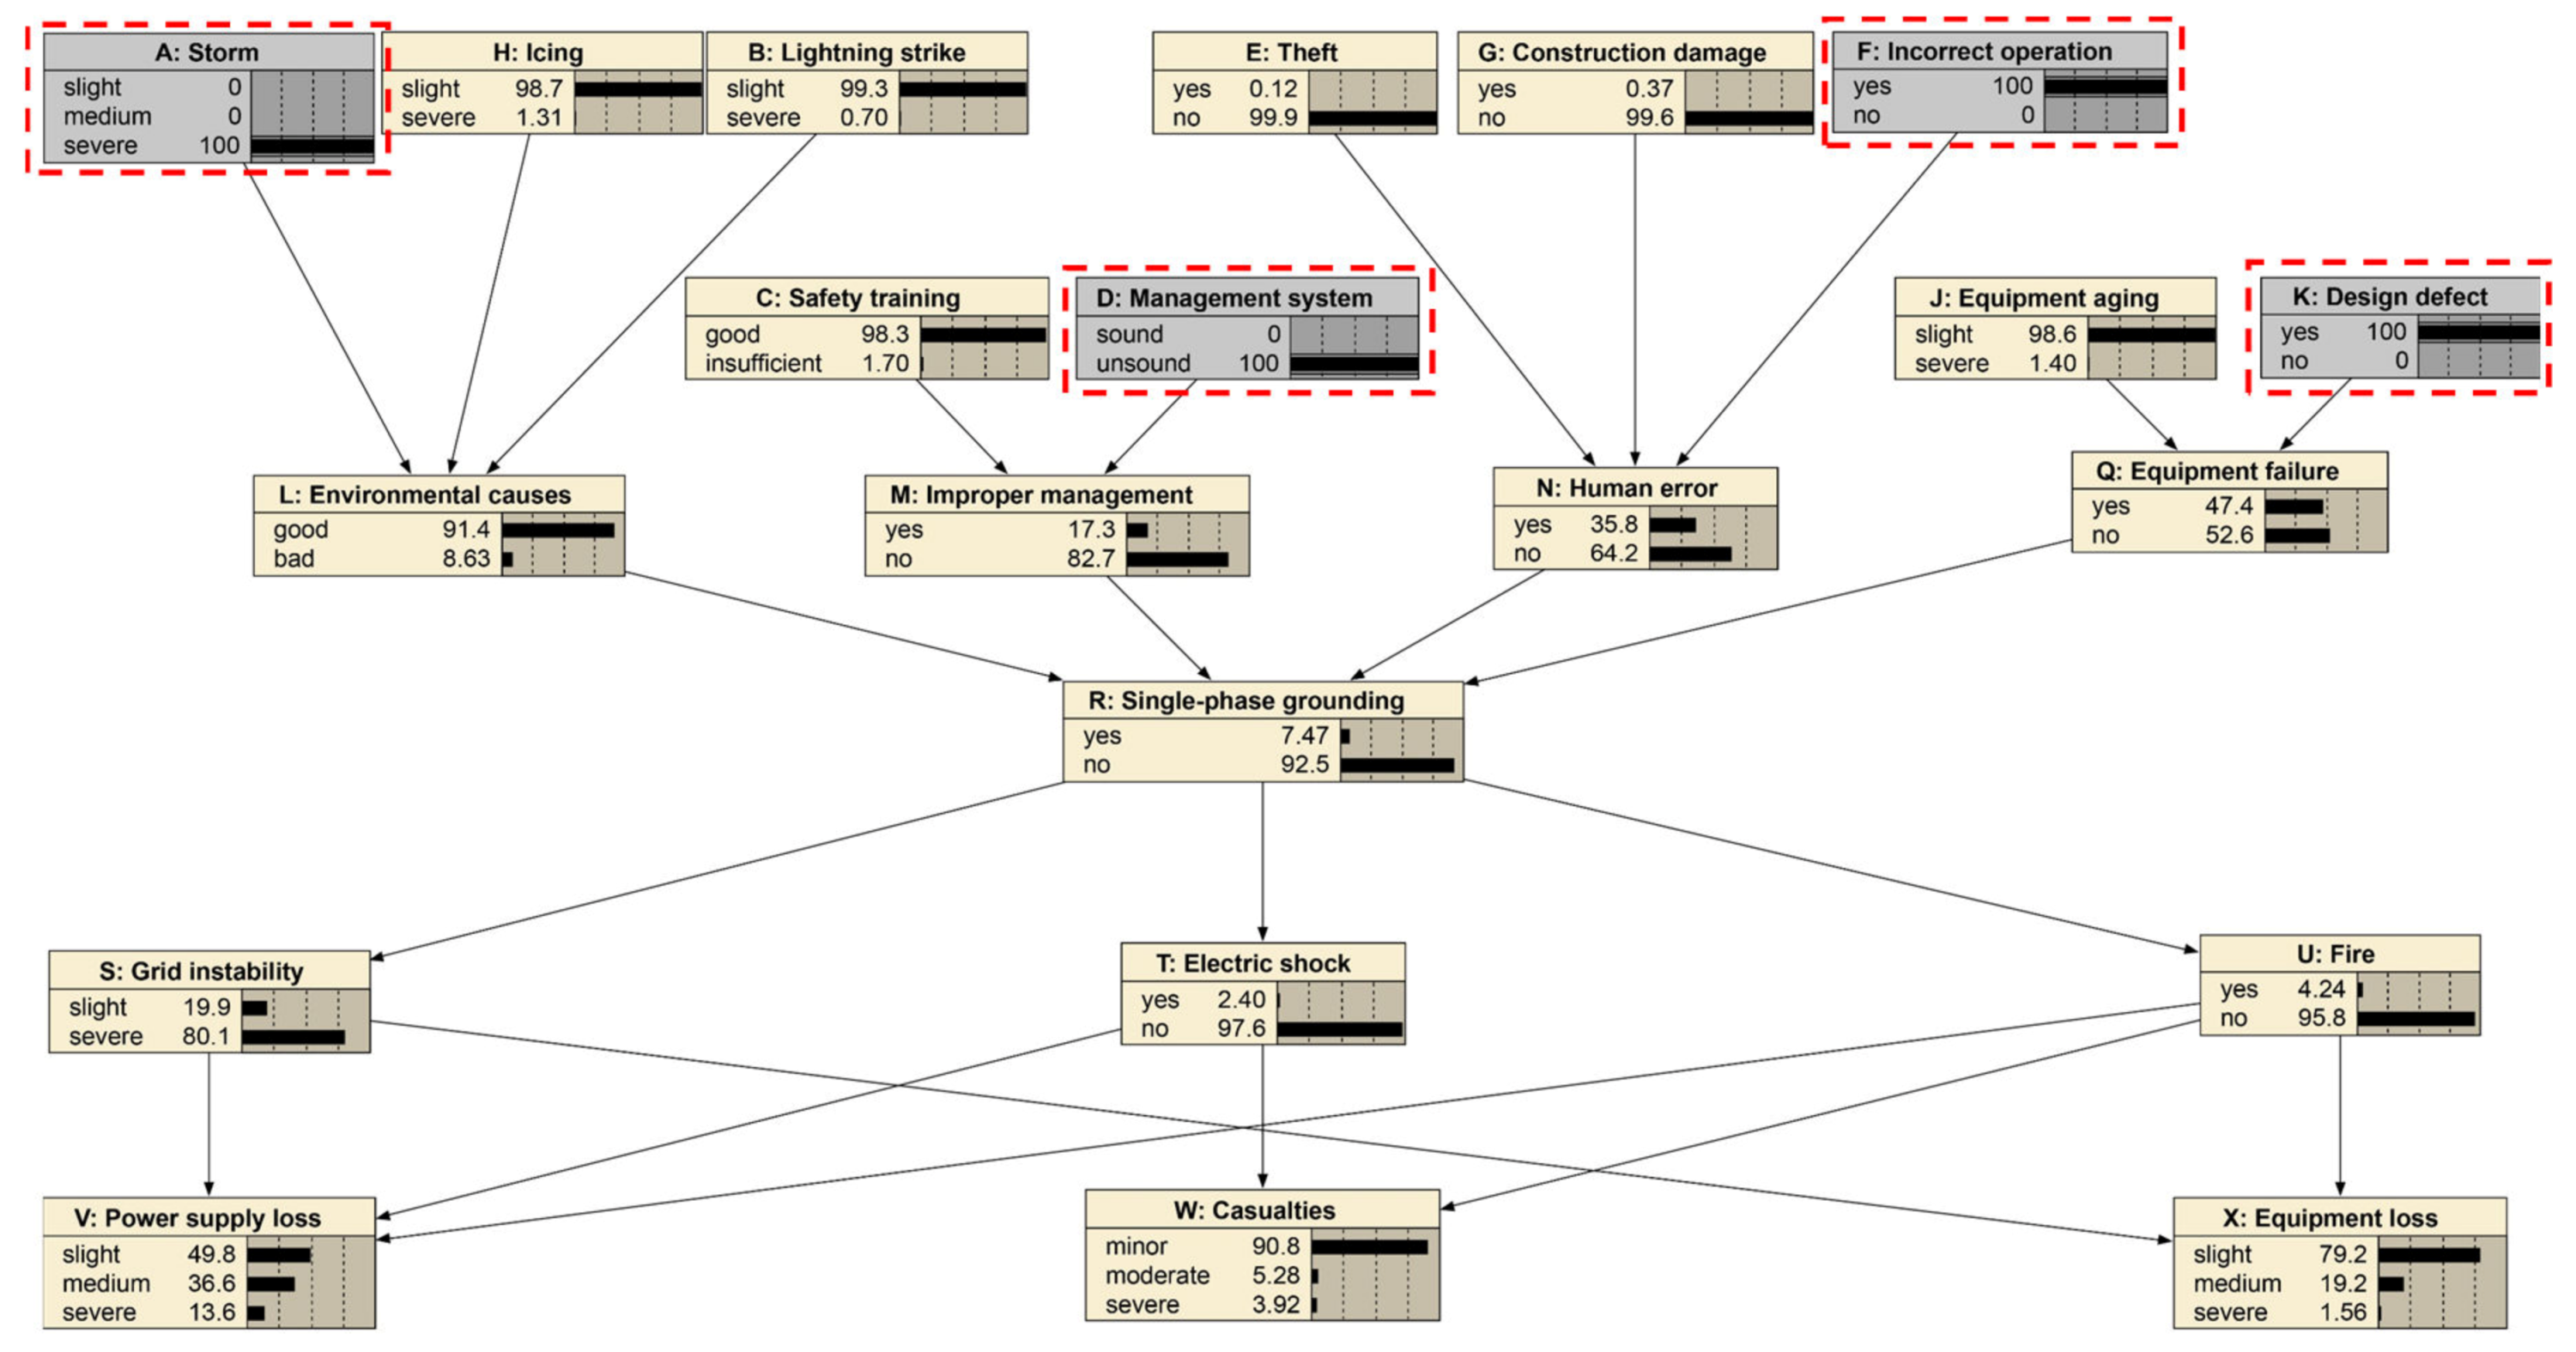
3.1. The Structure of the Bayesian Network
3.2. Conditional Probability Table
4. Cases Study
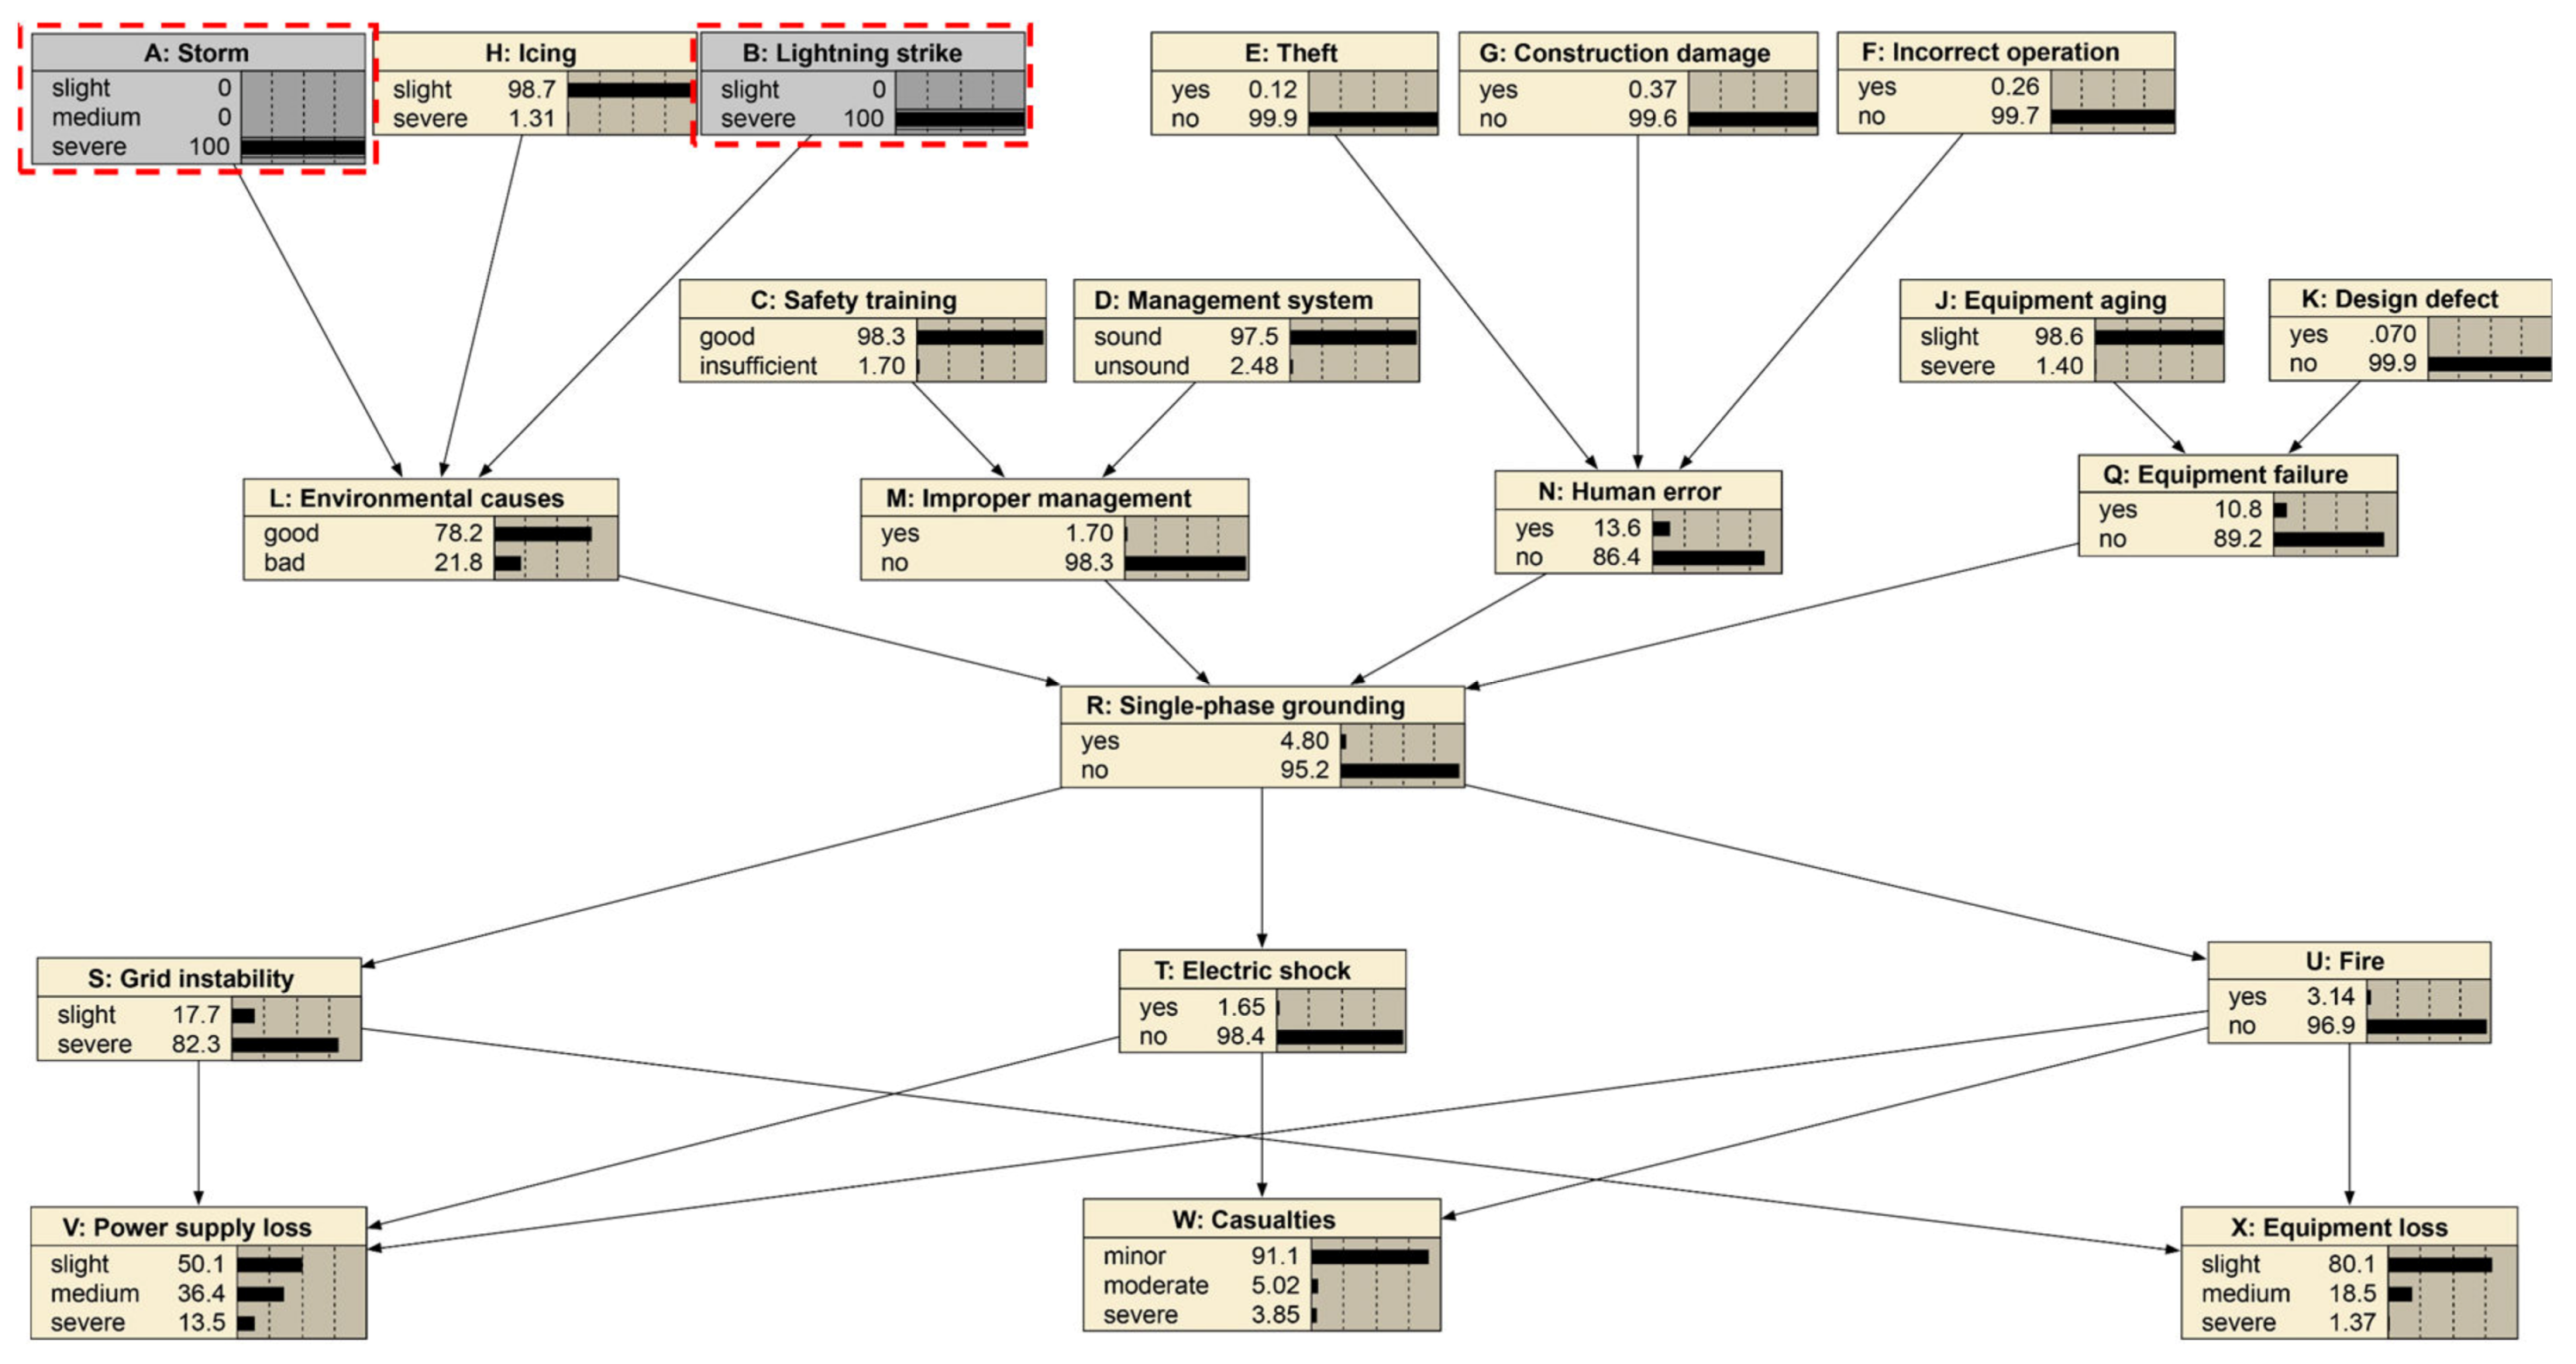
4.1. Case 1: Cause of Severe Storm and Severe Strike
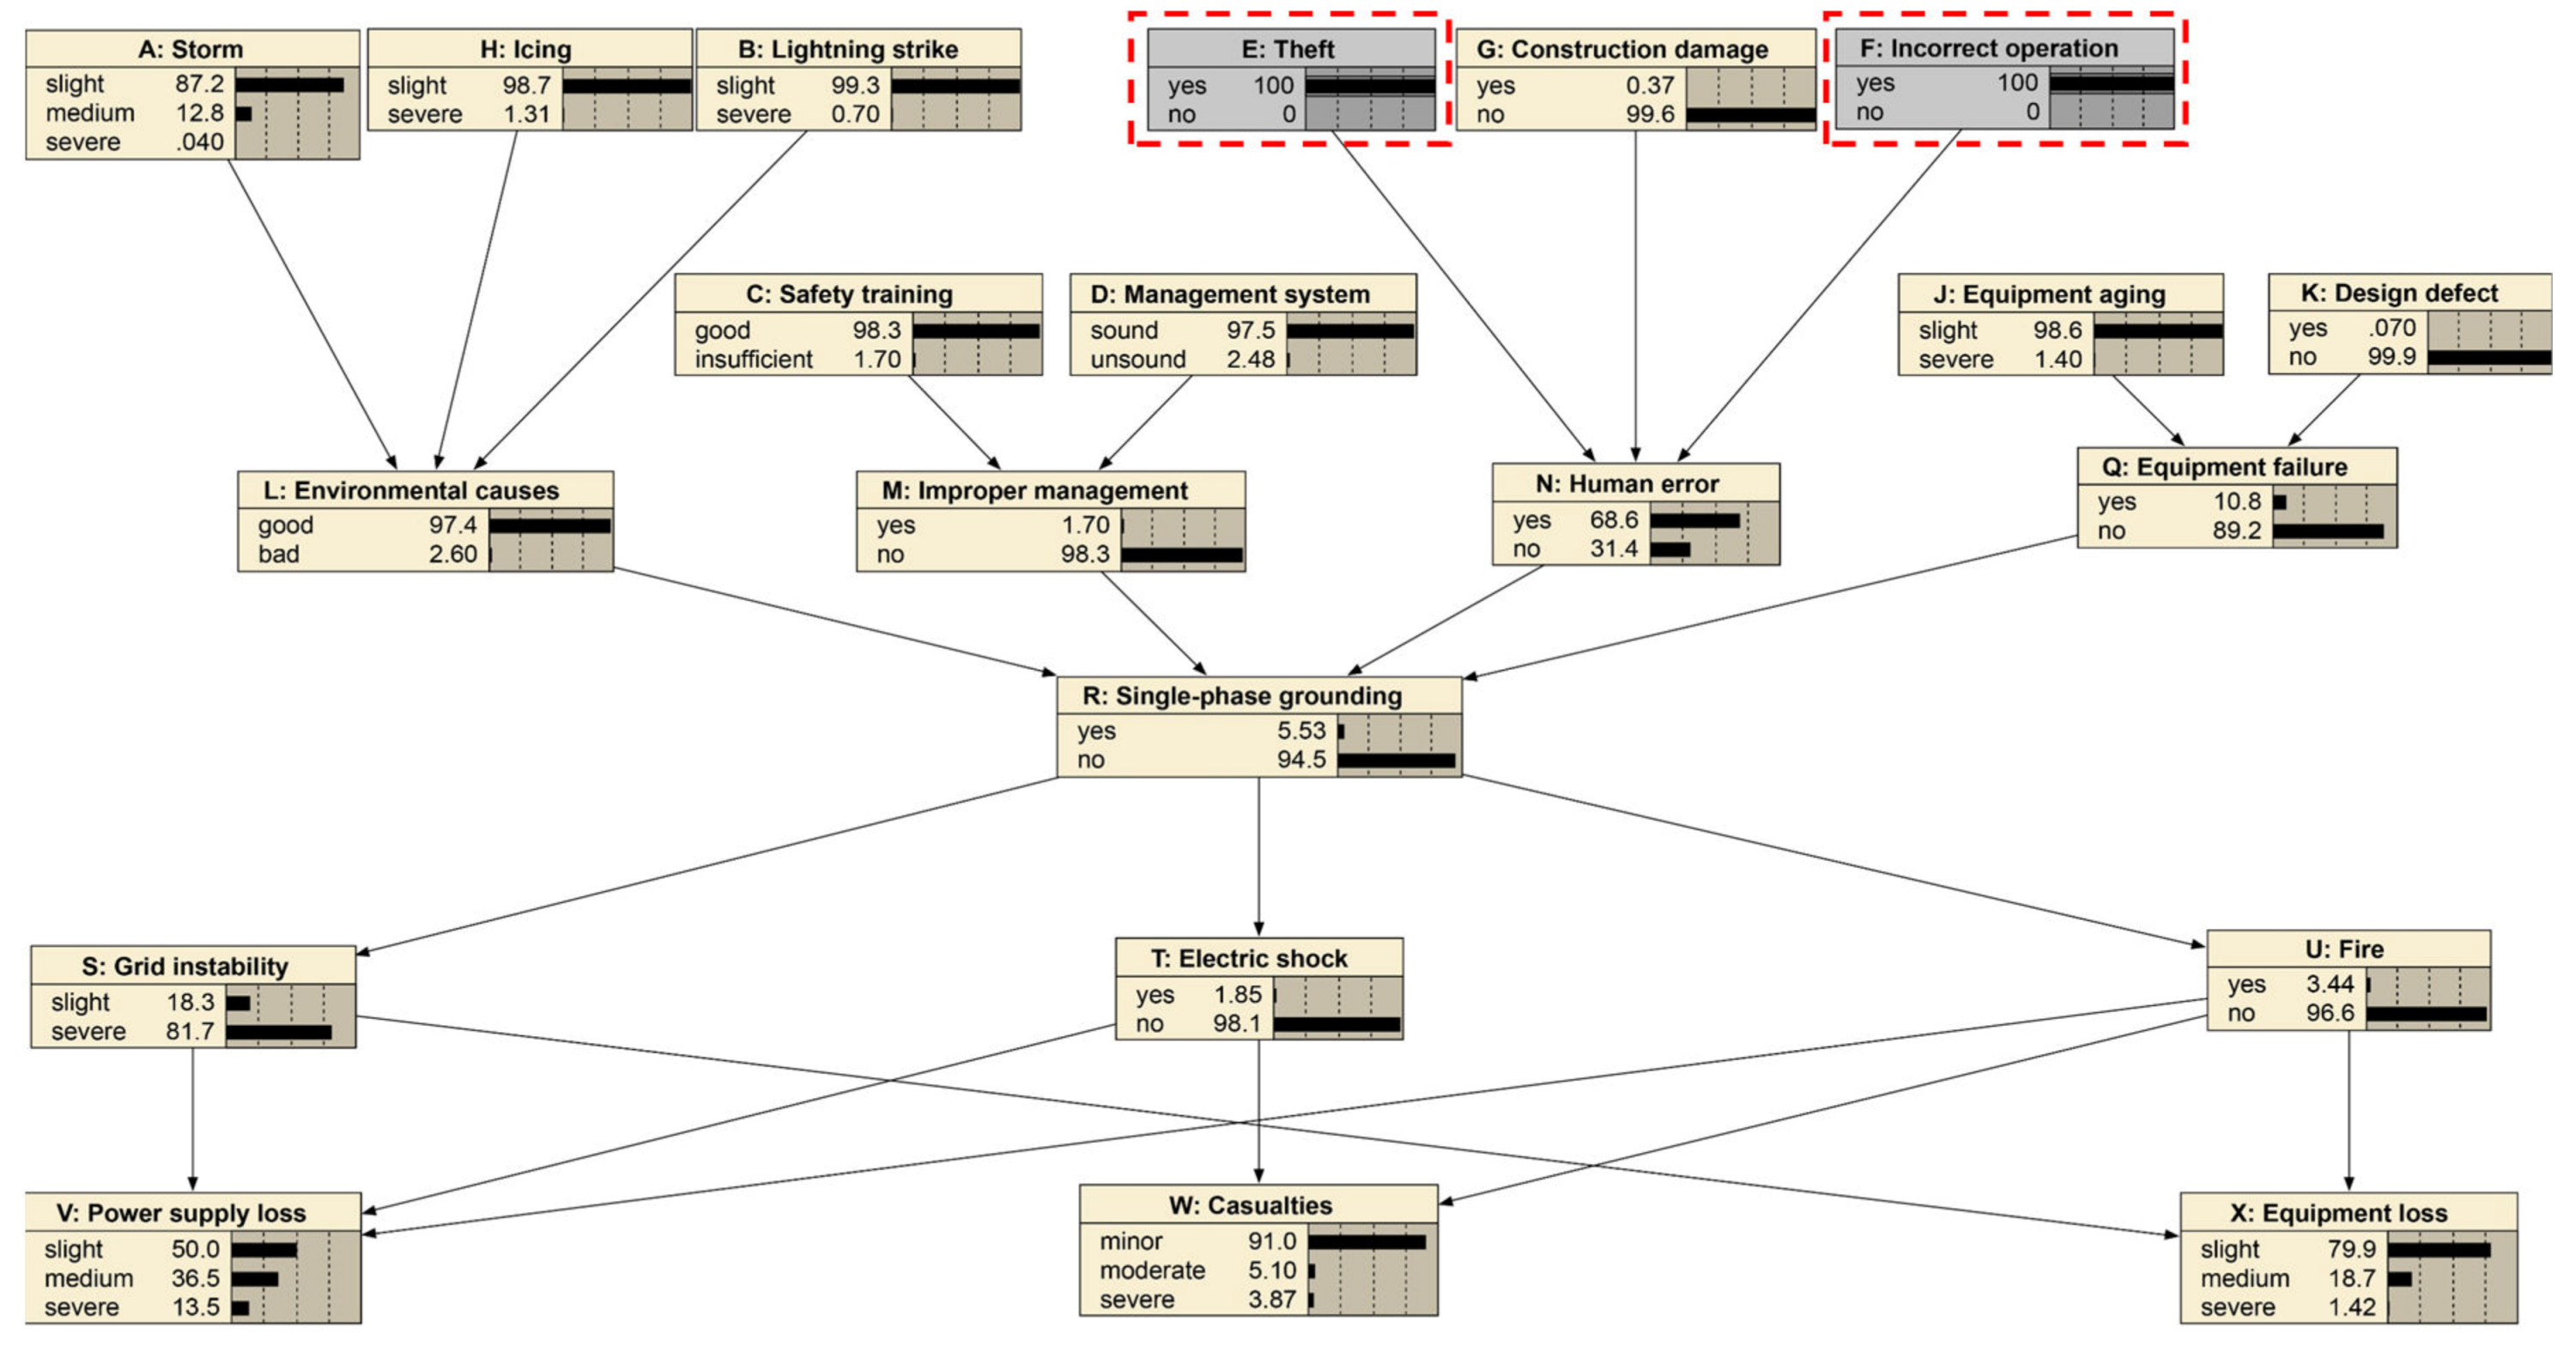
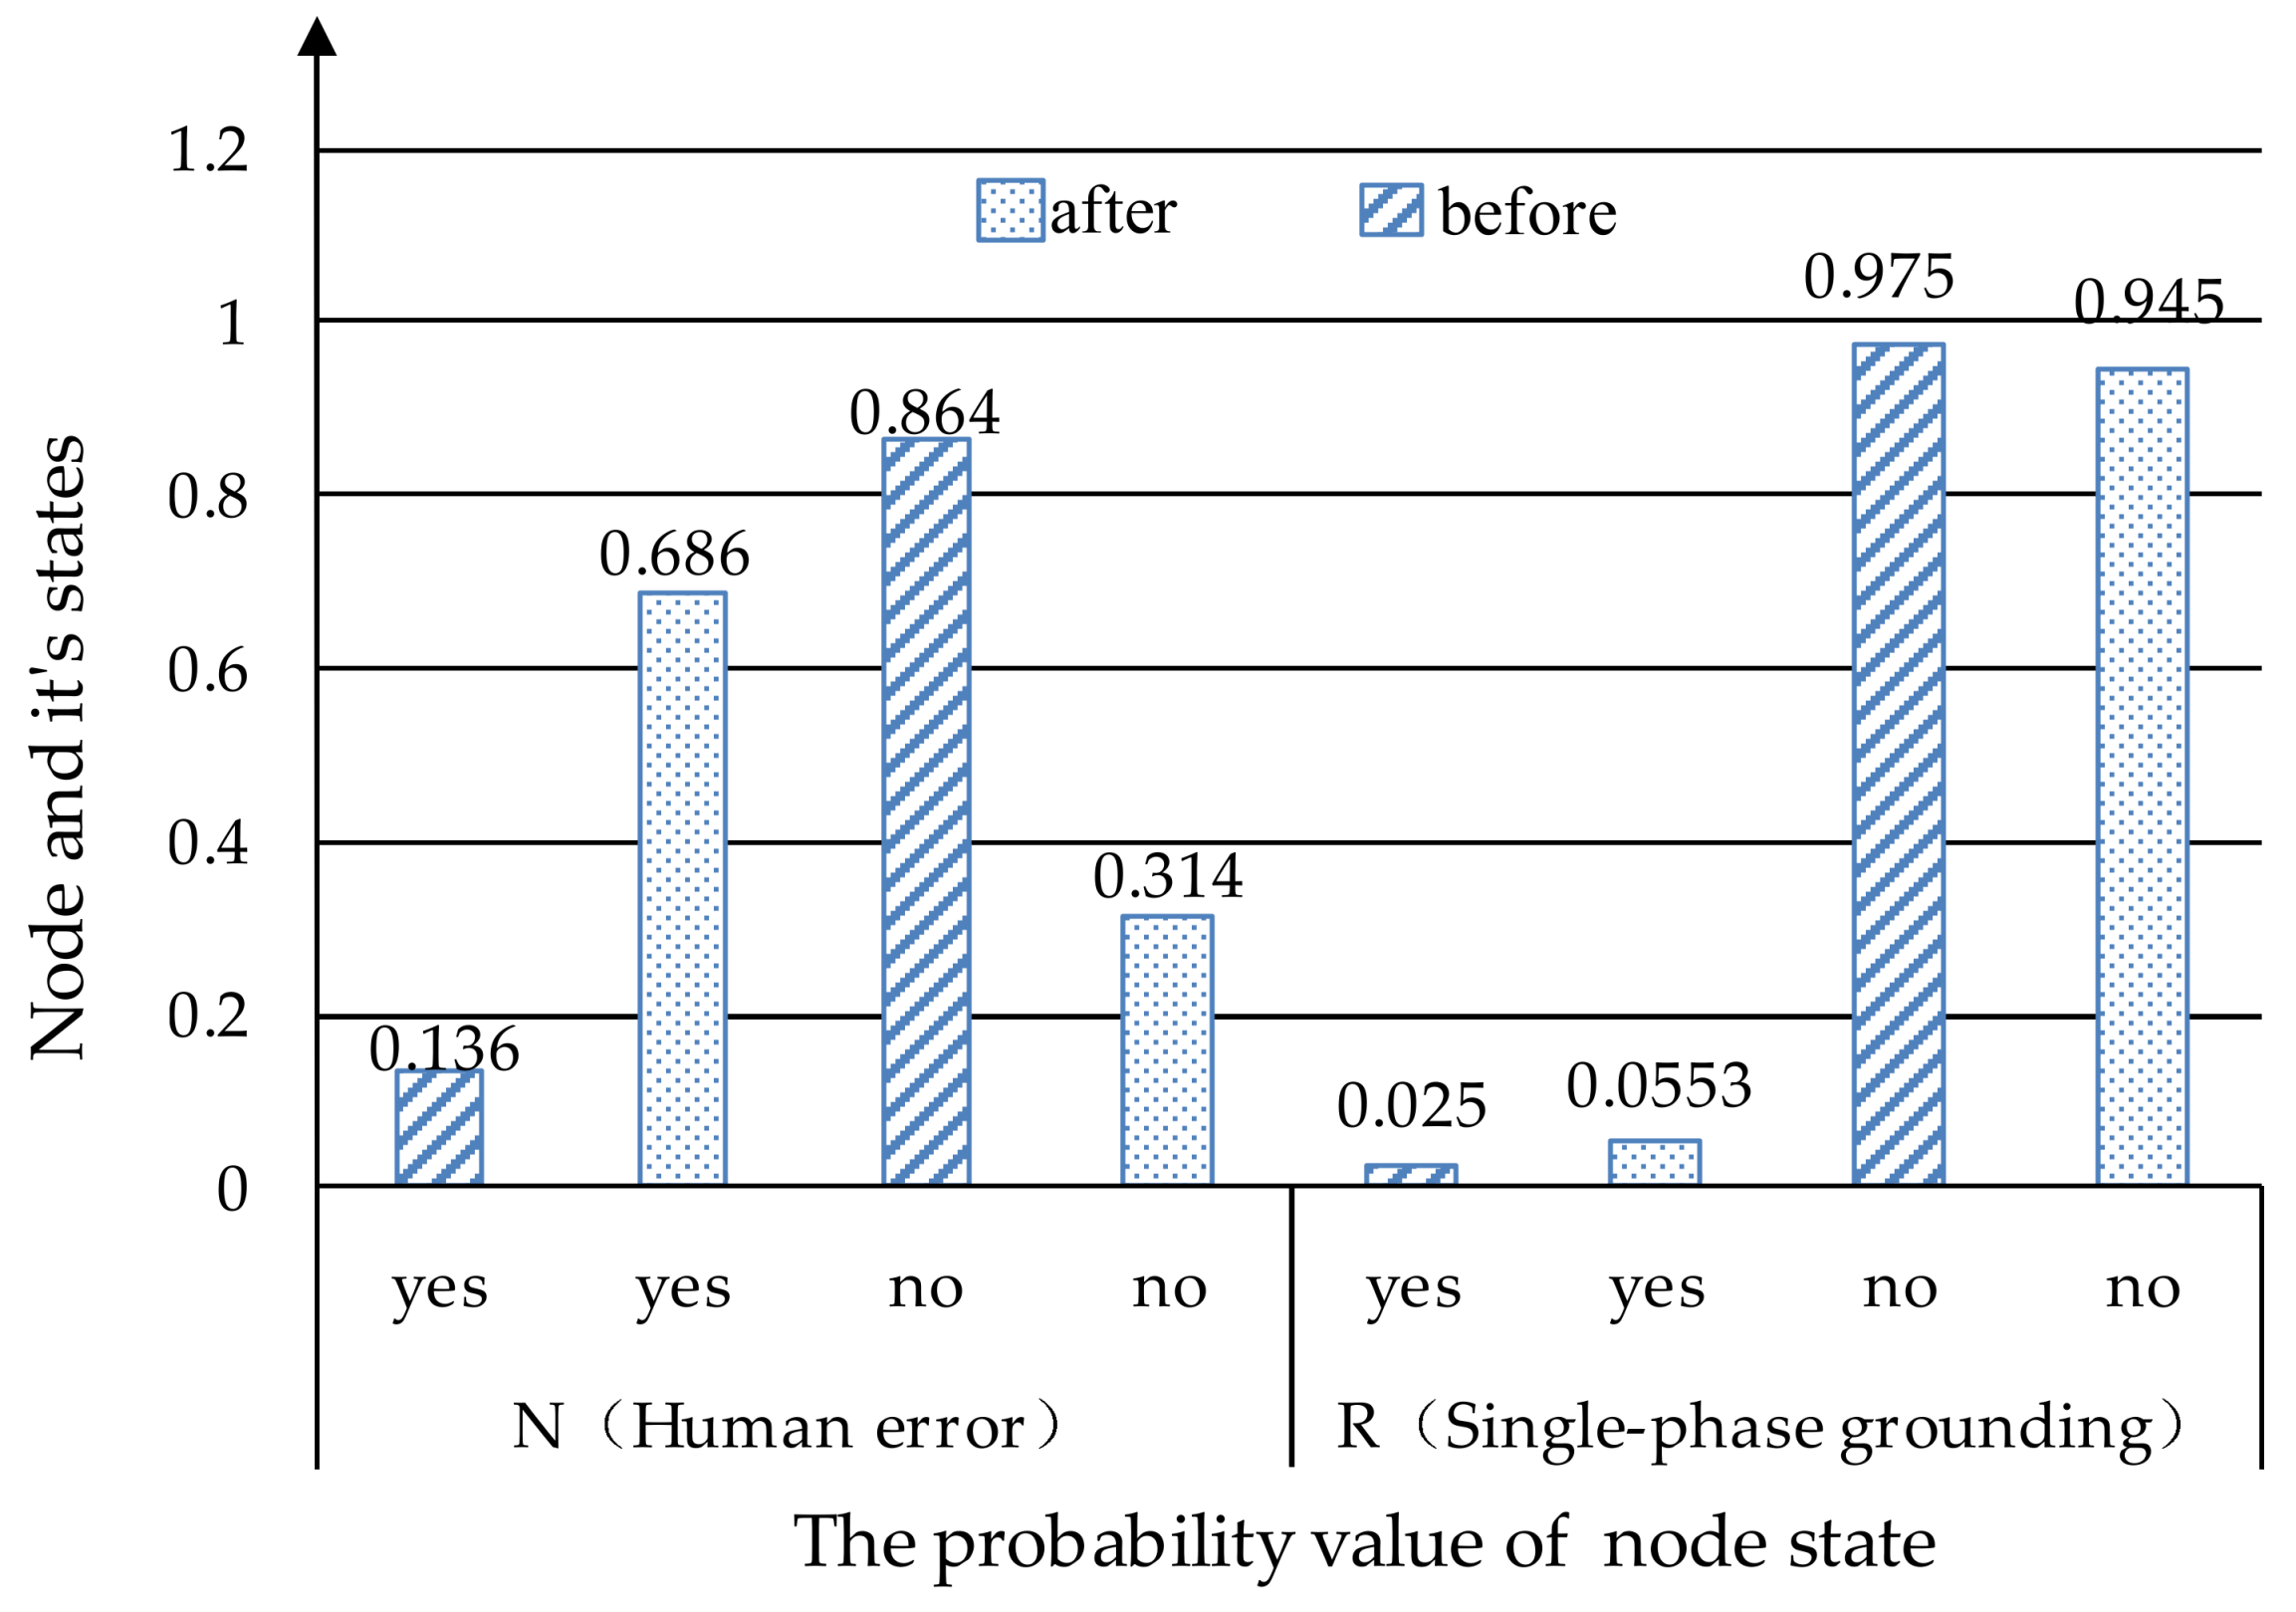
4.2. Case 2: Theft, Incorrect Operation
4.3. Case 3: Storm, Management System, Incorrect operation, Design Defect
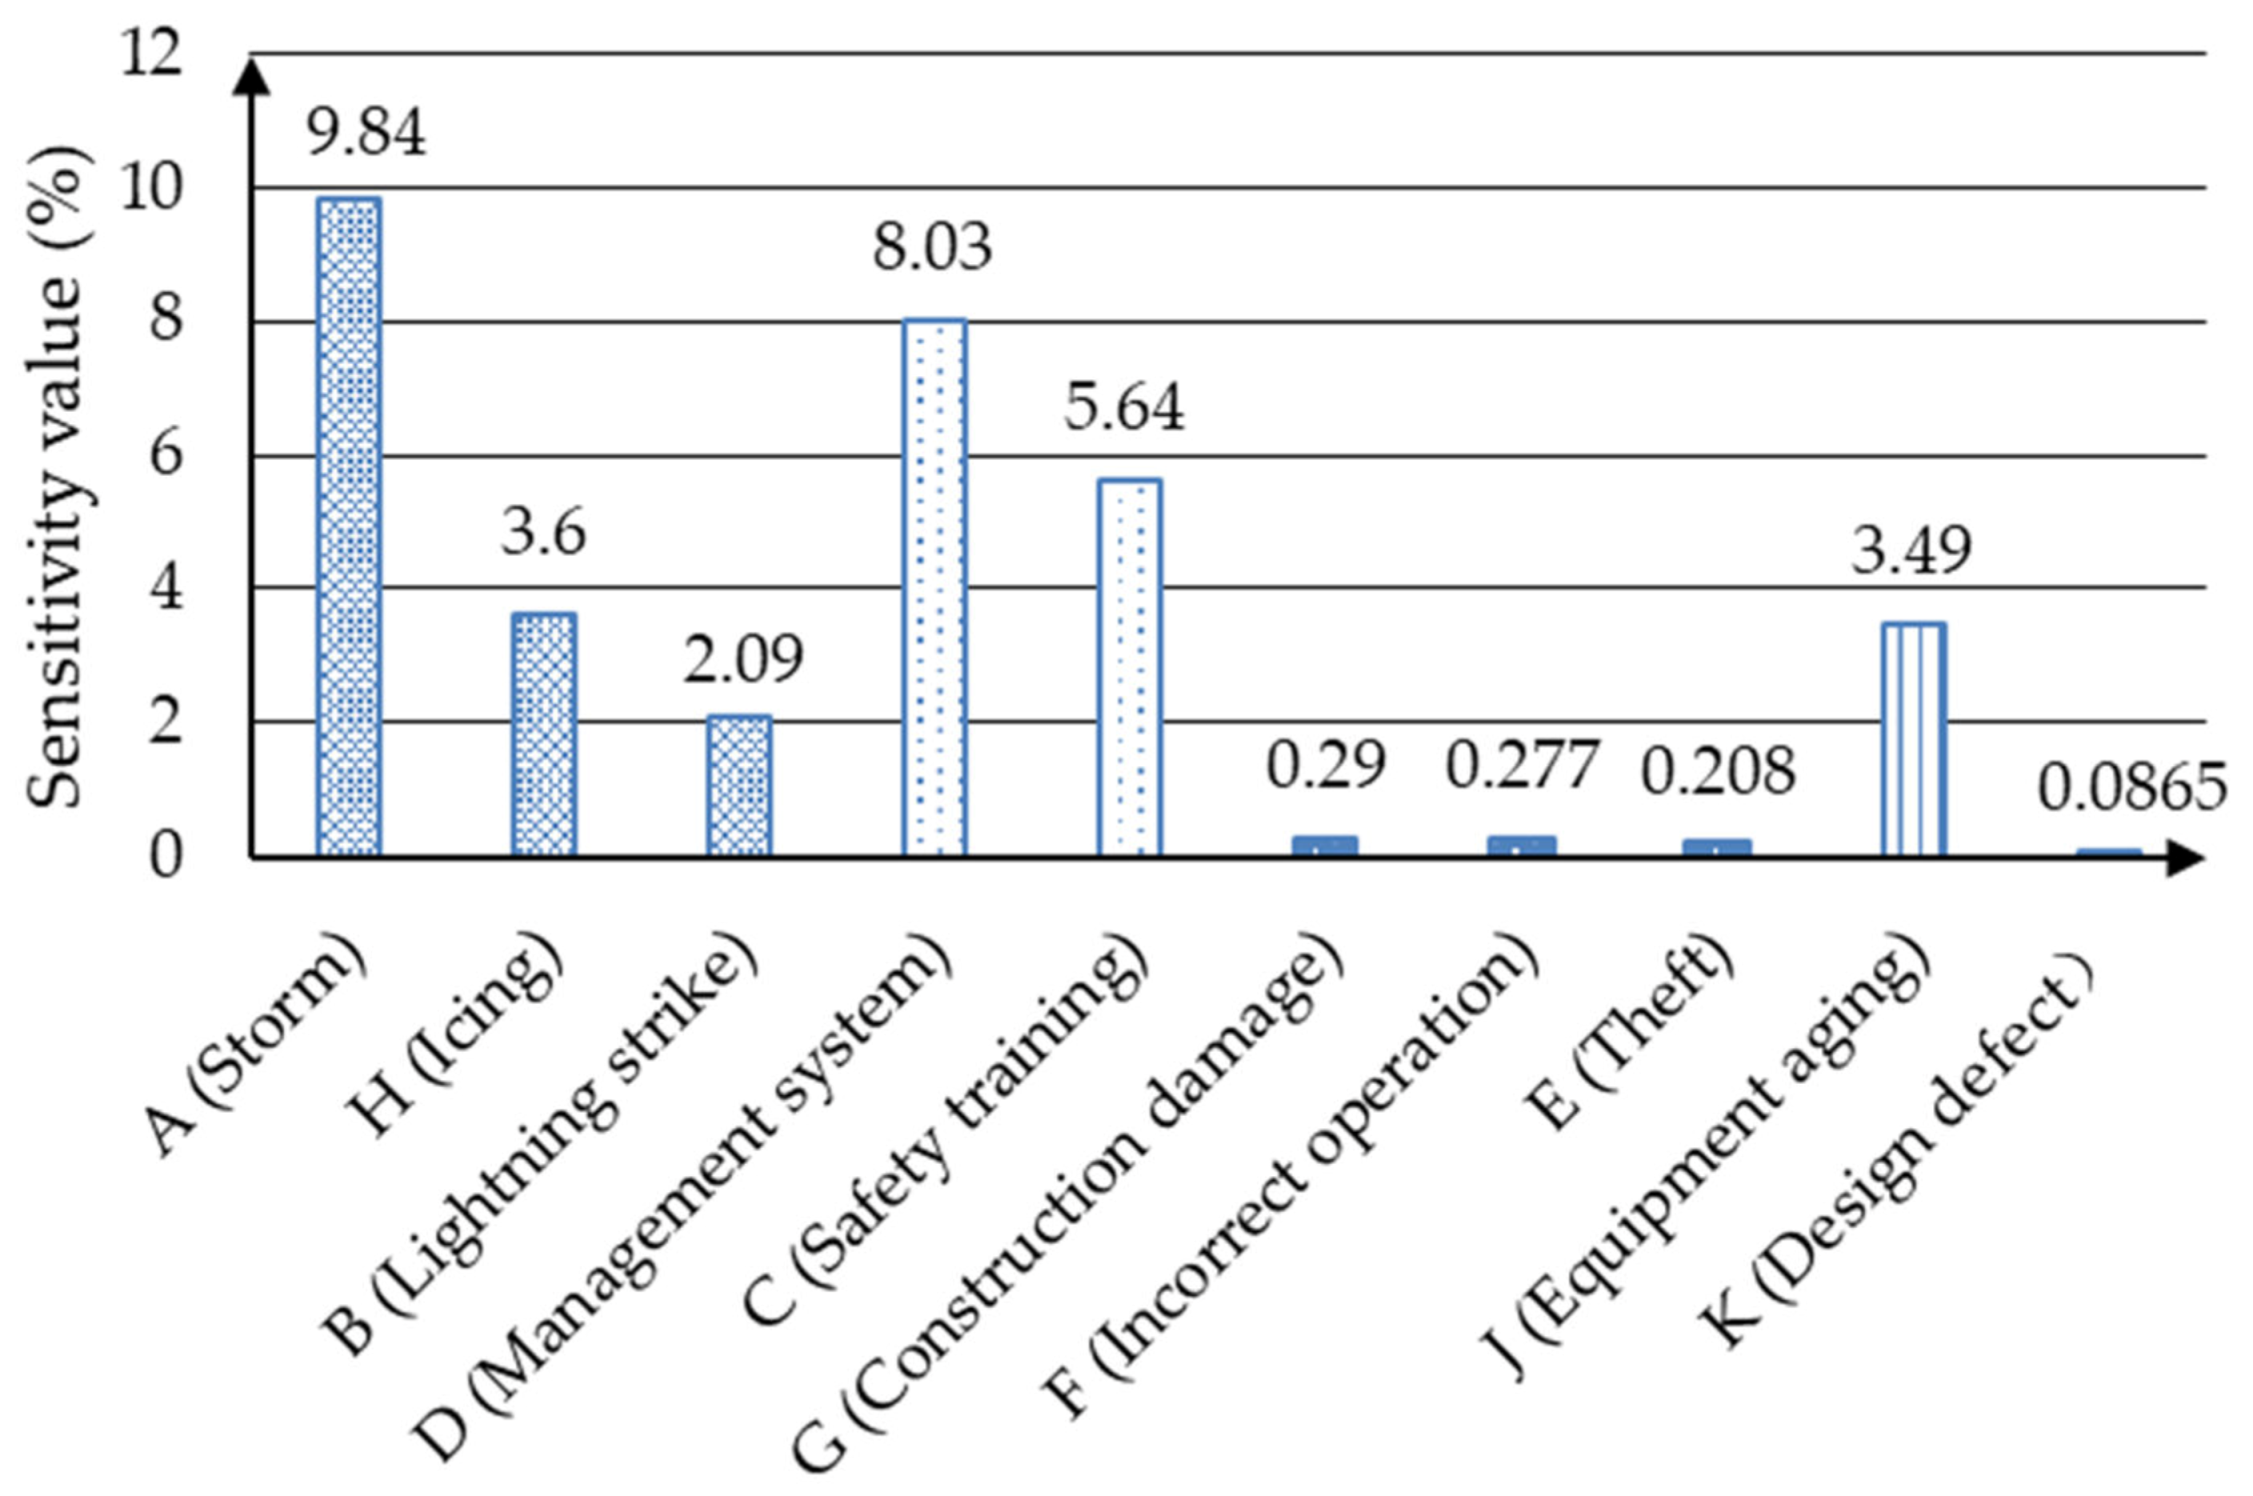
5. Sensitivity Analysis (SA)
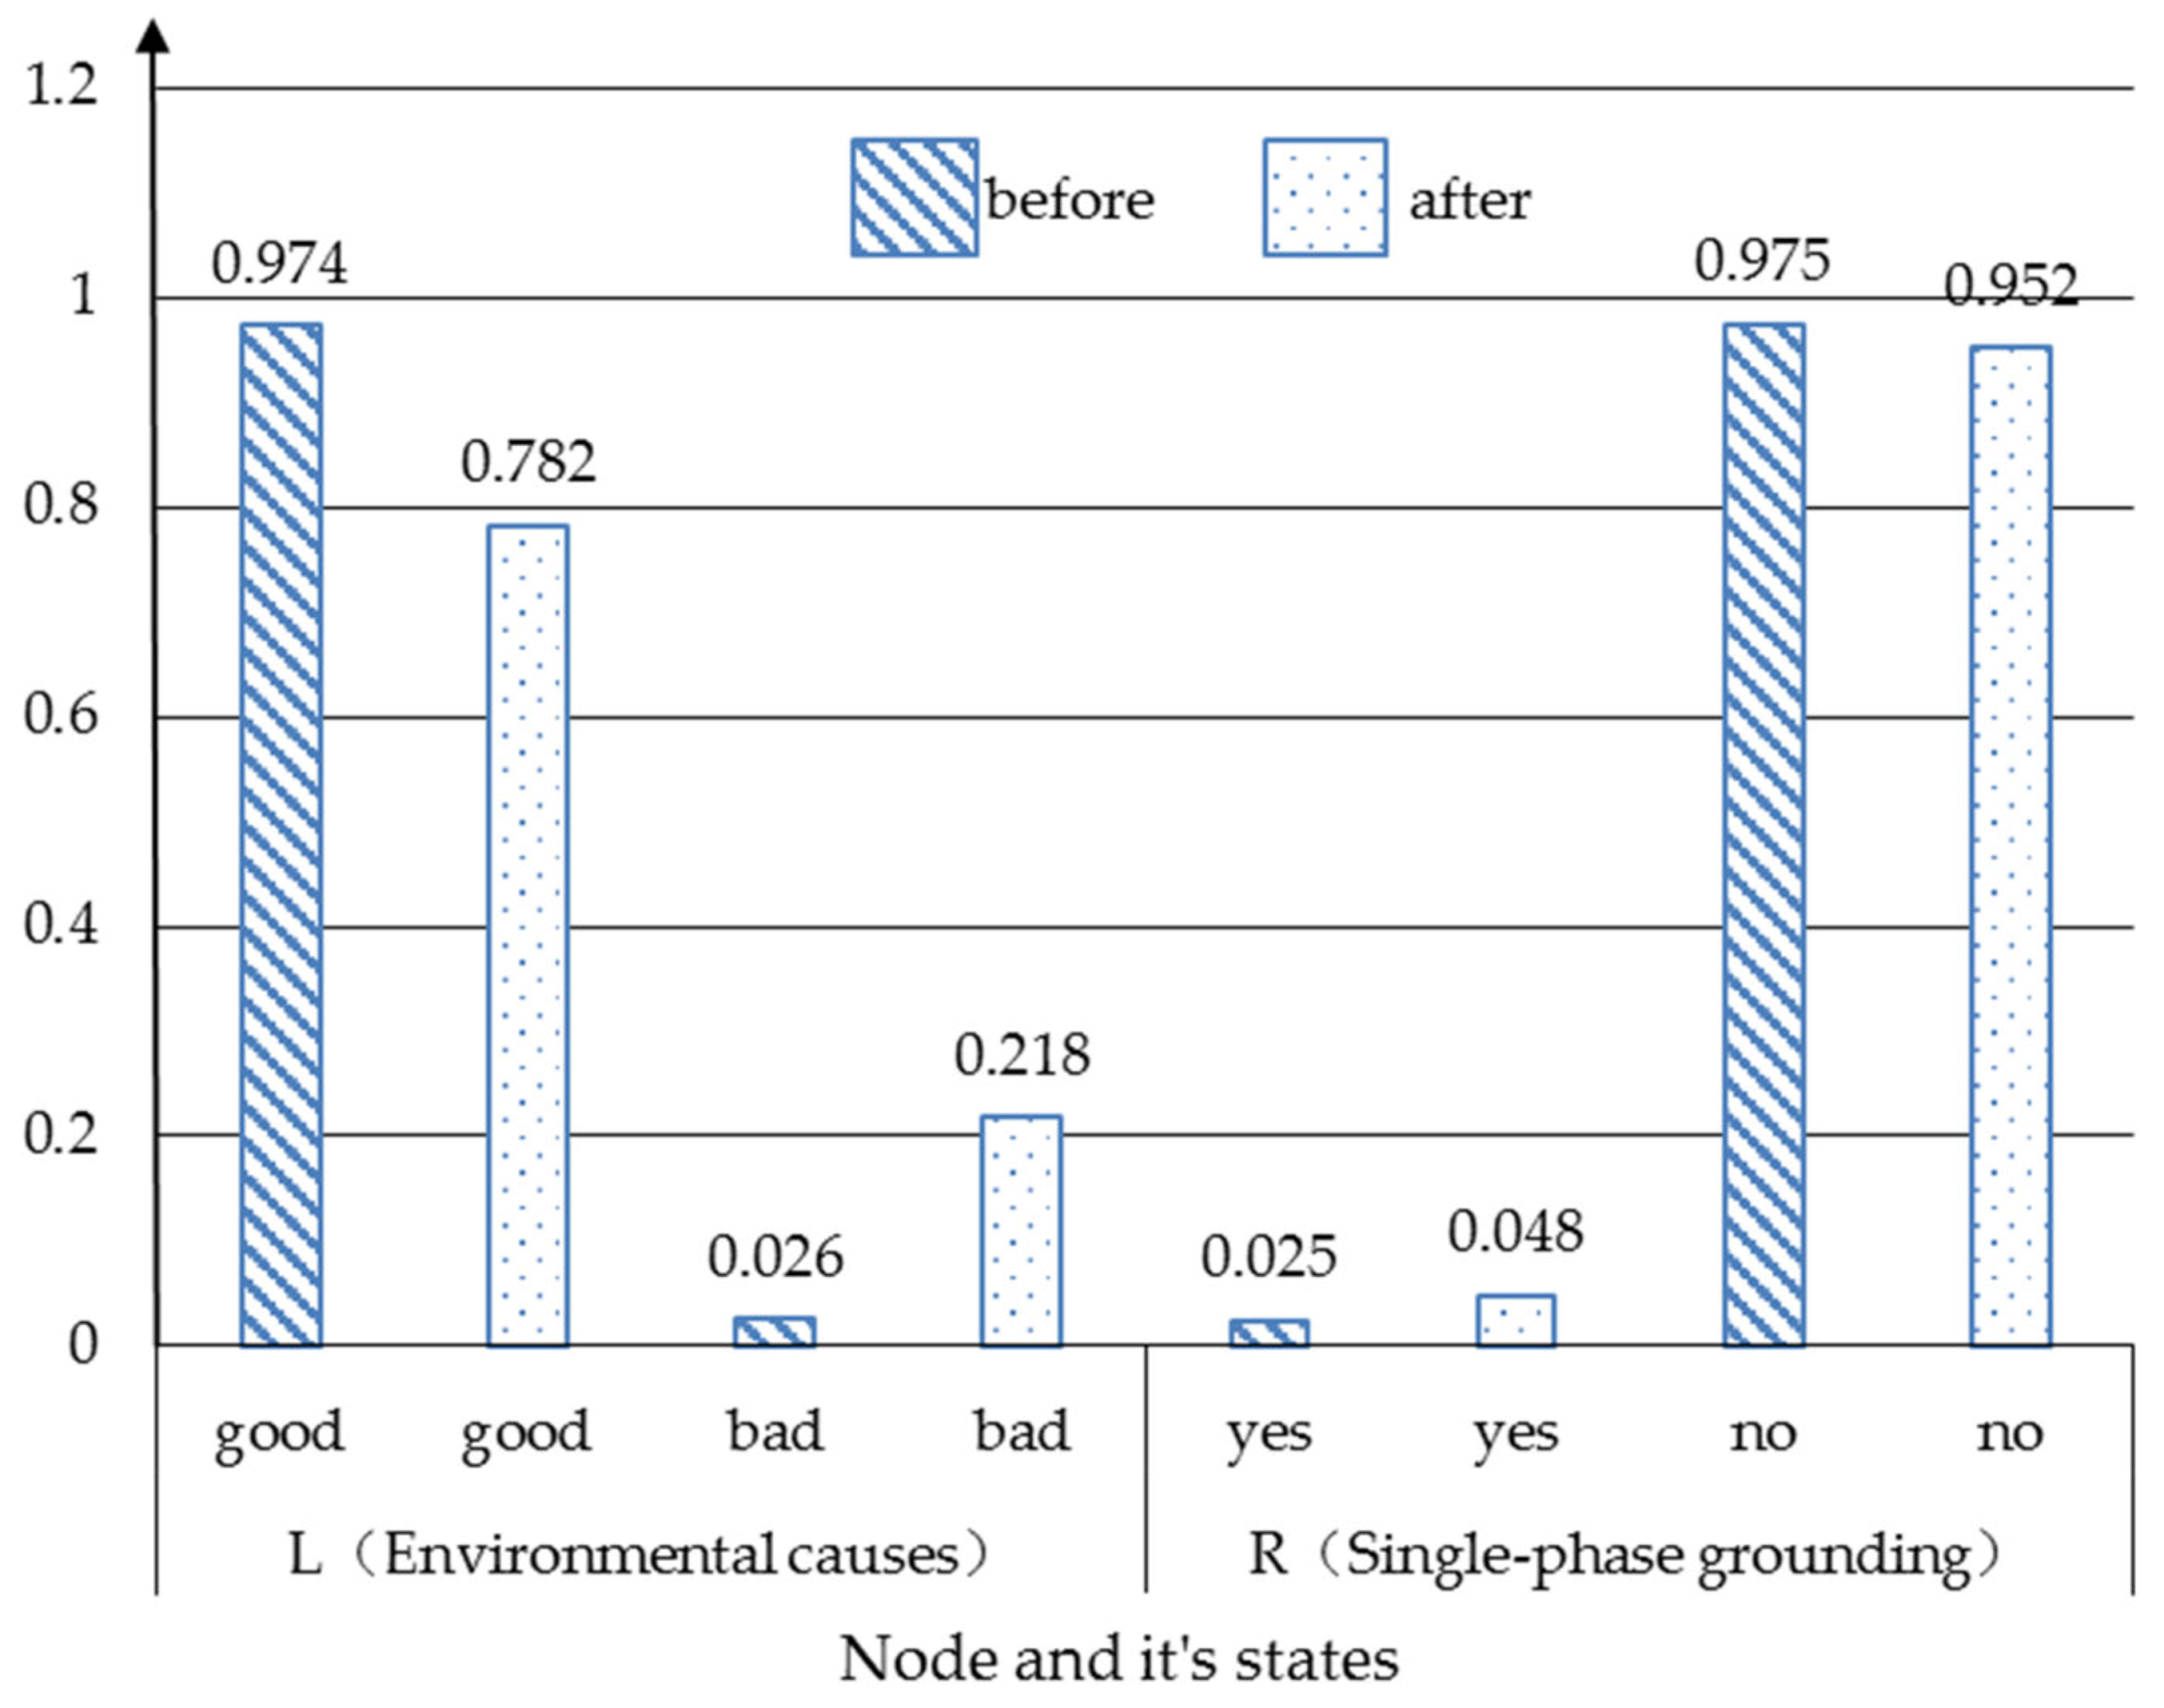
5.1. SA for “Environmental Causes”, “Improper Management”, “Human Causes” and “Equipment Failure”
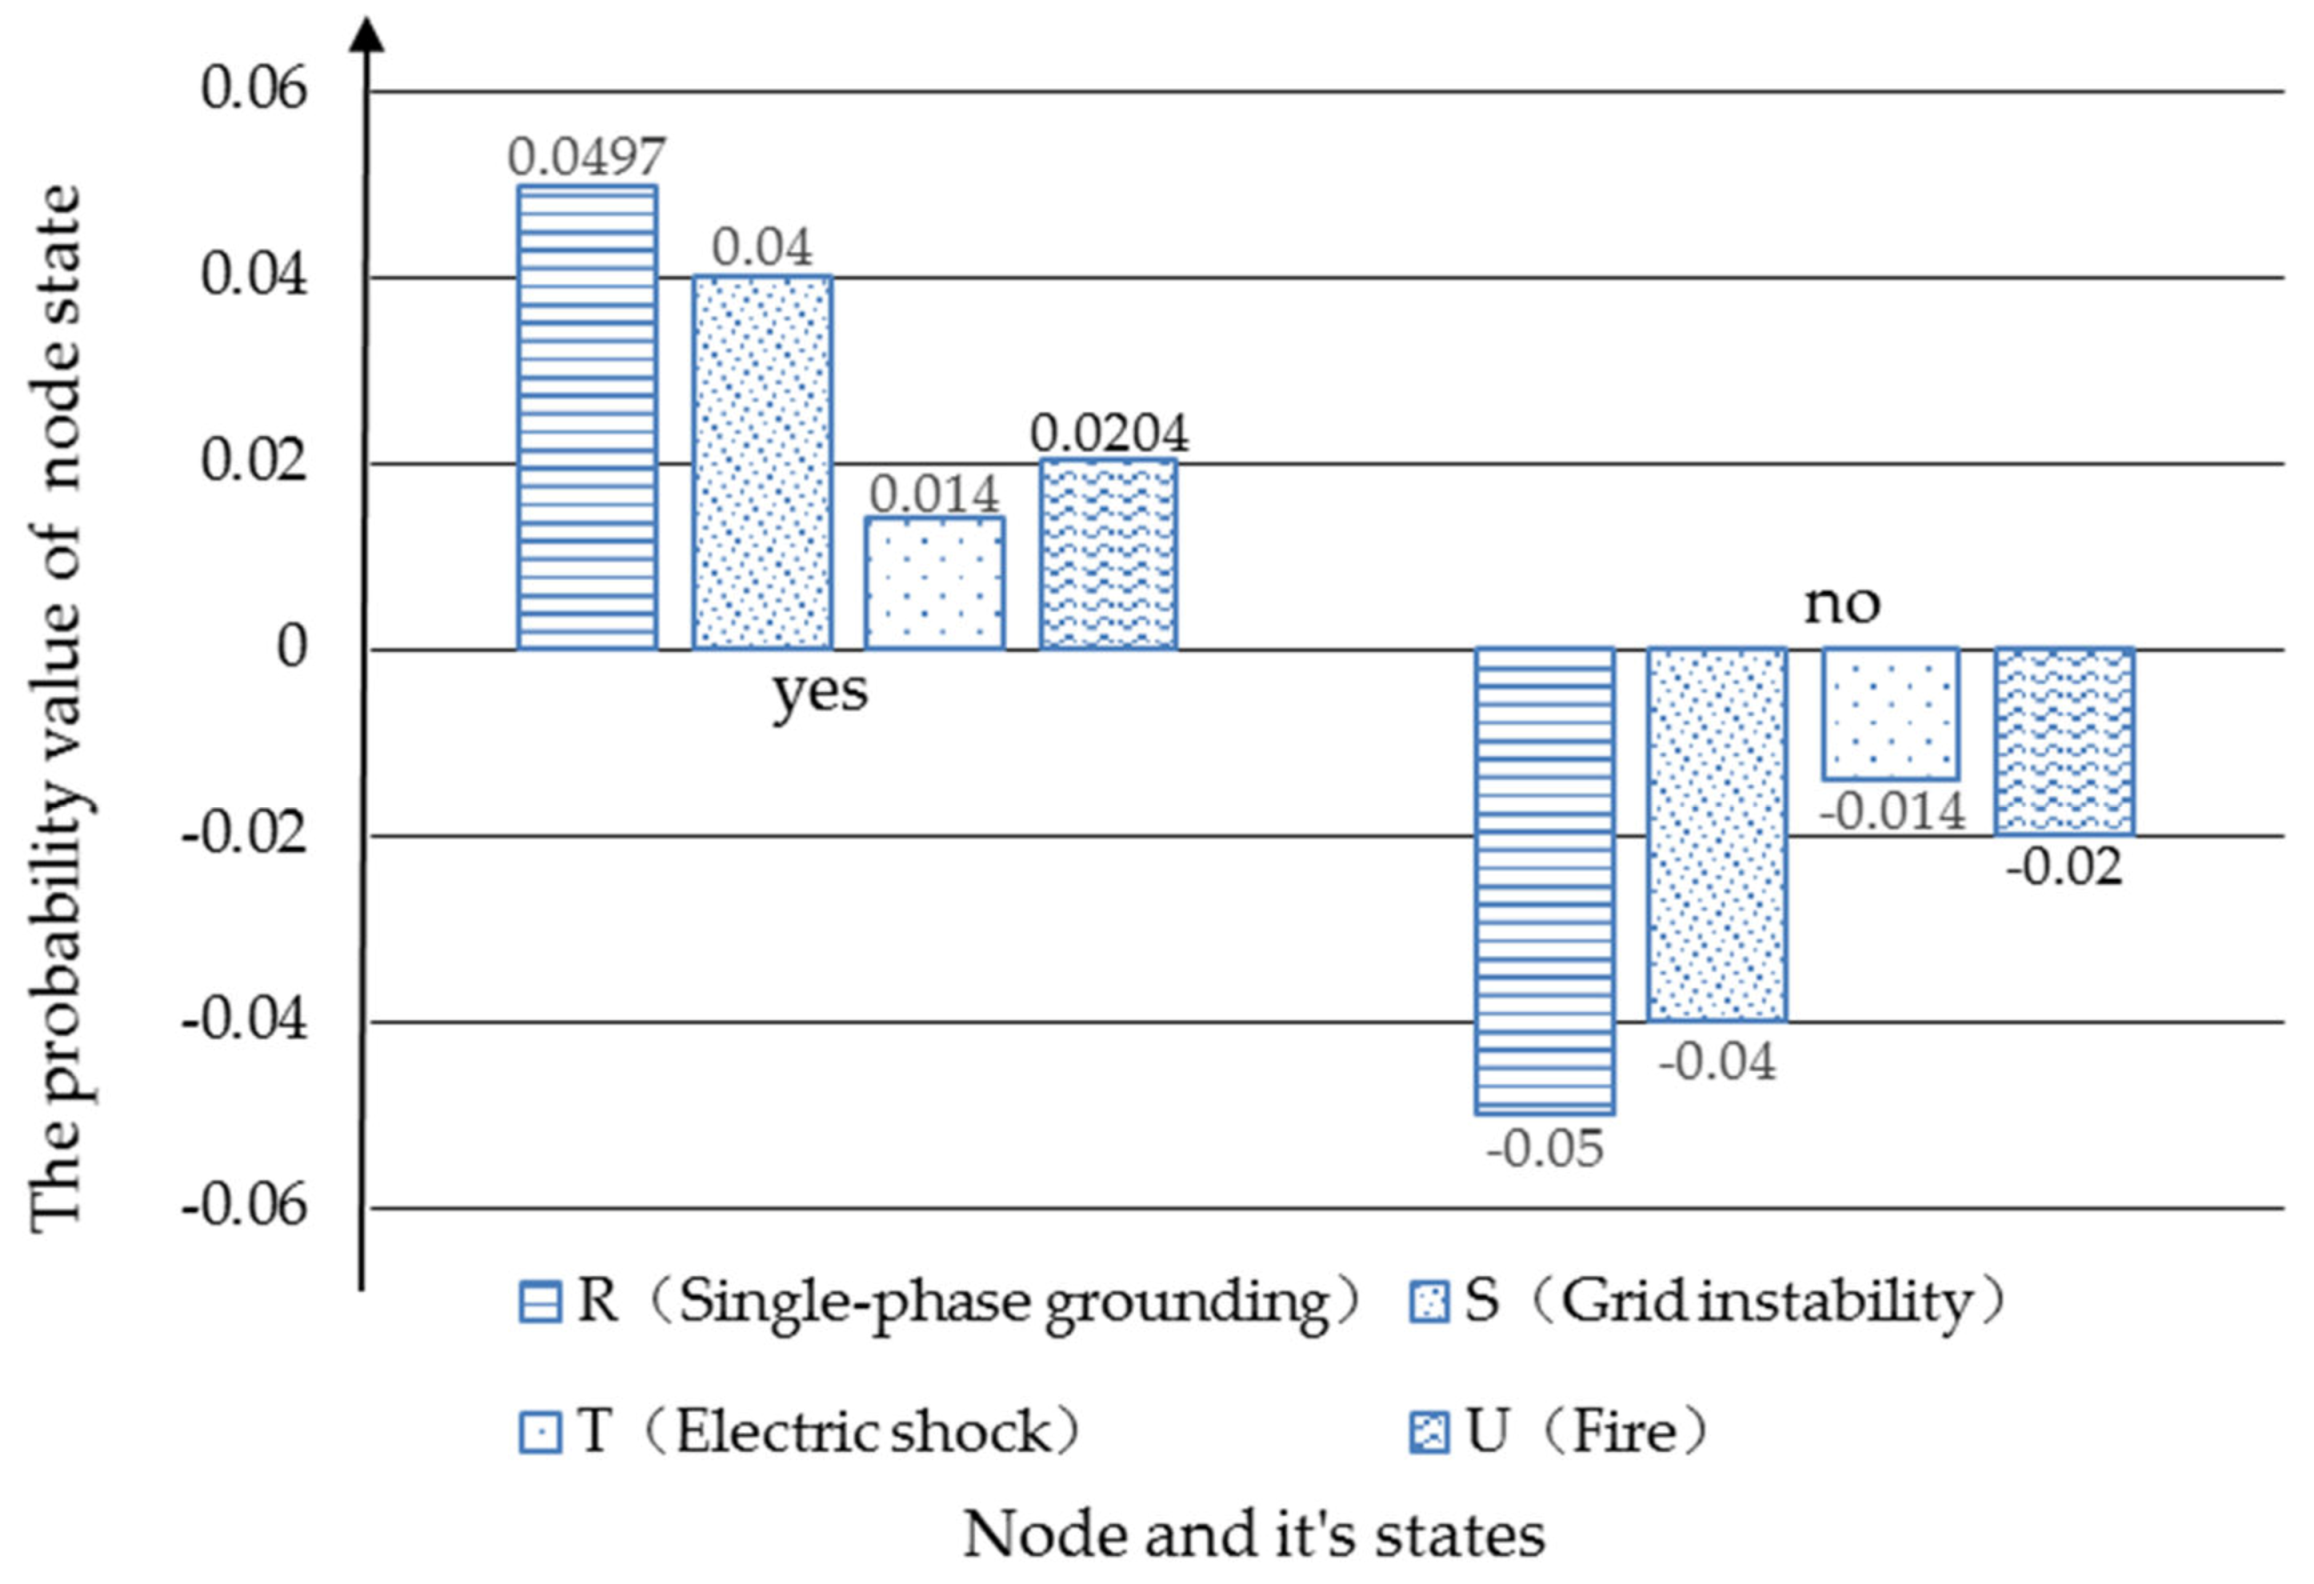
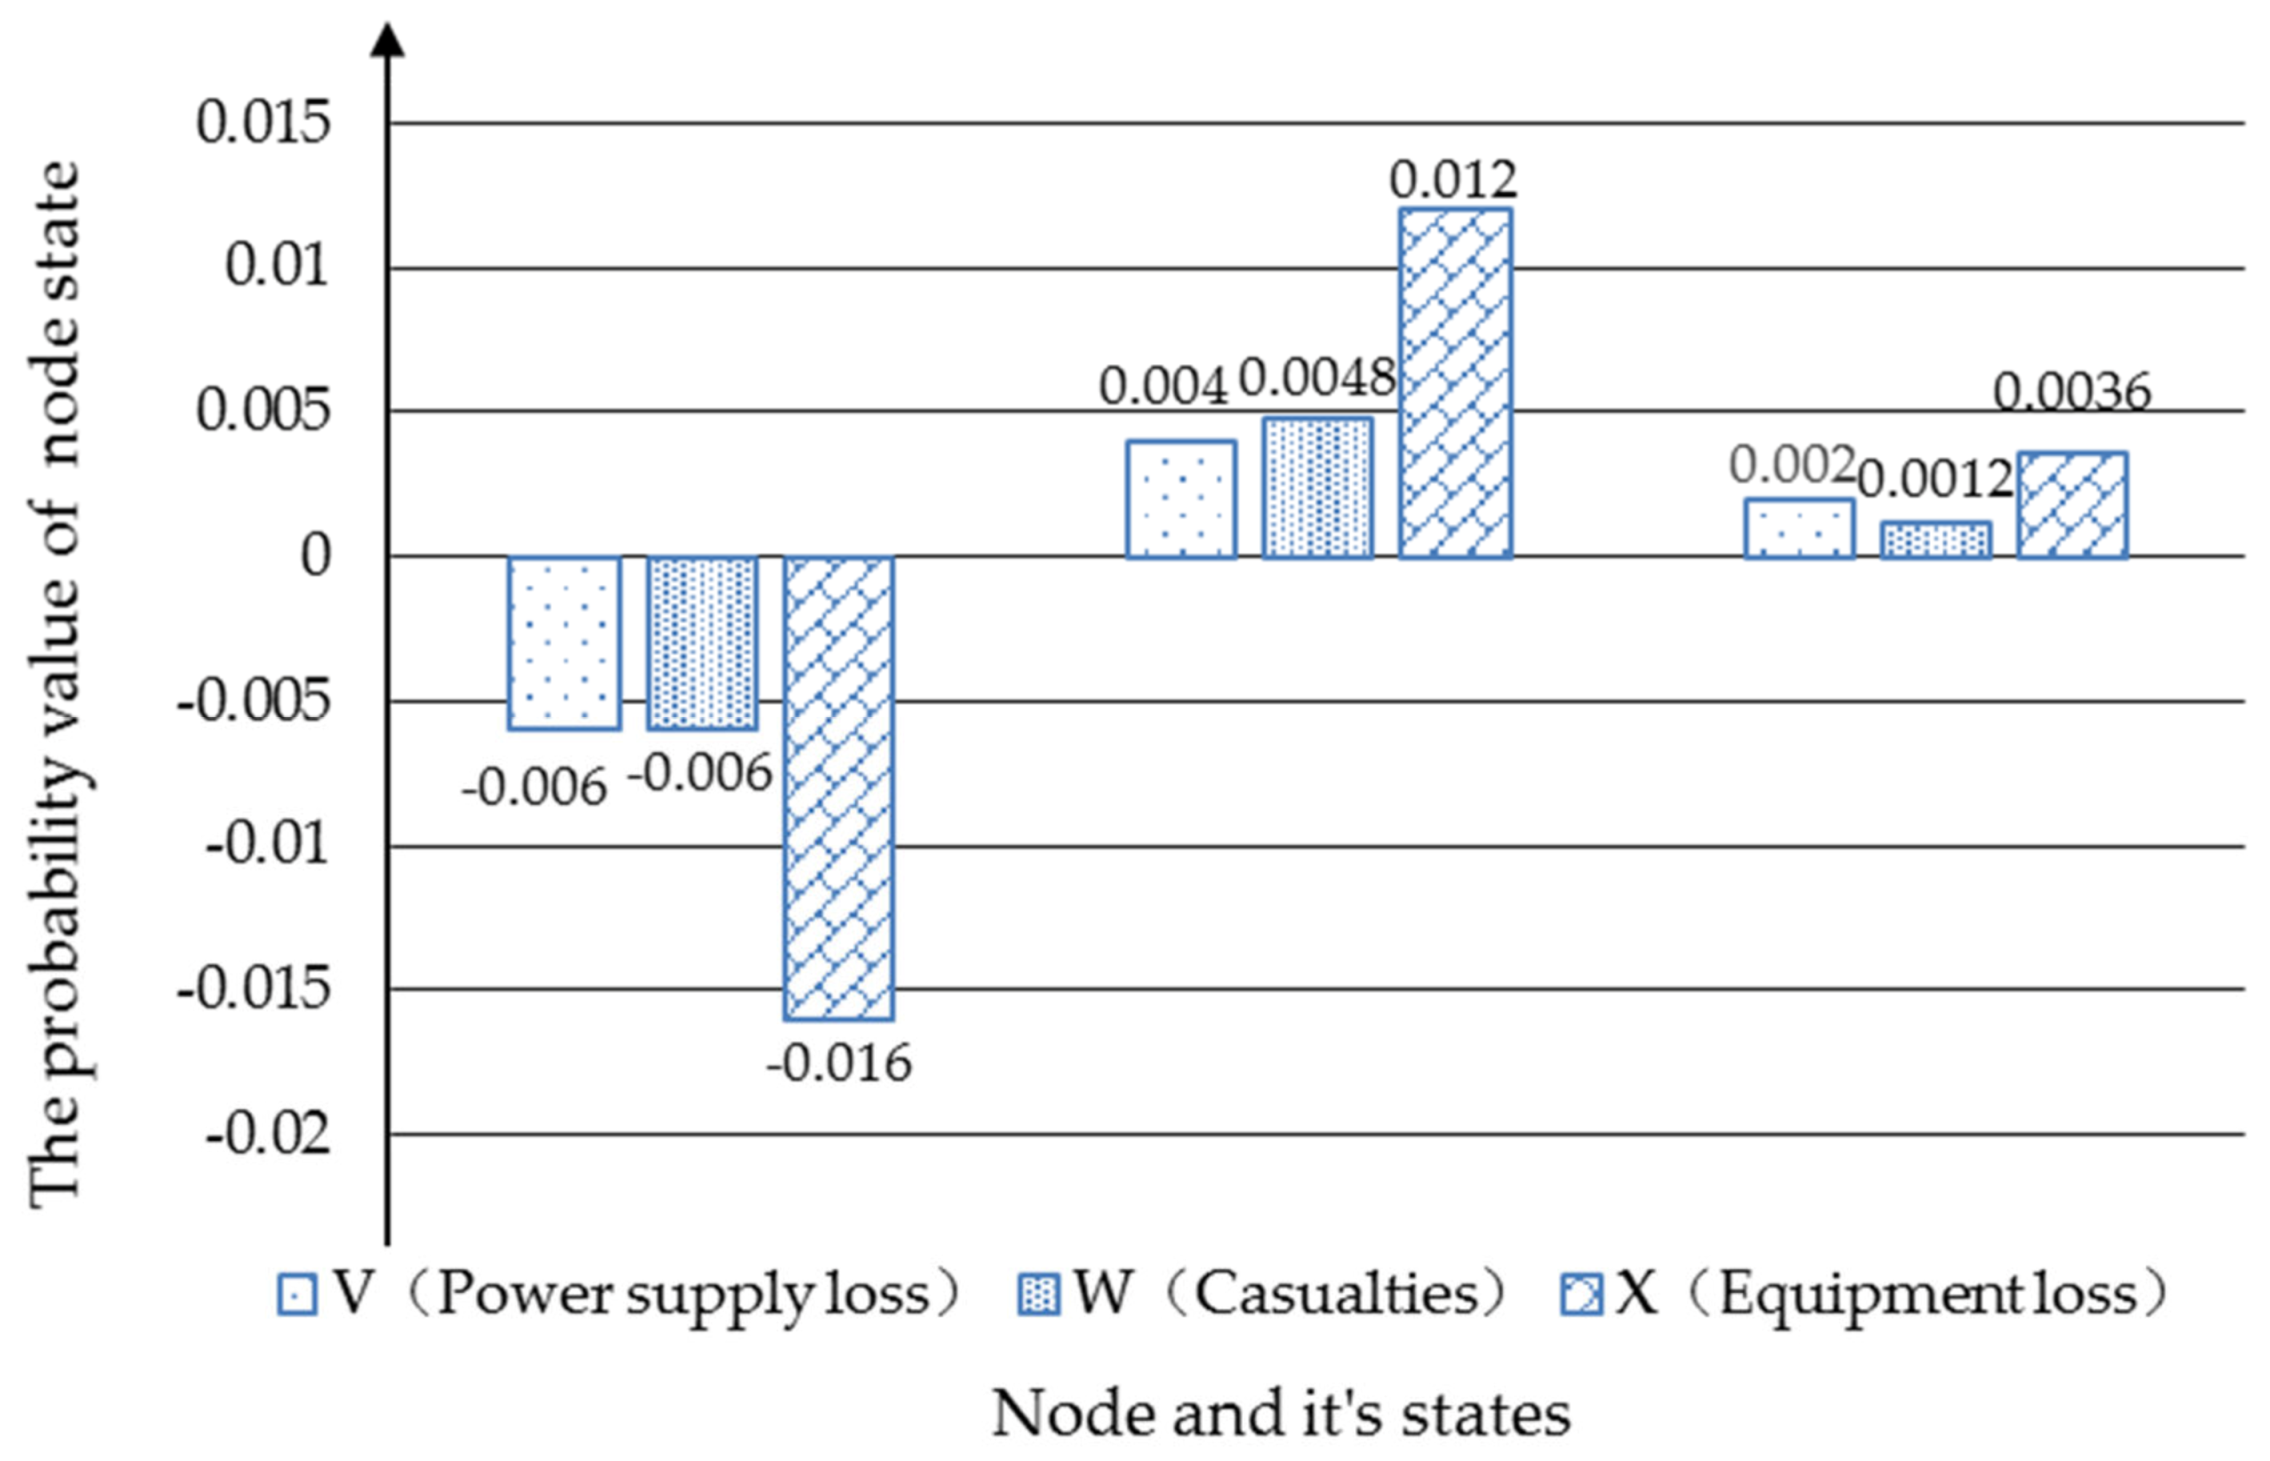
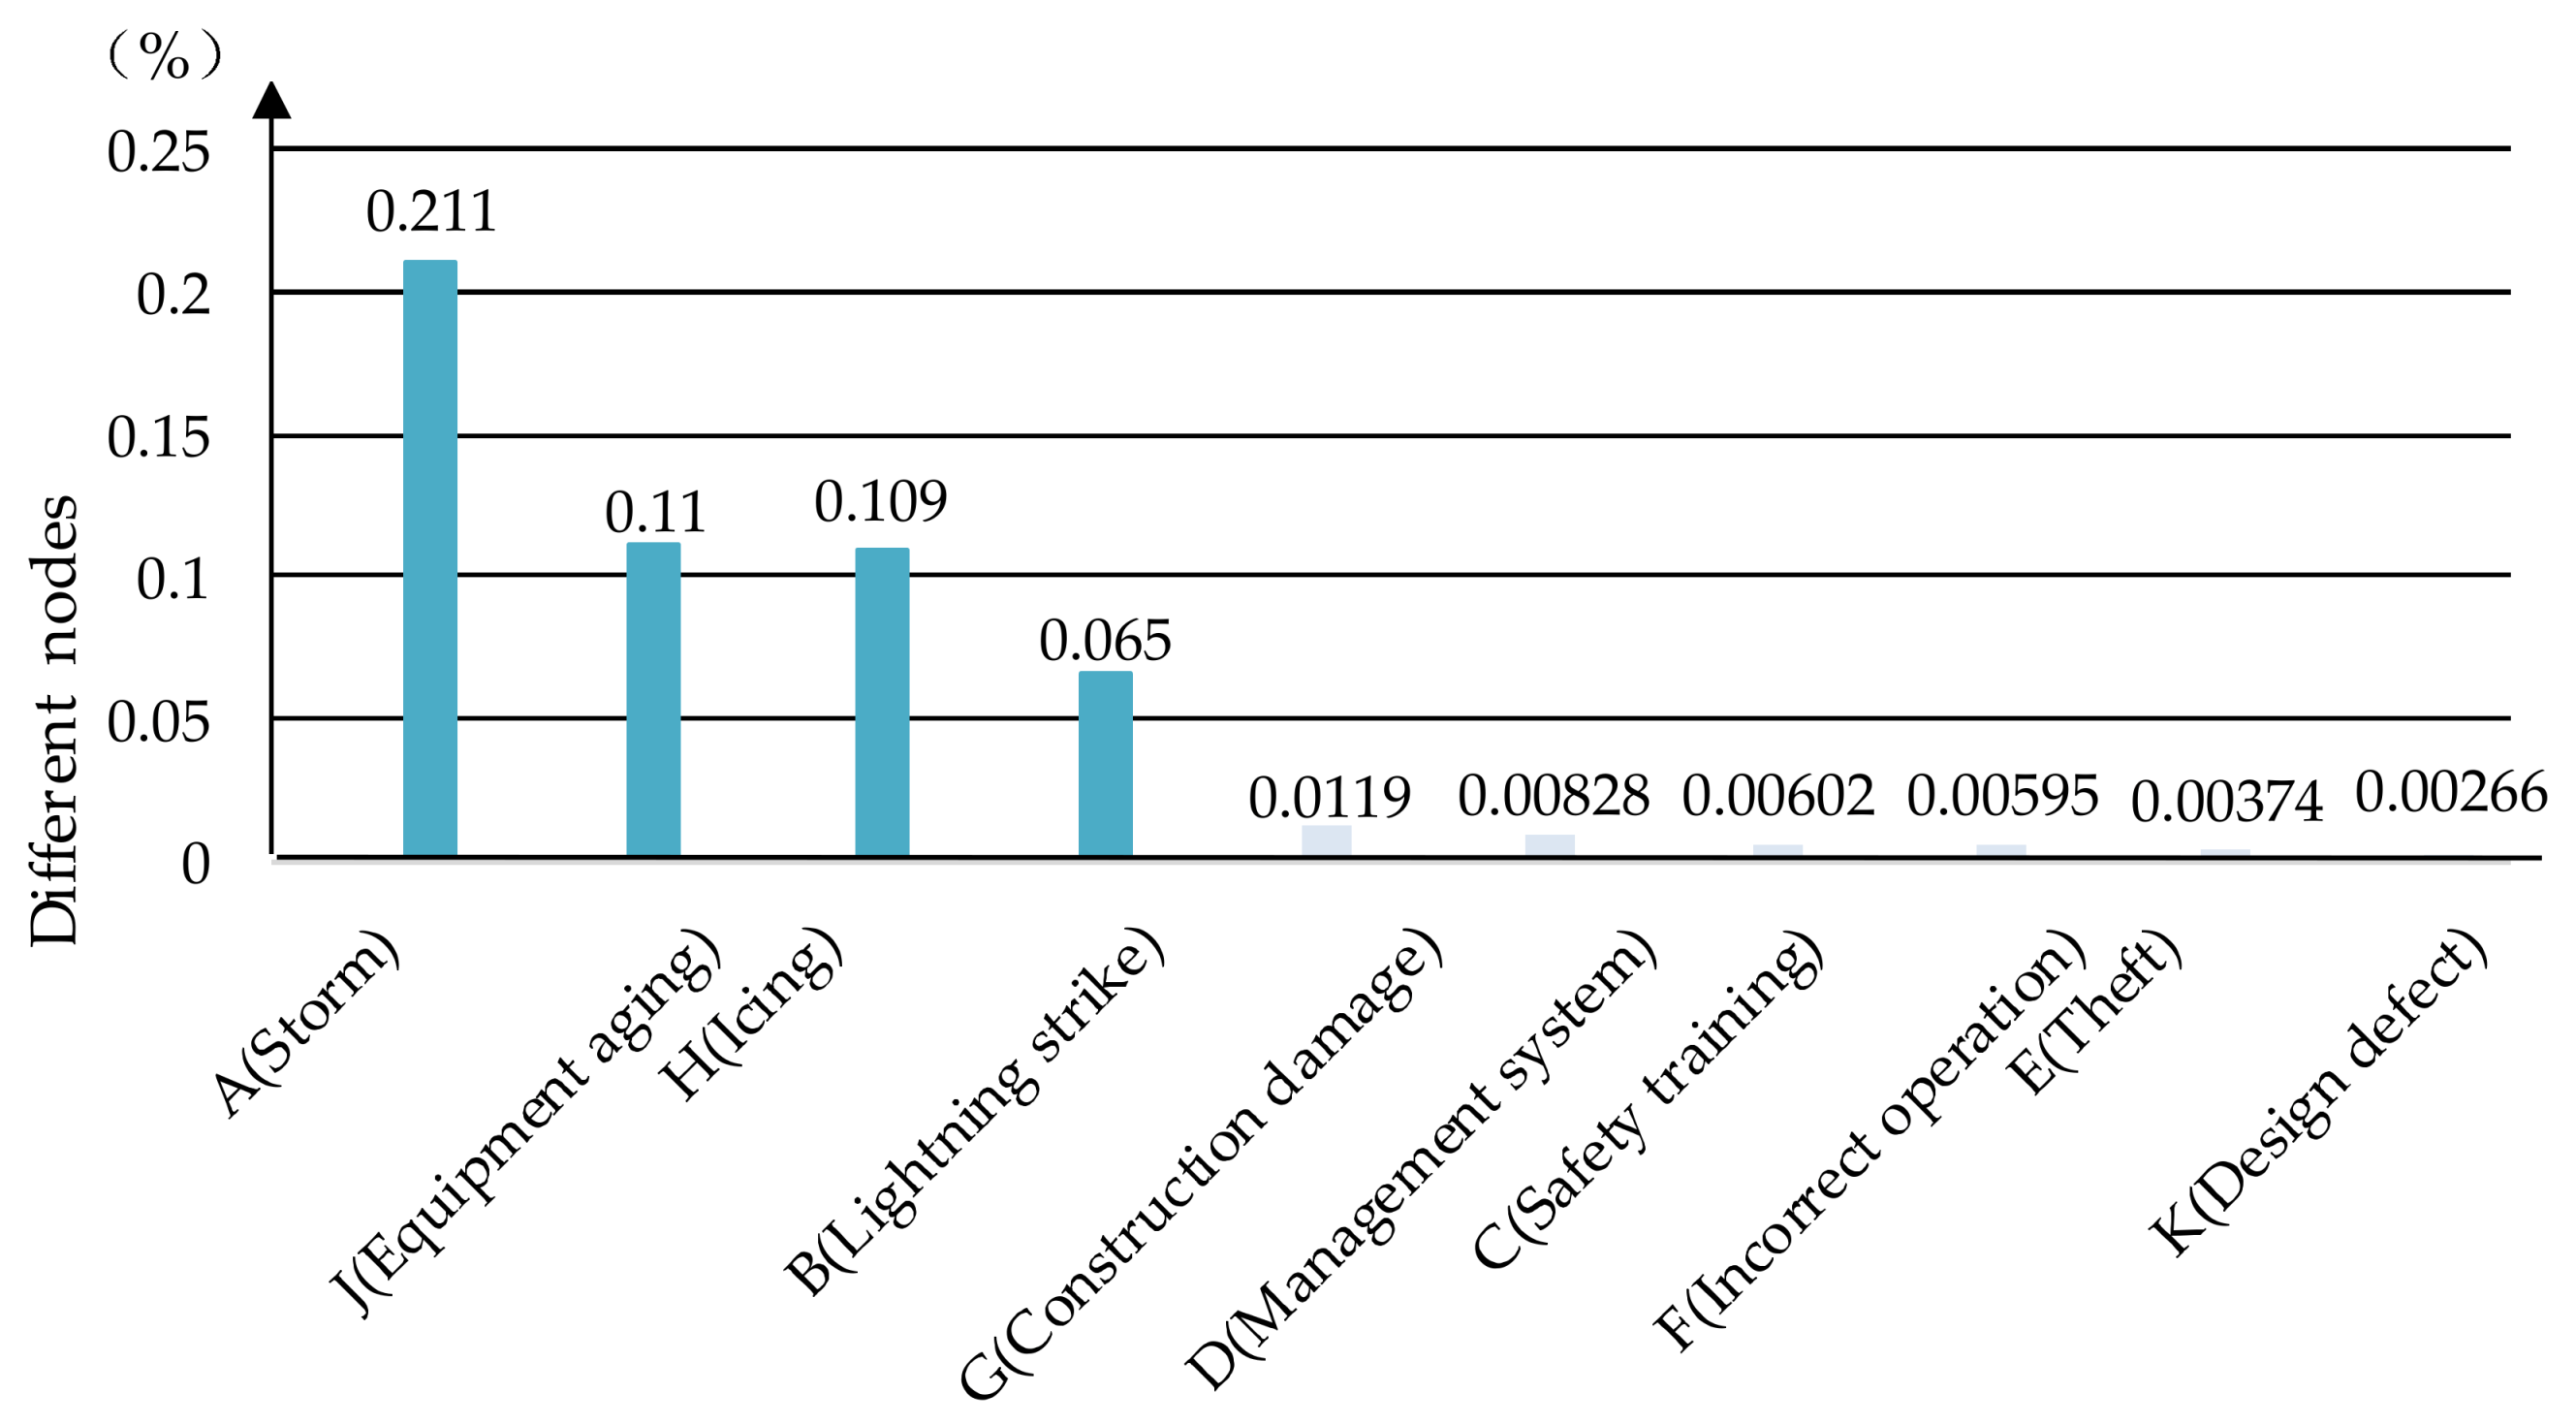
5.2. SA for “Single-Phase Grounding”
6. Conclusions
Author Contributions
Funding
Conflicts of Interest
References
- BP Statistical Review of World Energy 2019. Available online: https://www.bp.com/en/global/corporate/energy-economics/statistical-review-of-world-energy.html (accessed on 10 December 2019).
- Xue, Y.S.; Xiao, S.J. Generalized congestion of power systems: Insights from the massive blackouts in India. J. Mod. Power Syst. Clean 2013, 1, 91–100. [Google Scholar] [CrossRef]
- Zou, J.F.; Zhang, X.L. The blackouts and their implications in Brazil 2009·11·10 and 2011·2·4. Elec. Power. 2011, 44, 19–22. [Google Scholar]
- Andersson, G.; Donalek, P.; Farmer, R.; Hatziargyriou, N.; Kamwa, I.; Kundur, P.; Martins, N.; Paserba, J.; Pourbeik, P.; Sanchez-Gasca, J.; et al. Causes of the 2003 major grid blackouts in North America and Europe, and recommended means to improve system dynamic performance. IEEE Trans. Power Syst. 2005, 20, 1922–1928. [Google Scholar] [CrossRef]
- Ge, R.; Dong, Y.; Lv, Y.C. Analysis of large-scale blackout in UCTE power grid and lessons to be drawn to PGOC. Power Syst. Technol. 2007, 3, 1–6. [Google Scholar]
- Pan, L.Q.; Zhang, W.L.; Tang, J.H.; Zhou, Y. Overview of the extraordinary serious ice calamity to Hunan power grid in 2008. Power Syst. Technol. 2008, 32, 20–25. [Google Scholar]
- Zhu, Y.L. Electric Power System Analysis, 1st ed.; China Machine Press: Beijing, China, 2012. [Google Scholar]
- A Brief Introduction of State Grid Corporation of China. Available online: http://www.sgcc.com.cn/html/sgcc_main/col2017041241/column_2017041241_1.shtml (accessed on 9 December 2019).
- Han, F.C.; Dong, B.Z.; Jia, L.L.; Zhou, G.H.; Kou, A.G. Operation state evaluation of overhead transmission lines based on Bayesian network. Proc. Chin. Soc. Univ. Electr. Power Syst. Autom. 2008, 1, 101–104. [Google Scholar]
- Duan, Q.C.; Zhou, H.X.; Cheng, Y.F.; Zhang, G.F. Application of Bayesian network in transmission lines running state prediction. Comput. Sci. 2012, 39, 83–87. [Google Scholar]
- Wen, Z.; Lu, Z.P.; Zhu, B.Y.; Wu, J.H.; Tan, K.Q. Operation state evaluation of transmission systems based on Bayesian network. Electr. Switchgear 2015, 5, 41–44. [Google Scholar]
- Lin, B.K. Research and Implementation of Evaluation System of Operation State for Overhead Transmission Lines Based on the Bidirectional Bayesian Network. Master’s Thesis, South China University of Technology, Guangzhou, China, 10 June 2015. [Google Scholar]
- Ji, H.; Liu, X.P.; Zhu, W. A comprehensive state evaluation method for UHV transmission lines based on Bayesian network with GeNIe. Shanghai Electr. Power 2011, 24, 14–20. [Google Scholar]
- Teive, R.C.G.; Coelho, J.; Camargo, C.C.B.; Charles, P.C.; Lange, T.; Cimino, L. A Bayesian Network approach to fault diagnosis and prognosis in power transmission systems. In Proceedings of the 2011 16th International Conference on Intelligent System Applications to Power Systems, Hersonissos, Greece, 25–28 September 2011. [Google Scholar]
- Shen, X.K. Dynamic Bayesian Networks for Transmission Line Fault Diagnosis under Robot Inspection. Master’s Thesis, North China Electric Power University, Guangzhou, China, 17 March 2014. [Google Scholar]
- Zhu, Y.L.; Huo, L.M.; Lu, J.L. Bayesian Networks-Based Approach for Power Systems Fault Diagnosis. IEEE Trans. Power Deliv. 2006, 21, 634–639. [Google Scholar]
- Yang, J.Z.; Song, Y.B. Bayesian Model Based Services Awareness of Power Line Communications for Smart Power Grid. In Proceedings of the 2nd IEEE Advanced Information Management, Communicates, Electronic and Automation Control Conference (IMCEC 2018), Xi’an, China, 25–27 May 2018. [Google Scholar]
- Lesmantas, T.; Alzbutas, R. Bayesian assessment of electrical power transmission grid outage risk. Int. J. Elect. Power 2014, 58, 85–90. [Google Scholar] [CrossRef]
- Iamsumang, C.; Mosleh, A.; Modarres, M. Monitoring and learning algorithms for dynamic hybrid Bayesian network in on-line system health management applications. Reliab. Eng. Syst. Saf. 2018, 178, 119–129. [Google Scholar] [CrossRef]
- Velasquez, R.M.A. Performance improvement in long overhead lines associated to single-phase faults due to atmospheric discharges. Eng. Fail. Anal. 2019, 105, 347–372. [Google Scholar] [CrossRef]
- Li, H.F.; Chen, J.Q.; Liang, Y.S.; Liao, F.Q.; Wang, G. Effects of imbalance on single-phase to ground fault characteristics in low-resistance grounded systems. Int. J. Elect. Power 2020, 115. [Google Scholar] [CrossRef]
- Wang, Y.Y.; Zhou, J.M.; Wei, G.; Dong, Z.Y.; Chen, H.W. Stator winding single-phase grounding faults protective scheme based on discriminant analysis for Powerformers with selectivity. Int. J. Elect. Power 2016, 77, 145–150. [Google Scholar] [CrossRef]
- Han, L.N.; Ma, Q.; Zhang, F.; Zhang, Y.; Zhang, J.; Bao, Y.; Zhao, J. Risk Assessment of An Earthquake-Collapse-Landslide Disaster Chain by Bayesian Network and Newmark Models. Int. J. Environ. Res. Public Health 2019, 16, 3330. [Google Scholar] [CrossRef]
- Zhang, C.; Wu, J.S.; Hu, X.F.; Ni, S.J. A probabilistic analysis model of oil pipeline accidents based on an integrated Event-Evolution-Bayesian (EEB) model. Procss Saf. Environ. Prot. 2018, 117, 694–703. [Google Scholar] [CrossRef]
- Wu, J.; Zhou, R.; Xu, S.; Wu, Z. Probabilistic analysis of natural gas pipeline network accident based on Bayesian network. J. Loss Prevent. Process 2017, 46, 126–136. [Google Scholar] [CrossRef]
- Boutilier, C.; Friedman, N.; Goldszmidt, M.; Koller, D. Context-specific independence in Bayesian networks. In Proceedings of the Twelfth International Conference on Uncertainty in Artificial Intelligence, Portland, OR, USA, 1–4 August 1996. [Google Scholar]
- Wu, J.; Xu, S.; Zhou, R.; Qin, Y. Scenario analysis of mine water inrush hazard using Bayesian networks. Saf. Sci. 2016, 89, 231–239. [Google Scholar] [CrossRef]
- Chan, A.P.C.; Wong, F.K.W.; Hon, C.K.H.; Choi, T.N.Y. A Bayesian Network Model for Reducing Accident Rates of Electrical and Mechanical (E&M) Work. Int. J. Environ. Res. Public Health 2018, 15, 2496. [Google Scholar]
- Fang, W.; Wu, J.; Bai, Y.; Zhang, L. Quantitative Risk Assessment of a Natural Gas Pipeline in an Underground Utility Tunnel. Process Saf. Prog. 2019. [Google Scholar] [CrossRef]
- Atoui, M.A.; Cohen, A.; Verron, S.; Kobi, A. A single Bayesian network classifier for monitoring with unknown classes. Eng. Appl. Artif. Intel. 2019, 85, 681–690. [Google Scholar] [CrossRef]
- Badreddine, A.; Amor, N.B. A Bayesian approach to construct bow tie diagrams for risk evaluation. Process Saf. Environ. 2013, 91, 159–171. [Google Scholar] [CrossRef]
- Khakzad, N.; Khan, F.; Amyotte, P. Dynamic risk analysis using bow-tie approach. Reliab. Eng. Syst. Saf. 2012, 104, 36–44. [Google Scholar] [CrossRef]
- Markowski, A.S.; Kotynia, A.; Kotynia, A. “Bow-tie” model in layer of protection analysis. Process Saf. Environ. 2011, 89, 205–213. [Google Scholar] [CrossRef]
- Ferdous, R.; Khan, F.; Sadiq, R.; Amyotte, P.; Veitch, B. Handling and updating uncertain information in bow-tie analysis. J. Loss Prevent. Proc. 2012, 25, 8–19. [Google Scholar] [CrossRef]
- Vileiniskis, M.; Remenyte-Prescott, R. Quantitative risk prognostics framework based on Petri Net and Bow-Tie models. Reliab. Eng. Syst. Saf. 2017, 165, 62–73. [Google Scholar] [CrossRef]
- Blair, S.; Uhl, N.P. Using the Delphi Method to Improve the Curriculum. Can. J. High. Educ. 1993, 23, 107–128. [Google Scholar]
- Kalaian, S.A.; Kasim, R.M. Terminating sequential Delphi survey data collection, practical assessment. Res.Evaluat. 2012, 17, 10. [Google Scholar]
- Belton, I.; MacDonald, A.; Wright, G.; Hamlin, I. Improving the practical application of the Delphi method in group-based judgment: A six-step prescription for a well-founded and defensible process. Technol. Forecast. Soc. 2019, 147, 72–82. [Google Scholar] [CrossRef]
- Mbakwe, A.C.; Saka, A.A.; Choi, K.; Lee, Y.J. Alternative method of highway traffic safety analysis for developing countries using delphi technique and Bayesian network. Accid. Anal. Prev. 2016, 93, 135–146. [Google Scholar] [CrossRef] [PubMed]
- Zangenehmadar, Z.; Moselhi, O. Prioritizing deterioration factors of water pipelines using Delphi method. Measurement 2016, 90, 491–499. [Google Scholar] [CrossRef]


| Bayesian Nodes | State of Bayesian Nodes | Probability of Each State (%) |
|---|---|---|
| Storm | ①slight | 87.16 |
| ②medium | 12.8 | |
| ③severe | 0.04 | |
| Icing | ①slight | 98.69 |
| ②severe | 1.31 | |
| Lightning strike | ①slight | 99.3 |
| ②severe | 0.7 | |
| Safety training | ①good | 98.3 |
| ②insufficient | 1.7 | |
| Management system | ①sound | 97.52 |
| ②unsound | 2.48 | |
| Theft | ①yes | 0.12 |
| ②no | 99.88 | |
| Construction damage | ①yes | 0.37 |
| ②no | 99.62 | |
| Incorrect operation | ①yes | 0.26 |
| ②no | 99.74 | |
| Equipment aging | ①slight | 98.60 |
| ②severe | 1.40 | |
| Design defect | ①yes | 0.07 |
| ②no | 99.93 |
| BN Nodes | Expert’s Opinion | ||||||
|---|---|---|---|---|---|---|---|
| Safety training | Management system | m1(1,2) | m2(1,2) | m3(1,2) | M4(1,2) | M5(1,2) | M6(1,2) |
| good | sound | (1.01, 98.99) | (1.08, 98.92) | (1.05, 98.95) | (0.98, 99.02) | (0.96, 99.04) | (1.04, 98.96) |
| good | unsound | (16.85, 83.15) | (18.06, 81.94) | (17.50, 82.50) | (16.96, 83.04) | (17.23, 82.77) | (16.84, 83.16) |
| insufficient | sound | (17.85, 82.15) | (16.96, 83.04) | (18.83, 81.17) | (18.05, 81.95) | (18.15, 81.85) | (16.54, 83.46) |
| insufficient | unsound | (21.50, 78.50) | (22.05, 77.95) | (21.88, 78.12) | (21.50, 78.50) | (22.10, 77.90) | (22.07, 77.93) |
© 2020 by the authors. Licensee MDPI, Basel, Switzerland. This article is an open access article distributed under the terms and conditions of the Creative Commons Attribution (CC BY) license (http://creativecommons.org/licenses/by/4.0/).
Share and Cite
Zhang, J.; Bian, H.; Zhao, H.; Wang, X.; Zhang, L.; Bai, Y. Bayesian Network-Based Risk Assessment of Single-Phase Grounding Accidents of Power Transmission Lines. Int. J. Environ. Res. Public Health 2020, 17, 1841. https://doi.org/10.3390/ijerph17061841
Zhang J, Bian H, Zhao H, Wang X, Zhang L, Bai Y. Bayesian Network-Based Risk Assessment of Single-Phase Grounding Accidents of Power Transmission Lines. International Journal of Environmental Research and Public Health. 2020; 17(6):1841. https://doi.org/10.3390/ijerph17061841
Chicago/Turabian StyleZhang, Jun, Haifeng Bian, Huanhuan Zhao, Xuexue Wang, Linlin Zhang, and Yiping Bai. 2020. "Bayesian Network-Based Risk Assessment of Single-Phase Grounding Accidents of Power Transmission Lines" International Journal of Environmental Research and Public Health 17, no. 6: 1841. https://doi.org/10.3390/ijerph17061841
APA StyleZhang, J., Bian, H., Zhao, H., Wang, X., Zhang, L., & Bai, Y. (2020). Bayesian Network-Based Risk Assessment of Single-Phase Grounding Accidents of Power Transmission Lines. International Journal of Environmental Research and Public Health, 17(6), 1841. https://doi.org/10.3390/ijerph17061841