Article

Cluster Analysis of Health-Related Lifestyles in University Students

by
Miquel Bennasar-Veny
1,
Aina M. Yañez
2,*,
Jordi Pericas
1,
Lluis Ballester
3,
Juan Carlos Fernandez-Dominguez
1,
Pedro Tauler
4 and
Antoni Aguilo
1,4
1
Department of Nursing and Physiotherapy, Balearic Islands University, Cra. de Valldemossa, Km 7.5, 07122 Palma, Illes Balears, Spain
2
Research Group on Global Health & Human Development, Balearic Islands University, Cra. de Valldemossa, Km 7.5, 07122 Palma, Illes Balears, Spain
3
Department of Specific Didactics and Pedagogy, Educational and Social Research and Training Research Group, Balearic Islands University, Cra. de Valldemossa, Km 7.5, 07122 Palma, Illes Balears, Spain
4
Research Group on Evidence, lifestyles and Health Research, Instituto de Investigación Sanitaria Illes Balears, Cra. de Valldemossa, Km 7.5, 07122 Palma, Illes Balears, Spain
*
Author to whom correspondence should be addressed.
Int. J. Environ. Res. Public Health 2020, 17(5), 1776; https://doi.org/10.3390/ijerph17051776
Submission received: 5 February 2020 / Revised: 5 March 2020 / Accepted: 7 March 2020 / Published: 9 March 2020
(This article belongs to the Section Health Behavior, Chronic Disease and Health Promotion)

Abstract

:
Health-related lifestyles in young adults are a public health concern because they affect the risk for developing noncommunicable diseases. Although unhealthy lifestyles tend to cluster together, most studies have analyzed their effects as independent factors. This study assessed the prevalence, association, and clustering of health-related lifestyles (smoking, alcohol consumption, physical activity, and quality of diet) among university students. This cross-sectional study examined a sample of student participants from the University of the Balearic Islands (n = 444; 67.8% females; mean age: 23.1 years). A self-reported questionnaire was used to assess health-related lifestyles. Men that consumed more alcohol, had less healthy diets, were more likely to be overweight, and performed more physical activity. Women had a higher prevalence of low weight and performed less physical activity. Physical activity had a negative association with time using a computer (OR: 0.85; 95% CI: 0.76, 0.95) and a positive association with adherence to the Mediterranean diet (OR: 1.16; 95% CI: 1.02, 1.32). Adherence to the Mediterranean diet had a negative association with tobacco consumption (OR: 0.52; 95% CI: 0.30, 0.91), and positive associations with having breakfast every day (OR: 1.70; 95% CI: 1.05, 2.76) and consuming more daily meals (OR: 1.43; 95% CI: 1.10, 1.87). Cluster analysis indicated the presence of three distinct groups: Unhealthy lifestyles with moderate risk; unhealthy lifestyles with high risk; and healthy lifestyles with low risk. Health promotion interventions in the university environment that focus on multiple lifestyles could have a greater effect than interventions that target any single lifestyle.

1. Introduction

Previous research reported that modifiable unhealthy lifestyles, such as smoking, poor diet, physical inactivity, and alcohol consumption, independently contributed to increased premature morbimortality and development of noncommunicable diseases [1,2,3]. The prevalence of unhealthy lifestyles is especially high in young adults, including university students. The global epidemic of overweight and obesity is an important public health concern because it may lead to increases in cardiovascular diseases, metabolic conditions such as type 2 diabetes, and cancer [4].
Lifestyles that begin during adolescence tend to consolidate during youth (when attending a university) and continue throughout adulthood [5]. When an individual enters a university, important changes occur, such as increased individual autonomy, exposure to a new environment and social networks, and less parental control, that can lead to psychological stress [6,7]. Psychological stress is associated with alcohol and tobacco consumption, physical inactivity, and low consumption of fruits and vegetables [5,8,9]. These unhealthy lifestyles, together with socio-economic factors, could negatively impact university students [10]. Other research has suggested an association of health status with sociodemographic, economic, and psychosocial factors [11]. Furthermore, an individual’s perceived state of health is a multifactorial indicator that provides information about the individual’s physical and mental health, and is considered a good predictor of morbidity, mortality, quality of life, and well-being [12,13,14].
Previous studies have evaluated the effects of several single health-related risk factors, but no studies have considered these factors as clustered lifestyles, nor their synergistic effects, in the university environment. However, a few studies reported that unhealthy lifestyles tended to associate with each other [15,16,17,18]. The presence of such clustering could have significant implications for studies of morbidity and mortality, and for the design of preventive and health promotion interventions, because it means that interventions should focus on the whole lifestyle rather, than a single factor [19,20].
To our knowledge, only a few studies have analyzed the relationships of psychological stress, self-perception of health status, quality of life, and multiple health-related lifestyles in university students. The aim of the present study was to assess the prevalence, association, and clustering of major health-related lifestyles—smoking, alcohol consumption, physical activity, and diet quality— with stress, health status, and quality of life among university students.

2. Materials and Methods

2.1. Study Design

This cross-sectional study initially examined a sample of 473 Spanish students from the University of the Balearic Islands. All subjects were 18 to 40 years-old and were enrolled at the university for more than one year. Twenty-nine participants were excluded due to submission of incomplete surveys or questionnaires that were incorrectly completed. Therefore, data from 444 students were used for analysis.

2.2. Sample and Procedure

Participants were recruited using a randomized, multistage, conglomerate procedure, and stratified by an academic major (art and humanities, sciences and health sciences, social and law sciences, and engineering), with the proportion of overall participants recruited in a given academic major being equal to the proportion of students in that major at the university. The randomization unit was academic major in the first stage and academic year in the second stage. The gender, age, and academic major of study participants were similar to those of students overall at the university.

2.3. Measures

The survey was developed from a short version of the Spanish National Health Survey [21] in combination with other validated questionnaires [14,22,23,24], was self-administered with the supervision of trained interviewers, and examined the following parameters.
Demographic and anthropometric characteristics. Age, gender, academic major and year, and self-reported weight and height were collected. Body mass index (BMI) was calculated as kg/m2 and BMI groups were used to classify participants following World Health Organization criteria: Underweight (BMI < 18.5 kg/m2), normal weight (BMI = 18.5 to 24.9 kg/m2), overweight (BMI = 25.0 to 29.9 kg/m2), and obese (BMI ≥ 30.0 kg/m2) [25].
Health status, quality of life, and stress. Self-assessment of health status was used as a global health indicator [14], and self-perceived health status was obtained by the answer to the question: “Within the last 12 months, how do you rate your overall health status?” The five possible answers were “very good”, “good”, “fair”, “bad”, or “very bad”. The participants were categorized into two groups for descriptive analysis; students in one group answered “fair”, “bad”, or “very bad” and students in the other group answered “good” or “very good”. Several studies have shown good test-retest reliability of self-reported health measures, even better than in assessments of more specific health issues [26,27]. Questions about self-perceived quality of life and level of stress, using a Likert scale from 1 (very low) to 5 (very high), were also administered.
Social class. Social class was ascertained from highest parental occupation using the Spanish adaptation of the Goldthorpe classification suggested by the Spanish Society of Epidemiology [28]: Class I (upper class) includes executives, managers, and university professionals; Class II (middle class) includes intermediate occupations and employees; and Class III (lower class) includes manual workers. A two-category classification (blue-collar vs. white-collar) was also used for comparisons.
Smoking. Participants were asked if they smoked, and were then classified as smokers, nonsmokers, or former smokers. Smokers were asked about the number of cigarettes consumed per day, and whether they were occasional or frequent/regular smokers.
Drinking. The consumption of alcohol (yes vs. no), frequency of alcohol consumption, and frequency of drunkenness, were recorded. The types and amounts of alcoholic drinks were recorded to calculate the total amount of ethanol (g) consumed.
Drug consumption. Drug consumption was quantified by the answer to the following question: “How often do you consume any of the following substances: Tranquilizers, cannabis, cocaine, ecstasy, hallucinogens, amphetamines, or heroin?” The possible answers were “never”, “occasionally”, “weekly”, or “daily” for each of three time periods (“anytime in your life”, “within the last 12 months”, and “within the last 30 days”).
Physical activity and sedentary habits. The standard form of the International Physical Activity Questionnaire (IPAQ) was used to determine physical activity (PA) levels and total weekly time of PA [22]. IPAQ results are expressed as metabolic equivalents (METs)-minutes per week. The physically active participants were also asked about the type of PA they performed, and the weekly time spent performing a PA. Questions about the daily time spent in sedentary activities (watching TV, using a computer, and doing homework) were also in the survey.
Dietary habits and diet quality. Questions were asked to determine the number of meals eaten per day and the frequency of eating breakfast (“every day”, “sometimes”, “almost never”, or “never”). Adherence to the Mediterranean diet (MD) was evaluated using the PREDIMED index and the Mediterranean Diet Score (MDS). The PREDIMED index assesses the frequency of consuming 14 items [23] that are indicative of high adherence (olive oil, fruits, legumes, nuts, wine, seafood, and poultry) and the consumption of foods indicative of low adherence (red or processed meats, commercial bakery items, sugary drinks, and sweets). Each item was scored as 0 or 1, and a global score of 9 or higher indicated acceptable adherence [23]. A modified version of the MDS that evaluated the consumption of eight typical (cereals, whole grain cereals, legumes, fruits, nuts, vegetables, fish products, and olive oil) and two atypical (dairy products and meat products) MD food groups was also used. This score is a variation of the original MDS, which was adapted to consider the dietary patterns and nutritional needs of this population group [24,29]. The MDS was categorized as indicating high adherence (MDS ≥ 5) or low adherence (MDS < 5).

2.4. Statistical Analysis

The listwise deletion method (with complete case deletion) was used to account for missing data [30]. Descriptive analysis was used to report the frequency and distribution of categorical variables, and means and standard deviations (SDs) were reported for quantitative variables.
Bivariate association analysis was performed using the χ2 test, with correction using Fisher’s exact statistic when required. Student’s t-test for independent samples was used to compare means.
To evaluate the association of different risk factors with MD adherence (high vs. low) and weekly PA (yes vs. no), two adjusted logistic regression models were used. All variables that were considered relevant (age, sex, social class, BMI, etc.) and those with a p-value below 0.25 in the univariate analysis were included in the adjusted model. Each variable was extracted (one-by-one) according to the level of significance in the model. Possible interactions and their statistical significance were evaluated, and possible collinearity was determined. The goodness of fit of the model was assessed using the Hosmer-Lemeshow C statistic and calculation of the area under the receiver operating characteristic (ROC) curve [31].
The cluster analysis used the k-means algorithm to identify groups of students who shared common health-related lifestyles based on seven factors. This method identifies uniform groups by maximizing inter-group variance and minimizing intra-group variance. This method is less influenced by the presence of atypical cases than other clustering methods [32]. The scaling of variables is a fundamental criterion, so all variables were standardized before the cluster analysis. Once the variables were selected, the grouping process was performed to identify clusters using the criteria of “largest number of possible groups and largest number of cases explained”.
Statistical analyses were performed using the IBM SPSS Statistics version 24 (SPSS/IBM, Chicago, IL, USA) and STATA version 11 (StataCorp LP, TX, USA). In all cases, a p-value below 0.05 was considered significant.

2.5. Ethical Aspects

The study protocol was approved by the Institutional Review Board of the Balearic Islands Health Service (CEI-IB Ref. No.: 1685/11). All participants gave written informed consent.

3. Results

3.1. General Characteristics of Participants

The 444 student participants included 301 females (67.8%) and 143 males (32.2%). The mean age was 23.1 ± 5.7 years, and most students had normal BMI values and were in the middle class (Table 1).

3.2. Health-Related Lifestyles of Participants

Table 2 shows the health-related lifestyles of the participants. About 89% of them reported a good quality of life and 91.0% of them reported a good health status. However, 50.6% of them reported high or very high levels of stress, and women were more stressed than men (86.9% vs. 69.9%; p < 0.001). Age and social class were unrelated to stress level.
About 66% of participants (63.5% women vs. 72.7% men; p < 0.001) reported performing weekly PA. Men spent more time performing PA (210.0 vs. 174.3 min/week; p = 0.009) and had a higher metabolic rate (2835.0 vs. 1408.2 METs/week; p < 0.001). Men preferred running, playing football, and fitness center activities, and women preferred cycling, running, and swimming (data not shown). We asked participants who did not perform PA about the reasons for this. The most common responses were “lack of time” (33.6%), “lack of will” (19.8%), and “schedules of work and lessons” (13.5%) (data not shown). Since starting at the university, about 15% of participants stopped performing PA, 33.0% decreased their PA, and 18.8% increased their PA. Among men, there were negative correlations between the duration of PA and time using a computer (r = –0.324; p < 0.01) and hours of studying (r = –0.182; p < 0.05). In contrast, among women, there was only a negative correlation between duration of PA and time spent watching television (r = –0.182; p < 0.05).
A total of 19.5% of the participants were smokers (17.2% habitual smokers and 2.3% occasional smokers). Social class and sex were unrelated to smoking. Among smokers, individuals consumed an average of 7.1 (SD 7.0) cigarettes per day (Table 2).
A total of 58.0% of the participants were regular consumers of alcohol. Among alcohol consumers, the mean ethanol consumption per week was 47.8 g (SD 61.7), with 15.5 g on weekdays (SD 39.5) and 32.3 g on weekends (SD 32.7). Men consumed more alcohol than women (56.2 (SD 73.8) vs. 34.1 (SD 50.0) g/week; p < 0.001). Regarding the consumption of other drugs, the highest weekly consumption was for cannabis 26.5% (3.1% daily), followed by tranquillizers (13.8%), cocaine (5.9%), hallucinogens (4.5%), ecstasy (2.9%), and amphetamines (2.3%).
The mean PREDIMED score was 4.6 (SD 1.5) and the mean MDS was 5.3 (SD 1.8). These two scores had a high and statistically significant correlation (r = 0.709; p < 0.01). Women had higher adherence to the MD than men (PREDIMED score: 4.8 vs. 4.1, p < 0.001; MDS: 5.5 vs. 4.8, p < 0.001). On average, men ate 2.5 meals per day, and women ate 2.7 meals per day (p = 0.024). About 63% of participants reported having breakfast every day, and 10.2% of them reported never or almost never having breakfast.

3.3. Relationships of Mediterranean Diet and Physical Activity

Table 3 shows the factors associated with PA. Univariate analysis showed that males, those who had greater adherence to the MD, those whose parents had high PA, and those who spent less time studying and using a computer had greater PA. Multivariate analysis which was controlled for all these factors indicated that greater adherence to the MD, spending less time using a computer, and being male remained significantly associated with PA.
Table 4 shows the factors associated with adherence to the MD. Univariate analysis showed that females, those who were older, those who performed more PA, and those who had a high frequency of eating breakfast and ate more meals per day had greater adherence to the MD. Multivariate analysis indicated that these same factors remained associated with MD, and that tobacco consumption was related to a lower adherence to the MD.

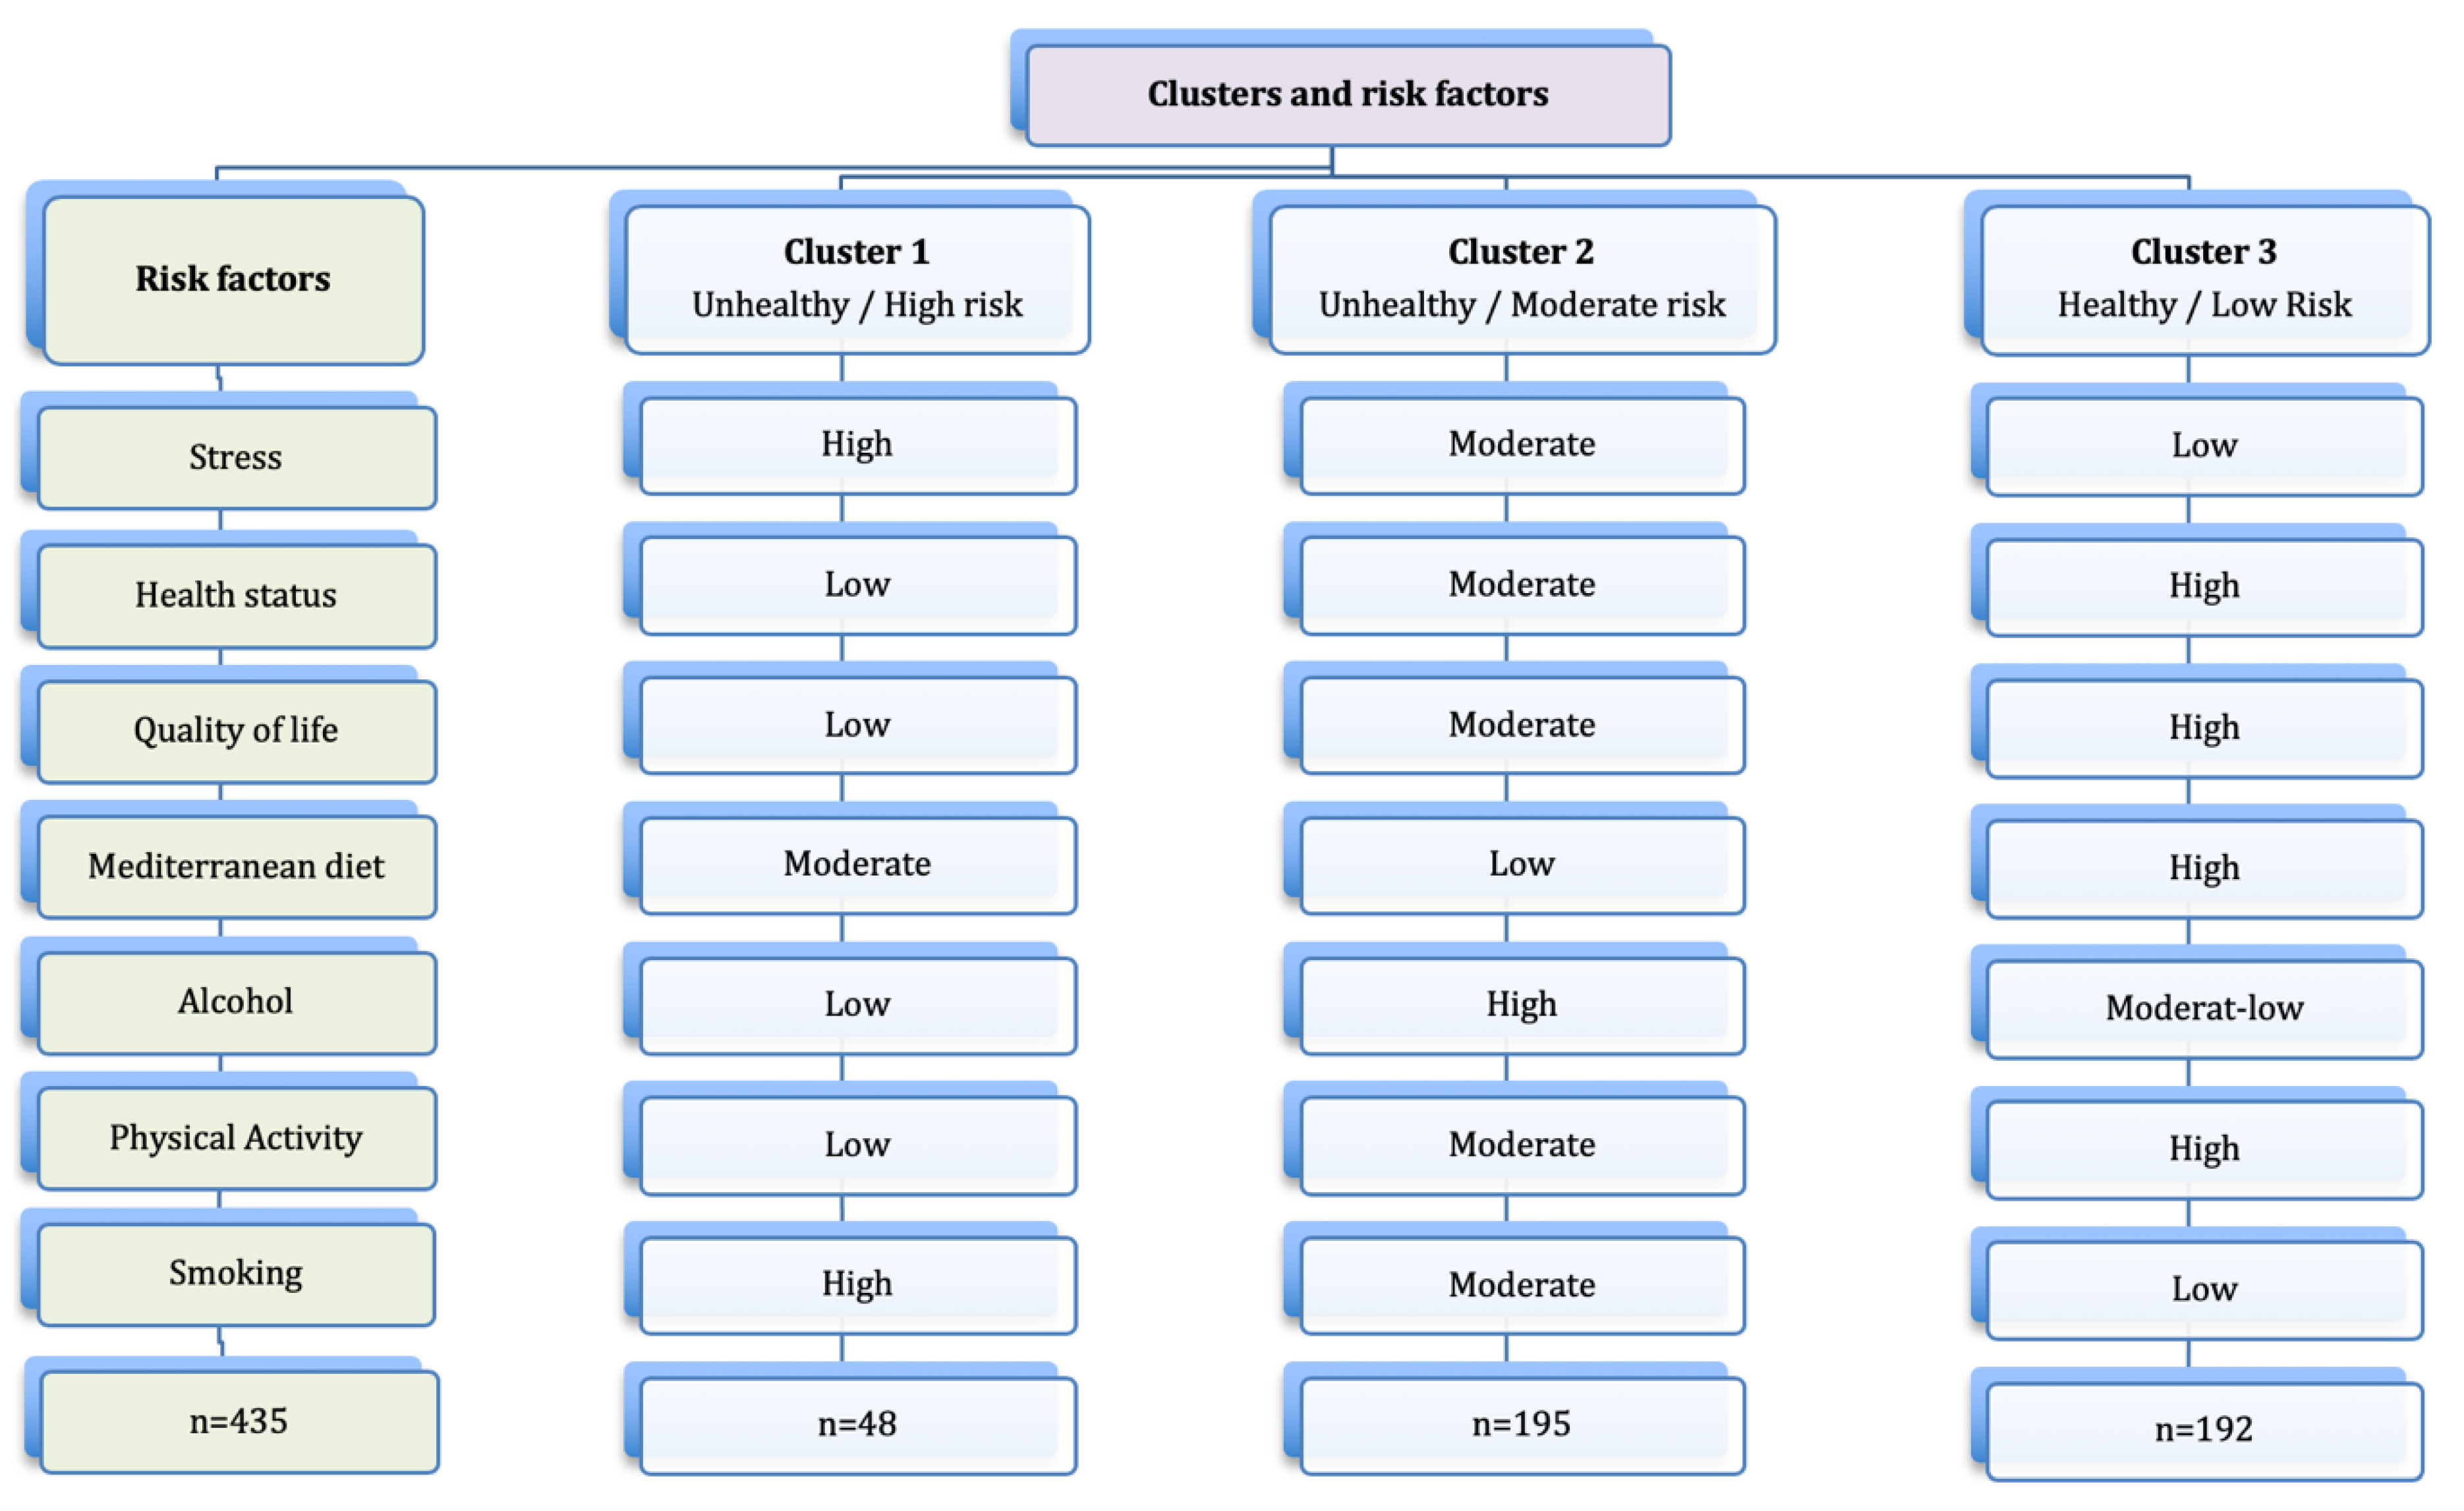
3.4. Cluster Analysis of Health-Related Lifestyles

Our cluster analysis of the health-related lifestyles indicated the presence of three different clusters (Figure 1). This analysis explained the grouping of 435 participants; nine participants did not belong to any cluster. We characterized these clusters as follows:
Cluster 1 (Unhealthy lifestyles/High risk): Participants had moderate adherence to the MD; high consumption of tobacco but low consumption of alcohol; a low level of PA; and poor quality of life, bad health status, and perception of a high level of stress.
Cluster 2 (Unhealthy lifestyles/Moderate risk): Participants had a low adherence to the MD; high alcohol consumption; moderate tobacco consumption; moderate level of PA; and moderate health status, quality of life, and stress.
Cluster 3 (Healthy lifestyles/Low risk): Participants had a high adherence to the MD; high level of PA; low consumption of tobacco and a moderate-low consumption of alcohol; and a low level of perceived stress, very good quality of life, and good health status.
Our analysis of these clusters indicated there were significant differences according to sex (χ2(2) = 11.149; p = 0.040), age (F = 10.284; p < 0.001), BMI (χ2(2) = 7.559; p = 0.023), and living arrangements during the time of university attendance (χ2(2) = 19.911; p < 0.001), but no significant effect of social class (Table 5). Participants in cluster 1 were mainly female (75.9%) and had a mean age of 23.4 years (SD 5.7). Participants in cluster 2 had an average age of 26.6 years (SD 7.8), had the highest prevalence of obesity and overweight, and mostly lived away from their parents. Participants in cluster 2 and cluster 3 had a mean age of 21.9 years (SD 4.4), mostly lived with their parents, and had the lowest prevalence of obesity and overweight.

4. Discussion

Our analysis of the health-related lifestyles of university students, such as PA, diet, tobacco consumption, and alcohol consumption, indicated significant clustering and associations with stress, perceived health status, and quality of life. The present study provides strong evidence that the health-related lifestyles of university students are a serious public health issue, that could contribute to the rise of noncommunicable diseases in the population.
About two-thirds of our university students reported performing PA, more than in similar studies [8,19,33,34]. We also found that men had greater PA levels than women. Cultural factors and traditions could explain these gender differences. Previous studies suggested that the same-sex parent affects PA of an individual, and other studies reported that the mother’s education level is particularly relevant [35,36]. However, we found that the PA of both parents had no significant effect on the PA of an individual. Furthermore, environmental factors can also influence PA. For example, the movement from the controlled environment of a secondary school to the more independent environment of the university could impact PA patterns [37]. Further research is needed to examine this topic.
Our results regarding the consumption of recreational substances indicated a lower prevalence of smoking (19.5%) than previously reported for the same environment [33,35]. However, our results on the prevalence of alcohol consumption were similar to previous studies, in that about six out of ten university students were regular consumers, most consumption occurred on weekends, and men consumed more than women [5,33,38]. There has been a change in the pattern of alcohol consumption by young people, with decreasing weekday consumption and increasing weekend consumption, as alcohol consumption has become an essential component of the leisure time of young people [39]. The social tolerance and the perception of the low risk associated with drinking alcoholic beverages have contributed to the widespread consumption and normalization of this behavior. Gender differences regarding the social acceptance of alcohol consumption could explain the lower consumption by women [40]. It is not clear how universities should address problematic alcohol consumption by students, and there is little evidence of the effectiveness of commonly used intervention techniques (motivational interviews or social norms campaigns) [41].
The present study showed a clear “westernization” of students’ diets, with a movement away from the traditional MD [42], which consists of olive oil, fruits, nuts, whole-grain breads, legumes, fresh foods, eggs, and fish. University students are likely to adopt fashionable diets and to eat fast food, among other tendencies [43]. As a result, there is an increase in the consumption of processed meats, snacks, butter and margarine, sweets, and pastries (foods with abundant saturated fats and sugars) [35].
Most studies that assessed adherence to the MD showed that university students had low-to-medium adherence [43,44], with lower intake of fruits and vegetables than recommended [8,38]. In agreement with other studies, our results showed a positive correlation of the daily number of meals with adherence to the MD [35]. We also identified healthier eating patterns (higher adherence to the MD) among women, as previously reported [35,45]. For these reasons, we suggest that interventions designed to promote healthy lifestyles in university students should consider gender, because men engage in more PA, but women have greater adherence to the MD.
Krieger et al. [46] reported an inverse relationship between a healthy diet (adherence to the MD) and tobacco consumption, in agreement with the present study. However, other research reported no relationship between diet quality and smoking [47]. In contrast to previous studies that examined PA [8,35,44], our results showed no association between PA and consumption of tobacco, alcohol, and other drugs. The lack of a relationship between alcohol consumption and PA could be because alcohol consumption is deeply rooted in Spanish society, and the MD even encourages the moderate consumption of wine. However, our results showed a positive association between PA and diet quality. Only a few previous studies have evaluated this relationship [35,38,48], and they reported that more active people usually consume more fruits and vegetables than less active people. However, it is unknown whether physiological needs due to increased PA, or cultural, social, or psychological factors influence food selection. Considering the health benefits of the MD and PA and their close relationship, we suggest promotion of a Mediterranean lifestyle (MD, PA, social activities, and moderate sun exposure) for university students.
Our results support the findings of previous studies which showed that health-related lifestyles should not be considered as isolated factors, because healthy lifestyles tend to cluster in the same way as unhealthy lifestyles [18,49]. Three distinct clusters were identified: Cluster 1 that we designated “unhealthy lifestyles/high risk”, and cluster 2 “unhealthy lifestyles/moderate risk”, because we consider these students at a high risk of different chronic diseases. In contrast, cluster 3 “healthy lifestyles/low risk” was comprised by students with low risk of health problems (adequate diet, PA practice, nonsmoking behavior, and less stress). Our cluster analysis demonstrated that more than half of university students had unhealthy behavior patterns and were in the high- or moderate -risk clusters (cluster 1 or 2). On the other hand, low levels of perceived psychological stress correlated with good health and quality of life, a high-quality diet, practice of PA, low tobacco consumption, and low-to-moderate alcohol consumption. These findings are consistent with previous results [8,34,44], and suggest a clear commitment to health by students in the low-risk cluster (cluster 3). In this regard, previous studies also reported that belonging to a high-risk (unhealthy) or a low-risk (healthy) group is associated with tobacco use, PA, alcohol consumption, and diet quality, and that these factors were associated with each other [8,33,35,44]. Considering these results, we suggest the implementation of interventions that simultaneously promote multiple healthy lifestyles, because this approach would have a greater impact on public health than the promotion of isolated lifestyles [49].
Health care and academic authorities should consider the relationship of psychological stress and unhealthy lifestyles when developing interventions for the university environment. Students experience peaks of anxiety during the academic year [33], and may be more prone to unhealthy lifestyles at these times. However, we are unaware of the implementation of measures that counteract the negative effect of these peaks, such as stress management during the exam period. It is noteworthy that a greater percentage of women than men reported feeling stressed. This could partly be due to the longer time women spend engaged in academic activities (attendance at lessons and time studying) [50].
Therefore, when planning policies and designing and evaluating interventions, the behavior patterns within these clusters should be considered [20,49,51]. However, previous studies have not consistently identified the occurrence of these clusters. Although previous studies of general populations identified relationships of socio-economic status with lifestyle [52], we found no such relationship. This may be because all of our participants were university students with a higher educational level. We thus suggest the performance of additional cluster studies of young people outside the university environment that consider socio-economic factors when planning interventions.

Study Limitations and Strengths

Several limitations of this study should be acknowledged. Data collection was performed using a self-reported survey. Self-reported measures of lifestyles may be subjected to social desirability bias. For example, individuals tend to underestimate body weight and overestimate height [53]. However, previous studies that used self-reported questionnaires support the general validity of this methodology [54]. Furthermore, the current study was limited to cross-sectional data. Therefore, we could not establish casual relationships between factors. However, the applied design was effective in identification of clusters of lifestyles.
Furthermore, as expected in studies of university students, there were more female than male participants (67.8% vs. 32.2%). This was also reported in previous studies [13,44,55,56]. However, when considering the overall percentages of male and female students, the difference in the present study was greater than expected. It should be considered that all participants in the present study were students attending lessons on a specific day and hour. Since absenteeism is higher among men, this could have affected the sex ratio of participants. There could also be a relationship of absenteeism with certain health-related lifestyles, so we may have underestimated the prevalence of these health-related lifestyles. Although, the participants represented only one university, the context of the University of Balearic Islands is similar to other Spanish universities.
Despite these limitations, the present study provides important information about the clustering of different health-related lifestyles in young adults, and the relationship of these lifestyles with self-perceived stress, health status, and quality of life. Furthermore, we examined variables that have major impacts on health and contribute to mortality and morbidity [3,4]. The clustering of health-related lifestyles among students has not yet been sufficiently recognized, and requires the attention of university administrators. Universities in Spain have formed a partnership in a Network of Healthy Universities [57], and most of these universities have health promotion services and facilities. However, there is still no strong culture of health promotion, and promotion of health is performed without the coordination or collaboration of the health care administration. Universities could provide an environment that better promotes healthy lifestyles [33,58]. For example, universities could provide restaurants that offer a MD with more fruit and vegetable options, promote the use of the fitness centers, design pedestrian-friendly walkways, promote smoke-free and alcohol-free campuses, and provide informative promotional materials to prevent risky lifestyles [59]. In fact, because university students are future parents, teachers, health care professionals, officials, and politicians, these changes can foster a vision towards the promotion of health from all these fields [60].

5. Conclusions

The results of the present study suggest that there is a need to improve the health-related lifestyles of university students. Furthermore, the health-related lifestyles of students that are related to diet, PA, smoking, and alcohol consumption tended to cluster together. In addition, these factors were related to self-reported stress, health status, and quality of life. These results suggest that health promotion interventions in the university environment should consider gender differences and should simultaneously focus on multiple health-related lifestyles rather than any single behaviour. Similar studies are needed to examine to what extent these findings can be replicated in other universities and which programs are more effective in addressing multiple health-related lifestyles of the students.

Author Contributions

Conceptualization, M.B.-V., A.M.Y., J.P., P.T., L.B., and A.A.; methodology, M.B.-V., L.B., A.A., J.P., and A.M.Y.; formal analysis, M.B.-V., A.M.Y., and L.B.; investigation, M.R.-E., M.B.-V., A.L., and A.M.Y.; data curation, M.B-V.; writing—original draft preparation, M.B.-V. and A.M.Y.; writing—review and editing, M.B.-V., A.M.Y., J.P., P.T., L.B., J.C.-F.D., and A.A.; supervision, J.P., L.B., and A.A.; project administration, M.B.-V. and J.C.-F.D.; funding acquisition, M.B.-V. All authors have read and agreed to the published version of the manuscript.

Funding

This study was funded by the Department of Research, Technological Development and Innovation, Government of Balearic Islands, Spain (AAEE 0163/09). The study funder had no role in the design of the study, in the collection, analysis and interpretation of the data, or in the writing of the manuscript. This project has been funded by the Carlos III Health Institute (Ministry of Economy and Competitiveness, Spain) through the Network for Prevention and Health Promotion in Primary Care (redIAPP, RD16/0007/008), and by the European Union ERDF funds.

Acknowledgments

We are extremely grateful to the students for collaborating with us and supporting this study.

Conflicts of Interest

The authors declare no conflict of interest.

References

  1. Joseph, P.; Leong, D.; McKee, M.; Anand, S.S.; Schwalm, J.-D.; Teo, K.; Mente, A.; Yusuf, S. Reducing the Global Burden of Cardiovascular Disease, Part 1. Circ. Res. 2017, 121, 677–694. [Google Scholar] [CrossRef] [PubMed]
  2. Liu, K.; Daviglus, M.L.; Loria, C.M.; Colangelo, L.A.; Spring, B.; Moller, A.; Lloyd-Jones, D.M. Healthy lifestyle through young adulthood and the presence of low cardiovascular disease risk profile in middle age: The Coronary Artery Risk Development in (Young) Adults (CARDIA) study. Circulation 2012, 125, 996–1004. [Google Scholar] [CrossRef] [PubMed] [Green Version]
  3. WHO. Global Status Report on Non-Communicable Diseases 2014; WHO: Geneva, Switzerland, 2014. [Google Scholar]
  4. Bauer, U.E.; Briss, P.A.; Goodman, R.A.; Bowman, B.A. Prevention of chronic disease in the 21st century: Elimination of the leading preventable causes of premature death and disability in the USA. Lancet 2014, 384, 45–52. [Google Scholar] [CrossRef]
  5. Hultgren, B.A.; Turrisi, R.; Cleveland, M.J.; Mallett, K.A.; Reavy, R.; Larimer, M.E.; Geisner, I.M.; Hospital, M. Transitions in drinking behaviors across the college years: A latent transition analysis. Addict. Behav. 2019, 92, 108–114. [Google Scholar] [CrossRef] [PubMed]
  6. Deasy, C.; Coughlan, B.; Pironom, J.; Jourdan, D.; Mannix-McNamara, P. Psychological Distress and Coping amongst Higher Education Students: A Mixed Method Enquiry. PLoS ONE 2014, 9, e115193. [Google Scholar] [CrossRef] [Green Version]
  7. Deforche, B.; Van Dyck, D.; Deliens, T.; De Bourdeaudhuij, I. Changes in weight, physical activity, sedentary behaviour and dietary intake during the transition to higher education: A prospective study. Int. J. Behav. Nutr. Phys. Act. 2015, 12, 16. [Google Scholar] [CrossRef] [Green Version]
  8. Dodd, L.J.; Al-Nakeeb, Y.; Nevill, A.M.; Forshaw, M.J. Lifestyle risk factors of students: A cluster analytical approach. Prev. Med. 2010, 51, 73–77. [Google Scholar] [CrossRef]
  9. Assaf, I.; Brieteh, F.; Tfaily, M.; El-Baida, M.; Kadry, S.; Balusamy, B. Students university healthy lifestyle practice: Quantitative analysis. Heal. Inf. Sci. Syst. 2019, 7, 7. [Google Scholar] [CrossRef]
  10. Moor, I.; Spallek, J.; Richter, M. Explaining socioeconomic inequalities in self-rated health: A systematic review of the relative contribution of material, psychosocial and behavioural factors. J. Epidemiology Community Heal. 2016, 71, 565–575. [Google Scholar] [CrossRef]
  11. Campos-Matos, I.; Russo, G.; Perelman, J. Connecting the dots on health inequalities--a systematic review on the social determinants of health in Portugal. Int. J. Equity Heal. 2016, 15, 26. [Google Scholar] [CrossRef] [Green Version]
  12. Arsandaux, J.; Michel, G.; Tournier, M.; Tzourio, C.; Galéra, C. Is self-esteem associated with self-rated health among French college students? A longitudinal epidemiological study: The i-Share cohort. BMJ Open 2019, 9, e024500. [Google Scholar] [CrossRef] [Green Version]
  13. Schmidt, M. Predictors of Self-rated Health and Lifestyle Behaviours in Swedish University Students. Glob. J. Heal. Sci. 2012, 4, 1–14. [Google Scholar] [CrossRef] [PubMed]
  14. Pietz, K.; Petersen, L.A. Comparing Self-Reported Health Status and Diagnosis-Based Risk Adjustment to Predict 1- and 2 to 5-Year Mortality. Heal. Serv. Res. 2007, 42, 629–643. [Google Scholar] [CrossRef] [PubMed] [Green Version]
  15. Kang, J.; Ciecierski, C.C.; Malin, E.L.; Carroll, A.J.; Gidea, M.; Craft, L.L.; Spring, B.; Hitsman, B. A latent class analysis of cancer risk behaviors among U.S. college students. Prev. Med. 2014, 64, 121–125. [Google Scholar] [CrossRef] [PubMed] [Green Version]
  16. El Ansari, W.; Ssewanyana, D.; Stock, C. Behavioral Health Risk Profiles of Undergraduate University Students in England, Wales, and Northern Ireland: A Cluster Analysis. Front. Public Heal. 2018, 6, 120. [Google Scholar] [CrossRef] [PubMed] [Green Version]
  17. Meader, N.; King, K.; Moe-Byrne, T.; Wright, K.; Graham, H.; Petticrew, M.; Power, C.; White, M.; Sowden, A.J. A systematic review on the clustering and co-occurrence of multiple risk behaviours. BMC Public Heal. 2016, 16, 657. [Google Scholar] [CrossRef] [PubMed] [Green Version]
  18. Murphy, J.J.; MacDonncha, C.; Murphy, M.; Murphy, N.; Timperio, A.; Leech, R.; Woods, C. Identification of health-related behavioural clusters and their association with demographic characteristics in Irish university students. BMC Public Heal. 2019, 19, 121. [Google Scholar] [CrossRef]
  19. Lawrence, E.M.; Mollborn, S.; Hummer, R.A. Health lifestyles across the transition to adulthood: Implications for health. Soc. Sci. Med. 2017, 193, 23–32. [Google Scholar] [CrossRef]
  20. Luo, J.; Agley, J.; Hendryx, M.; Gassman, R.; Lohrmann, D. Risk patterns among college youth: Identification and implications for prevention and treatment. Health Promot. Pract. 2015, 16, 132–141. [Google Scholar] [CrossRef]
  21. Ministerio de Sanidad. Encuesta Nacional de Salud de España; Ministerio de Sanidad: Madrid, Spain, 2016.
  22. Craig, C.L.; Marshall, A.; Sjöström, M.; Bauman, A.E.; Booth, M.L.; Ainsworth, B.E.; Pratt, M.; Ekelund, U.; Yngve, A.; Sallis, J.F.; et al. International Physical Activity Questionnaire: 12-Country Reliability and Validity. Med. Sci. Sports Exerc. 2003, 35, 1381–1395. [Google Scholar] [CrossRef] [Green Version]
  23. Estruch, R.; Ros, E.; Salas-Salvadó, J.; Covas, M.-I.; Corella, D.; Arós, F.; Gomez-Gracia, E.; Ruiz-Gutierrez, V.; Fiol, M.; Lapetra, J.; et al. Primary Prevention of Cardiovascular Disease with a Mediterranean Diet Supplemented with Extra-Virgin Olive Oil or Nuts. New Engl. J. Med. 2018, 378, e34. [Google Scholar] [CrossRef] [PubMed]
  24. Trichopoulou, A.; Costacou, T.; Bamia, C.; Trichopoulos, D. Adherence to a Mediterranean Diet and Survival in a Greek Population. New Engl. J. Med. 2003, 348, 2599–2608. [Google Scholar] [CrossRef] [PubMed] [Green Version]
  25. World Health Organization. Obesity: Preventing and managing the global epidemic; Report of a WHO Consultation; WHO: Geneva, Switzerland, 2000. [Google Scholar]
  26. Lundberg, O.; Manderbacka, K. Assessing reliability of a measure of self-rated health. Scand. J. Soc. Med. 1996, 24, 218–224. [Google Scholar] [CrossRef] [PubMed]
  27. Manor, O.; Matthews, S.; Power, C. Self-rated health and limiting longstanding illness: Inter-relationships with morbidity in early adulthood. Int. J. Epidemiol. 2001, 30, 600–607. [Google Scholar] [CrossRef] [PubMed] [Green Version]
  28. Domingo-Salvany, A.; Bacigalupe, A.; Carrasco, J.M.; Espelt, A.; Ferrando, J.; Borrell, C.; del Grupo de Determinantes Sociales de Sociedad Espanola de Epidemiología. [Proposals for social class classification based on the Spanish National Classification of Occupations 2011 using neo-Weberian and neo-Marxist approaches]. Gac. Sanit. 2013, 27, 263–272. [Google Scholar] [CrossRef] [Green Version]
  29. Trichopoulou, A.; Orfanos, P.; Norat, T.; Bueno-De-Mesquita, B.; Ocke, M.C.; Peeters, P.H.; Van Der Schouw, Y.T.; Boeing, H.; Hoffmann, K.; Boffetta, P.; et al. Modified Mediterranean diet and survival: EPIC-elderly prospective cohort study. BMJ 2005, 330, 991. [Google Scholar] [CrossRef] [Green Version]
  30. Eekhout, I.; de Boer, R.M.; Twisk, J.W.; de Vet, H.C.; Heymans, M.W. Missing data: A systematic review of how they are reported and handled. Epidemiology 2012, 23, 729–732. [Google Scholar] [CrossRef]
  31. Hosmer, D.W.; Lemeshow, S. Applied Logistic Regresion; John Willey and Sons: New York, NY, USA, 2000. [Google Scholar]
  32. Hair, J.F.; Anderson, R.E.; Tatham, R.L.; Black, W.C. Multivariate Data Analysis, 5nd ed.; Prentice Hall: Upper Saddle River, NJ, USA, 1998. [Google Scholar]
  33. Aceijas, C.; Waldhäusl, S.; Lambert, N.; Cassar, S.; Bello-Corassa, R. Determinants of health-related lifestyles among university students. Perspect. Public Heal. 2016, 137, 227–236. [Google Scholar] [CrossRef]
  34. Keller, S.; Maddock, J.E.; Hannöver, W.; Thyrian, J.R.; Basler, H.-D. Multiple health risk behaviors in German first year university students. Prev. Med. 2008, 46, 189–195. [Google Scholar] [CrossRef]
  35. Moreno-Gómez, C.; Romaguera, D.; Tauler-Riera, P.; Bennasar-Veny, M.; Pericas-Beltrán, J.; Martinez-Andreu, S.; Aguilo-Pons, A. Clustering of lifestyle factors in Spanish university students: The relationship between smoking, alcohol consumption, physical activity and diet quality. Public Heal. Nutr. 2012, 15, 2131–2139. [Google Scholar] [CrossRef] [PubMed] [Green Version]
  36. Romaguera, D.; Tauler, P.; Bennasar, M.; Pericàs, J.; Moreno, C.; Martínez, S.; Aguiló, A.; Bennasar-Veny, M. Determinants and patterns of physical activity practice among Spanish university students. J. Sports Sci. 2011, 29, 989–997. [Google Scholar] [CrossRef] [PubMed]
  37. Clemente, F.M.; Nikolaidis, P.; Martins, F.M.L.; Mendes, R. Physical Activity Patterns in University Students: Do They Follow the Public Health Guidelines? PLoS ONE 2016, 11, e0152516. [Google Scholar] [CrossRef] [PubMed]
  38. Hadjimbei, E.; Botsaris, G.; Gekas, V.; Panayiotou, A.G. Adherence to the Mediterranean Diet and Lifestyle Characteristics of University Students in Cyprus: A Cross-Sectional Survey. J. Nutr. Metab. 2016, 2016, 1–8. [Google Scholar] [CrossRef] [Green Version]
  39. Franco, A.J.-M.; Agustín, A.B.S.; Marqueta, A.; Valero, P.G.; De La Puerta, I.N. [Addictive substance use among first-year university students]. Adicciones 2009, 21, 21–28. [Google Scholar]
  40. Foxcroft, D.; Moreira, M.T.; Santimano, N.M.; Smith, L.A. Social norms information for alcohol misuse in university and college students. Cochrane Database Syst. Rev. 2015, CD006748. [Google Scholar]
  41. Tarrant, M.; Smith, J.; Ball, S.; Winlove, C.; Gul, S.; Charles, N. Alcohol consumption among university students in the night-time economy in the UK: A three-wave longitudinal study. Drug Alcohol Depend. 2019, 204, 107522. [Google Scholar] [CrossRef]
  42. Cabrera, S.G.; Fernández, N.H.; Hernández, C.R.; Nissensohn, M.; Roman-Viñas, B.; Serra-Majem, L. Kidmed test, prevalence of low adherence to the mediterranean diet in children and young: A systematic review. Nutr. Hosp. 2015, 32, 2390–2399. [Google Scholar]
  43. García-Meseguer, M.J.; Burriel, F.C.; García-Meseguer, M.J.; Serrano-Urrea, R. Adherence to Mediterranean diet in a Spanish university population. Appetite 2014, 78, 156–164. [Google Scholar] [CrossRef] [PubMed]
  44. De-Mateo-Silleras, B.; Camina-Martín, M.A.; Cartujo-Redondo, A.; Carreño-Enciso, L.; De La Cruz, S.; Redondo-Del-Río, M.P. Health Perception According to the Lifestyle of University Students. J. Community Heal. 2018, 44, 74–80. [Google Scholar] [CrossRef]
  45. Sprake, E.F.; Russell, J.M.; Cecil, J.E.; Cooper, R.J.; Grabowski, P.; Pourshahidi, K.; Barker, M. Dietary patterns of university students in the UK: A cross-sectional study. Nutr. J. 2018, 17, 90. [Google Scholar] [CrossRef] [PubMed]
  46. Krieger, J.-P.; Pestoni, G.; Cabaset, S.; Brombach, C.; Sych, J.M.; Schader, C.; Faeh, D.; Rohrmann, S. Dietary Patterns and Their Sociodemographic and Lifestyle Determinants in Switzerland: Results from the National Nutrition Survey menuCH. Nutrients 2018, 11, 62. [Google Scholar] [CrossRef] [PubMed] [Green Version]
  47. Arabshahi, S.; Lahmann, P.H.; Williams, G.; Marks, G.C.; Van Der Pols, J. Longitudinal Change in Diet Quality in Australian Adults Varies by Demographic, Socio-Economic, and Lifestyle Characteristics. J. Nutr. 2011, 141, 1871–1879. [Google Scholar] [CrossRef] [PubMed] [Green Version]
  48. Dowler, E. Inequalities in diet and physical activity in Europe. Public Heal. Nutr. 2001, 4, 701–709. [Google Scholar] [CrossRef] [Green Version]
  49. Noble, N.; Paul, C.; Turon, H.; Oldmeadow, C. Which modifiable health risk behaviours are related? A systematic review of the clustering of Smoking, Nutrition, Alcohol and Physical activity (‘SNAP’) health risk factors. Prev. Med. 2015, 81, 16–41. [Google Scholar] [CrossRef] [PubMed]
  50. Chacón-Cuberos, R.; Zurita-Ortega, F.; Olmedo, E.; Castro-Sánchez, M. Relationship between Academic Stress, Physical Activity and Diet in University Students of Education. Behav. Sci. 2019, 9, 59. [Google Scholar] [CrossRef] [Green Version]
  51. Havigerova, J.M.; Dosedlova, J.; Buresova, I. One health behavior or many health-related behaviors? Psychol. Res. Behav. Manag. 2019, 12, 23–30. [Google Scholar] [CrossRef] [Green Version]
  52. Mawditt, C.; Sacker, A.; Britton, A.; Kelly, Y.J.; Cable, N. Social influences on health-related behaviour clustering during adulthood in two British birth cohort studies. Prev. Med. 2018, 110, 67–80. [Google Scholar] [CrossRef]
  53. Galán, I.; Rodríguez-Artalejo, F.; Zorrilla, B. [Telephone versus face-to-face household interviews in the assessment of health behaviors and preventive practices]. Gac. Sanit. 2004, 18, 440–450. [Google Scholar] [CrossRef]
  54. Bes-Rastrollo, M.; Pérez Valdivieso, J.R.; Sánchez-Villegas, A.; Alonso, A.; Martínez González, M. Validación del peso e índice de masa corporal auto-declarados de los participantes en una cohorte de graduados universitarios. Rev. Esp. Obes. 2005, 3, 352–358. [Google Scholar]
  55. Pedisic, Z.; Rakovac, M.; Titze, S.; Jurakić, D.; Oja, P. Domain-specific physical activity and health-related quality of life in university students. Eur. J. Sport Sci. 2013, 14, 492–499. [Google Scholar] [CrossRef] [PubMed]
  56. Wanden-Berghe, C.; Martín-Rodero, H.; Rodríguez-Martín, A.; Ruiz, J.P.N.; De Victoria, E.M.; Sanz-Valero, J.; González Ángela, G.; Vila, A.; Alonso, M.V.; Marí, J.A.T.; et al. [Quality of life and its determinants in Spanish university students of health sciences factors]. Nutr. Hosp. 2014, 31, 952–958. [Google Scholar] [PubMed] [Green Version]
  57. Martinez-Riera, J.R.; Gallardo Pino, C.; Aguilo Pons, A.; Granados Mendoza, M.C.; Lopez-Gomez, J.; Arroyo Acevedo, H.V. [The university as a community: Health-promoting universities. SESPAS Report 2018]. Gac. Sanit. 2018, 32, 86–91. [Google Scholar] [PubMed]
  58. Whatnall, M.C.; Patterson, A.J.; Chiu, S.; Oldmeadow, C.; Hutchesson, M.J. Feasibility and Preliminary Efficacy of the Eating Advice to Students (EATS) Brief Web-Based Nutrition Intervention for Young Adult University Students: A Pilot Randomized Controlled Trial. Nutrients 2019, 11, 905. [Google Scholar] [CrossRef] [PubMed] [Green Version]
  59. Plotnikoff, R.C.; Costigan, S.; Haslam, R.; Hutchesson, M.J.; Kennedy, S.; Robards, S.L.; Allen, J.; Collins, C.E.; Callister, R.; Germov, J. Effectiveness of interventions targeting physical activity, nutrition and healthy weight for university and college students: A systematic review and meta-analysis. Int. J. Behav. Nutr. Phys. Act. 2015, 12, 45. [Google Scholar] [CrossRef] [Green Version]
  60. Deasy, C.; Coughlan, B.; Pironom, J.; Jourdan, D.; Mannix-McNamara, P. Psychological distress and lifestyle of students: Implications for health promotion. Heal. Promot. Int. 2014, 30, 77–87. [Google Scholar] [CrossRef] [PubMed] [Green Version]
Figure 1. High, moderate, and low risk clusters and their associated risk factors.
Ijerph 17 01776 g001
Table 1. General characteristics of participants (n = 444).
All
(n = 444)
Men
(n = 143)
Women
(n = 301)
p-Value
Mean (SD) or n (%)
Age, years23.1 (5.7)23.0 (5.5)23.0 (5.7)0.681
Weight, kg64.2 (12.9)75.8 (11.5)58.7 (9.4)<0.001
Height, cm168.5 (8.7)177.5 (6.6)154.1 (5.8)<0.001
BMI, kg/m222.5 (3.5)24.0 (3.5)21.8 (3.2)<0.001
BMI classification * <0.001
Underweight 34 (7.7%)1 (0.7%)33 (11.0%)
Normal weight326 (73.4%)101 (70.6%)225 (74.7%)
Overweight68 (15.3%)35 (24.5%)33 (11.0%)
Obese16 (3.6%)6 (4.2%)10 (3.3%)
Social class 0.044
High105 (23.7%)44 (30.8%)61 (20.3%)
Medium271 (61.0%)79 (55.2%)192 (63.8%)
Low68 (15.3%)20 (14.0%)48 (15.9%)
Working
Yes130 (29.4%)101 (29.4%)211 (29.4%)0.990
* Underweight (BMI < 18.5 kg/m2); normal weight (BMI 18.5 to 25 kg/m2); overweight (BMI 25 to 30 kg/m2); obese (BMI ≥ 30 kg/m2).
Table 2. Health-related behaviors of participants (n = 444).
All
(n = 444)
Men
(n = 143)
Women
(n = 301)
p-Value
Mean (SD) or n (%)
Stress
High or very high
225 (50.6%)56 (39.2%)169 (56.7%)<0.001
Health status
Good or very good
401 (91.0%)130 (91.6%)271 (90.7%)0.061
Quality of life
Good or very good
394 (88.9%)129 (90.2%)265 (88.4%)0.711
Diet
Meals/day2.7 (0.9)2.5 (1.0)2.7 (0.9)0.024
Breakfast every day279 (63.1%)89 (62.2%)190 (63.5%)0.790
Diet quality
PREDIMED score5.4 (1.8)4.8 (1.8)5.6 (1.8)<0.001
MDS5.3 (1.8)4.8 (1.9)5.5 (1.7)<0.001
Physical activity
Yes294 (66.2%)103 (72.0%)191 (63.5%)<0.001
Mets-min/week1867.7 (2798.5)2835.0 (3991.4)1408.2 (1834.6)<0.001
Minutes/week186.6 (89.1)210.0 (99.4)174.3 (80.9)0.009
Parent’s physical activity 0.311
Yes, both79 (19.7%)28 (20.9%)51 (19.0%)
Yes, mother only49 (12.2%)15 (11.2%)34 (12.7%)
Yes, father only63 (15.7%)15 (11.2%)48 (17.9%)
Smoking
Yes86 (19.5%)22 (15.5%)64 (21.3%)0.148
Cigarettes/day7.1 (7.0)8.4 (9.2)6.6 (6.1)
Alcohol consumption
Yes41.2 (59.6%)56.2 (73.8%)34.1 (50.0%)<0.001
g ethanol /week41.2 (59.6)56.2 (73.8)34.1 (50.0)<0.001
Drug consumption
Yes65 (14.6%)18 (12.6%)47 (15.6%)0.399
Sedentary habits
Study (h/day)3.5 (2.3)3.3 (3.4)3.6 (2.4)0.047
Computer (h/day)3.6 (2.5)3.8 (2.6)3.6 (2.4)0.694
Table 3. Univariate and multivariate analysis of factors associated with physical activity (n = 444).
Physical ActivityYes
(n = 294)
No
(n = 150)
OR95% CIaOR95% CI
n (%) or Mean (SD)
Gender
Male105 (35.7%)38 (25.7%)1 1
Female191 (65.0%)110 (73.3%)0.62 *0.40–0.960.49 *0.29–0.85
Age (years)22.9 (5.6)23.3 (5.7)0.990.96–1.020.990.95–1.04
BMI (kg/m2)22.6 (3.1)22.4 (4.2)1.010.96–1.071.020.95–1.09
Social class
High72 (24.5%)35 (23.3%)1
Medium 83 (28.2%)43 (28.7%)1.070.65–1.77
Low139 (47.3%)72 (48.0%)1.010.63–1.62
Mediterranean Diet Score5.5 (1.8)5.0 (1.7)1.13 *1.01–1.261.16 *1.02–1.32
Parent’s physical activity
No143 (48.6%)89 (59.3%)1 1
Yes, both69 (23.5%)19 (12.7%)2.24 **1.24–4.061.820.96–3.47
Yes, mother only39 (13.3%)16 (10.7%)1.500.77–2.921.780.83–3.82
Yes, father only43 (14.6%)26 (17.3%)1.000.57–1.790.840.45–1.55
Computer use (h/day)3.1 (2.1)3.8 (2.2)0.87 ***0.80–0.960.85 **0.76–0.95
Studying (h/day)3.3 (2.0)3.7 (2.0)0.89 *0.81–0.980.920.81–1.04
Tobacco consumption
No236 (80.3%)(80.8%)1
Yes58 (19.7%)(19.2%)1.020.62–1.69
Alcohol consumption
No39 (13.3%)29 (19.3%)1
Yes255 (86.7%)121 (80.7%)1.540.91–2.61
Drug consumption
No243 (82.7%)121 (80.7%)1
Yes51 (17.3%)29 (19.3%)0.900.54–1.49
* p <0.05, ** p <0.01, *** p <0.001. Physical activity (yes vs. no) was calculated excluding the “walking” category. Area under the curve (AUC) of the logistic regression model was 0.68. Qualitative explanatory variables that had more than two categories were transformed into dummy variables for inclusion in the logistic model.
Table 4. Univariate and multivariate analysis of factors associated with adherence to the Mediterranean diet (n = 431).
Mediterranean Diet Score (MDS)Low Adherence(MDS < 5)(n = 229)High Adherence(MDS ≥ 5)(n = 202)OR95% CIaOR95% CI
n (%) or Mean (SD)
Sex
Male104 (45.4%)54 (26.7%)1 1
Female125 (54.6%)148 (73.3%)2.26 ***1.47–3.472.98 ***1.80–4.93
Age (years)21.9 (4.4)23.4 (5.9)1.06 *1.01–1.111.08 **1.02–1.14
BMI (kg/m2)22.4 (3.8)22.6 (3.4)1.020.96–1.081.050.98–1.13
Social class
High social class51 (22.3%)51 (25.2%)1
Medium social class73 (31.9%)53 (26.2%)0.710.40–1.27
Low social class105 (45.8%)98 (48.6%)0.930.54–1.58
Physical activity
No95 (41.5%)62 (30.7%)1 1
Yes134 (58.5%)140 (69.3%)1.61 *1.05–2.471.75 *1.09–2.80
Breakfast every day
No114 (49.8%)62 (30.7%)1 1
Yes115 (50.2%)140 (69.3%)2.24 ***1.46–3.421.70 *1.05–2.76
Meals/day2.4 (0.9)2.8 (0.9)1.61 ***1.27–2.051.43 **1.10–1.87
Tobacco consumption
No173 (75.5%)168 (83.2%)1 1
Yes56 (24.5%)34 (16.8%)0.610.37–1.010.52*0.30–0.91
Alcohol consumption
No32 (14.0%)31 (15.4%)1
Yes197 (86.0%)171 (84.6%)0.890.49–1.60
Drugs consumption
No185 (80.8%)168 (83.2%)1
Yes44 (19.2%)34 (16.8%)0.860.50–1.46
* p < 0.05, ** p < 0.01, *** p < 0.001. Physical activity (yes vs. no) was calculated excluding the “walking” category. AUC of the logistic regression model was 0.67. Qualitative explanatory variables that had more than two categories were transformed into dummy variables for inclusion in the logistic model.
Table 5. Characteristics of the three clusters (n = 435).
Cluster 1
(n = 195, 44.83%)
Unhealthy, High Risk
Cluster 2
(n = 48, 11.03%)
Unhealthy, Moderate Risk
Cluster 3
(n = 192, 44.14%)
Healthy, Low Risk
Health-Related Behaviorsn(%) or Mean (SD)
Stress **4.14 (0.76)3.58 (1.07)2.78 (0.89)
Health status **1.18 (0.53)0.83 (0.43)0.47 (0.52)
Quality of life **1.20 (0.58)0.98 (0.53)0.60 (0.51)
Mediterranean diet5.34 (1.74)4.82 (1.56)5.42 (1.83)
Physical activity **1071 (1519)2086 (2549)2473 (2547)
Smoking **37 (19.0%)32 (66.7%)15 (7.9%)
Alcohol consumption**30.05 (2.15)109.66 (15.83)35.23 (2.54)
Sociodemographic factors
Age **23.4 (5.7)26.6 (7.8)21.9 (4.4)
Gender *
Female148 (75.9%)29 (60.4%)117 (60.9%)
Male47 (24.1%)19 (39.6%)75 (39.1%)
BMI *
Normal weight150 (77.7%)36 (75.0%)166 (87.4%)
Obesity or overweight43 (22.3%)12 (25.0%)24 (12.6%)
Social class
Blue collar96 (50.8%)26 (56.5%)80 (43.0%)
White collar93 (49.2%)20 (43.5%)106 (57.0%)
Residence **
Parents130 (66.7%)20 (42.6%)146 (76.0%)
Others65 (33.3%)27 (57.4%)46 (24.0%)
* p < 0.05, ** p < 0.01, *** p < 0.001.

