Spatial and Seasonal Variations of Sedimentary Organic Matter in a Subtropical Bay: Implication for Human Interventions

 ,
,
Abstract
1. Introduction
2. Materials and Methods
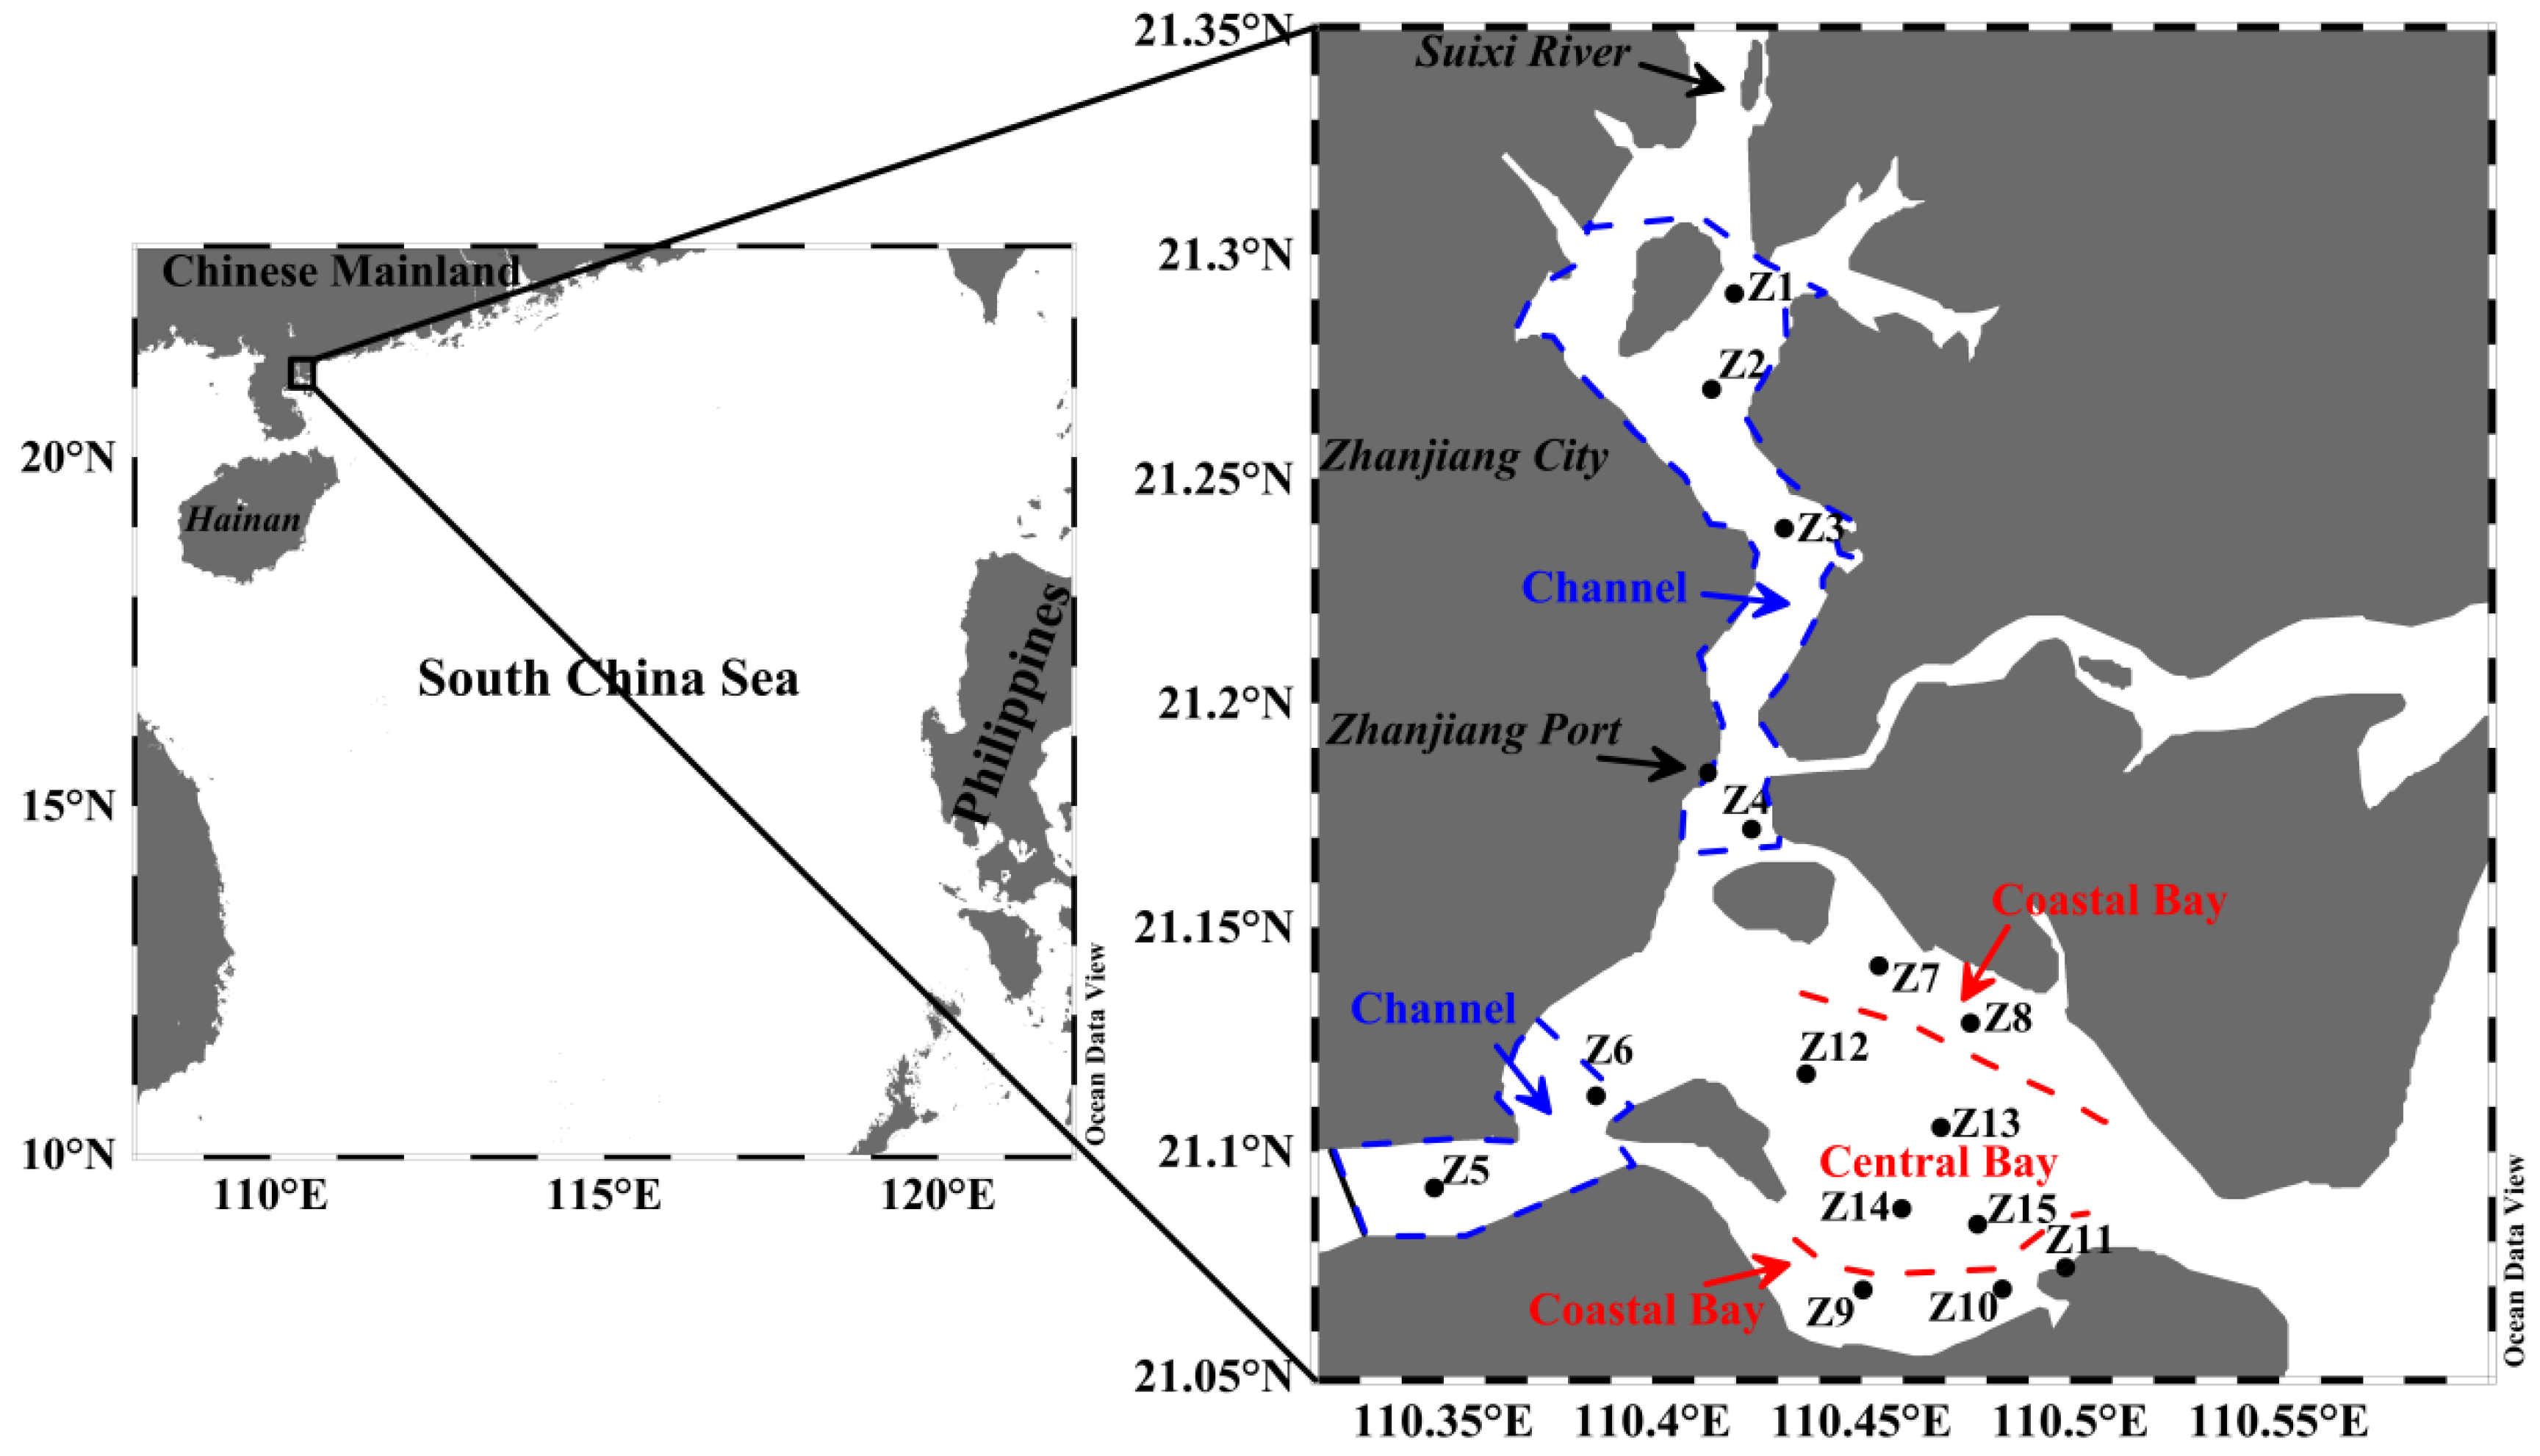
2.1. Study Region
2.2. Sampling and Analyses
3. Results
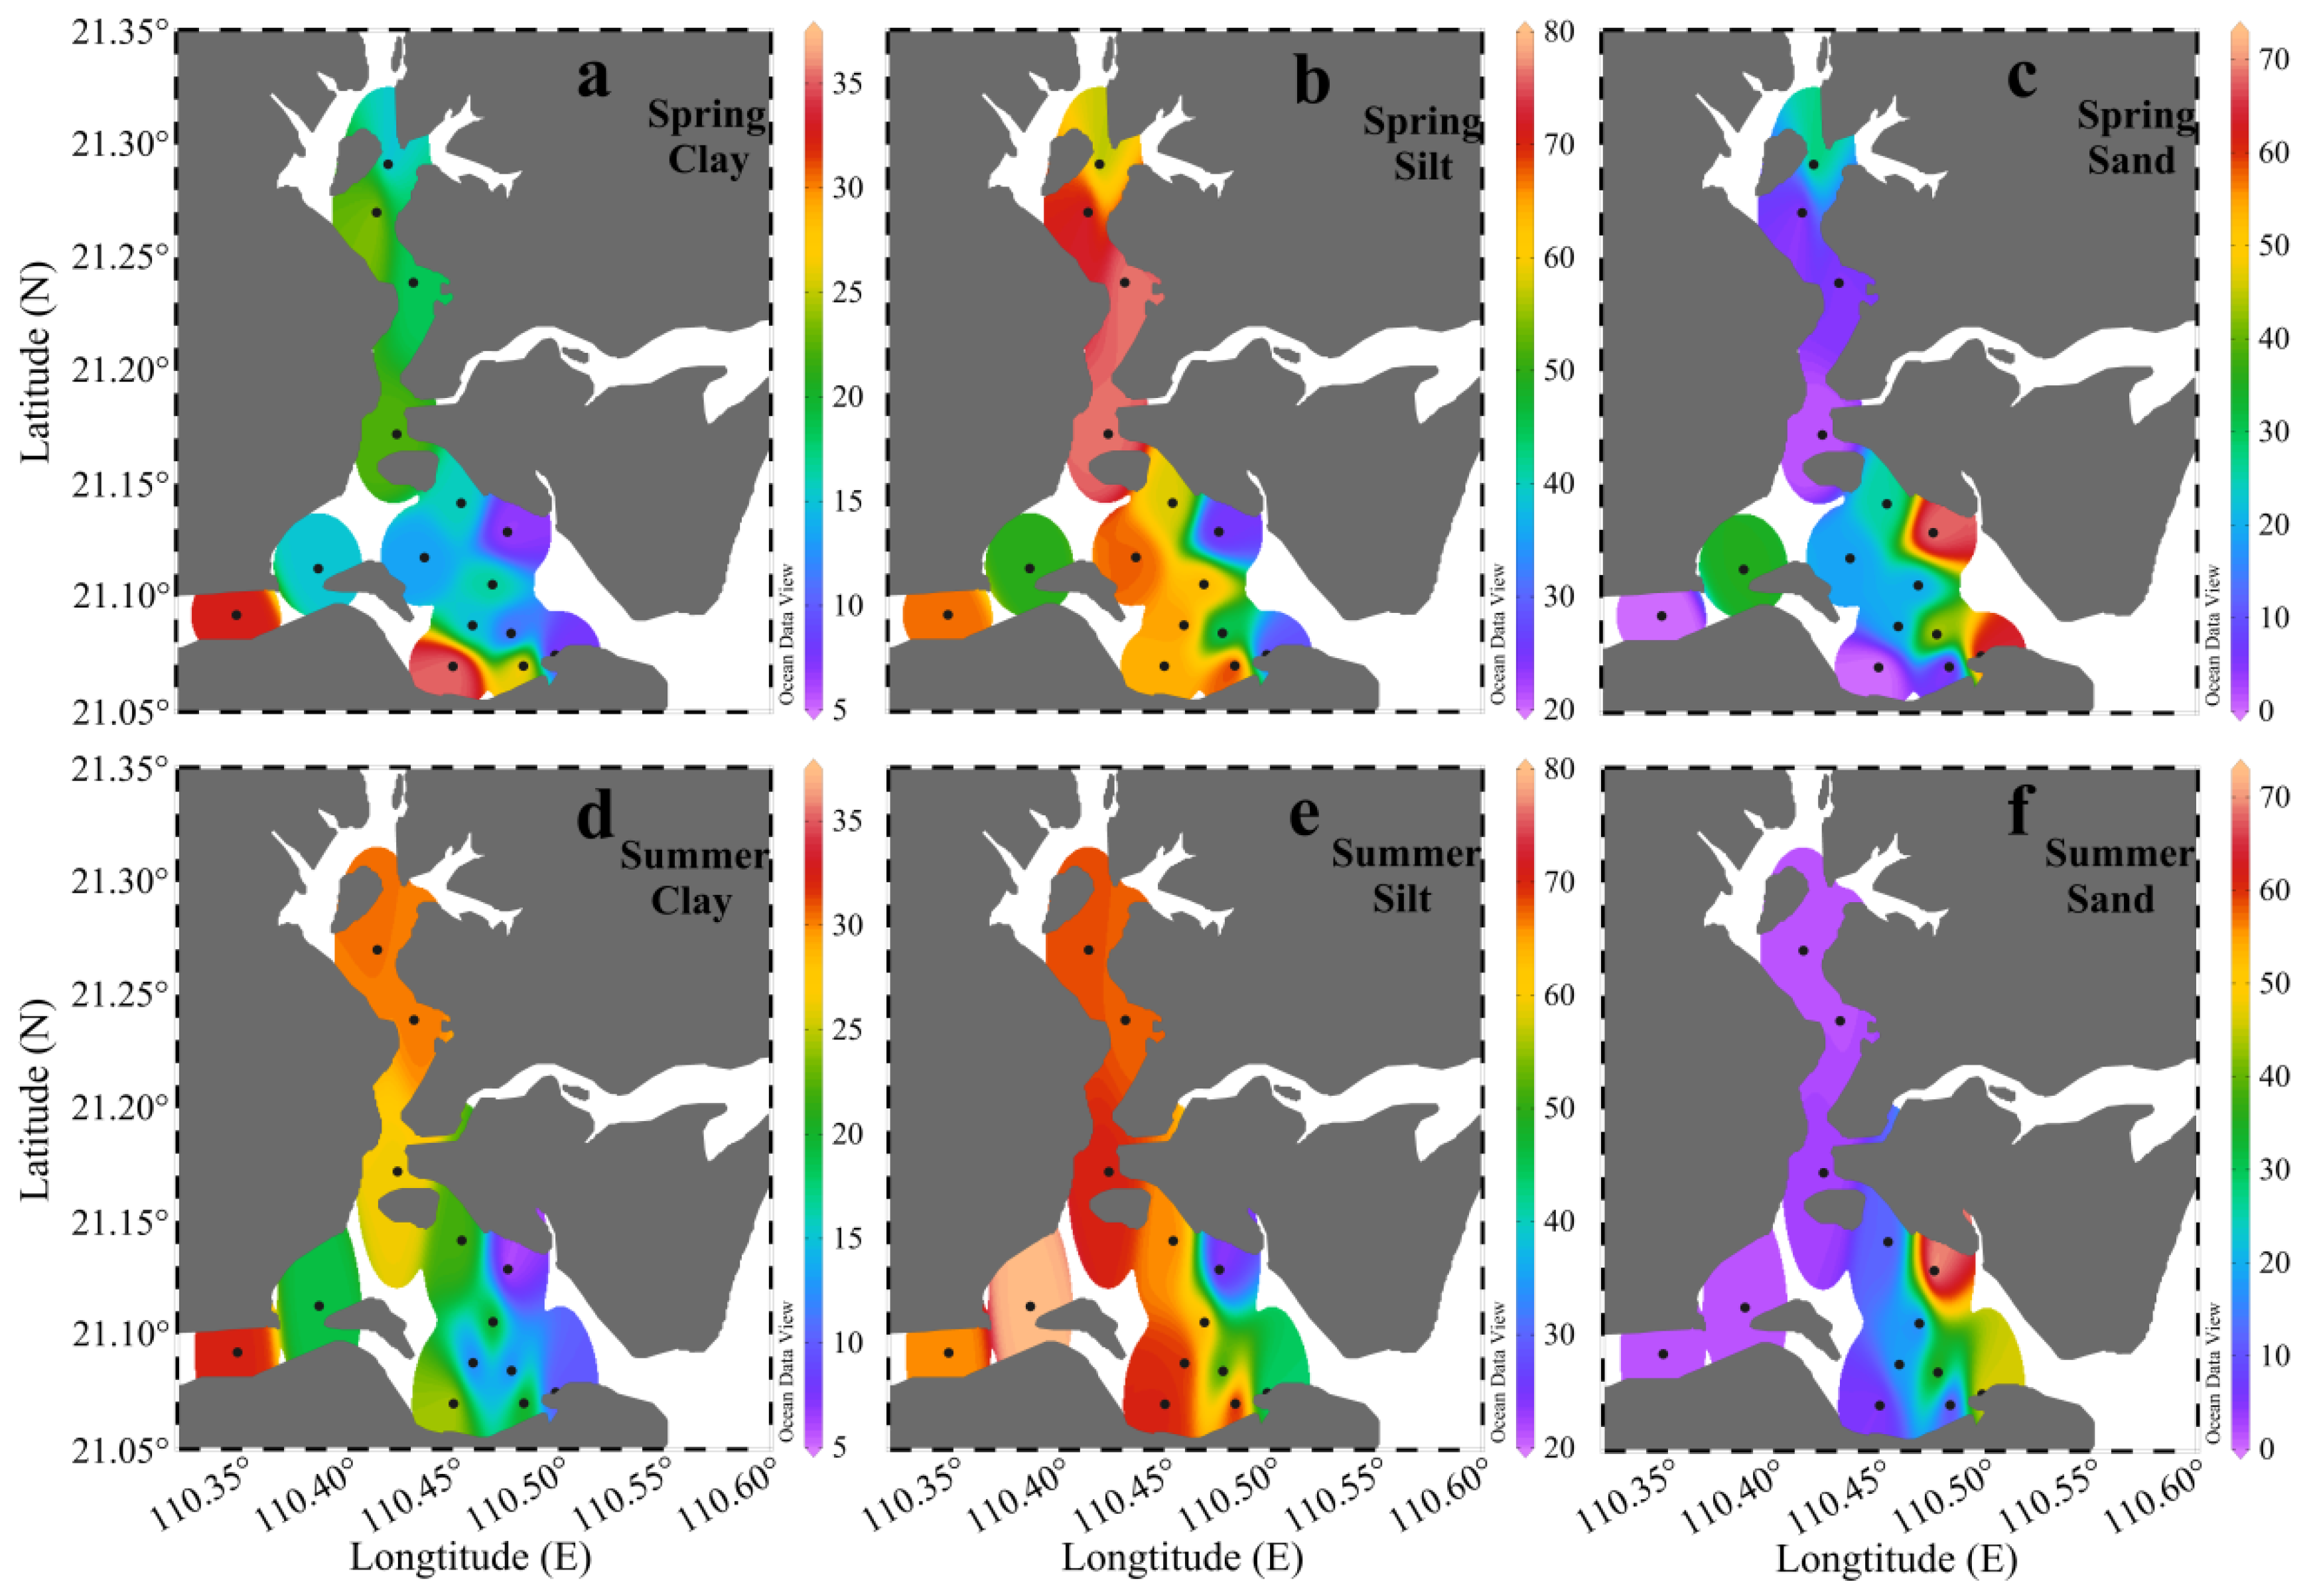
3.1. Grain Size
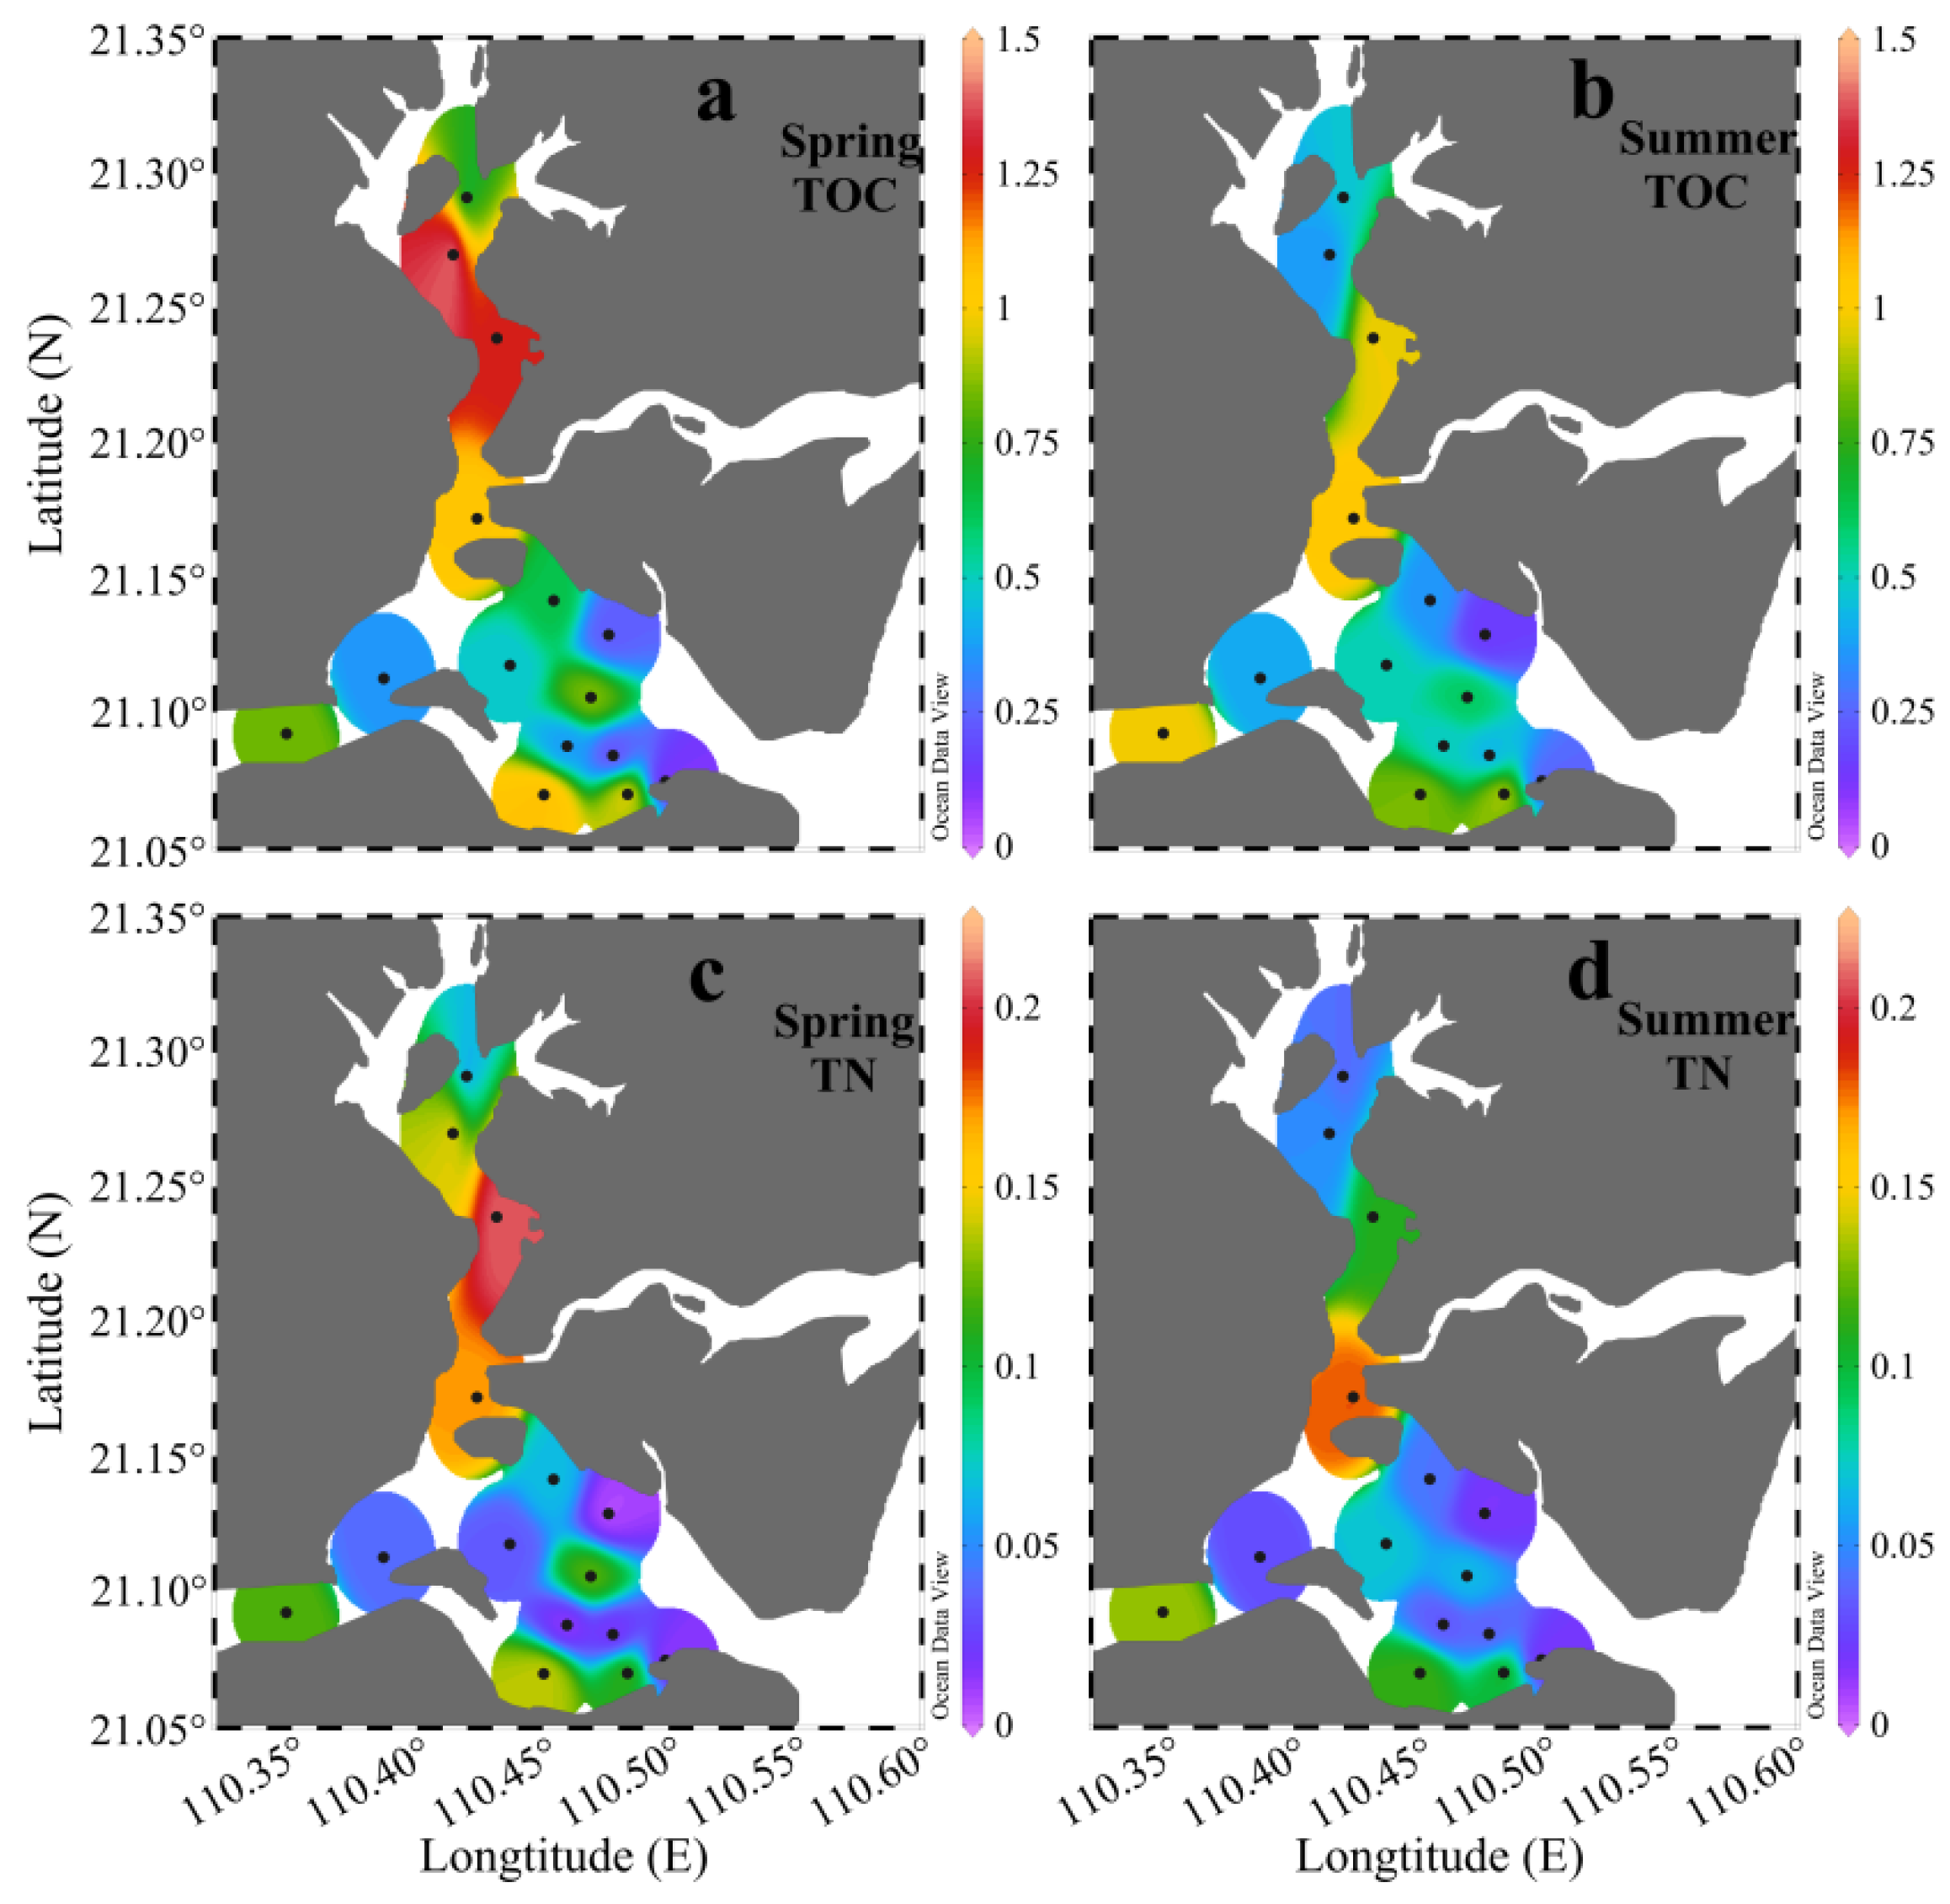
3.2. TOC and TN
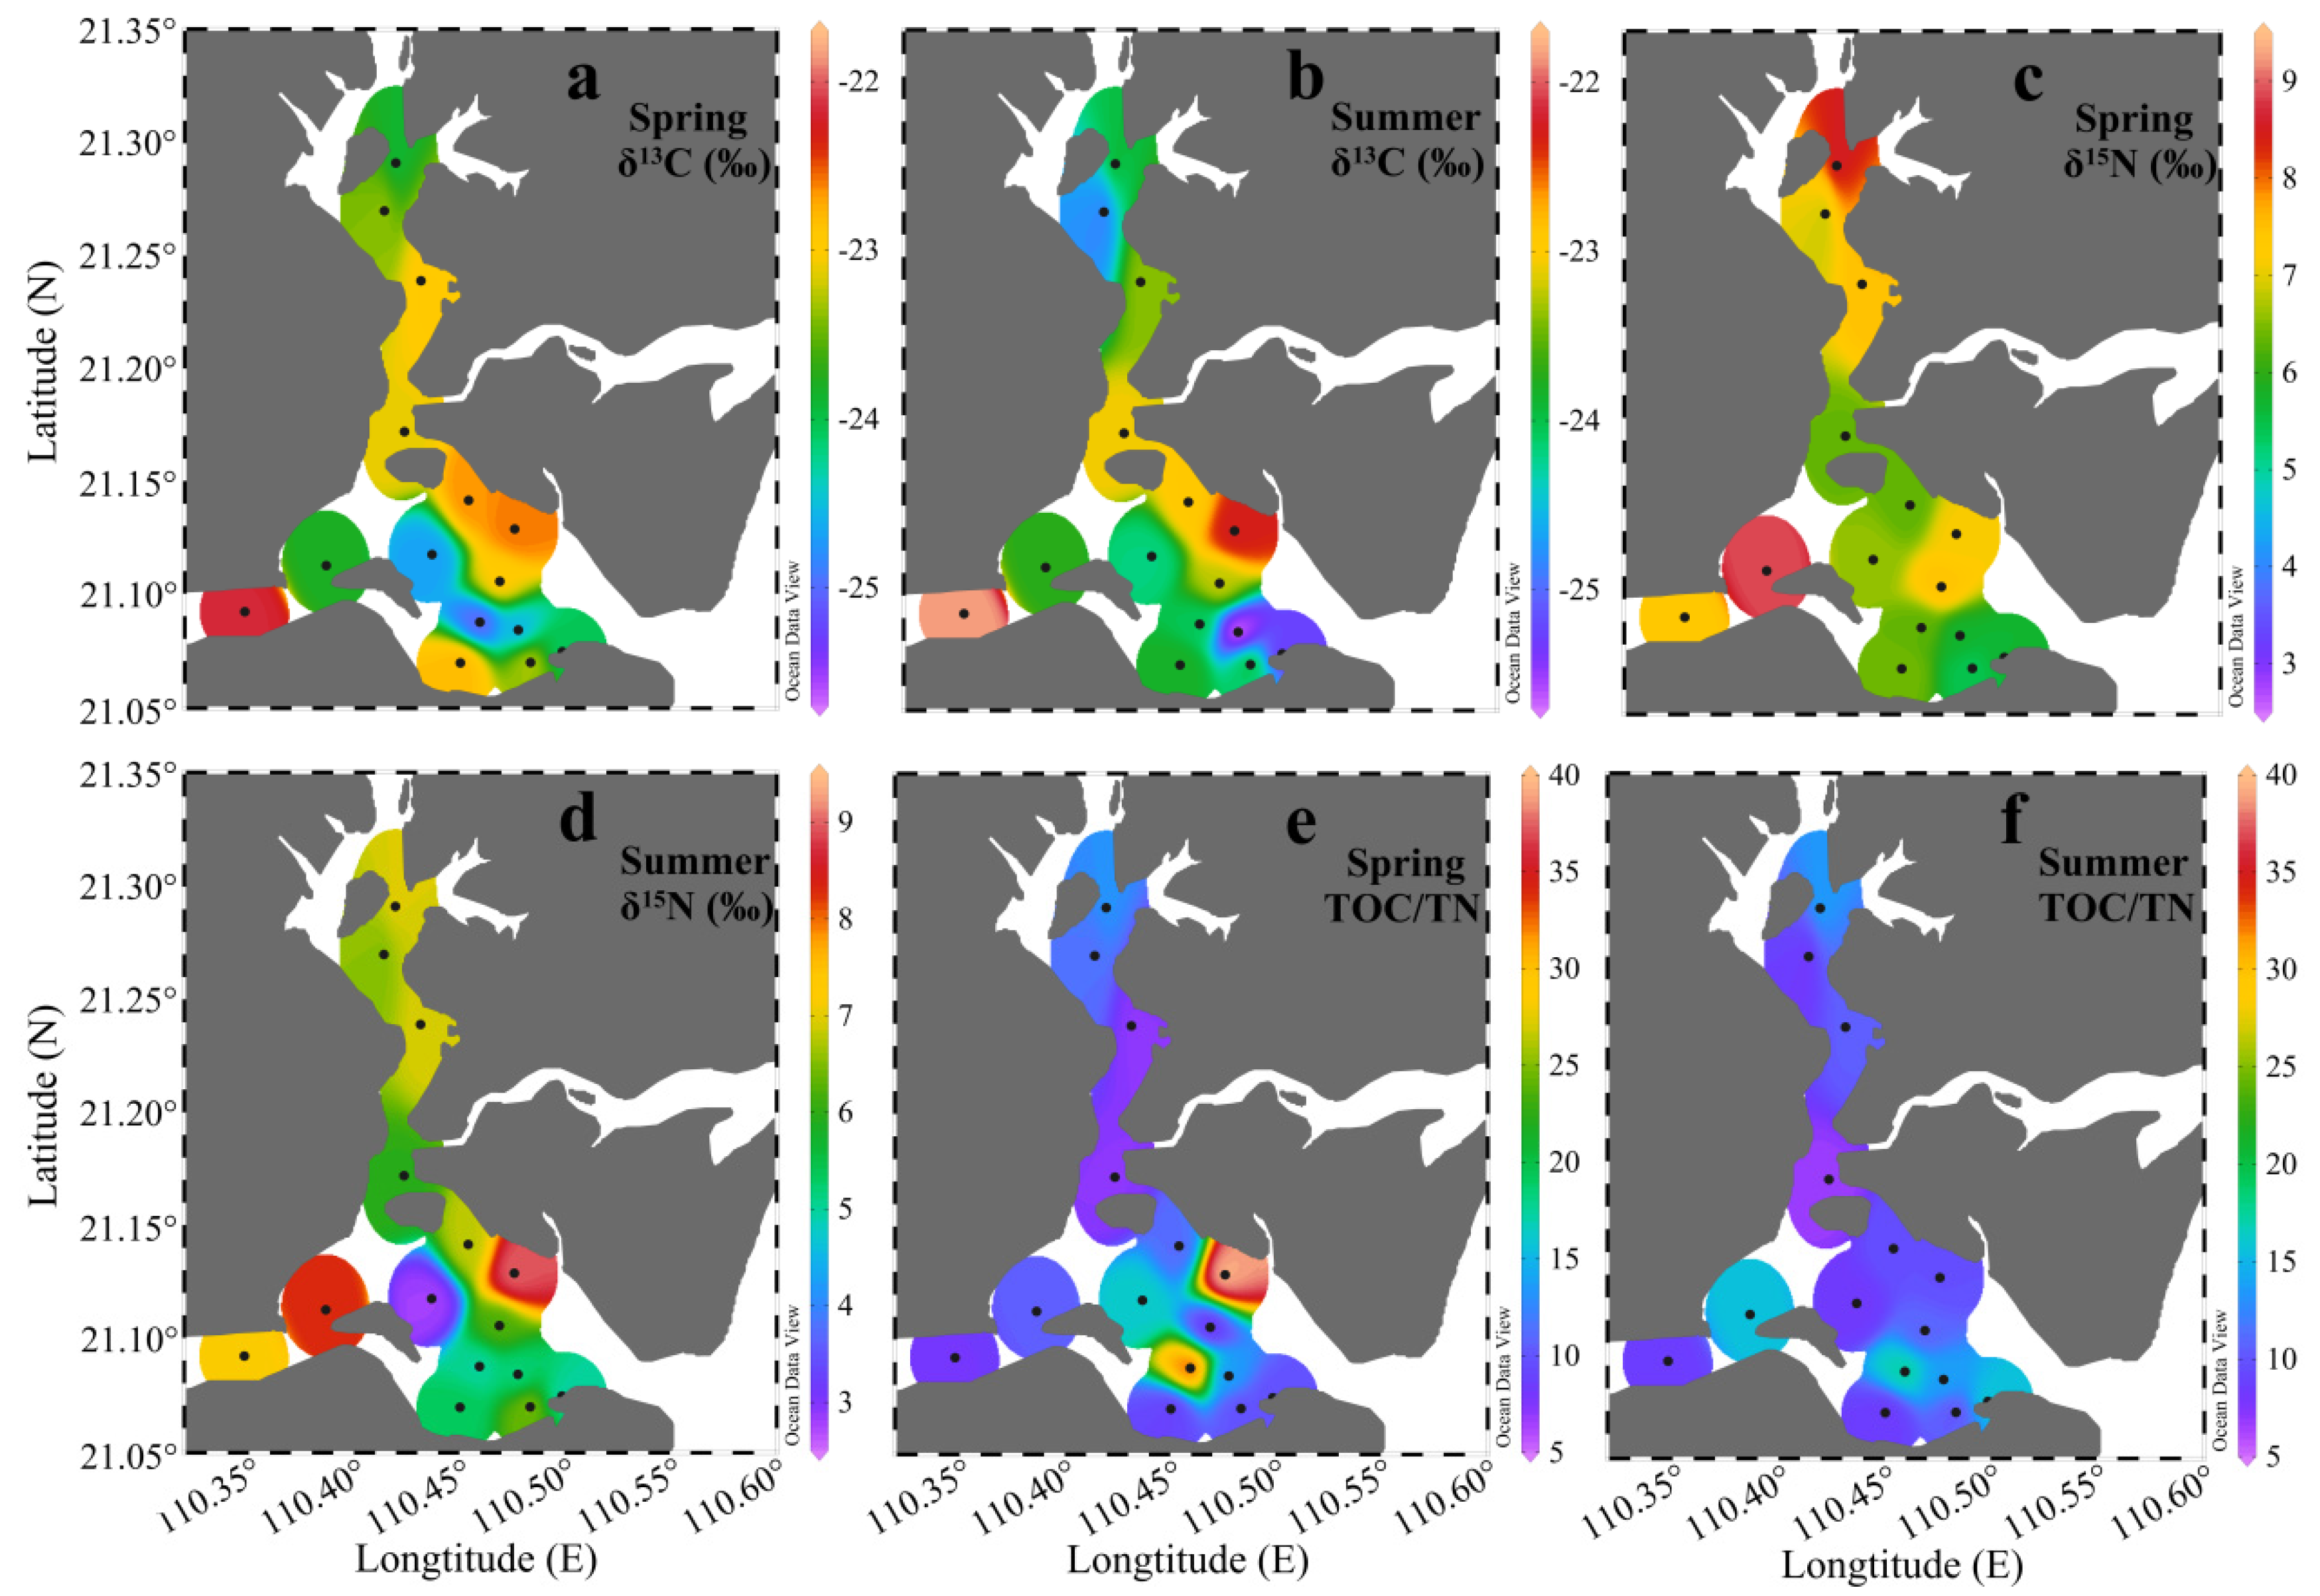
3.3. δ13C, δ15N, and TOC/TN
4. Discussion
4.1. Environmental Indications of TOC/TN, δ13C, and δ15N
4.1.1. Environmental Indications of TOC/TN
4.1.2. Environmental Indications of δ13C
4.1.3. Environmental Indications of δ15N
4.2. Quantification of Terrestrial and Marine Organic Matter Sources
5. Conclusions
Author Contributions
Funding
Conflicts of Interest
References
- Meyers, P.A. Applications of organic geochemistry to paleolimnological reconstructions: A summary of examples from the Laurentian Great Lakes. Org. Geochem. 2003, 34, 261–289. [Google Scholar] [CrossRef]
- Duarte, C.M.; Cebriàn, J. The fate of marine autotrophic production. Limnol. Oceanogr. 1996, 41, 1758–1766. [Google Scholar] [CrossRef]
- Bode, A.; Alvarez-Ossorio, M.T.; Varela, M. Phytoplankton and macrophyte contributions to littoral food webs in the Galician upwelling estimated from stable isotopes. Mar. Ecol. Prog. Ser. 2006, 318, 89–102. [Google Scholar] [CrossRef]
- Emerson, S.; Hedges, J.I. Processes controlling the organic carbon content of open ocean sediments. Paleoceanography 1988, 3, 621–634. [Google Scholar] [CrossRef]
- Thornton, S.F.; Mcmanus, J. Application of organic carbon and nitrogen stable isotope and C/N ratios as source indicators of organic matter provenance in estuarine systems: Evidence from the Tay Estuary, Scotland. Estuar. Coast. Shelf Sci. 1994, 38, 219–233. [Google Scholar] [CrossRef]
- Savoye, N.; Aminot, A.; Tréguer, P.; Fontugne, M.; Naulet, M.; Kérouel, R. Dynamics of particulate organic matter δ15N and δ13C during spring phytoplankton blooms in a macrotidal ecosystem (Bay of Seine, France). Mar. Ecol. Prog. Ser. 2003, 255, 27–41. [Google Scholar] [CrossRef]
- Tesi, T.; Miserocchi, S.; Goñi, M.A.; Langone, L.; Boldrin, A.; Turchetto, M. Organic matter origin and distribution in suspended particulate materials and surficial sediments from the Western Adriatic Sea (Italy). Estuar. Coast. Shelf Sci. 2007, 73, 431–446. [Google Scholar] [CrossRef]
- Liao, W.S.; Hu, J.F.; Zhou, H.D.; Hu, J.H.; Peng, P.A.; Deng, W.F. Sources and distribution of sedimentary organic matter in the Beibu Gulf, China: Application of multiple proxies. Mar. Chem. 2018, 206, 74–83. [Google Scholar] [CrossRef]
- Gao, X.L.; Yang, Y.W.; Wang, C.Y. Geochemistry of organic carbon and nitrogen in surface sediments of coastal Bohai Bay inferred from their ratios and stable isotopic signatures. Mar. Pollut. Bull. 2012, 64, 1148–1155. [Google Scholar] [CrossRef]
- Barros, G.V.; Martinelli, L.A.; Novais, T.M.O.; Ometto, J.P.H.B.; Zuppi, G.M. Stable isotopes of bulk organic matter to trace carbon and nitrogen dynamics in an estuarine ecosystem in Babitonga Bay (Santa Catarina, Brazil). Sci. Total Environ. 2010, 408, 2226–2232. [Google Scholar] [CrossRef]
- Vizzini, S.; Savona, B.; Chi, T.D.; Mazzola, A. Spatial variability of stable carbon and nitrogen isotope ratios in a Mediterranean coastal lagoon. Hydrobiologia 2005, 555, 73–82. [Google Scholar] [CrossRef]
- Sugimoto, R.; Kasai, A.; Yamao, S.; Fujiwara, T.; Kimura, T. Short-term variation in behavior of allocthonous particulate organic matter accompanying changes of river discharge in Ise Bay, Japan. Estuar. Coast. Shelf Sci. 2006, 66, 267–279. [Google Scholar] [CrossRef]
- Toming, K.; Tuvikene, L.; Vilbaste, S.; Agasild, H.; Viik, M.; Kisand, A.; Feldmann, T.; Martma, T.; Jones, R.I.; Nõges, T. Contributions of autochthonous and allochthonous sources to dissolved organic matter in a large, shallow, eutrophic lake with a highly calcareous catchment. Limnol. Oceanogr. 2013, 58, 1259–1270. [Google Scholar] [CrossRef]
- Yang, B.; Gao, X.L.; Xing, Q.G. Geochemistry of organic carbon in surface sediments of a region in the coastal waters of northern Shandong Peninsula summer hypoxic. Cont. Shelf Res. 2018, 171, 113–125. [Google Scholar] [CrossRef]
- Pan, Z.; Gao, Q.F.; Dong, S.L.; Wang, F.; Li, D.H.; Zhao, K.; Jiang, X.Y. Effects of abalone (Haliotis discus hannai Ino) and kelp (Saccharina japonica) mariculture on sources, distribution, and preservation of sedimentary organic carbon in Ailian Bay, China: Identified by coupling stable isotopes (δ13C and δ15N) with C/N ratio analyses. Mar. Pollut. Bull. 2019, 141, 387–397. [Google Scholar]
- Costanzo, S.D.; O’donohue, M.J.; Dennison, W.C.; Loneragan, N.R.; Thomas, M. A new approach for detecting and mapping sewage impacts. Mar. Pollut. Bull. 2001, 42, 149–156. [Google Scholar] [CrossRef]
- Gao, Q.F.; Shin, P.; Lin, G.H.; Chen, S.P.; Cheung, S.G. Stable isotope and fatty acid evidence for uptake of organic waste by green-lipped mussels Perna viridis in a polyculture fish farm system. Mar. Ecol. Prog. Ser. 2006, 317, 273–283. [Google Scholar] [CrossRef]
- He, B.; Dai, M.; Huang, W.; Liu, Q.; Chen, H.; Xu, L. Sources and accumulation of organic carbon in the Pearl River Estuary surface sediment as indicated by elemental, stable carbon isotopic, and carbohydrate compositions. Biogeosciences 2010, 7, 3343–3362. [Google Scholar] [CrossRef]
- Babarro, J.M.F.; Carrington, E. Attachment strength of the mussel Mytilus galloprovincialis: Effect of habitat and body size. J. Exp. Mar. Biol. Ecol. 2013, 443, 188–196. [Google Scholar] [CrossRef]
- Thompson, J.K.; Nichols, F.H. Food availability controls seasonal cycle of growth in Macoma balthica (L.) in San Francisco Bay, California USA. J. Exp. Mar. Biol. Ecol. 1988, 116, 43–62. [Google Scholar] [CrossRef]
- Hartnett, H.E.; Keil, R.G.; Al, E. Influence of oxygen exposure time on organic carbon preservation in continental marine regions. Nature 1998, 391, 572–575. [Google Scholar] [CrossRef]
- Cai, J.G.; Xu, J.L.; Yang, S.Y.; Bao, Y.J.; Lu, L.F. The fractionation of an argillaceous sediment and difference in organic matter enrichment in different fractions. Geol. J. China Univ. 2006, 12, 234–241. (In Chinese) [Google Scholar]
- Lesen, A.E. Sediment organic matter composition and dynamics in San Francisco Bay, California, USA: Seasonal variation and interactions between water column chlorophyll and the benthos. Estuar. Coast. Shelf Sci. 2006, 66, 501–512. [Google Scholar] [CrossRef]
- Keil, R. Anthropogenic forcing of carbonate and organic carbon preservation in marine sediments. Annu. Rev. Mar. Sci. 2017, 9, 151–172. [Google Scholar] [CrossRef]
- Bralower, T.J.; Thierstein, H.R. Low productivity and slow deep-water circulation in mid-Cretaceous oceans. Geology 1984, 12, 614–618. [Google Scholar] [CrossRef]
- Meyers, P.A.; Ishiwatari, R. Lacustrine organic geochemistry—An overview of indicators of organic matter sources and diagenesis in lake sediments. Org. Geochem. 1993, 20, 867–900. [Google Scholar] [CrossRef]
- Das, S.K.; Routh, J.; Roychoudhury, A.N.; Klump, J.V. Elemental (C, N, H and P) and stable isotope (δ15N and δ13C) signatures in sediments from Zeekoevlei, South Africa: A record of human intervention in the lake. J. Paleolimnol. 2008, 39, 349–360. [Google Scholar] [CrossRef]
- Zhou, F.X.; Gao, X.L.; Yuan, H.M.; Song, J.M.; Chen, C.T.A.; Lui, H.K.; Zhang, Y. Geochemical forms and seasonal variations of phosphorus in surface sediments of the East China Sea shelf. J. Mar. Syst. 2016, 159, 41–54. [Google Scholar] [CrossRef]
- Andrieux, F.; Aminot, A. A two-year survey of phosphorus speciation in the sediments of the Bay of Seine (France). Cont. Shelf Res. 1997, 17, 1229–1245. [Google Scholar] [CrossRef]
- Rydin, E. Potentially mobile phosphorus in Lake Erken sediment. Water Res. 2000, 34, 2037–2042. [Google Scholar] [CrossRef]
- Smith, V.H.; Tilman, G.D.; Nekola, J.C. Eutrophication: Impacts of excess nutrient inputs on freshwater, marine, and terrestrial ecosystems. Environ. Pollut. 1999, 100, 179–196. [Google Scholar] [CrossRef]
- Howarth, R.W.; Sharpley, A.; Walker, D. Sources of nutrient pollution to coastal waters in the United States: Implications for achieving coastal water quality goals. Estuar. Coast. 2002, 25, 656–676. [Google Scholar] [CrossRef]
- Scavia, D.; Bricker, S.B. Costal eutrophication in the assessment in the United States. Biogeochemistry 2006, 79, 187–208. [Google Scholar] [CrossRef]
- Liu, X.J.; Ge, C.D. Spatial and temporal variations of sedimented organic matter in Xiaohai Lagoon, Hainan Island. Acta Oceanol. Sin. 2012, 31, 74–87. [Google Scholar] [CrossRef]
- Medeiros, P.M.; Bıcego, M.C.; Castello, R.M.; Del Rosso, C.; Fillmann, G.; Zamboni, A.J. Natural and anthropogenic hydrocarbon inputs to sediments of Patos Lagoon Estuary, Brazil. Environ. Int. 2005, 31, 77–87. [Google Scholar] [CrossRef] [PubMed]
- Sarkar, A.; Chakraborty, P.; Nath, N. Distribution and nature of sedimentary organic matter in a tropical estuary: An indicator of human intervention on environment. Mar. Pollut. Bull. 2016, 102, 176–186. [Google Scholar] [CrossRef] [PubMed]
- Bourbonniere, R.A.; Meyers, P.A. Sedimentary geolipid records of historical changes in the watersheds and productivities of Lake Ontario and Erie. Limnol. Oceanogr. 1996, 41, 352–359. [Google Scholar] [CrossRef]
- Holmer, M.; Marba, N.; Diaz-Almela, E.; Duarte, C.M.; Tsapakis, M.; Danovaro, R. Sedimentation of organic matter from fish farms in oligotrophic Mediterranean assessed through bulk and stable isotope (δ13C and δ15N) analyses. Aquaculture 2007, 262, 268–280. [Google Scholar] [CrossRef]
- Gu, Y.G.; Lin, Q.; Jiang, S.J.; Wang, Z.H. Metal pollution status in Zhelin Bay surface sediments inferred from a sequential extraction technique, South China Sea. Mar. Pollut. Bull. 2014, 81, 256–261. [Google Scholar] [CrossRef]
- Gu, Y.G.; Ouyang, J.; Ning, J.J.; Wang, Z.H. Distribution and sources of organic carbon, nitrogen and their isotopes in surface sediments from the largest mariculture zone of the eastern Guangdong coast, South China. Mar. Pollut. Bull. 2017, 120, 286–291. [Google Scholar] [CrossRef]
- Ke, S.; Zhao, L.R.; Sun, S.L. Distribution characteristics and sources of PAHs in sea water of the land-based outlet of Zhanjiang Bay. Mar. Environ. Sci. 2014, 33, 71–77. (In Chinese) [Google Scholar]
- Li, Z.Y.; Xu, S.J.; Xu, H.Y.; Cai, X. Value assessment of marine ecosystem service in Zhanjiang Bay. Mar. Environ. Sci. 2012, 31, 567–571. (In Chinese) [Google Scholar]
- Yu, J.; Chen, G.B.; Huang, Z.R.; Chen, Z.Z. Changes in the coastline of three typical bays in Guangdong during recent 10 years revealed by satellite image. Trans. Oceanol. Limnol. 2014, 3, 92–96. (In Chinese) [Google Scholar]
- Cai, L.C. The Spatial and Temporal Distribution of Carbon Isotope of Suspended Particulate Matter and Pollution Source Tracer in Zhanjiang Harbor. Master’s Thesis, Guangdong Ocean University, Zhanjiang, China, 2010. (In Chinese). [Google Scholar]
- Owen, R.B.; Lee, R. Human impacts on organic matter sedimentation in a proximal shelf setting, Hong Kong. Cont. Shelf Res. 2004, 24, 583–602. [Google Scholar] [CrossRef]
- Meagan, E.G.; Adina, P.; Jorge, A.; Herrera, S. Tracing organic matter sources and carbon burial in mangrove sediments over the past 160 years. Estuar. Coast. Shelf Sci. 2004, 61, 211–227. [Google Scholar]
- Aké-Castillo, J.A.; Vázquez, G. Phytoplankton variation and its relation to nutrients and allochthonous organic matter in a coastal lagoon on the Gulf of Mexico. Estuar. Coast. Shelf Sci. 2008, 78, 705–714. [Google Scholar] [CrossRef]
- Zillén, L.; Conley, D.J.; Andrén, T.; Andrén, E.; Björck, S. Past occurrences of hypoxia in the Baltic Sea and the role of climate variability, environmental change and human impact. Earth-Sci. Rev. 2008, 91, 77–92. [Google Scholar] [CrossRef]
- Huon, S.; Grousset, F.E.; Burdloff, D.; Bardoux, G.; Mariotti, A. Sources of fine-sized organic matter in North Atlantic Heinrich Layers: δ13C and δ15N tracers. Geochim. Cosmochim. Acta 2002, 66, 223–239. [Google Scholar] [CrossRef]
- Hu, J.; Peng, P.; Jia, G.; Mai, B.; Zhang, G. Distribution and sources of organic carbon, nitrogen and their isotopes in sediments of the subtropical Pearl River Estuary and adjacent shelf, Southern China. Mar. Chem. 2006, 98, 274–285. [Google Scholar] [CrossRef]
- Pondell, C.R.; Canuel, E.A. The role of hydrodynamic sorting on the accumulation and distribution of organic carbon in an impoundment: Englebright Lake, California, USA. Biogeochemistry 2017, 133, 129–145. [Google Scholar] [CrossRef]
- Meyers, P.A.; Teranes, J.L. Sediment organic matter. In Tracking Environmental Change Using Lake Sediments, Physical and Geochemical Methods; Last, W.M., Smol, J.P., Eds.; Kluwer Academic Publishers: Dordrecht, The Netherlands, 2001; Volume 2, pp. 239–269. [Google Scholar]
- Keil, R.G.; Montluçon, D.B.; Prahl, F.G.; Hedges, J.I. Sorptive preservation of labile organic matter in marine sediments. Nature 1994, 370, 549–552. [Google Scholar] [CrossRef]
- Mayer, L.M. Surface area control of organic carbon accumulation in continental shelf sediments. Geochim. Cosmochim. Acta 1994, 58, 1271–1284. [Google Scholar] [CrossRef]
- Andrews, J.A.; Greenaway, A.M.; Dennis, P.F. Combined carbon isotope and C/N ratios as indicators of source and fate of organic matter in a poorly flushed, tropical estuary: Hunts Bay, Kingston Harbour, Jamaica. Estuar. Coast. Shelf Sci. 1998, 46, 743–756. [Google Scholar] [CrossRef]
- Rocha, C. Rhythmic ammonium regeneration and flushing in intertidal sediments of the Sado Estuary. Limnol. Oceanogr. 1998, 43, 823–831. [Google Scholar] [CrossRef]
- Petersen, J.K.; Nielsen, T.G.; Duren, L.A.V.; Maar, M. Depletion of plankton in a raft culture of Mytilus galloprovincialis in Ría de Vigo, NW Spain. I. Phytoplankton. Aquat. Biol. 2015, 4, 113–125. [Google Scholar] [CrossRef]
- Yu, Z.T.; Wang, X.J.; Han, G.X.; Liu, X.Q.; Zhang, E.L. Organic and inorganic carbon and their stable isotopes in surface sediments of the Yellow River Estuary. Sci. Rep. 2018, 8, 10825. [Google Scholar] [CrossRef]
- Gireeshkumar, T.R.; Deepulal, P.M.; Chandramohanakumar, N. Distribution and sources of sedimentary organic matter in a tropical estuary, south west coast of India (Cochin estuary): A baseline study. Mar. Pollut. Bull. 2013, 66, 239–245. [Google Scholar] [CrossRef]
- Pradhan, U.K.; Wu, Y.; Shirodkar, P.V.; Zhang, J.; Zhang, G.S. Sources and distribution of organic matter in thirty five tropical estuaries along the west coast of India-a preliminary assessment. Estuar. Coast. Shelf Sci. 2014, 151, 21–33. [Google Scholar] [CrossRef]
- Meyers, P.A. Organic geochemical proxies of paleoceanographic, paleolimnologic, and paleoclimatic processes. Org. Geochem. 1997, 27, 213–250. [Google Scholar] [CrossRef]
- Zhang, L.; Chen, F.R.; Yin, K.D.; Lü, Y.; Yang, Y.Q.; Zhang, D.R. The characteristics and sources of surface sediments in the Pearl River Estuary and its adjacent shelves. J. Trop. Oceanogr. 2010, 29, 98–103. (In Chinese) [Google Scholar]
- Zhou, F.X.; Gao, X.L.; Yuan, H.M.; Song, J.M.; Chen, F.J. The distribution and seasonal variations of sedimentary organic matter in the East China Sea shelf. Mar. Pollut. Bull. 2018, 129, 163–171. [Google Scholar] [CrossRef] [PubMed]
- Hu, L.M.; Guo, Z.G.; Feng, J.L.; Yang, Z.S.; Fang, M. Distributions and sources of bulk organic matter and aliphatic hydrocarbons in surface sediments of the Bohai Sea, China. Mar. Chem. 2009, 113, 197–211. [Google Scholar] [CrossRef]
- Li, D.; Yao, P.; Bianchi, T.; Zhang, T.T.; Zhao, B.; Pan, H.H.; Wang, J.P.; Yu, Z.G. Organic carbon cycling in sediments of the Changjiang Estuary and adjacent shelf: Implication for the influence of Three Gorges Dam. J. Mar. Syst. 2014, 139, 409–419. [Google Scholar] [CrossRef]
- Zhang, L.; Yin, K.D.; Wang, L.; Chen, F.R.; Zhang, D.R.; Yang, Y.Q. The sources and accumulation rate of sedimentary organic matter in the Pearl River Estuary and adjacent coastal area, Southern China. Estuar. Coast. Shelf Sci. 2009, 85, 190–196. [Google Scholar] [CrossRef]
- Cao, Y.Y.; Xing, L.; Zhang, T.; Liao, W.H. Multi-proxy evidence for decreased terrestrial contribution to sedimentary organic matter in coastal areas of the East China Sea during the past 100 years. Sci. Total Environ. 2017, 599–600, 1895–1902. [Google Scholar] [CrossRef] [PubMed]
- Liu, M.; Hou, L.J.; Xu, S.Y.; Ou, D.N.; Jiang, H.Y.; Yu, J.; Gardner, W.S. Carbon and nitrogen stable isotopes as tracers to source organic matter in the Yangtze Estuary. Acta Geogr. Sin. 2004, 59, 918–926. (In Chinese) [Google Scholar]
- Yang, B.; Cao, L.; Liu, S.M.; Zhang, G.S. Biogeochemistry of bulk organic matter and biogenic elements in surface sediments of the Yangtze River Estuary and adjacent sea. Mar. Pollut. Bull. 2015, 96, 471–484. [Google Scholar] [CrossRef]
- Prahl, F.G.; Ertel, J.R.; Goni, M.A.; Sparrow, M.A.; Eversmeyer, B. Terrestrial organic carbon contributions to sediments on the Washington margin. Geochim. Cosmochim. Acta 1994, 58, 3035–3048. [Google Scholar] [CrossRef]
- Hedges, J.I.; Clark, W.A.; Cowie, G.L. Organic matter sources to the water column and surficial sediments of a marine bay. Limnol. Oceanogr. 1988, 33, 1116–1136. [Google Scholar] [CrossRef]
- Wu, Y.; Zhang, J.; Li, D.J.; Wei, H.; Lu, R.X. Isotope variability of particulate organic matter at the PN in the East China Sea. Biogeochemistry 2003, 65, 31–49. [Google Scholar] [CrossRef]
- Talbot, M.R.; Livingstone, D.A. Hydrogen index and carbon isotopes of lacustrine organic matter as lake level indicators. Palaeogeogr. Palaeoclimatol. Palaeoecol. 1989, 70, 121–137. [Google Scholar] [CrossRef]
- Woodward, C.A.; Potito, A.P.; Beilman, D.W. Carbon and nitrogen stable isotope ratios in surface sediments from lakes of western Ireland: Implications for inferring past lake productivity and nitrogen loading. J. Paleolimnol. 2012, 47, 167–184. [Google Scholar] [CrossRef]
- Chen, F.J.; Chen, C.Q.; Zhou, F.X.; Lao, Q.B.; Zhu, Q.M.; Zhang, S.W. Nutrients in atmospheric wet deposition in the Zhanjiang Bay. China Environ. Sci. 2017, 37, 2055–2063. (In Chinese) [Google Scholar]
- Pancost, R.D.; Boot, C.S. The palaeoclimatic utility of terrestrial biomarkers in marine sediments. Mar. Chem. 2004, 92, 239–261. [Google Scholar] [CrossRef]
- Ramaswamy, V.; Gaye, B.; Shirodkar, P.; Rao, P.; Chivas, A.; Wheeler, D.; Thwin, S. Distribution and sources of organic carbon, nitrogen and their isotopic signatures in sediments from the Ayeyarwady (Irrawaddy) continental shelf, northern Andaman Sea. Mar. Chem. 2008, 111, 137–150. [Google Scholar] [CrossRef]
- Schelske, C.L.; Hodell, D.A. Recent changes in productivity and climate of Lake Ontario detected by isotopic analysis of sediments. Limnol. Oceanogr. 1991, 36, 961–975. [Google Scholar] [CrossRef]
- Meyers, P.A. Preservation of elemental and isotopic source identification of sedimentary organic matter. Chem. Geol. 1994, 114, 289–302. [Google Scholar] [CrossRef]
- Jia, G.; Peng, P. Temporal and spatial variations in signatures of sedimented organic matter in Lingding Bay (Pearl estuary), Southern China. Mar. Chem. 2003, 82, 47–54. [Google Scholar] [CrossRef]
- Li, Y.; Niu, J.; Shen, Z.; Zhang, C.; Wang, Z.; He, T. Spatial and seasonal distribution of organochlorine pesticides in the sediments of the Yangtze estuary. Chemosphere 2014, 114, 233–240. [Google Scholar] [CrossRef]
- Shi, Y.Z.; Zhang, Y.B.; Sun, X.L. Spatiotemporal distribution of eutrophication and its relationship with environmental factors in Zhanjiang Sea Bay Area. Environ. Sci. Technol. 2015, 38, 90–96. (In Chinese) [Google Scholar]
- Liao, X.; Huang, H.; Liu, H.; Dai, M.; Yu, J.; Tian, Z. The spatial distribution of Chlorophyll a in water and surface sediment of Maowei Sea during summer. Mar. Sci. 2004, 282, 205–219. (In Chinese) [Google Scholar]
- Huang, X.P.; Huang, L.M.; Yue, W.Z. The characteristic of nutrients and eutrophication in the Pearl River estuary, South China. Mar. Pollut. Bull. 2003, 47, 30–36. [Google Scholar] [CrossRef]
- Huang, L.; Jian, W.; Song, X.; Huang, X.; Liu, S.; Qian, P.; Yin, K.; Wu, M. Species diversity and distribution for phytoplankton of the Pearl River estuary during rainy and dry seasons. Mar. Pollut. Bull. 2004, 49, 588–596. [Google Scholar] [CrossRef]
- Yin, K.; Zhang, J.; Qian, P.; Jian, W.; Huang, L.; Chen, J.; Wu, M.C.S. Effect of wind events on phytoplankton blooms in the Pearl River estuary during summer. Cont. Shelf Res. 2004, 24, 1909–1923. [Google Scholar] [CrossRef]
- Yu, F.L.; Zong, Y.Q.; Lloyd, J.M.; Huang, G.Q.; Leng, M.J.; Kendrick, C.; Lamb, A.L.; Yim, W.W.S. Bulk organic δ13C and C/N as indicators for sediment sources in the Pearl River delta and estuary, southern China. Estuar. Coast. Shelf Sci. 2010, 87, 618–630. [Google Scholar] [CrossRef]
- Vizzini, S.; Mazzola, A. Seasonal variations in the stable carbon and nitrogen isotoe ratios (13C/12C and 15N/14N) of primary producers and consumers in a western Mediterranean coastal lagoon. Mar. Biol. 2003, 142, 1009–1018. [Google Scholar] [CrossRef]
- Yokoyama, H.; Abo, K.; Ishihi, Y. Quantifying aquaculture-derived organic matter in the sediment in and around a coastal fish farm using stable carbon and nitrogen isotope ratios. Aquaculture 2006, 254, 411–425. [Google Scholar] [CrossRef]
- Dean, W.E.; Arthur, M.A.; Claypool, G.E. Depletion of 13C in Cretaceous marine organic matter: Source, diagenetic or environmental signal? Mar. Geol. 1986, 70, 119–157. [Google Scholar] [CrossRef]
- Vizzini, S.; Savona, B.; Caruso, M.; Savona, A.; Mazzola, A. Analysis of stable carbon and nitrogen isotopes as a tool for assessing the environmental impact of aquaculture: A case study from the western Mediterranean. Aquacult. Int. 2005, 13, 157–165. [Google Scholar] [CrossRef]
- Teranes, J.L.; Bernasconi, S.M. The record of nitrate utilization and productivity limitation provided by δ15N values in lake organic matter—A study of sediment trap and core sediments from Baldeggersee Switzerland. Limnol. Oceanogr. 2000, 45, 801–813. [Google Scholar] [CrossRef]
- Hansson, S.; Hobbie, J.E.; Elmgren, R.; Larsson, U.; Fry, B.; Johansson, S. The stable nitrogen isotope ratio as a marker of food-web interactions and fish migration. Ecology 1997, 78, 2249–2257. [Google Scholar] [CrossRef]
- Cole, M.L.; Valiela, I.; Kroeger, K.D.; Tomasky, G.L.; Cebrian, J.; Wigand, C.; McKinney, R.A.; Grady, S.P.; Da Silva, M.H.C. Assessment of a δ15N isotopic method to indicate anthropogenic eutrophication in aquatic ecosystems. J. Environ. Qual. 2004, 33, 124–132. [Google Scholar] [CrossRef] [PubMed]
- Vizzini, S.; Mazzola, A. Stable isotope evidence for the environmental impact of a land-based fish farm in the western Mediterranean. Mar. Pollut. Bull. 2004, 49, 61–70. [Google Scholar] [CrossRef] [PubMed]
- Wada, E.; Kadonaga, T.; Matsuo, S. 15N abundance in nitrogen of naturally occurring substances and global assessment of denitrification from isotopic viewpoint. Geochem. J. 1975, 9, 139–148. [Google Scholar] [CrossRef]
- Michener, R.H.; Schell, D.M. Stable isotope ratios as tracers in marine aquatic food webs. In Stable Isotopes in Ecology and Environmental Sciences; Lajtha, K., Michener, R.H., Eds.; Black-Well: Oxford, UK, 1994; pp. 138–157. [Google Scholar]
- Zhang, J.; Wu, Y.; Jennerjahn, T.C.; Ittekkot, V.; He, Q. Distribution of organic matter in the Changjiang (Yangtze River) Estuary and their stable carbon and nitrogen isotopic ratios: Implications for source discrimination and sedimentary dynamics. Mar. Chem. 2007, 106, 111–126. [Google Scholar] [CrossRef]


| Season | Clay (%) | Silt (%) | Sand (%) |
|---|---|---|---|
| Spring | 18.4 ± 8.6 | 58.9 ± 16.2 | 22.7 ± 22.9 |
| Summer | 20.4 ± 8.7 | 62.3 ± 15.4 | 17.3 ± 22.2 |
| Season | Subregion | TOC (%) | TN (%) | TOC/TN | δ13C (‰) | δ15N (‰) | Clay (%) | Silt (%) | Sand (%) |
|---|---|---|---|---|---|---|---|---|---|
| Spring | Channel | 0.94 ± 0.41 | 0.12 ± 0.07 | 9.6 ± 2.5 | −23.2 ± 0.6 | 7.6 ± 1.0 | 21.3 ± 6.8 | 66.4 ± 11.5 | 12.4 ± 16.0 |
| Coastal Bay | 0.60 ± 0.43 | 0.07 ± 0.06 | 15.8 ± 13.2 | −23.1 ± 0.6 | 6.2 ± 0.7 | 18.5 ± 12.7 | 49.0 ± 21.5 | 32.4 ± 33.2 | |
| Central Bay | 0.48 ± 0.28 | 0.05 ± 0.05 | 17.7 ± 10.5 | −24.3 ± 0.9 | 6.5 ± 0.7 | 13.9 ± 2.5 | 60.2 ± 10.9 | 25.9 ± 12.9 | |
| Summer | Channel | 0.71 ± 0.33 | 0.09 ± 0.06 | 10.6 ± 3.6 | −23.5 ± 1.0 | 7.0 ± 0.8 | 27.7 ± 5.3 | 70.3 ± 5.4 | 2.0 ± 0.7 |
| Coastal Bay | 0.50 ± 0.35 | 0.06 ± 0.05 | 10.8 ± 2.9 | −23.7 ± 1.1 | 6.5 ± 1.6 | 17.5 ± 9.8 | 53.9 ± 21.0 | 28.6 ± 30.1 | |
| Central Bay | 0.51 ± 0.07 | 0.05 ± 0.02 | 12.6 ± 3.8 | −24.3 ± 1.0 | 4.8 ± 1.4 | 14.7 ± 5.5 | 61.5 ± 10.8 | 23.8 ± 13.7 | |
| Spring and Summer | Channel | 0.82 ± 0.37 | 0.11 ± 0.06 | 10.1 ± 3.0 | −23.3 ± 0.8 | 7.3 ± 0.9 | 24.2 ± 6.8 | 68.2 ± 9.1 | 7.7 ± 12.6 |
| Coastal Bay | 0.55 ± 0.38 | 0.06 ± 0.05 | 13.3 ± 9.4 | −23.4 ± 0.9 | 6.4 ± 1.2 | 18.0 ± 10.7 | 51.4 ± 20.2 | 30.5 ± 29.9 | |
| Central Bay | 0.49 ± 0.19 | 0.05 ± 0.04 | 15.2 ± 7.8 | −24.3 ± 0.9 | 5.7 ± 1.4 | 14.2 ± 3.7 | 60.7 ± 9.9 | 25.0 ± 12.1 |
| Season | Variables | Clay | Silt | Sand | TOC | TN | TOC/TN | δ13C | δ15N |
|---|---|---|---|---|---|---|---|---|---|
| Spring | TOC | 0.731 b | 0.811 c | −0.848 c | 1 | ||||
| TN | 0.689 b | 0.761 b | −0.797 c | 0.939 c | 1 | ||||
| TOC/TN | −0.482 | −0.461 | 0.507 | −0.505 | −0.611 a | 1 | |||
| δ13C | 0.497 | 0.131 | −0.279 | 0.497 | 0.572 a | −0.225 | 1 | ||
| δ15N | −0.064 | 0.006 | 0.019 | 0.053 | 0.064 | −0.026 | 0.161 | 1 | |
| Summer | TOC | 0.704 b | 0.564 a | −0.665 b | 1 | ||||
| TN | 0.720 b | 0.467 | −0.604 a | 0.935c | 1 | ||||
| TOC/TN | −0.641 a | −0.086 | 0.309 | −0.456 | −0.670 b | 1 | |||
| δ13C | 0.294 | 0.015 | −0.125 | 0.352 | 0.339 | −0.426 | 1 | ||
| δ15N | 0.042 | −0.188 | 0.114 | −0.082 | −0.098 | 0.002 | 0.544 a | 1 |
| Location | Sampling Time | δ13C (‰) | δ15N (‰) | TOC/TN | Reference | |
|---|---|---|---|---|---|---|
| Zhanjiang Bay | Apr., 2017 | Range | −25.0 to −22.2 | 5.4–8.9 | 7.1–39.4 | This study |
| Mean | -23.4 ± 0.8 | 6.8 ± 1.0 | 13.8 ± 9.4 | |||
| Aug., 2017 | Range | −25.7 to −21.8 | 2.8–9.0 | 6.7–17.2 | This study | |
| Mean | −23.7 ± 1.0 | 6.2 ± 1.5 | 11.2 ± 3.3 | |||
| Apr. and Aug., 2017 | Range | −25.7 to −21.8 | 2.8–9.0 | 6.7–39.4 | This study | |
| Mean | −23.6 ± 0.9 | 6.6 ±1.3 | 12.5 ± 7.1 | |||
| Beibu Gulf | Jul., 2010 | Range | −27.8 to −20.0 | 0.8–9.0 | 2.2–33.3 | [8] |
| Pearl River Estuary | Spring, 2003 | Range | −25.19 to −23.33 | 3.73–6.57 | 8.1–17.2 | [66] |
| Mar., 2005 | Range | na a | na | 8.50–15.32 | [62] | |
| Mean | −24.3 | na | na | |||
| 2001–2005 | Range | −26.1 to −21.3 | na | 6.5-22.4 | [18] | |
| Zheling Bay | Sep., 2013 | Range | −22.07 to −21.13 | 5.28–7.14 | 6.43–8.20 | [40] |
| East China Sea Shelf | May to Jun., 2014 | Range | −22.08 to −19.99 | 3.67–6.28 | 4.69–9.12 | [63] |
| Mean | −21.35 | 4.60 | 6.74 | |||
| Oct. to Nov., 2014 | Range | −21.97 to −20.10 | 4.60–6.13 | 4.78–8.89 | [63] | |
| Mean | −21.00 | 5.32 | 6.73 | |||
| Coastal Areas of the East China Sea | Jun., 2010 | Range | −21.8 to −20.7 | na | na | [67] |
| Changjiang Estuary | na | Range | −29.8 to −23.7 | 1.0–7.8 | na | [68] |
| Changjiang Estuary and Adjacent Sea | 2006–2007 | Range | −23.8 to 20.7 | na | na | [69] |
| Jul. to Aug., 2001 | Range | −23.6 to −20.4 | na | 6.4–7.9 | [65] | |
| Mean | −22.5 | na | 7.1 | |||
| Ailian Bay | Aug., 2016 | Range | −19.75 to −18.50 | 6.59–7.32 | 6.29–8.39 | [15] |
| Sishili Bay | Nov., 2008 | Range | −22.7 to −21.6 | 5.4–6.5 | 7.9–10.1 | [34] |
| Bohai Bay | 2006 | Range | −23.9 to −21.7 | na | 3.3–7.7 | [64] |
| Coastal Bohai Bay | May, 2008 | Range | −25.69 to −18.23 | na | 10.8–42.6 | [9] |
| Mean | −22.86 ± 1.43 | 4.05 ± 0.53 | 21.3 ± 6.1 | |||
| Washington Continental Shelf | Range | −25.5 to −22.6 | na | 12.1–17.5 | [70] | |
| Mean | −23.9 ± 0.9 | na | 14.5 ± 1.6 |
© 2020 by the authors. Licensee MDPI, Basel, Switzerland. This article is an open access article distributed under the terms and conditions of the Creative Commons Attribution (CC BY) license (http://creativecommons.org/licenses/by/4.0/).
Share and Cite
Lu, X.; Zhou, F.; Chen, F.; Lao, Q.; Zhu, Q.; Meng, Y.; Chen, C. Spatial and Seasonal Variations of Sedimentary Organic Matter in a Subtropical Bay: Implication for Human Interventions. Int. J. Environ. Res. Public Health 2020, 17, 1362. https://doi.org/10.3390/ijerph17041362
Lu X, Zhou F, Chen F, Lao Q, Zhu Q, Meng Y, Chen C. Spatial and Seasonal Variations of Sedimentary Organic Matter in a Subtropical Bay: Implication for Human Interventions. International Journal of Environmental Research and Public Health. 2020; 17(4):1362. https://doi.org/10.3390/ijerph17041362
Chicago/Turabian StyleLu, Xuan, Fengxia Zhou, Fajin Chen, Qibin Lao, Qingmei Zhu, Yafei Meng, and Chunqing Chen. 2020. "Spatial and Seasonal Variations of Sedimentary Organic Matter in a Subtropical Bay: Implication for Human Interventions" International Journal of Environmental Research and Public Health 17, no. 4: 1362. https://doi.org/10.3390/ijerph17041362
APA StyleLu, X., Zhou, F., Chen, F., Lao, Q., Zhu, Q., Meng, Y., & Chen, C. (2020). Spatial and Seasonal Variations of Sedimentary Organic Matter in a Subtropical Bay: Implication for Human Interventions. International Journal of Environmental Research and Public Health, 17(4), 1362. https://doi.org/10.3390/ijerph17041362