Abstract
To summarize utility estimates of breast cancer and to assess the relative impacts of study characteristics on predicting breast cancer utilities. We searched Medline, Embase, RISS, and KoreaMed from January 1996 to April 2019 to find literature reporting utilities for breast cancer. Thirty-five articles were identified, reporting 224 utilities. A hierarchical linear model was used to conduct a meta-regression that included disease stages, assessment methods, respondent type, age of the respondents, and scale bounds as explanatory variables. The utility for early and late-stage breast cancer, as estimated by using the time-tradeoff with the scales anchored by death to perfect health with non-patients, were 0.742 and 0.525, respectively. The severity of breast cancer, assessment method, and respondent type were significant predictors of utilities, but the age of the respondents and bounds of the scale were not. Patients who experienced the health states valued 0.142 higher than did non-patients (p < 0.001). Besides the disease stage, the respondent type had the highest impact on breast cancer utility.
1. Introduction
Breast cancer is one of the most frequent female cancers in the world, with approximately 2.09 million women newly diagnosed in 2018 [1,2]. The incidence varies across geographic locations, ranging from 18.4 per 100,000 in North Africa and the Middle East to 32.5 in Central Europe [3,4]. Breast cancer is the fifth most common cancer in Korea in 2017 [5], and the age-standardized incidence has escalated rapidly, from 26.8 per 100,000 in 1999 to 46.4 per 100,000 in 2019 [3,4].
Unlike western countries, where patients are predominantly postmenopausal [6], premenopausal patients represent approximately 15% of all patients in Korea [7], which is three times higher than that observed in western countries. Specifically, the prevalence of breast cancer is the highest in their 40s (39.7%), followed by 50s (24.98%) and 30s (14.80%) in Korea [8].
With the introduction of various surgical and non-surgical treatment options, the 5-year survival rates for non-metastatic breast cancer has been improved to as high as 92% for stage I patients [9]. Yet, these treatment options can have several negative effects on patients’ quality of life, which suggests that patients might have their life expectancy extended at the expense of their quality of life [10,11,12]. However, patients and health care providers consider both morbidity and mortality [11], so an outcome measure that incorporates both the quality and quantity of life, such as quality-adjusted life-years (QALYs), is suitable for evaluating the health outcomes of breast cancer patients [13]. Additionally, QALYs are used in the cost-utility analysis, which is a type of economic evaluation of health interventions. This is particularly relevant in cancer, where costly treatment options are frequently developed [14,15]. However, previous studies have suggested that breast cancer patients’ quality of life weights vary greatly, ranging from 0.39 to 0.61 for progressive breast cancer and from 0.52 to 0.81 for metastatic breast cancer, for example [16]. This has been frequently reported in other diseases as well [17,18,19,20,21]. These variations could be explained by the different assessment methods (direct vs. indirect methods, and subgroups of direct and indirect methods) [19,22]; types of respondents (patients allocate significantly higher utilities than does the general public) [17,21]; lower or upper bounds of scales, especially the upper anchor (the disutilities estimated from a disease-free anchor are considerably higher than those estimated from a perfect health anchor) [18,23]. Many countries have adopted economic evaluation in their reimbursement process with the introduction of various expensive drugs, where incorporating utility weights is commonly needed [24]. Although domestically obtained utility weights are generally preferred, they are not required in many jurisdictions [24], and the transferability of the utility weights are generally mixed [25]. Given that it is less feasible to obtain country-specific utility values for countries with limited infrastructure [20], providing a summary value could be very helpful for those countries.
Meta-regression has been frequently employed to summarize the QALYs to incorporate methodological heterogeneity [17,18,19]. However, it is vulnerable to false-positive results when there are too few studies or too many covariates or when methodological heterogeneity exists among the studies [26,27]. When considering breast cancer patients’ quality of life, the impacts of time since cancer diagnosis, and racial factors on utilities are inconsistent [28,29,30,31], whereas patients’ age at diagnosis and, in particular, menopausal status have been reported to consistently have a significant impact [12,32,33,34,35,36,37]. Namely, the negative impact of breast cancer on utilities was approximately four times higher for women aged 18–44 than it was for women aged ≥45 [12]. Thus, breast cancer patients’ age should be considered when estimating their preferences [12]. However, the importance of breast cancer patients’ age has been published only recently [12,36,38,39], which highlights the need to incorporate age into such analyses.
Our study has two objectives: (1) to summarize the publicly available utility values of breast cancer patients, and (2) to assess the relative impacts of study design characteristics on predicting the utilities for breast cancer. More specifically, we sought to examine whether age is a critical factor in explaining breast cancer patients’ utilities.
2. Materials and Methods
2.1. Data Collection
To identify studies reporting breast cancer patients’ utilities, we searched the Medline and Embase databases, along with Korean databases (Koreamed, RISS), for articles written in English and Korean. Korean studies were included in our analysis to better reflect the premenopausal patients’ quality of life since premenopausal patients comprise three times higher than that of western countries in Korea [7]. Studies published from January 1996 to April 2019 with the keywords “breast cancer/breast neoplasm”, “health-related quality of life”, “QALY”, “utility”, “quality-adjusted life year” and in which utilities were estimated using generic (direct and indirect) utility instruments, such as standard gamble (SG), time-tradeoff (TTO), rating scale (RS), Euroqual-5 dimension (EQ-5D), health utility instrument (HUI), short-form 6 dimension (SF-6D) and quality of well being (QWB), were included. We excluded studies that were only available as abstracts, not original research (referring to utility values obtained from previous studies, reviews, comments, or editorials), or not written in English or Korean. We also excluded utilities reporting the median rather than the mean of the utilities to be consistent with previous studies [40,41].
Utilities that had been transformed from non-preference-based, condition-specific instruments were not included in our analysis because of the methodological concerns related to mapping [42,43]. Two independent reviewers (JK, JH) reviewed the identified articles and discussed the inclusion/exclusion of the articles. Disagreement was resolved by consensus.
2.2. Data Extraction
We extracted the following information from the identified articles because those variables were reported to be associated with the health state utility values (HSUVs): (1) first author, name of the journal, and year of publication; (2) disease stage (early (stage 1 and 2), late (stage 3 and 4), based on the clinical definition, or not clarified) [44,45]; (3) assessment method (e.g., EQ-5D, HUI2/3, SF-6D, TTO, SG, RS); (4) respondent type (patient vs. non-patient (general public, experts, or others)) to incorporate patients’ experience with the health state utility values (HSUVs) [46,47]; (5) lower bound of the scale (death, other); (6) upper bound of the scale (perfect health, other) [23]; and (7) respondent age (non-clarified, premenopause vs. postmenopause, with 50 being the cutoff) [48,49]. If premenopausal and postmenopausal respondents are mixed together, then it was classified as “not clarified”.
Breast cancer surgery (mastectomy or other) was not considered because it was not significant in a previous meta-regression analysis [40], and more than half of the utilities did not clarify surgery status (data not shown). Other variables (chemotherapy, response to treatment) were not included in our analyses because clear information was not available in many studies.
2.3. Statistical Analysis
To incorporate heterogeneity into the study design, we conducted a meta-regression using a hierarchical linear model (HLM), which is a mixed-effects regression model for nested designs [50]. A single study is likely to contain more than one utility estimate; thus, those values are likely to be correlated. This violates the assumption of independence necessary for a traditional ordinary least square regression model. In our HLM model, each utility value is treated as being nested within a cluster, which is the study the utility is being reported.
We included six explanatory variables in the model: disease stage, assessment method, types of the respondent, administration method, lower and upper bounds of the scale, and the age of the respondent, with the utility being the dependent variable. The statistical significance of the predictor variables was assumed if the p-value was lower than 0.05. The model employed a random intercept for each study, with a common slope used across all groups [18,51].
The reference case for the model was early-stage breast cancer, postmenopausal, rated by non-patients (own health) using TTO, interviewed with a scale ranging from death to perfect health.
The utility values were not transformed because they showed a normal distribution, which is consistent with a previous study [18]. Thus, data transformation was not required. Administration method was frequently missing in many studies; we included those studies with unspecified administration methods in the analysis to yield as many samples as possible. Statistical analysis was performed using the Proc Mixed procedures in SAS version 9.4 (SAS Institute Inc., Cary, NC, USA).
3. Results
3.1. Literature Review
We initially identified 224 studies reporting QALYs for breast cancer, and after excluding 49 duplicate studies, we reviewed 175 abstracts. Ninety-five studies were excluded based on the abstracts, leaving 80 studies for full-text review. An additional 45 of those studies were excluded because they did not clarify the disease state [32,52,53,54,55,56,57,58] or were redundant with previous [59,60,61,62] studies where utilities were not clearly reported [63,64,65,66,67,68,69,70,71,72,73,74,75,76,77], leaving 35 studies [16,31,37,78,79,80,81,82,83,84,85,86,87,88,89,90,91,92,93,94,95,96,97,98,99,100,101,102,103,104,105,106,107,108,109] for our analysis (Table 1, Figure 1).

Table 1.
Study characteristics.
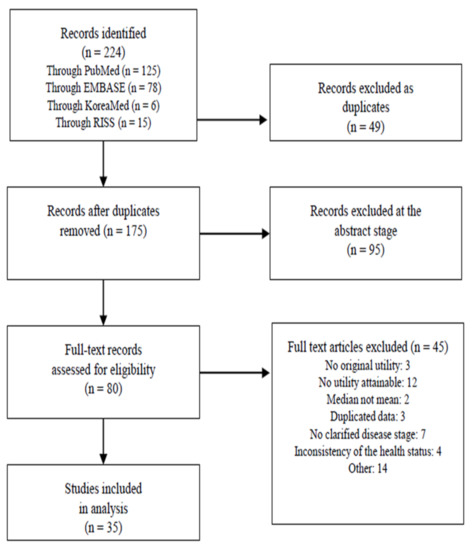
Figure 1.
Flow diagram of the systematic review of breast cancer utility studies.
3.2. Study Characteristics
Of those 35 studies, 18 had been published since 2010 [16,31,78,79,80,82,85,86,88,91,94,95,96,103,104,106,108,109] (Table 1). 16 of the 35 studies were conducted in Europe, and 10 in Asia. Frequently, the age of the participants was not clearly divided based on the menopausal status (Table 1). Overall, 224 utility values were collected in the 35 studies (Table 2). Of those 224 utilities, 38.8% evaluated early-stage (n = 87), while 31.3% (n = 70) corresponded to stages III and IV, and 29.9% of them did not specify the disease states (Table 2). RS was most frequently used (37.1%, n = 83), followed by EQ-5D (27.7%, n = 62) and SG (21.4%, n = 48). EQ-5D and RS were more likely to be used in studies published after 2010 (38% and 45% of the utilities, respectively) than in studies published before 2010 (19% and 30% of the utilities, respectively). However, the use of SG and TTO plummeted from 29% and 22% in the earlier period to 13% and 4% in the later period, respectively (Figure A1).
Table 2.
Characteristics of the utility weights by disease stage, assessment method, respondent type, survey origin, scale bounds, and administration method.
Patients served as respondents in approximately 68.3% (n = 153) of the utilities, and younger (age < 50) respondents represented 16.1% of the respondent (n = 36, Table 2). 20.1% of the utilities defined the lower and upper anchors as death to perfect health, with “other” included best/worst possible health, good/full health, disease-free state, or anchors were not stated/defined. The quality of the included study was evaluated by Papaioannou and colleagues’ study [110]; loss to follow-up information was frequently missing, and the sample size and response rates varied widely. (Appendix B).
3.3. Regression Analysis
The results of the HLM model are shown in Table 3. We estimated the utility for the reference case for the early and late-stage (using the TTO with the scales anchored by death to perfect health estimated by non-patients) to be 0.742 and 0.525, respectively. Our analysis showed that the disease stage, assessment method, and types of respondents were significant predictors of utilities (p < 0.05). However, the lower and upper anchors of the scales and respondent age were not significant predictors. Specifically, the elicitation methods were significantly associated with the HSUVs, with TTO being highest (0.135 higher than those estimated from RS, holding constant all other variables), followed by SG and EQ-5D, and with RS being the lowest. Also, the response type was an important predictor; patients who experienced the health states valued 0.142 higher than did non-patients (p < 0.001, Figure 2). Age was not significantly associated with the HSUVs.
Table 3.
The result of the HLM model (n = 224): coefficient estimates, p-values, and 95% confidence intervals (CI) for the predictors of utilities.
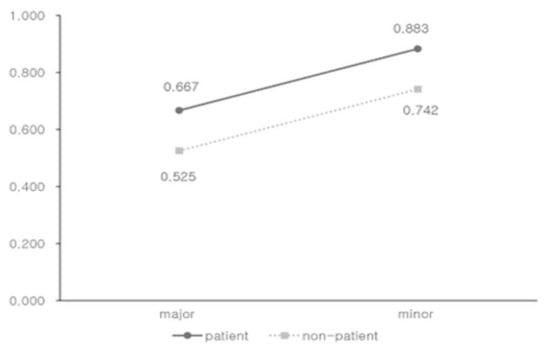
Figure 2.
Estimated utility values for breast cancer stages stratified by respondent type, using the time-tradeoff with the scales anchored by death to perfect health.
We conducted a subgroup analysis including 10 Asian studies [78,79,80,82,85,94,95,105,106,109], and the results were consistent with the main results in terms of the impact and the statistical significance of the respondent type (Table 4).
Table 4.
The result of the HLM model (n = 75, only including Asian countries): coefficient estimates, p-values, and 95% confidence intervals (CI) for the predictors of utilities.
4. Discussion
In this meta-regression analysis, we pooled 224 HSVs from 35 studies and estimated the breast cancer utility values of 0.742 and 0.525 for early- and late-stage breast cancer, respectively, using non-patients as the respondents, TTO as the elicitation method, lower and upper bounds of the scale as the death to perfect health and others, and the respondent age being 50 years and older.
We found that the disease stage was significantly associated with breast cancer utility values, which is consistent with previous studies [17,18,19]. Interestingly, the utilities estimated from TTO were the highest, followed by SG, EQ-5D, and RS, in the main model, while holding other variables constant. However, it has been reported that the values estimated from SG were usually highest, followed by TTO and RS [22,111]. The order of TTO and SG was switched in our study, as observed in other studies [19,40]. The difference between TTO and SG, however, was marginal (0.037), consistent with previous studies [37]. Our results also showed that the TTO values were higher than the EQ-5D values, as seen in previous studies [40,89]. Lidgren and colleagues reported that early-stage breast cancer patients were not willing to trade their life expectancy for improved quality of life, even though their current health status was far from perfect [89]. The authors speculated that those patients might assume their full recovery after treatment, which would improve their quantity and quality of life. Late-stage breast cancer patients might not be willing to trade their life expectancy at all; this is known as the violation of the constant proportional assumption and is prevalent in patients with limited life expectancy [112]. Thus, it is not surprising that the values obtained from TTO were higher than those obtained from EQ-5D or SG in breast cancer patients of all stages.
Our results illustrated that EQ-5D has been more frequently employed in studies published since 2010 (Appendix A). This might be associated with the fact that the UK NICE recommended the use of the EQ-5D as a reference case in 2008 [113,114], and Australian PBAC has stipulated that indirect preference-based, multi-attribute utility instruments (MAUIs) such as HUI, EQ-5D, and SF-6D are preferred [115]. In Korea, EQ-5D is the only MAUI that has a tariff for the general Korean population, and the Korean guidelines specified that preference should be preferably sourced from the domestic, general population, which explains the increased use of EQ-5D [116]. If appropriate elicitation methods for breast cancer were recommended based on the practicality, validity, and reliability [117], then the comparability and homogeneity among breast cancer studies would be enhanced.
Our study also suggested that the type of respondent had the highest impact on the utility, holding other variables constant. The utilities derived from patients were higher than non-patients in every condition, which is consistent with previous studies [22]. It is not surprising that the patient’s experience is the most significant predictor in the breast cancer utility estimate, since patients’ experience may influence more for those diseases with long life expectancy and good treatment options, such as breast cancer. Our finding is consistent with what has been discussed in the assessment methods, with breast cancer patients not willing to trade their life expectancy regardless of the disease stage. Although future study is needed, our analysis suggested that patients’ experience may count more for breast cancer patients, thus, special attention should be paid to selecting respondents.
Additionally, although the age of the respondent was reported to be significantly associated with the HSUVs by Brown and colleagues [12], with younger patients reporting lower HSUVs compared with their older counterparts, which is consistent with our study, statistical significance was still not achieved, which might be related with the fact that the age of the respondent was frequently not clarified (Table 2). Further study is required.
Our study sought to summarize breast cancer utility values by including relevant variables (age) and being limited to studies with clear information that could improve the reliability of the results considerably [27]. However, our study suffered the following limitations. First, insufficient information was available regarding the definition of the health states; we tried to keep as many studies as possible while having clear definitions of the health states, which forced us to classify the health states rather crudely (i.e., early-stage, late-stage). Information about the treatment type (types of surgery, types of chemotherapy) was also frequently missing in the original data, so although the treatment type could influence the HSVs, we could not include that variable in our analysis. In addition, the sample size and response rate of the included studies varied greatly, and little information was available regarding missing data, loss-to-follow up, or evaluating the appropriateness of the measure. Also, there was only one study using HUI3, which reported two health state values [97], which was excluded due to statistical concerns. We conducted sensitivity analyses including the study which used HUI3, and we categorized HUI3 and EQ-5D together as “MAUI”, and the results were still consistent with those of our main model. Finally, our base case analysis was based on the mean rather than the median of the utilities to be consistent with previous studies [41]. We conducted sensitivity analyses with studies reporting medians instead of means, and the results were consistent with our analysis.
5. Conclusions
The present study summarized the quality of life weights for breast cancer patients and demonstrated that disease severity, elicitation method, and response type were significantly associated with the weights but that the respondent age and scale bounds were not. Our analysis suggested that the respondent had the highest impact on the quality of life weights, and special attention should be paid to patients’ experience when estimating utility for breast cancer.
Author Contributions
Conceptualization, J.G. and S.B.; methodology, J.G., D.L., and S.B.; data curation, J.G., S.B., and J.H.; formal analysis, J.G., S.B., and D.L.; visualization, J.G., S.B., and D.L.; writing—original draft, J.G. and S.B.; writing—review and editing, S.B., D.L., and J.H.; supervision, S.B. All authors have read and agreed to the published version of the manuscript.
Funding
The author(s) declared no potential conflicts of interest with respect to the research, authorship, and/or publication of this article.
Acknowledgments
All authors are grateful to Jinhee Kim for her generous support.
Conflicts of Interest
The authors declare no conflict of interest.
Appendix A

Figure A1.
Percentage of assessment methods used in the studies from January 1996 to April 2019 (total n = 224). Year 1996~2009, n = 122; year 2010~2019, n = 102; SG = standard gamble; RS = rating scale; TTO = time-tradeoff; EQ-5D = Euroqual-5 dimension

Appendix B. Quality Evaluation of the Included Studies
| Reference | Sample Size | Respondent Selection and Recruitment | Inclusion/ Exclusion Criteria | Response Rates to the Instrument Used | Loss to Follow-Up | Missing Data | Any Other Problems with the Study |
| Grann (1998) | 54 | not reported | Yes | not repoted | No follow-up | not repoted | small samples for generalization |
| Hürny (1998) | 83 | Yes | Yes | 100% | No follow-up | not reported | population (patient) from various countries and cultures |
| Jansen (1998) | 70 | Yes | Yes | 36% | No follow-up | 7% | small samples for generalization |
| Grann (1999) | 135 | Yes | Yes | not reported | No follow-up | not reported | representative of the health states |
| Chie (2000) | 979 | Yes | Yes | not reported | No follow-up | not reported | low response rate |
| Jansen (2000) | 41 | Yes | Yes | 76% | 24% | not reported | small sample for generalization |
| Jansen (2000) | 70 | Yes | Yes | 64% | 22% | not reported | small sample for generalization |
| Polsky (2002) | 784 | Yes | Yes | 68% | not reported | 5% | selection bias for generalization |
| Jansen (2004) | 448 | Yes | Yes | 62% | No follow-up | 10% | selection bias for generalization |
| Conner-Spady (2005) | 52 | Yes | Yes | 92% | 14% | not reported | small sample for generalization |
| Lloyd (2006) | 106 | Yes | not reported | not reported | No follow-up | 6% | health state validation unclear |
| Milne (2006) | 50 | Yes | Yes | not reported | No follow-up | No | small sample for generalization |
| Schleinitz (2006) | 156 | Yes | Yes | 78% | No follow-up | not reported | language difference |
| Lidgren (2007) | 345 | Yes | Yes | 96% | No follow-up | 6% | selection bias |
| Mansel (2007) | not reported | not reported | Yes | not reported | not reported | not reported | lack of information |
| Buyukdamgaci-Alogan (2008) | 30 | Yes | Yes | not reported | No follow-up | not reported | small sample for generalization |
| Kimman (2009) | 192 | Yes | Yes | 87% | no follow-up | not reported | small subgroup analysis for generalization |
| Freedman (2010) | 1050 | Yes | Yes | not reported | 54% | not reported | representative of the health states |
| Haines (2010) | 89 | Yes | Yes | 76% | 18% | not reported | low response and follow-up rate |
| Kimman (2011) | 299 | Yes | Yes | not reported | 12% | 1% | selection bias |
| Cheng (2012) | 152 | Yes | Yes | not reported | No follow-up | not reported | large amount of missing data |
| Kim (2012) | 199 | Yes | Yes | 100% | no follow-up | no exist | selection bias for generalization |
| Shih (2012) | 20 | Yes | Yes | 61% | No follow-up | no exist | small sample for generalization |
| Frederix (2013) | 200 | Yes | Yes | not reported | No follow-up | No exist | representative of the health states |
| Moro-Valdezate (2013) | 364 | Yes | Yes | 66% | 34% | Not reported | lack of baseline HRQOL measurements prior to treatment |
| Farkkila (2014) | 27 | Yes | Yes | not reported | No follow-up | not reported | small sample for generalization |
| Matter-Walstra (2014) | 92 | Yes | Yes | not reported | No follow-up | No exist | language difference |
| Tan (2014) | 64 | Yes | Yes | 68% | No follow-up | not reported | small sample |
| Kim (2015) | 827 | Yes | Yes | 83% | No follow-up | 21% | generalizability (one hospitals selected) |
| Kim (2015) | 299 | Yes | Yes | 90% | No follow-up | not reported | representative of the health states |
| Luo (2015) | 269 | Yes | Yes | 94% | 6% | 1% | Selection bias |
| Pickard (2016) | 50 | Yes | Yes | not reported | No follow-up | No exist | small sample |
| Kim (2017) | 509 | Yes | Yes | not reported | No follow-up | not reported | selection bias |
| Rautalin (2018) | 840 | Yes | Yes | 59% | No follow-up | No exist | low response rate |
| Li (2019) | 608 | Yes | Yes | not reported | No follow-up | 2% | selection bias |
References
- Mattiuzzi, C.; Lippi, G. Current Cancer Epidemiology. J. Epidemiol. Glob. Health 2019, 9, 217–222. [Google Scholar] [CrossRef]
- DeSantis, C.E.; Ma, J.; Gaudet, M.M.; Newman, L.A.; Miller, K.D.; Goding Sauer, A.; Jemal, A.; Siegel, R.L. Breast cancer statistics, 2019. A Cancer J. Clin. 2019, 69, 438–451. [Google Scholar] [CrossRef]
- Murray, C.J.L.; Aravkin, A.Y.; Zheng, P.; Abbafati, C.; Abbas, K.M.; Abbasi-Kangevari, M.; Abd-Allah, F.; Abdelalim, A.; Abdollahi, M.; Abdollahpour, I.; et al. Global burden of 87 risk factors in 204 countries and territories, 1990–2019: A systematic analysis for the global burden of disease study 2019. Lancet 2020, 396, 1223–1249. [Google Scholar] [CrossRef]
- Global Health Data Exchange. Retrieved from GBD Compare 2019. Available online: http://vizhub.healthdata.org/gbd-compare/ (accessed on 30 November 2019).
- Kang, S.Y.; Kim, Y.S.; Kim, Z.; Kim, H.Y.; Kim, H.J.; Park, S.; Bae, S.Y.; Yoon, K.H.; Lee, S.B.; Lee, S.K.; et al. Breast cancer statistics in Korea in 2017: Data from a breast cancer registry. J. Breast Cancer 2020, 23, 115–128. [Google Scholar] [CrossRef]
- Pleis, J.R.; Ward, W.B.; Lucas, J.W. Summary health statistics for U.S. adults: National health interview survey, 2009. Vital Health Stat. 2010, 10, 1–207. [Google Scholar]
- Korean Breast Cancer Society. Breast Cancer in Korea, in Korean Breast Cancer Sociery; Seoul, Korea, 2014. Available online: http://www.kbcs.or.kr/sub02/sub04.html/ (accessed on 30 November 2019).
- Korean Ministry of Health Welfare & Family Affairs. Annual Report of Cancer Incidence, Cancer Prevalence and Survival in Korea; Korean Ministry of Health Welfare & Family Affairs: Sejong, Korea, 2011.
- American Cancer Society. Breast Cancer Survival Rates; American Cancer Society: Bedford, NH, USA, 2018. [Google Scholar]
- Hopwood, P. The impact of age and clinical factors on quality of life in early breast cancer: An analysis of 2208 women recruited to the UK START Trial (Standardisation of Breast Radiotherapy Trial). Breast 2007, 16, 241–251. [Google Scholar] [CrossRef]
- Byar, K.L.; Berger, A.M.; Bakken, S.L.; Cetak, M.A. Impact of adjuvant breast cancer chemotherapy on fatigue, other symptoms, and quality of life. Oncol. Nurs. Forum 2006, 33, E18–E26. [Google Scholar] [CrossRef]
- Brown, D.S.; Trogdon, J.G.; Ekwueme, D.U.; Chamiec-Case, L.; Guy Jr, G.P.; Tangka, F.K.; Li, C.; Trivers, K.F.; Rodriguez, J.L. Health state utility impact of breast cancer in U.S. women aged 18–44 years. Am. J. Prev. Med. 2016, 50, 255–261. [Google Scholar] [CrossRef]
- Weinstein, M.C.; Torrance, G.; McGuire, A. QALYs: The basics. Value Health 2009, 12, S5–S9. [Google Scholar] [CrossRef]
- Drummond, M.F.; Sculpher, M.J.; Claxton, K.; Stoddart, G.L.; Torrance, G.W. Methods for the Economic Evaluation of Health Care Programme, 3nd ed.; Oxford University Press: Oxford, UK, 2005. [Google Scholar]
- Light, D.W.; Kantarjian, K. Market spiral pricing of cancer drugs. Cancer 2013, 119, 3900–3902. [Google Scholar] [CrossRef]
- Frederix, G.W.; Quadri, N.; Hovels, A.M.; van de Wetering, F.T.; Tamminga, H.; Schellens, J.H.; Lloyd, A.J. Utility and work productivity data for economic evaluation of breast cancer therapies in the Netherlands and Sweden. Clin. Ther. 2013, 35, e1–e7. [Google Scholar] [CrossRef] [PubMed]
- Tengs, T.O.; Lin, T.H. A meta-analysis of utility estimates for HIV/AIDS. Med. Decis. Mak. 2002, 22, 475–481. [Google Scholar] [CrossRef] [PubMed]
- Sturza, J. A review and meta-analysis of utility values for lung cancer. Med. Decis. Mak. 2010, 30, 685–693. [Google Scholar] [CrossRef]
- Djalalov, S.; Rabeneck, L.; Tomlinson, G.; Bremner, K.E.; Hilsden, R.; Hoch, J.S. A review and meta-analysis of colorectal cancer utilities. Med. Decis. Mak. 2014, 3, 809–818. [Google Scholar] [CrossRef] [PubMed]
- Bae, S.; Bae, E.Y.; Lim, S.H. Sourcing quality-of-life weights obtained from previous studies: Theory and reality in Korea. Cent. Outcomes Res. 2014, 7, 141–150. [Google Scholar] [CrossRef]
- Boyd, N.F.; Sutherland, H.J.; Heasman, K.Z.; Tritchler, D.L.; Cummings, B.J. Whose Utilities for Decision Analysis? Med Decis. Mak. 1990, 10, 58–67. [Google Scholar] [CrossRef]
- Nord, E.; Daniels, N.; Kamlet, M. QALYs: Some challenges. Value Health 2009, 12, S10–S15. [Google Scholar] [CrossRef]
- King, J.T.; Styn, M.A.; Tsevat, J.; Roberts, M.S. “Perfect health” versus “disease free”: The impact of anchor point choice on the measurement of preferences and the calculation of disease-specific disutilities. Med. Decis. Mak. 2003, 23, 212–225. [Google Scholar] [CrossRef]
- Eunethta. European Network for Health Technology Assessment (EUnetHTA), Methods for Health Economic Evaluations-A Guideline Based on Current Practices in Europe; Eunethta: Diemen, The Netherlands, 2015. [Google Scholar]
- Drummond, M. Transferability of economic evaluations across jurisdictions: ISPOR good research practices task force report. Value Health 2009, 12, 409–418. [Google Scholar] [CrossRef]
- Higgins, J.P.T.; Thompson, S.G. Controlling the risk of spurious findings from meta-regression. Stat. Med. 2004, 23, 1663–1682. [Google Scholar] [CrossRef]
- Peasgood, T.; Brazier, J. Is meta-analysis for utility values appropriate given the potential impact different elicitation methods have on values? Pharmacoeconomics 2015, 33, 1101–1105. [Google Scholar] [CrossRef] [PubMed]
- Jeffe, D.B.; Pérez, M.; Cole, E.F.; Liu, Y.; Schootman, M. The effects of surgery type and chemotherapy on early-stage breast cancer patients’ quality of life over 2-year follow-up. Ann. Surg. Oncol. 2016, 23, 735–743. [Google Scholar] [CrossRef] [PubMed]
- Samuel, C.A.; Pinheiro, L.C.; Reeder-Hayes, K.E.; Walker, J.S.; Corbie-Smith, G.; Fashaw, S.A.; Woods-Giscombe, C.; Wheeler, S.B. To be young, black, and living with breast cancer: A systematic review of health-related quality of life in young black breast cancer survivors. Breast Cancer Res. Treat. 2016, 160, 1–15. [Google Scholar] [CrossRef] [PubMed]
- Van der Kloot, W.A.; Ucchida, Y.; Inoue, K.; Kobayashi, K.; Yamaoka, K.; Nortier, H.W.; Kaptein, A.A. The effects of illness beliefs and chemotherapy impact on quality of life in Japanese and Dutch patients with breast or lung cancer. Chin. Clin. Oncol. 2016, 5, 3. [Google Scholar] [PubMed]
- Freedman, G.M.; Li, T.; Anderson, P.R.; Nicolaou, N.; Konski, A. Health states of women after conservative surgery and radiation for breast cancer. Breast Cancer Res. Treat. 2010, 121, 519–526. [Google Scholar] [CrossRef] [PubMed][Green Version]
- Cappelli, M.; Surh, L.; Humphreys, L.; Verma, S.; Logan, D.; Hunter, A.; Allanson, J. Measuring women’s preferences for breast cancer treatments and BRCA1/BRCA2 testing. Qual. Life Res. 2001, 10, 595–607. [Google Scholar] [CrossRef]
- Roine, E.; Blomqvist, C.; Kellokumpu-Lehtinen, P.L.; Sintonen, H.; Saarto, T. Health-related quality of life in breast cancer patients after adjuvant treatments. Breast J. 2016, 22, 473–475. [Google Scholar] [CrossRef]
- Howard-Anderson, J.; Ganz, P.A.; Bower, J.E.; Stanton, A.L. Quality of life, fertility concerns, and behavioral health outcomes in younger breast cancer survivors: A systematic review. J. Natl. Cancer Inst. 2012, 104, 386–405. [Google Scholar] [CrossRef]
- Avis, N.E.; Crawford, S.; Manuel, J. Quality of life among younger women with breast cancer. J. Clin. Oncol. 2005, 23, 3322–3330. [Google Scholar] [CrossRef]
- Trogdon, J.G.; Ekwueme, D.U.; Chamiec-Case, L.; Guy, G.P. Breast cancer in young women: Health State Utility Impacts by Race/Ethnicity. Am. J. Prev. Med. 2016, 50, 262–269. [Google Scholar] [CrossRef][Green Version]
- Schleinitz, M.D.; DePalo, D.; Blume, J.; Stein, M. Can differences in breast cancer utilities explain disparities in breast cancer care? J. Gen. Intern. Med. 2006, 21, 1253–1260. [Google Scholar] [CrossRef] [PubMed]
- Lee, K.H. Cancer Facts and Figures 215 of Korea, 1st ed.; Minister for Health and Welfare President of National Cancer Center: Sejong, Korea, 2015.
- Coons, S.J.; Rao, S.; Keininger, D.L.; Hays, R.D. A comparative review of generic quality-of-life instruments. Pharmacoeconomics 2000, 17, 13–35. [Google Scholar] [CrossRef] [PubMed]
- Peasgood, T.; Ward, S.E.; Brazier, J. Health-state utility values in breast cancer. Expert Rev. Pharm. Outcomes Res. 2010, 10, 553–566. [Google Scholar] [CrossRef] [PubMed]
- Tengs, T.O.; Lin, T.H. A meta-analysis of quality-of-life estimates for stroke. Pharmacoeconomics 2003, 21, 191–200. [Google Scholar] [CrossRef]
- Brazier, J.E.; Yang, Y.; Tsuchiya, A.; Rowen, D.L. A review of studies mapping (or cross walking) non-preference based measures of health to generic preference-based measures. Eur. J. Health Econ. 2010, 11, 215–225. [Google Scholar] [CrossRef]
- Longworth, L.; Rowen, D. Mapping to obtain EQ-5D utility values for use in NICE health technology assessments. Value Health 2013, 16, 202–210. [Google Scholar] [CrossRef]
- Gradishar, W.; Salerno, K.E. NCCN Guidelines for patients, breast cancer: Early stage. J. Natl. Compr. Cancer Netw. 2016, 14, 641–644. [Google Scholar] [CrossRef]
- Canadian Cancer Society, Stages of Breast Cancer. Available online: https://www.cancer.ca/~/media/cancer.ca/CW/cancer%20information/cancer%20101/Canadian%20cancer%20statistics/Canadian-Cancer-Statistics-2018-EN.pdf?la=en/ (accessed on 30 November 2019).
- Jansen, S.J.T.; Kievit, J.; Nooij, M.A.; Stiggelbout, A.M. Stability of patients’ preferences for chemotherapy: The impact of experience. Med. Decis. Mak. 2001, 21, 295–306. [Google Scholar] [CrossRef]
- Stiggelbout, A.M.; de Vogel-Voogt, E. Health state utilities: A framework for studying the gap between the imagined and the real. Value Health 2008, 11, 76–87. [Google Scholar] [CrossRef]
- Wenzel, L.B.; Fairclough, D.L.; Brady, M.J.; Cella, D.; Garrett, K.M.; Kluhsman, B.C.; Crane, L.A.; Marcus, A.C. Age-related differences in the quality of life of breast carcinoma patients after treatment. Cancer 1999, 86, 1768–1774. [Google Scholar] [CrossRef]
- NHS Foundation Trust. The menopause; NHS Foundation Trust: London, UK, 2014. [Google Scholar]
- Raudenbush, S.W.; Bryk, A.S. Hierarchical Linear Models: Applications and Data Aanalysis Methods., 2nd ed.; Sage Publications: Thousand Oaks, CA, USA, 2002. [Google Scholar]
- Frost, C.; Clarke, R.; Beacon, H. Use of hierarchical models for meta-analysis: Experience in the metabolic ward studies of diet and blood cholesterol. Stat. Med. 1999, 18, 1657–1676. [Google Scholar] [CrossRef]
- Teckle, P.; Peacock, S.; McTaggart-Cowan, H.; Van der Hoek, K.; Chia, S.; Melosky, B.; Gelmon, K. The ability of cancer-specific and generic preference-based instruments to discriminate across clinical and self-reported measures of cancer severities. Health Qual Life Outcomes 2011, 9, 106. [Google Scholar] [CrossRef] [PubMed]
- Robertson, S.; Wengstrom, Y.; Eriksen, C.; Sandelin, K. Breast surgeons performing immediate breast reconstruction with implants-assessment of resource-use and patient-reported outcome measures. Breast 2012, 21, 590–596. [Google Scholar] [CrossRef] [PubMed]
- Lee, J.A.; Kim, S.Y.; Kim, Y.; Oh, J.; Kim, H.J.; Jo, D.Y.; Kwon, T.G.; Park, J.H. Comparison of health-related quality of life between cancer survivors treated in designated cancer centers and the general public in Korea. Jpn. J. Clin. Oncol. 2014, 44, 141–152. [Google Scholar] [CrossRef] [PubMed]
- Stratmann-Schoene, D.; Kuehn, T.; Kreienberg, R.; Leidl, R. A preference-based index for the SF-12. Health Econ. 2006, 15, 553–564. [Google Scholar] [CrossRef] [PubMed]
- Hann, D.M.; Jacobsen, P.B.; Martin, S.C.; Kronish, L.E.; Azzarello, L.M.; Fields, K.K. Quality of life following bone marrow transplantation for breast cancer: A comparative study. Bone Marrow Transpl. 1997, 19, 257–264. [Google Scholar] [CrossRef]
- Kimman, M.; Jan, S.; Monaghan, H.; Woodward, M. The relationship between economic characteristics and health-related quality of life in newly diagnosed cancer patients in Southeast Asia: Results from an observational study. Qual. Life Res. 2015, 24, 937–949. [Google Scholar] [CrossRef]
- Ashby, J.; O’Hanlon, M.; Buxton, M.J. The time trade-off technique: How do the valuations of breast cancer patients compare to those of other groups? Qual Life Res. 1994, 3, 257–265. [Google Scholar] [CrossRef]
- Grann, V.R.; Sundararajan, V.; Jacobson, J.S.; Whang, W.; Heitjan, D.F.; Antman, K.H.; Neugut, A.I. Decision analysis of tamoxifen for the prevention of invasive breast cancer. Cancer J. 2000, 6, 169–178. [Google Scholar]
- Shih, V.; Chan, A.; Xie, F.; Ko, Y. Economic evaluation of anastrozole versus tamoxifen for early stage breast cancer in singapore. Value Health Reg. Issues 2012, 1, 46–53. [Google Scholar] [CrossRef]
- Hutton, J.; Brown, T.; Borowitz, M.; Abrams, K.; Rothman, M.; Shakespeare, A. A new decision model for cost-utility comparisons of chemotherapy in recurrent metastatic breast cancer. Pharmacoeconomics 1996, 9, 8–22. [Google Scholar] [CrossRef] [PubMed]
- Conner-Spady, B.; Cumming, C.; Nabholtz, J.M.; Jacobs, P.; Stewart, D. Responsiveness of the EuroQol in breast cancer patients undergoing high dose chemotherapy. Qual. Life Res. 2001, 10, 479–486. [Google Scholar] [CrossRef] [PubMed]
- Wang, S.Y.; Hsu, S.H.; Gross, C.P.; Sanft, T.; Davidoff, A.J.; Ma, X.; Yu, J.B. Association between time since cancer diagnosis and health-related quality of life: A population-level analysis. Value Health 2016, 19, 631–638. [Google Scholar] [CrossRef] [PubMed]
- Hays, R.D.; Reeve, B.B.; Smith, A.W.; Clauser, S.B. Associations of cancer and other chronic medical conditions with SF-6D preference-based scores in Medicare beneficiaries. Qual. Life Res. 2014, 23, 385–391. [Google Scholar] [CrossRef][Green Version]
- Lee, H.-J.; Lee, T.-J.; Yang, B.-M.; Min, J. Cost-effectiveness analysis of adjuvant hormonal treatments for women with postmenopausal hormone-receptor positive early breast cancer in the Korean context. J. Breast Cancer 2010, 13, 286–298. [Google Scholar] [CrossRef]
- Stalmeier, P.F. Discrepancies between chained and classic utilities induced by anchoring with occasional adjustments. Med. Decis. Making 2002, 22, 53–64. [Google Scholar] [CrossRef]
- Dranitsaris, G.; Cottrell, W.; Spirovski, B.; Hopkins, S. Economic analysis of albumin-bound paclitaxel for the treatment of metastatic breast cancer. J. Oncol. Pharm. Pract. 2009, 15, 67–78. [Google Scholar] [CrossRef]
- Perez, D.J.; Williams, S.M.; Christensen, E.A.; McGee, R.O.; Campbell, A.V. A longitudinal study of health related quality of life and utility measures in patients with advanced breast cancer. Qual Life Res 2001, 10, 587–593. [Google Scholar] [CrossRef]
- Dranitsaris, G.; Yu, B.; Qing, Z.; King, J.; Zhang, A.; Kaura, S. Nab-paclitaxel or docetaxel as alternatives to solvent-based paclitaxel in metastatic breast cancer (Mbc): A cost utility analysis from a Chinese health care perspective. Value Health 2014, 17, A642. [Google Scholar] [CrossRef][Green Version]
- Hershman, D.; Sundararajan, V.; Jacobson, J.S.; Heitjan, D.F.; Neugut, A.I.; Grann, V.R. Outcomes of tamoxifen chemoprevention for breast cancer in very high-risk women: A cost-effectiveness analysis. J. Clin. Oncol. 2002, 20, 9–16. [Google Scholar] [CrossRef]
- Franic, D.M.; Pathak, D.S.; Gafni, A. Quality-adjusted life years was a poor predictor of women’s willingness to pay in acute and chronic conditions: Results of a survey. J. Clin. Epidemiol. 2005, 58, 291–303. [Google Scholar] [CrossRef] [PubMed]
- Takashima, T.; Mukai, H.; Hara, F.; Matsubara, N.; Saito, T.; Takano, T.; Park, Y.; Toyama, T.; Hozumi, Y.; Tsurutani, J.; et al. Taxanes versus S-1 as the first-line chemotherapy for metastatic breast cancer (SELECT BC): An open-label, non-inferiority, randomised phase 3 trial. Lancet Oncol. 2016, 17, 90–98. [Google Scholar] [CrossRef]
- Kim, J.G.; Kwon, L.S. Measurement of quality of life related to health by demographic characteristics of adult patients with cancer using EQ-5D index-focused on the Korea health & nutrition examination survey. J. Digit. Converg. 2013, 11, 281–291. [Google Scholar]
- Ha, E.H. The influence of health related quality of life on depressive symptoms of breast cancer patients. Korean J. Woman Psychol. 2011, 16, 499–515. [Google Scholar]
- Kim, M.S. Study on Health-Related Quality of Life and Needs of Breast Cancer Patients; Yonsei University Grduation School: Seoul, Korea, 2005. [Google Scholar]
- Lee, H.S. The Social Network Analysis for Research of the Cancer Patients’ Health-Related Quality of Life; Chungang University Graduate School: Seoul, Korea, 2014. [Google Scholar]
- Cho, S.M. Factors Affecting Symptom Clusters in Patients with Breast Cancer Receiving Chemotherapy; Yonsei University Graduate School: Seoul, Korea, 2013. [Google Scholar]
- Kim, S.I.; Lee, Y.; Son, Y.; Jun, S.Y.; Yun, S.; Bae, H.S.; Lim, M.C.; Jung, S.Y.; Joo, J.; Lee, E.S. Assessment of breast bancer patients’ knowledge and decisional conflict regarding tamoxifen use. J. Korean Med. Sci. 2015, 30, 1604–1611. [Google Scholar] [CrossRef]
- Tan, X.-Y.; Aung, M.-M.; Ngai, M.-I.; Xie, F.; Ko, Y. Assessment of preference for hormonal treatment–related health states among patients with breast cancer. Value Health Reg. Issues 2014, 3, 27–32. [Google Scholar] [CrossRef] [PubMed][Green Version]
- Li, S.; Wang, M.; Liu, L.; Chen, G. Which approach is better in eliciting health state utilities from breast cancer patients? Evidence from mainland China. Eur. J. Cancer Care 2019, 28, e12965. [Google Scholar] [CrossRef]
- Mansel, R.; Locker, G.; Fallowfield, L.; Benedict, A.; Jones, D. Cost-effectiveness analysis of anastrozole vs tamoxifen in adjuvant therapy for early stage breast cancer in the United Kingdom: The 5-year completed treatment analysis of the ATAC (“Arimidex”, Tamoxifen alone or in combination) trial. Br. J. Cancer 2007, 97, 152–161. [Google Scholar] [CrossRef]
- Cheng, T.F.; Wang, J.D.; Uen, W.C. Cost-utility analysis of adjuvant goserelin (Zoladex) and adjuvant chemotherapy in premenopausal women with breast cancer. BMC Cancer 2012, 12, 33. [Google Scholar] [CrossRef]
- Grann, V.R.; Panageas, K.S.; Whang, W.; Antman, K.H.; Neugut, A.I. Decision analysis of prophylactic mastectomy and oophorectomy in BRCA1-positive or BRCA2-positive patients. J. Clin. Oncol. 1998, 16, 979–985. [Google Scholar] [CrossRef]
- Buyukdamgaci-Alogan, G.; Elele, T.; Hayran, M.; Erman, M.; Kilickap, S. A decision-analytic model for early stage breast cancer: Lumpectomy vs mastectomy. Neoplasma 2008, 55, 222–228. [Google Scholar] [PubMed]
- Shih, V.; Chan, A.; Xie, F.; Ko, Y.E. Health State Utility Assessment for Breast Cancer. Value Health Reg. Issues 2012, 1, 93–97. [Google Scholar] [CrossRef] [PubMed][Green Version]
- Kimman, M.L.; Dirksen, C.D.; Voogd, A.C.; Falger, P.; Gijsen, B.C.; Thuring, M.; Lenssen, A.; Van der Ent, F.; Verkeyn, J.; Haekens, C.; et al. Economic evaluation of four follow-up strategies after curative treatment for breast cancer: Results of an RCT. Eur. J. Cancer 2011, 47, 1175–1185. [Google Scholar] [CrossRef] [PubMed]
- Jansen, S.J.; Stiggelbout, A.M.; Nooij, M.A.; Kievit, J. The effect of individually assessed preference weights on the relationship between holistic utilities and nonpreference-based assessment. Qual. Life Res. 2000, 9, 541–557. [Google Scholar] [CrossRef]
- Moro-Valdezate, D.; Peiro, S.; Buch-Villa, E.; Caballero-Garate, A.; Morales-Monsalve, M.D.; Martinez-Agullo, A.; Checa-Ayet, F.; Ortega-Serrano, J. Evolution of health-related quality of life in breast cancer patients during the first year of follow-up. J. Breast Cancer 2013, 16, 104–111. [Google Scholar] [CrossRef][Green Version]
- Lidgren, M.; Wilking, N.; Jonsson, B.; Rehnberg, C. Health related quality of life in different states of breast cancer. Qual. Life Res. 2007, 16, 1073–1081. [Google Scholar] [CrossRef]
- Lloyd, A.; Nafees, B.; Narewska, J.; Dewilde, S.; Watkins, J. Health state utilities for metastatic breast cancer. Br. J. Cancer 2006, 95, 683–690. [Google Scholar] [CrossRef]
- Farkkila, N.; Torvinen, S.; Roine, R.P.; Sintonen, H.; Hanninen, J.; Taari, K.; Saarto, T. Health-related quality of life among breast, prostate, and colorectal cancer patients with end-stage disease. Qual. Life Res. 2014, 23, 1387–1394. [Google Scholar] [CrossRef]
- Jansen, S.J.; Otten, W.; Van de Velde, C.J.; Nortier, J.W.; Stiggelbout, A.M. The impact of the perception of treatment choice on satisfaction with treatment, experienced chemotherapy burden and current quality of life. Br. J. Cancer 2004, 91, 56–61. [Google Scholar] [CrossRef]
- Conner-Spady, B.L.; Cumming, C.; Nabholtz, J.M.; Jacobs, P.; Stewart, D. A longitudinal prospective study of health-related quality of life in breast cancer patients following high-dose chemotherapy with autologous blood stem cell transplantation. Bone Marrow Transpl. 2005, 36, 251–259. [Google Scholar] [CrossRef][Green Version]
- Luo, N.; Cheung, Y.B.; Ng, R.; Lee, C.F. Mapping and direct valuation: Do they give equivalent EQ-5D-5L index scores? Health Qual. Life Outcomes 2015, 13, 166. [Google Scholar] [CrossRef] [PubMed]
- Kim, E.J.; Ko, S.K.; Kang, H.Y. Mapping the cancer-specific EORTC QLQ-C30 and EORTC QLQ-BR23 to the generic EQ-5D in metastatic breast cancer patients. Qual. Life Res. 2012, 21, 1193–1203. [Google Scholar] [CrossRef] [PubMed]
- Haines, T.P.; Sinnamon, P.; Wetzig, N.G.; Lehman, M.; Walpole, E.; Pratt, T.; Smith., A. Multimodal exercise improves quality of life of women being treated for breast cancer, but at what cost? Randomized trial with economic evaluation. Breast Cancer Res. Treat. 2010, 124, 163–175. [Google Scholar] [CrossRef] [PubMed]
- Polsky, D.; Keating, N.L.; Weeks, J.C.; Schulman, K.A. Patient choice of breast cancer treatment: Impact on health state preferences. Med. Care 2002, 40, 1068–1079. [Google Scholar] [CrossRef] [PubMed]
- Jansen, S.J.; Stiggelbout, A.M.; Wakker, P.P.; Vliet Vlieland, T.P.; Leer, J.W.; Nooy, M.A.; Kievit, J. Patients’ utilities for cancer treatments: A study of the chained procedure for the standard gamble and time tradeoff. Med. Decis. Mak. 1998, 18, 391–399. [Google Scholar] [CrossRef]
- Grann, V.R.; Jacobson, J.S.; Sundararajan, V.; Albert, S.M.; Troxel, A.B.; Neugut, A.I. The quality of life associated with prophylactic treatments for women with BRCA1/2 mutations. Cancer J. Sci. Am. 1999, 5, 283–292. [Google Scholar]
- Kimman, M.L.; Dirksen, C.D.; Lambin, P.; Boersma, L.J. Responsiveness of the EQ-5D in breast cancer patients in their first year after treatment. Health Qual. Life Outcomes 2009, 7, 11. [Google Scholar] [CrossRef]
- Hurny, C.; Van Wegberg, B.; Bacchi, M.; Bernhard, J.; Thurlimann, B.; Real, O.; Perey, L.; Bonnefoi, H.; Coates, A. Subjective health estimations (SHE) in patients with advanced breast cancer: An adapted utility concept for clinical trials. Br. J. Cancer 1998, 77, 985–991. [Google Scholar] [CrossRef][Green Version]
- Jansen, S.J.; Stiggelbout, A.M.; Wakker, P.P.; Nooij, M.A.; Noordijk, E.M.; Kievit, J. Unstable preferences: A shift in valuation or an effect of the elicitation procedure? Med. Decis. Making 2000, 20, 62–71. [Google Scholar] [CrossRef]
- Pickard, A.S.; Jiang, R.; Lin, H.W.; Rosenbloom, S.; Cella, D. Using patient-reported outcomes to compare relative burden of cancer: EQ-5D and functional assessment of cancer therapy-general in eleven types of cancer. Clin. Ther. 2016, 38, 769–777. [Google Scholar] [CrossRef]
- Matter-Walstra, K.; Klingbiel, D.; Szucs, T.; Pestalozzi, B.C.; Schwenkglenks, M. Using the EuroQol EQ-5D in swiss cancer patients, which value set should be applied? Pharmacoeconomics 2014, 32, 591–599. [Google Scholar] [CrossRef] [PubMed]
- Chie, W.C.; Huang, C.S.; Chen, J.H.; Chang, K.J. Utility assessment for different clinical phases of breast cancer in Taiwan. J. Formos. Med. Assoc. 2000, 99, 677–683. [Google Scholar] [PubMed]
- Kim, S.H.; Jo, M.W.; Lee, J.W.; Lee, H.J.; Kim, J.K. Validity and reliability of EQ-5D-3L for breast cancer patients in Korea. Health Qual. Life Outcomes 2015, 13, 203. [Google Scholar] [CrossRef] [PubMed]
- Milne, R.J.; Heaton-Brown, K.H.; Hansen, P.; Thomas, D.; Harvey, V.; Cubitt, A. Quality-of-life valuations of advanced breast cancer by New Zealand women. Pharmacoeconomics 2006, 24, 281–292. [Google Scholar] [CrossRef]
- Rautalin, M.; Färkkilä, N.; Sintonen, H.; Saarto, T.; Taari, K.; Jahkola, T.; Roine, R.P. Health-related quality of life in different states of breast cancer–comparing different instruments. Acta Oncologica 2018, 57, 622–628. [Google Scholar] [CrossRef]
- Kim, S.-H.; Jo, M.-W.; Ock, M.; Lee, H.-J.; Lee, J.-W. Estimation of health state utilities in breast cancer. Patient Prefer. Adherence 2017, 11, 531. [Google Scholar] [CrossRef]
- Papaioannou, D.; Brazier, J.; Paisley, S. Systematic searching and selection of health state utility values from the literature. Value Health 2013, 16, 686–695. [Google Scholar] [CrossRef]
- Bleichrodt, H. Characterizing QALYs risk neutrality. J. Risk Uncertain 1997, 15, 107–114. [Google Scholar] [CrossRef]
- Attema, A.E.; Brouwer, W.B.F. On the (not so) constant proportional trade-off in TTO. Qual. Life Res. 2010, 19, 489–497. [Google Scholar] [CrossRef]
- Tosh, J.C.; Longworth, L.J.; George, E. Utility values in national institute for health and clinical excellence (NICE) technology appraisals. Value Health 2011, 14, 102–109. [Google Scholar] [CrossRef]
- National Institute for Health and Clinical Excellence. Guide to the Methods of Technology Appraisal. Available online: https://heatinformatics.com/sites/default/files/images-videosFileContent/UK%20NHS_NICE%20HTA%202008.pdf/ (accessed on 30 November 2019).
- Pharmaceutical Benefits Advisory Committee. Guidelines for Preparing Submissions to the Pharmaceutical Benefits Advisory Committee (Version 4.3); Australian Government Department of Health: Canberra, Australia, 2008.
- Bae, S.; Lee, S.; Bae, E.Y.; Jang, S. Korean guidelines for pharmacoeconomic evaluation (second and updated version). Pharmacoeconomics 2013, 31, 257–267. [Google Scholar] [CrossRef] [PubMed]
- Brazier, J.; Deverill, M. A checklist for judging preference-based measures of health related quality of life: Learning from psychometrics. Health Econ. 1999, 8, 41–51. [Google Scholar] [CrossRef]


Publisher’s Note: MDPI stays neutral with regard to jurisdictional claims in published maps and institutional affiliations. |
© 2020 by the authors. Licensee MDPI, Basel, Switzerland. This article is an open access article distributed under the terms and conditions of the Creative Commons Attribution (CC BY) license (http://creativecommons.org/licenses/by/4.0/).