Abstract
Background: Polycystic ovary syndrome (PCOS) is characterized by hyperandrogenism, anovulation, infertility, obesity, and insulin resistance, which results in increased concentrations of testosterone (T), which disturbs follicular growth and ovulation. This study aimed to assess PCOS women’s clinical, endocrinological, and metabolic parameters concerning hyperandrogenism severity. Results: 314 women (mean age 27.3 ± 4.6; mean body mass index (BMI) 25.7 ± 5.6) with PCOS, were divided into terciles according to T concentrations: <0.64 ng/mL (group 1), 0.64 to 0.84 ng/mL (Group 2) and >0.84 ng/mL (group 3). The mean concentration of T in all women was 0.59 ng/mL and correlated negatively with the number of menstrual cycles per year (MPY) (r = −0.36; p < 0.0001) and positively with Ferriman-Gallway score (FG) (r = 0.33; p < 0.0001), luteinizing hormone (LH) (r = 0.19; p < 0.0001) and dehydroepiandrosterone sulfate (DHEAS) (r = 0.52; p < 0.0001). Positive correlation between BMI and hirsutism (r = 0.16; p < 0.0001), total cholesterol (TC) (r = 0.18; p < 0.0001), low-density lipoprotein (LDL) (r = 0.29; p < 0.0001), and triglycerides (TG) (r = 0.40; p < 0.0001) was demonstrated. The division into subgroups confirmed the lowest MPY, highest LH, and hirsutism in group 3. BMI, insulin sensitivity indices, and lipid profile parameters were not different between the three T subgroups. Conclusions: We found no correlation between testosterone levels and insulin sensitivity or dyslipidemia in women with PCOS. Metabolic abnormalities may contribute more significantly than hyperandrogenemia to PCOS development.
1. Introduction
Polycystic ovary syndrome (PCOS) is one of the most common endocrinopathies affecting 4 to 21% of women of reproductive age, depending on the diagnostic criteria. Prevalence of the syndrome varies according to different geographic regions, but mainly because of various diagnostic consensus used. Ranges 5% to 10% according to NIH 1990 criteria; 10% to 15% according to the AE-PCOS 2006 criteria, and 6% to 21% by ESHRE/ASRM 2003 criteria are applied [1,2,3,4,5,6,7,8].
Hyperandrogenism, chronic anovulation, infertility, and obesity characterize PCOS. It is also associated with insulin resistance and hyperinsulinemia, leading to the development of type 2 diabetes and cardiovascular disease [9,10,11,12,13,14]. The pathophysiology of PCOS is still not fully understood. Patients with PCOS suffer not only from reproductive dysfunction [15,16,17,18], but also are at increased risk of long-term metabolic and cardiovascular health problems such as dyslipidemia [19,20], gestational diabetes [21], type 2 diabetes [22], hypertension [9,23,24], and atherosclerosis s [25,26]. The most prominent endocrine PCOS features include insulin resistance (IR) and compensatory hyperinsulinemia. Carmina et al., reported that the prevalence of IR range from 68% to 76% according to glucose tolerance test [27]. In a large study on untreated patients with PCOS, the prevalence of IR was approximately 64% according to the HOMA-IR measurement [28]. Insulin resistance is observed in both obese and non-obese women with PCOS. Legro et al., reported a higher prevalence of insulin resistance in obese (64%) than in non-obese (20%) patients [29]. Most evidence indicates that hyperinsulinemia causes hyperandrogenism (HA) rather than its converse. Insulin in higher concentration also inhibits sex hormone-binding globulin (SHBG) production in the liver, resulting in increased free testosterone [11,22,30].
Consequently, androgen excess has an unfavorable effect on follicular growth and ovulation and may compromise oocytes and embryos [31,32]. Hyperandrogenemia may lead to dysfunction of the corpus luteum, reduced progesterone production, and finally to impaired endometrial receptivity [33,34]. However, despite continuous research, there are still controversies regarding PCOS’s etiology, pathogenesis, and phenotypic spectrum.
This study aimed to assess PCOS women’s clinical, endocrinological, and metabolic parameters concerning hyperandrogenism severity.
2. Materials and Methods
2.1. Study Subjects
Three hundred fourteen women of reproductive age (mean age 27.3 ± 4.6; mean BMI 25.7 ± 5.6) with diagnosed PCOS according to the Rotterdam criteria [13] were recruited to the study. We defined PCOS as oligo-or amenorrhea, HA (hirsutism or acne), and/or hyperandrogenemia (increased total serum testosterone (T) >0.8 ng/mL). The ovarian transvaginal ultrasonographic evaluation demonstrated that all the women studied had multiple (more than 12) subcapsular antral follicles measuring up to 10 mm of diameter, i.e., all had classic sonographic characteristics of polycystic ovaries. All recruited subjects were euthyroid with no evidence of other endocrinopathies, including hyperprolactinemia, Cushing’s syndrome, congenital adrenal hyperplasia, or androgen-secreting tumors. No treatment, neither oral contraceptives, nor other hormones, and drugs that could affect carbohydrate metabolism were taken by the participants during the study and two months before the study’s commencement.
All women underwent clinical assessment in the early follicular phase. Physical examination, including the measurement of weight, height, body mass index (BMI), waist and hip circumferences, was performed, and hirsutism was assessed with Ferriman–Gallwey score (FG). Blood samples were taken from patients during the early follicular phase between 7 a.m. and 8 a.m., after 12-h fasting.
2.2. Assays
Serum levels of insulin were determined by standard ELISA (Enzyme Test Insulin; Boehringer Mannheim, Mannheim, Germany). T, LH, FSH, plasma glucose, and prolactin were measured with specific chemiluminescence assays (Chiron Diagnostics GmbH, Fernwald, Germany). Dehydroepiandrosterone sulfate (DHEAS) and SHBG were measured with radioimmunoassays: (Orion Diagnostica, Espoo, Finland). Total cholesterol (TC), HDL, LDL, and triglycerides (TG) were measured with an enzymatic colorimetric method on Roche Cobas Integra 400. Sampled sera were stored at −20 °C for subsequent analysis. Free androgen index (FTI) was derived using formula: T (nmol/L) × 100/SHBG (nmol/L). The fasting glucose to insulin ratio (FGIR) was calculated as proposed by Legro [35]. Quantitative insulin sensitivity check index (QUICKI = 1/[log (fasting insulin) + log (fasting glucose)] was calculated as described by Katz et al. [36]. HOMA-IR was calculated using the formula: HOMA-IR = [glucose (nmol/L) × insulin (µU/mL)/22.5], using fasting values [37].
The intra-and inter-assay coefficients of variation were below 10% for all assays performed.
2.3. Studied Subgroups
The studied population was divided into terciles according to T concentrations. The lowest tercile comprised patients with T level <0.64 ng/mL (group 1), the middle tercile ranged from 0.64 to 0.84 ng/mL (group 2), and the highest one was above 0.84 ng/mL (group 3). The testosterone level in our laboratory that is proposed to be within the normal range for women of reproductive age is 0.06–0.82 ng/mL.
All laboratory measurements were performed in the certified central laboratory of the Gynecologic Obstetrical University Hospital in Poznan.
The Institutional Ethical Committee of Poznan University of Medical Sciences approved this retrospective study protocol (349/14).
2.4. Statistical Analysis
Statistical analyses were performed using Statistica version 10. PL software (StatSoft, Inc., Tulsa, OK, USA) and MedCalc Statistical Software version 16.4. 3 (MedCalc Software bv., Ostend, Belgium; https://www.medcalc.org; 2016).
Testing for normality of data distribution was performed using the Kolmogorov–Smirnov and D’Agostino Pearson tests. The Kruskal-Wallis was used to determine the differences between the studied groups. Data were presented as median (IQR 25–75). The Spearman’s Rank Correlation Coefficient was used to discover the strength of a link between two sets of data. The p-value of less than 0.05 was considered significant.
3. Results
We examined 694 patients diagnosed with PCOS according to Rotterdam criteria [13], with median age 27.0 (24.0–31.0) and median T level 0.54 (0.39–0.75) (Table 1).

Table 1.
Characteristics of the whole studied population.
Table 2 presents the characteristic of the study group according to their testosterone concentration (terciles). The worth underlying finding is that the studied subgroups did not differ concerning their age and BMI. However, we observed the tendency to higher BMI in the group with the highest T. This characteristic initially did not indicate the relation between the patients’ androgenemia and metabolic status in these subgroups of PCOS patients.
Table 2.
Characteristics of the study groups.
We performed intergroup comparisons of FTI between terciles that revealed significant differences, with expected the highest level in group 3 (p < 0.05) (Figure 1a, Table 2).
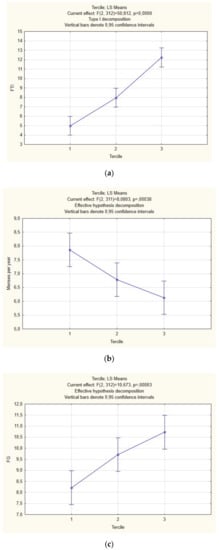
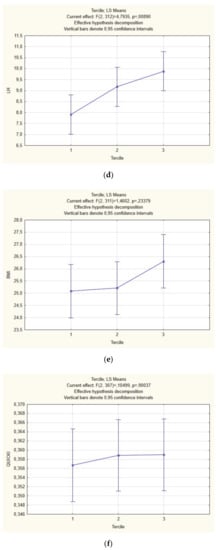
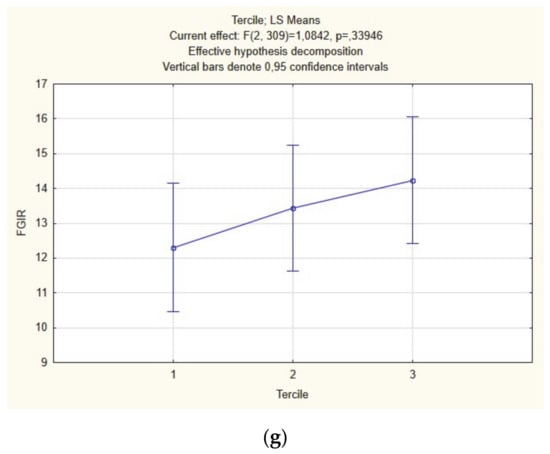
Figure 1.
Intergroup comparison between terciles of free testosterone index (FTI) (a), menses per year (MPY) (b), luteinizing hormone (LH) (c), Ferrimann–Gallway score (FG) (d), body-mass index (BMI) (e), QUICKI (f), FGIR (g) (ANOVA).
Further analysis of the studied subpopulations divided into T terciles revealed worthy of note observations: we confirmed significant differences in menstrual cyclicity, with the lowest number of MPY in group 3 (Figure 1b; Table 2), LH (Figure 1c, Table 2) and hirsutism (Figure 1d, Table 2). On the other hand, BMI (Figure 1e, Table 2), insulin sensitivity indices (Figure 1f,g, Table 2), and lipid profile parameters (Table 2) were not different between the three T subgroups.
In the third table we present the correlation between studied parameters in the whole group. The mean T concentration in all PCOS subjects was 0.59 (0.27) and correlated negatively with the number of menstrual cycles per year (MPY) (Spearman correlation r = −0.36; p < 0.0001) and positively with FG score (r = 0.33; p < 0.0001), LH (r = 0.19; p < 0.0001) and with DHEAS (r = 0.52; p < 0.0001). Likewise, also FTI correlated with MPY (r = −0.24; p < 0.001), FG (r = 0.34; p < 0.0001) and DHEAS (r = 0.36; p < 0.0001) but additively showed positive correlation with BMI (r = 0.38; p < 0.0001) and TG (r = 0.26; p < 0.0001), LDL (r = 0.09; p = 0.02), TC/HDL ratio (r = 0.27; p < 0.0001) and negative with HDL (r = −0.27; p < 0.0001), QUICKI (r = −0.27; p < 0.001) and FGIR (r = −0.24; p < 0.0001). Moreover, a positive correlation between BMI and hirsutism (r = 0.16; p < 0.0001), TC (r = 0.18; p < 0.0001), LDL (r = 0.29; p < 0.0001), TC/HDL (r = 0.49; p < 0.0001) and TG (r = 0.40; p < 0.0001) was demonstrated. Negative correlations were shown between BMI and LH (r = −0.18; p < 0.0001), FGIR (r = −0.45; p < 0.0001), QUICKI (r = −0.556; p < 0.0001), as well as HDL (r = −0.45; p < 0.0001) levels (Table 3).
Table 3.
Correlation between studied parameters in the whole polycystic ovary syndrome (PCOS) group.
Subsequently we presented analysis of relationships between measured parameters within subgroups. These data are shown in Table 4, Table 5 and Table 6 (For the clarity we enclosed only significantly different data in the enclosed tables). In the Table 4 we present correlation in the selected parameters in Group 1. Obviously, there is a positive correlation between T and FTI (r = 0.586; p < 0.0001). BMI had strong, significant, positive correlation with TC/HDL (r = 0.586; p < 0.0001); HOMA-IR (r = 0.548; p < 0.0001), TG/HDL (r = −0.511; p < 0.0001) and negative correlation with FGIR (r = −0.518; p < 0.0001)) and QUICKI (r = −0.545; p < 0.0001). FGIR correlated significantly with QUICKI (r = 0.945; p < 0.0001). We also noticed significant negative correlation between QUICKI and TC/HDL (r = −0.513; p < 0.0001). TC correlated positively with LDL (r = 0.839; p < 0.0001). TC/HDL correlated obviously with HDL (r = −0.778; p < 0.0001), LDL (r = 0.686; p < 0.0001); TG (r = 0.636; p < 0.0001); HOMA-IR (r = 0.518, p < 0.0001), TG/HDL (r = 0.805; p < 0.0001). TG/HDL correlated positively with TG (r = 0.905; p < 0.0001) and negatively with HDL (r = −0.764; p < 0.0001).
Table 4.
Correlation between studied parameters in Group 1.
Table 5.
Correlation between studied parameters in Group 2.
Table 6.
Correlation between the studied parameters in Group 3.
In the Table 5 we present the results for the Group 2. Similarly, to the Group 1 we see that the strong correlations are observed mostly within metabolic parameters. BMI correlates significantly with FGIR (r = −0.58; p < 0.0001); QUICKI (r = −0.62; p < 0.0001), TC/HDL (r = 0.515; p < 0.0001), HOMA-IR (r = 0.952; p < 0.0001); TG/HDL (r = 0.535; p < 0.0001). FGIR correlated positively with QUCIKI (r = 0.953; p < 0.0001) and negatively with HOMA-IR (r = −0.952; p < 0.0001). HOMA-IR had strong correlation with QUICKI (r = −1.0, p < 0.0001) and TG/HDL (r = 0.519; p < 0.0001).
In the Table 6 we show the results of Group 3 with the highest testosterone levels. BMI strongly had significant positive correlation with TC/HDL (r = 0.544; p < 0.0001), HOMA-IR (r = 0.637; p < 0.0001); TG/HDL (r = 0.544; p < 0.0001) and negative with FGIR (r = −0.65; p < 0.0001), QUICKI (r = −0.643; p < 0.0001), HDL (r = −0.59; p < 0.0001). FGIR correlated positively with QUICKI (r = 0.908; p < 0.001) and negatively with HOMA-IR (r = −0.907; p < 0.0001) and TG/HDL (r = −0.5; p < 0.0001). There was also a correlation between HOMA-IR and HDL (r = −0.517; p < 0.0001), TC/HDL (r = 0.504; p < 0.0001) and TG/HDL (p = 0.529; r < 0.001).
4. Discussion
PCOS, also named “functional hyperandrogenism,” is regarded as androgen-induced ovarian dysfunction because these are androgens responsible for the clinical features of the syndrome [38]. On the ovarian level, they interfere with folliculogenesis and lead to the characteristic appearance of ovaries [39]. Numerous papers confirm that a higher incidence of IR with compensatory hyperinsulinemia is a major contributor to the overproduction of male sex steroids [11,40]. Insulin resistance is an essential regulatory factor of ovarian steroidogenesis and, in concert with LH, through cytochrome P450c17α, acts as a gonadotrophic hormone [41]. Moreover, hyperinsulinemia increases bio-available serum testosterone by inhibiting the hepatic synthesis of sex hormone-binding globulin (SHBG) [41,42].
In PCOS girls during puberty, physiological hyperinsulinemia may induce both ovarian hyperandrogenemia and anovulation. These adverse effects are exaggerated by higher than normal insulin levels, probably due to genetic predisposition or excessive weight gain (or both). Increased secretion of insulin and reduced insulin sensitivity were found in obese adolescent girls with PCOS clinical features compared to weight-matched control subjects [43,44]. These pathognomonic characteristics persist till adulthood. In a study assessing the large population of 1212 women with different PCOS phenotypes, obese subjects with mild disease (anovulation and polycystic ovaries without HA) were more insulin resistant than healthy BMI-matched controls and had similar IR as women with HA.
On the other hand, normal-weight women with that phenotype did not differ from controls in IR markers [45]. In our study, we did notice a significantly lower rate of MPY in the groups with middle and highest groups of T, but there were no differences between all the groups according to insulin sensitivity parameters (fasting insulin, HOMA-IR, QUICKI, and FGIR). Moreover, we could not find any strong correlations between MPR and other examined parameters.
In our analysis, we observed that in the third tercile of patients, DHEA-S concentrations were significantly the highest. DHEA-S in the whole population had a strong positive correlation with T, correlated negatively with cholesterol/HDL ratio. Moreover, in the whole studied population, levels of DHEAS were in negative correlation with BMI. An increase in adrenal androgen production is present in 20–60% of women with PCOS [46,47,48]. Increased 17-α-hydroxylase/17-20 lyase (P450 17α) is probably responsible for enhanced androgen biosynthesis in PCOS [49,50]. The polymorphism in the regulatory region of CYP17, a gene that codes for cytochrome P450c17-α, probably up-regulates its expression and may result in augmented androgens production [51]. Numerous studies assessing the association between CYP17 polymorphism and PCOS risk have brought conflicting results for the last two decades. Finally, a recent meta-analysis, which processed all published case-control studies, did not demonstrate such a correlation in the overall study. However, limiting the analysis to the studies within Hardy–Weinberg equilibrium (assuming that both allele and genotype frequencies in a population remain constant) significantly increased risk of CYP17 polymorphism in PCOS patients was proved [52,53].
Lipid abnormalities in PCOS have been initially attributed to the presence of insulin resistance [19,40]. However, some studies report a relation between hyperandrogenemia and dyslipidemia, although the mechanism is not precise [54]. High androgen levels probably exert that effect by working directly at the liver, or they alter body composition by favoring central adiposity [55,56]. In our study, although we found a correlation of FTI with BMI, insulin sensitivity indices on lipid profile parameters in the lowest T group, a similar relation was not fully demonstrated in the middle and highest T tercile. We noticed that it was not the testosterone level itself, but metabolic parameters such as BMI, HOMA-IR, QUICKI that correlated with lipid profile. In our study, levels of testosterone did not correlate with the intensity of metabolic disturbances.
Calculation of LH concentrations revealed statistically significant differences between studied subgroups, revealing that high T tercile patients had the highest LH levels. This phenomenon might be explained by reduced steroid hormone negative feedback on LH secretion because of androgen excess, enhancing hypothalamic gonadotropin releasing-hormone (GnRH) pulsatile release and causes the increase of LH pulse frequency [57,58]. This neuroendocrine abnormality occurs in adolescent girls and probably requires a genetic component or depends on androgen excess [59]. It was proven that exposure to elevated levels of androgens during puberty in female rhesus monkeys changes the neural drive to the reproductive axis. It increases LH pulsatile secretion and LH response to GnRH [60,61]. The full expression of PCOS’s clinical characteristics depends on maturational changes during puberty when a regular alteration in LH pattern may unveil hypersecretion of androgens in adolescent girls with polycystic ovaries [62,63,64]. Some authors point sexually dimorphic pattern of LH release, which more closely resembles that of men or women with congenital virilizing disorders, e.g., girls with CAH have a predisposition to the development of clinical and biochemical features of PCOS [65]. In the study investigating an association of LH β-subunit gene variants with PCOS, the authors demonstrated that cases harboring variant alleles had higher mean LH levels.
Moreover, the prevalence of LH genes variants was lower in obese than lean PCOS women [66]. In our observations, LH correlated negatively with BMI, but those were not strong correlations. Furthermore, there was no strong correlation between LH and T, FTI, and DHEA-S, as well as with any metabolic parameters.
In summary, PCOS is the commonest cause of menstrual irregularity and hyperandrogenemia. It is often associated with many metabolic dysfunctions that were postulated to be responsible for the pathogenesis of the disease. Insulin resistance, central to this disorder, might be regarded as exaggerating standard metabolic alteration during puberty, which is further exacerbated by weight gain. From another perspective, there is evidence for primary abnormality in ovarian folliculogenesis and androgen production manifested in puberty, but their origins may reach early infancy or even the fetal period. Although PCOS etiology is still uncertain, preceding observations suggest that there may exist many different pathways leading to the development of that syndrome.
The advantage of the study is the group size and homogeneity of the studied population. Not using the hyperinsulinemic-euglycemic clamp is the study’s limitation when speculating about hyperinsulinemia effect on the variables studied in this paper. However, the study of Pisprasert et al., indicated that insulin sensitivity indices based on glucose and insulin levels work well in the studies where we examine a homogenous group of patients (same gender, same race population) [67].
5. Conclusions
Our study confirms that PCOS is a very heterogeneous syndrome manifesting with diverse clinical, endocrinological, and metabolic phenotypes. On a population of white Caucasian PCOS women, we demonstrated that hyperandrogenemia correlates with severity of derangements in clinical parameters, that all predispose to the development of the metabolic syndrome, which we have described already in our previous papers [68,69].
Interestingly, subgroups’ analysis revealed no correlation between androgen levels and insulin sensitivity/dyslipidemia in women with high/very high levels of testosterone. We speculate that metabolic abnormalities may contribute more significantly to PCOS development in women’s subpopulation with no aberrant steroidogenesis and less predominant androgenization.
Author Contributions
Conceptualization, M.K. and K.O.; methodology, M.K.; software, M.K. and K.O.; validation, L.P.; formal analysis, L.P.; investigation, K.O. and M.K.; resources, A.S.; data curation, A.S.; writing—original draft preparation, M.K., K.O., and A.S.; writing—review and editing, L.P.; visualization, M.K. and K.O.; supervision, L.P.; project administration, L.P.; All authors have read and agreed to the published version of the manuscript.
Funding
This research received no external funding.
Conflicts of Interest
The authors declare no conflict of interest.
References
- Goodarzi, M.O.; Dumesic, D.A.; Chazenbalk, G.; Azziz, R. Polycystic ovary syndrome: Etiology, pathogenesis and diagnosis. Nat. Rev. Endocrinol. 2011, 7, 219–231. [Google Scholar] [CrossRef] [PubMed]
- Diamanti-Kandarakis, E.; Kouli, C.R.; Bergiele, A.T.; Filandra, F.A.; Tsianateli, T.C.; Spina, G.G.; Zapanti, E.D.; Bartzis, M.I. A survey of the polycystic ovary syndrome in the Greek island of Lesbos: Hormonal and metabolic profile. J. Clin. Endocrinol. Metab. 1999, 84, 4006–4011. [Google Scholar] [CrossRef] [PubMed]
- Mikolajczyk, R.; Rauchfuss, M.; Lamm, D. Unplanned pregnancies in a developed society--a study on a maternity ward in Berlin. Zentralbl. Gynakol. 2001, 123, 578–584. [Google Scholar] [CrossRef] [PubMed]
- March, W.A.; Moore, V.M.; Willson, K.J.; Phillips, D.I.W.; Norman, R.J.; Davies, M.J. The prevalence of polycystic ovary syndrome in a community sample assessed under contrasting diagnostic criteria. Hum. Reprod. 2010, 25, 544–551. [Google Scholar] [CrossRef]
- Ma, Y.M.; Li, R.; Qiao, J.; Zhang, X.W.; Wang, S.Y.; Zhang, Q.F.; Li, L.; Tu, B.B.; Zhang, X. Characteristics of abnormal menstrual cycle and polycystic ovary syndrome in community and hospital populations. Chin. Med. J. 2010. [Google Scholar] [CrossRef]
- Boyle, J.A.; Cunningham, J.; O’Dea, K.; Dunbar, T.; Norman, R.J. Prevalence of polycystic ovary syndrome in a sample of Indigenous women in Darwin, Australia. Med. J. Aust. 2011, 196, 62–66. [Google Scholar] [CrossRef]
- Azziz, R.; Carmina, E.; Dewailly, D.; Diamanti-Kandarakis, E.; Escobar-Morreale, H.F.; Futterweit, W.; Janssen, O.E.; Legro, R.S.; Norman, R.J.; Taylor, A.E.; et al. The Androgen Excess and PCOS Society criteria for the polycystic ovary syndrome: The complete task force report. Fertil. Steril. 2009, 91, 456–488. [Google Scholar] [CrossRef]
- Asuncion, M.; Calvo, R.M.; San Millan, J.L.; Sancho, J.; Avila, S.; Escobar-Morreale, H.F. A prospective study of the prevalence of the polycystic ovary syndrome in unselected Caucasian women from Spain. J. Clin. Endocrinol. Metab. 2000, 85, 2434–2438. [Google Scholar] [CrossRef]
- Wild, R.A.; Carmina, E.; Diamanti-Kandarakis, E.; Dokras, A.; Escobar-Morreale, H.F.; Futterweit, W.; Lobo, R.; Norman, R.J.; Talbott, E.; Dumesic, A.D. Assessment of Cardiovascular Risk and Prevention of Cardiovascular Disease in Women with the Polycystic Ovary Syndrome: A Consensus Statement by the Androgen Excess and Polycystic Ovary Syndrome (AE-PCOS) Society. J. Clin. Endocrinol. Metab. 2010, 95, 2038–2049. [Google Scholar] [CrossRef]
- Moran, L.J.; Misso, M.L.; Wild, R.A.; Norman, R.J. Impaired glucose tolerance, type 2 diabetes and metabolic syndrome in polycystic ovary syndrome: A systematic review and meta-analysis. Hum. Reprod. Update 2010, 16, 347–363. [Google Scholar] [CrossRef]
- Dunaif, A. Insulin resistance and the polycystic ovary syndrome: Mechanism and implications for pathogenesis. Endocr. Rev. 1997, 18, 774–800. [Google Scholar] [CrossRef] [PubMed]
- Azziz, R.; Carmina, E.; Dewailly, D.; Diamanti-Kandarakis, E.; Escobar-Morreale, H.F.; Futterweit, W.; Janssen, O.E.; Legro, R.S.; Norman, R.J.; Taylor, A.E.; et al. Position statement: Criteria for defining polycystic ovary syndrome as a predominantly hyperandrogenic syndrome: An androgen excess society guideline. J. Clin. Endocrinol. Metab. 2006. [Google Scholar] [CrossRef] [PubMed]
- Rotterdam ESHRE/ASRM-Sponsored PCOS Consensus Workshop Group. Revised 2003 consensus on diagnostic criteria and long-term health risks related to polycystic ovary syndrome (PCOS). Hum. Reprod. 2004, 19, 41–47. [Google Scholar] [CrossRef] [PubMed]
- Ozegowska, K.; Pawelczyk, L. Cardiometabolic risk in patients with polycystic ovary syndrome. Ginekol. Pol. 2015, 86. [Google Scholar] [CrossRef] [PubMed]
- Boomsma, C.M.; Eijkemans, M.J.C.; Hughes, E.G.; Visser, G.H.A.; Fauser, B.C.J.M.; Macklon, N.S. A meta-analysis of pregnancy outcomes in women with polycystic ovary syndrome. Hum. Reprod. Update 2006, 12, 673–683. [Google Scholar] [CrossRef]
- Palomba, S.; Falbo, A.; Russo, T.; Tolino, A.; Orio, F.; Zullo, F. Pregnancy in women with polycystic ovary syndrome: The effect of different phenotypes and features on obstetric and neonatal outcomes. Fertil. Steril. 2010, 94, 1805–1811. [Google Scholar] [CrossRef]
- Palomba, S.; De Wilde, M.A.; Falbo, A.; Koster, M.P.H.; La Sala, G.B.; Fauser, B.C.J.M. Pregnancy complications in women with polycystic ovary syndrome. Hum. Reprod. Update 2015, 21, 575–592. [Google Scholar] [CrossRef]
- Fica, S.; Albu, A.; Constantin, M.; Dobri, G.A. Insulin resistance and fertility in polycystic ovary syndrome. J. Med. Life 2008, 1, 415–422. [Google Scholar]
- Legro, R.S.; Kunselman, A.R.; Dunaif, A. Prevalence and predictors of dyslipidemia in women with polycystic ovary syndrome. Am. J. Med. 2001, 111, 607–613. [Google Scholar] [CrossRef]
- Carmina, E.; Orio, F.; Palomba, S.; Cascella, T.; Longo, R.A.; Colao, A.M.; Lombardi, G.; Lobo, R.A. Evidence for altered adipocyte function in polycystic ovary syndrome. Eur. J. Endocrinol. 2005, 152, 389–394. [Google Scholar] [CrossRef]
- Palomba, S.; Santagni, S.; Falbo, A.; La Sala, G.B. Complications and challenges associated with polycystic ovary syndrome: Current perspectives. Int. J. Womens Health 2015, 7, 745–763. [Google Scholar] [CrossRef] [PubMed]
- Ovalle, F.; Azziz, R. Insulin resistance, polycystic ovary syndrome, and type 2 diabetes mellitus. Fertil. Steril. 2002, 77, 1095–1105. [Google Scholar] [CrossRef]
- Amiri, M.; Ramezani Tehrani, F.; Behboudi-Gandevani, S.; Bidhendi-Yarandi, R.; Carmina, E. Risk of hypertension in women with polycystic ovary syndrome: A systematic review, meta-analysis and meta-regression. Reprod. Biol. Endocrinol. 2020, 18, 23. [Google Scholar] [CrossRef]
- Ramezani Tehrani, F.; Montazeri, S.A.; Hosseinpanah, F.; Cheraghi, L.; Erfani, H.; Tohidi, M.; Azizi, F. Trend of Cardio-Metabolic Risk Factors in Polycystic Ovary Syndrome: A Population-Based Prospective Cohort Study. PLoS ONE 2015, 10, e0137609. [Google Scholar] [CrossRef]
- Loverro, G.; Lorusso, F.; Mei, L.; Depalo, R.; Cormio, G.; Selvaggi, L. The plasma homocysteine levels are increased in polycystic ovary syndrome. Gynecol. Obstet. Investig. 2002, 53, 157–162. [Google Scholar] [CrossRef]
- Wild, S.; Pierpoint, T.; McKeigue, P.; Jacobs, H. Cardiovascular disease in women with polycystic ovary syndrome at long-term follow-up: A retrospective cohort study. Clin. Endocrinol. 2000, 52, 595–600. [Google Scholar] [CrossRef] [PubMed]
- Carmina, E.; Koyama, T.; Chang, L.; Stanczyk, F.Z.; Lobo, R.A. Does ethnicity influence the prevalence of adrenal hyperandrogenism and insulin resistance in polycystic ovary syndrome? Int. J. Gynecol. Obstet. 1993. [Google Scholar] [CrossRef]
- DeUgarte, C.M.; Bartolucci, A.A.; Azziz, R. Prevalence of insulin resistance in the polycystic ovary syndrome using the homeostasis model assessment. Fertil. Steril. 2005. [Google Scholar] [CrossRef] [PubMed]
- Legro, R.S.; Castracane, V.D.; Kauffman, R.P. Detecting Insulin Resistance in Polycystic Ovary Syndrome: Purposes and Pitfalls. Obstet. Gynecol. Surv. 2004. [Google Scholar] [CrossRef] [PubMed]
- Nestler, J.E. Role of hyperinsulinemia in the pathogenesis of the polycystic ovary syndrome, and its clinical implications. Semin. Reprod. Endocrinol. 1997, 15, 111–122. [Google Scholar] [CrossRef]
- Wood, J.R.; Dumesic, D.A.; Abbott, D.H.; Strauss, J.F. Molecular abnormalities in oocytes from women with polycystic ovary syndrome revealed by microarray analysis. J. Clin. Endocrinol. Metab. 2007. [Google Scholar] [CrossRef] [PubMed]
- Dumesic, D.A.; Abbott, D.H. Implications of polycystic ovary syndrome on oocyte development. Semin. Reprod. Med. 2008. [Google Scholar] [CrossRef] [PubMed]
- Brewer, C.J.; Balen, A.H. The adverse effects of obesity on conception and implantation. Reproduction 2010, 140, 347–364. [Google Scholar] [CrossRef] [PubMed]
- Giudice, L.C. Endometrium in PCOS: Implantation and predisposition to endocrine CA. Best Pract. Res. Clin. Endocrinol. Metab. 2006, 20, 235–244. [Google Scholar] [CrossRef]
- Legro, R.S.; Finegood, D.; Dunaif, A. A fasting glucose to insulin ratio is a useful measure of insulin sensitivity in women with polycystic ovary syndrome. J. Clin. Endocrinol. Metab. 1998. [Google Scholar] [CrossRef]
- Katz, A.; Nambi, S.S.; Mather, K.; Baron, A.D.; Follmann, D.A.; Sullivan, G.; Quon, M.J. Quantitative insulin sensitivity check index: A simple, accurate method for assessing insulin sensitivity in humans. J. Clin. Endocrinol. Metab. 2000, 85, 2402–2410. [Google Scholar] [CrossRef]
- Matthews, D.R.; Hosker, J.P.; Rudenski, A.S.; Naylor, B.A.; Treacher, D.F.; Turner, R.C. Homeostasis model assessment: Insulin resistance and beta-cell function from fasting plasma glucose and insulin concentrations in man. Diabetologia 1985, 28, 412–419. [Google Scholar] [CrossRef]
- Azziz, R. Androgen excess is the key element in polycystic ovary syndrome. Fertil. Steril. 2003, 80, 252–254. [Google Scholar] [CrossRef]
- Walters, K.A.; Paris, V.R.; Aflatounian, A.; Handelsman, D.J. Androgens and ovarian function: Translation from basic discovery research to clinical impact. J. Endocrinol. 2019, 242, R23–R50. [Google Scholar] [CrossRef]
- Jeanes, Y.M.; Reeves, S. Metabolic consequences of obesity and insulin resistance in polycystic ovary syndrome: Diagnostic and methodological challenges. Nutr. Res. Rev. 2017, 30, 97–105. [Google Scholar] [CrossRef]
- Poretsky, L.; Cataldo, N.A.; Rosenwaks, Z.; Giudice, L.C. The insulin-related ovarian regulatory system in health and disease. Endocr. Rev. 1999, 20, 535–582. [Google Scholar] [CrossRef] [PubMed]
- Wallace, I.R.; McKinley, M.C.; Bell, P.M.; Hunter, S.J. Sex hormone binding globulin and insulin resistance. Clin. Endocrinol. 2013. [Google Scholar] [CrossRef] [PubMed]
- Rosenfield, R.L. The diagnosis of polycystic ovary syndrome in adolescents. Pediatrics 2015, 136, 1154–1165. [Google Scholar] [CrossRef] [PubMed]
- Lewy, V.D.; Danadian, K.; Witchel, S.F.; Arslanian, S. Early metabolic abnormalities in adolescent girls with polycystic ovarian syndrome. J. Pediatr. 2001, 138, 38–44. [Google Scholar] [CrossRef] [PubMed]
- Goodarzi, M.O.; Carmina, E.; Azziz, R. DHEA, DHEAS and PCOS. J. Steroid Biochem. Mol. Biol. 2015, 145, 213–225. [Google Scholar] [CrossRef]
- Macut, D.; Antić, I.B.; Nestorov, J.; Topalović, V.; Macut, J.B.; Panidis, D.; Kotlica, B.K.; Papadakis, E.; Matić, G.; Milutinović, D.V. The influence of combined oral contraceptives containing drospirenone on hypothalamic-pituitary-adrenocortical axis activity and glucocorticoid receptor expression and function in women with polycystic ovary syndrome. Hormones 2015, 14, 109–117. [Google Scholar] [CrossRef]
- Vettor, R.; Macor, C.; Novo, F.; Gottardo, C.; Zovato, S.; Simoncini, M.; Federspil, G.; Armanini, D. Corticosteroid receptors in mononuclear leucocytes of obese subjects. J. Endocrinol. 1998, 156, 187–194. [Google Scholar] [CrossRef][Green Version]
- Cheng, T.; Dimitrov, S.; Pruitt, C.; Hong, S. Glucocorticoid mediated regulation of inflammation in human monocytes is associated with depressive mood and obesity. Psychoneuroendocrinology 2016, 66, 195–204. [Google Scholar] [CrossRef]
- O’Shaughnessy, P.J.; Antignac, J.P.; Le Bizec, B.; Morvan, M.L.; Svechnikov, K.; Söder, O.; Savchuk, I.; Monteiro, A.; Soffientini, U.; Johnstonid, Z.C.; et al. Alternative (Backdoor) androgen production and masculinization in the human fetus. PLoS Biol. 2019, 17, e3000002. [Google Scholar] [CrossRef]
- Ehrmann, D.A.; Rosenfield, R.L.; Barnes, R.B.; Brigell, D.F.; Sheikh, Z. Detection of functional ovarian hyperandrogenism in women with androgen excess. Obstet. Gynecol. Surv. 1992, 327, 157–162. [Google Scholar] [CrossRef]
- Carey, A.H.; Waterworth, D.; Patel, K.; White, D.; Little, J.; Novelli, P.; Franks, S.; Williamson, R. Polycystic ovaries and premature male pattern baldness are associated with one allele of the steroid metabolism gene CYP17. Hum. Mol. Genet. 1994, 3, 1873–1876. [Google Scholar] [CrossRef] [PubMed]
- Li, Y.; Liu, F.; Luo, S.; Hu, H.; Li, X.H.; Li, S.W. Polymorphism T→C of gene CYP17 promoter and polycystic ovary syndrome risk: A meta-analysis. Gene 2012, 495, 16–22. [Google Scholar] [CrossRef] [PubMed]
- Ajmal, N.; Khan, S.Z.; Shaikh, R. Polycystic ovary syndrome (PCOS) and genetic predisposition: A review article. Eur. J. Obstet. Gynecol. Reprod. Biol. X 2019, 3. [Google Scholar] [CrossRef] [PubMed]
- Diamanti-Kandarakis, E.; Papavassiliou, A.G.; Kandarakis, S.A.; Chrousos, G.P. Pathophysiology and types of dyslipidemia in PCOS. Trends Endocrinol. Metab. 2007, 18, 280–285. [Google Scholar] [CrossRef] [PubMed]
- Sidhwani, S.; Scoccia, B.; Sunghay, S.; Stephens-Archer, C.N.; Mazzone, T.; Sam, S. Polycystic ovary syndrome is associated with atherogenic changes in lipoprotein particle number and size independent of body weight. Clin. Endocrinol. 2011, 75, 76–82. [Google Scholar] [CrossRef]
- Moran, L.J.; Mundra, P.A.; Teede, H.J.; Meikle, P.J. The association of the lipidomic profile with features of polycystic ovary syndrome. J. Mol. Endocrinol. 2017, 59, 93–104. [Google Scholar] [CrossRef]
- Coyle, C.; Campbell, R.E. Pathological pulses in PCOS. Mol. Cell. Endocrinol. 2019, 498, 11056. [Google Scholar] [CrossRef]
- Blank, S.K.; McCartney, C.R.; Marshall, J.C. The origins and sequelae of abnormal neuroendocrine function in polycystic ovary syndrome. Hum. Reprod. Update 2006, 12, 351–361. [Google Scholar] [CrossRef]
- Chhabra, S.; McCartney, C.R.; Yoo, R.Y.; Eagleson, C.A.; Chang, R.J.; Marshall, J.C. Progesterone inhibition of the hypothalamic gonadotropin-releasing hormone pulse generator: Evidence for varied effects in hyperandrogenemic adolescent girls. J. Clin. Endocrinol. Metab. 2005, 90, 2810–2815. [Google Scholar] [CrossRef]
- McGee, W.K.; Bishop, C.V.; Bahar, A.; Pohl, C.R.; Chang, R.J.; Marshall, J.C.; Pau, F.K.; Stouffer, R.L.; Cameron, J.L. Elevated androgens during puberty in female rhesus monkeys lead to increased neuronal drive to the reproductive axis: A possible component of polycystic ovary syndrome. Am. J. Physiol. Endocrinol. Metab. 2014, 306, E1292–E1304. [Google Scholar] [CrossRef]
- Bishop, C.V.; Mishler, E.C.; Takahashi, D.L.; Reiter, T.E.; Bond, K.R.; True, C.A.; Slayden, O.D.; Stouffer, R.L. Chronic hyperandrogenemia in the presence and absence of a western-style diet impairs ovarian and uterine structure/function in young adult rhesus monkeys. Hum. Reprod. 2018, 33, 128–139. [Google Scholar] [CrossRef] [PubMed]
- Franks, S.; McCarthy, M.I.; Hardy, K.; Skakkebæk, N.E.; Aitken, R.J.; Swan, S.; De Muinck Keizer-Schrama, S. Development of polycystic ovary syndrome: Involvement of genetic and environmental factors. Int. J. Androl. 2006, 29, 278–285. [Google Scholar] [CrossRef] [PubMed]
- Rothenberg, S.S.; Beverley, R.; Barnard, E.; Baradaran-Shoraka, M.; Sanfilippo, J.S. Polycystic ovary syndrome in adolescents. Best Pract. Res. Clin. Obstet. Gynaecol. 2018, 48, 103–114. [Google Scholar] [CrossRef] [PubMed]
- Zumoff, B.; Freeman, R.; Coupey, S.; Saenger, P.; Markowitz, M.; Kream, J. A Chronobiologic Abnormality in Luteinizing Hormone Secretion in Teenage Girls with the Polycystic-Ovary Syndrome. N. Engl. J. Med. 1983, 309, 1206–1209. [Google Scholar] [CrossRef] [PubMed]
- Barnes, R.B.; Rosenfield, R.L.; Ehrmann, D.A.; Cara, J.F.; Cuttler, L.; Levitsky, L.L.; Rosenthal, I.M. Ovarian hyperandrogynism as a result of congenital adrenal virilizing disorders: Evidence for perinatal masculinization of neuroendocrine function in women. J. Clin. Endocrinol. Metab. 1994, 79, 1328–1333. [Google Scholar] [CrossRef] [PubMed]
- Dasgupta, S.; Sirisha, P.V.S.; Neelaveni, K.; Anuradha, K.; Sudhakar, G.; Reddy, B.M. Role of luteinizing hormone β-subunit gene variants among South Indian women with polycystic ovary syndrome. Gene 2012, 494, 51–56. [Google Scholar] [CrossRef]
- Pisprasert, V.; Ingram, K.H.; Lopez-Davila, M.F.; Munoz, A.J.; Garvey, W.T. Limitations in the use of indices using glucose and insulin levels to predict insulin sensitivity: Impact of race and gender and superiority of the indices derived from oral glucose tolerance test in African Americans. Diabetes Care 2013, 36, 845–853. [Google Scholar] [CrossRef]
- Ozegowska, K.; Bogacz, A.; Bartkowiak-Wieczorek, J.; Seremak-Mrozikiewicz, A.; Pawelczyk, L. Is there an association between the development of metabolic syndrome in PCOS patients and the C677T MTHFR gene polymorphism? Ginekol. Pol. 2016, 87, 246–253. [Google Scholar] [CrossRef]
- Ozegowska, K.E.; Pawelczyk, L.A. The role of insulin and selected adipocytokines in patients with polycystic ovary syndrome (PCOS)—A literature review. Ginekol. Pol. 2015, 86. [Google Scholar] [CrossRef]


Publisher’s Note: MDPI stays neutral with regard to jurisdictional claims in published maps and institutional affiliations. |
© 2020 by the authors. Licensee MDPI, Basel, Switzerland. This article is an open access article distributed under the terms and conditions of the Creative Commons Attribution (CC BY) license (http://creativecommons.org/licenses/by/4.0/).