Disposable and Low-Cost Colorimetric Sensors for Environmental Analysis


Abstract
1. Introduction
2. Detection and Image Analysis
3. Chemometric Tools for Colorimetric Data Analysis
3.1. PCA
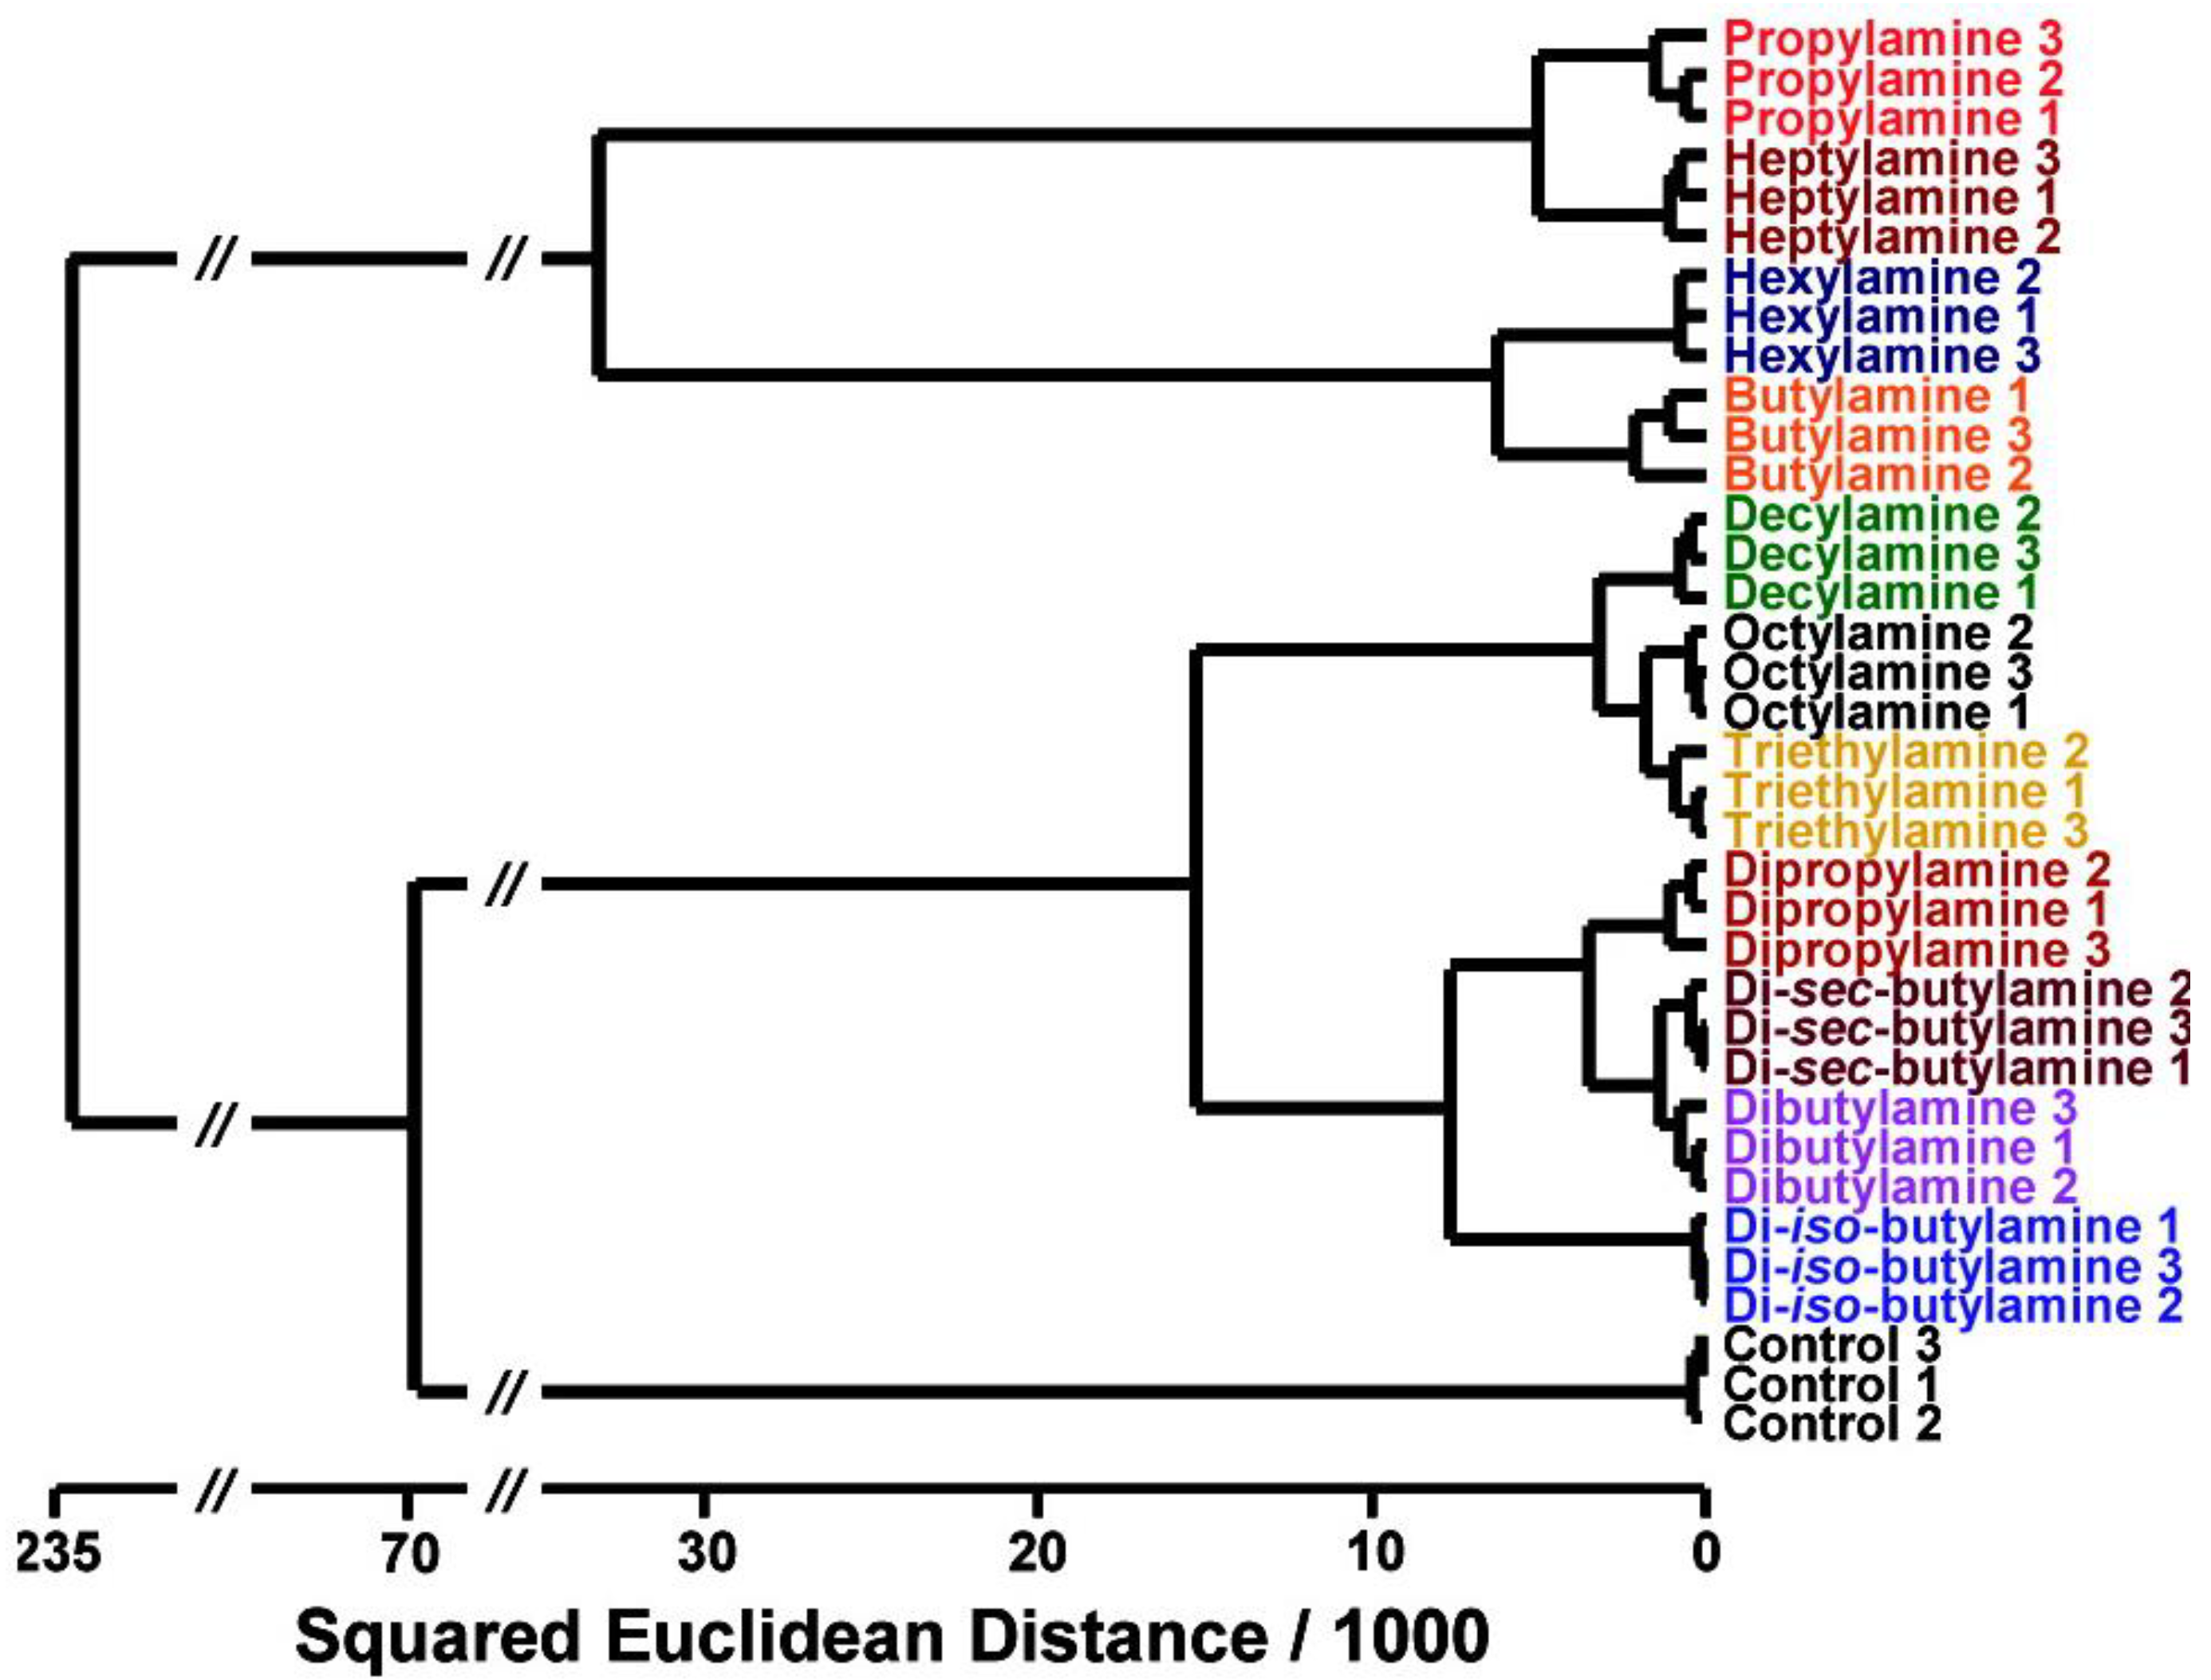
3.2. HCA
3.3. PLS
4. Materials for Disposable Colorimetric Sensors
- -
- Cellulose-based materials;
- -
- Textiles and woven non-woven fabrics;
- -
- Synthetic polymeric supports;
- -
- Sol-gel materials.
4.1. Cellulose-Based Materials
4.2. Textiles and Woven Non-Woven Fabrics
4.3. Synthetic Polymeric Supports
4.4. Sol-Gel Materials
5. Conclusions
Author Contributions
Funding
Conflicts of Interest
References
- Reeve, R.N. Introduction. In Introduction to Environmental Analysis; John Wiley and Sons Ltd.: Chichester, UK, 2002; pp. 2–4. [Google Scholar]
- West, J.J.; Cohen, A.; Dentener, F.; Brunekreef, B.; Zhu, T.; Armstrong, B.G.; Bell, M.L.; Brauer, M.; Carmichael, G.; Costa, D.L.; et al. What we breathe impacts our health: Improving understanding of the link between air pollution and health. Environ. Sci. Technol. 2016, 50, 4895–4904. [Google Scholar] [CrossRef] [PubMed]
- Heyer, D.B.; Meredith, R.M. Environmental toxicology: Sensitive periods of development and neurodevelopmental disorders. Neurotoxicology 2017, 58, 23–41. [Google Scholar] [CrossRef] [PubMed]
- Jin, Y.X.; Wu, S.S.; Zeng, Z.Y.; Fu, Z.W. Effects of environmental pollutants on gut microbiota. Environ. Pollut. 2017, 222, 1–9. [Google Scholar] [CrossRef]
- Justino, C.I.L.; Duarte, A.C.; Rocha-Santos, T.A.P. Recent Progress in Biosensors for Environmental Monitoring: A Review. Sensors 2017, 17, 2918. [Google Scholar] [CrossRef] [PubMed]
- Ho, C.K.; Robinson, A.; Miller, D.R.; Davis, M.J. Overview of Sensors and Needs for Environmental Monitoring. Sensors 2005, 5, 4–37. [Google Scholar] [CrossRef]
- Pandey, S.K.; Kim, K.-H.; Brown, R.J.C. Measurement techniques for mercury species in ambient air. Trends Anal. Chem. 2011, 30, 899–917. [Google Scholar] [CrossRef]
- Wang, J.; Hansen, E.H. On-line sample-pre-treatment schemes for trace-level determinations of metals by coupling flow injection or sequential injection with ICP-MS. Trends Anal. Chem. 2003, 22, 836–846. [Google Scholar] [CrossRef]
- Silva, B.F.; Perez, S.; Gardinalli, P.; Singhal, R.K.; Mozeto, A.A.; Barcelo, D. Analytical chemistry of metallic nanoparticles in natural environments. Trends Anal. Chem. 2011, 30, 528–540. [Google Scholar] [CrossRef]
- Margui, E.; Zawisza, B.; Sitko, R. Trace and ultratrace analysis of liquid samples by X-ray fluorescence spectrometry. Trends Anal. Chem. 2014, 53, 73–83. [Google Scholar] [CrossRef]
- Dago, A.; Arino, C.; Diaz-Cruz, J.M.; Esteban, M. Analysis of phytochelatins and Hg-phytochelatin complexes in Hordeum vulgare plants stressed with Hg and Cd: HPLC study with amperometric detection. Int. J. Environ. Anal. Chem. 2014, 94, 668–678. [Google Scholar] [CrossRef]
- Plassmann, M.M.; Schmidt, M.; Brack, W.; Krauss, M. Detecting a wide range of environmental contaminants in human blood samples-combining QuEChERS with LC-MS and GC-MS methods. Anal. Bioanal. Chem. 2015, 407, 7047–7054. [Google Scholar] [CrossRef] [PubMed]
- Duarte, K.; Justino, C.I.L.; Freitas, A.C.; Gomes, A.M.P.; Duarte, A.C.; Rocha-Santos, T.A. Disposable sensors for environmental monitoring of lead, cadmium and mercury. TRAC Trend. Anal. Chem. 2015, 64, 183–190. [Google Scholar] [CrossRef]
- Howes, P.D.; Chandrawati, R.; Stevens, M.M. Colloidal nanoparticles as advanced biological sensors. Science 2014, 346, 1247390. [Google Scholar] [CrossRef] [PubMed]
- Zhang, W.S.; Lin, D.M.; Wang, H.X.; Li, J.F.; Nienhaus, G.U.; Su, Z.Q.; Wei, G.; Shang, L. Supramolecular Self-Assembly Bioinspired Synthesis of Luminescent Gold Nanocluster-Embedded Peptide Nanofibers for Temperature Sensing and Cellular Imaging. Bioconjugate Chem. 2017, 28, 2224–2229. [Google Scholar] [CrossRef] [PubMed]
- Shetti, N.P.; Bukkitgar, S.D.; Reddy, K.R.; Reddy, C.V.; Aminabhavi, T.M. ZnO-based nanostructured electrodes for electrochemical sensors and biosensors in biomedical applications. Biosens. Bioelectron. 2019, 141, 111417. [Google Scholar] [CrossRef] [PubMed]
- Shetti, N.P.; Bukkitgar, S.D.; Reddy, K.R.; Reddy, C.V.; Aminabhavi, T.M. Nanostructured titanium oxide hybrids based electrochemical biosensors for healthcare applications. Colloids Surf. B 2019, 178, 385–394. [Google Scholar] [CrossRef] [PubMed]
- Su, S.; Wu, W.; Gao, J.; Lu, J.; Fan, C. Nanomaterials-based sensors for applications in environmental monitoring. J. Mater. Chem. 2012, 22, 18101–18110. [Google Scholar] [CrossRef]
- Wooten, M.; Karra, S.; Zhang, M.G.; Gorski, W. On the Direct Electron Transfer, Sensing, and Enzyme Activity in the Glucose Oxidase/Carbon Nanotubes System. Anal. Chem. 2014, 86, 752–757. [Google Scholar] [CrossRef]
- Wang, Z.Q.; Wu, S.S.; Wang, J.; Yu, A.L.; Wei, G. Carbon Nanofiber-Based Functional Nanomaterials for Sensor Applications. Nanomaterials 2019, 9, 1045. [Google Scholar] [CrossRef]
- Shetti, N.P.; Nayak, D.S.; Malode, S.J.; Kakarla, R.R.; Shukla, S.S.; Aminabhavi, T.M. Sensors based on ruthenium-doped TiO2 nanoparticles loaded into multiwalled carbon nanotubes for the detection of flufenamic acid and mefenamic acid. Anal. Chim. Acta 2019, 1051, 58–72. [Google Scholar] [CrossRef]
- Ho, M.D.; Ling, Y.; Yap, L.W.; Wang, Y.; Dong, D.; Zhao, Y.; Cheng, W. Percolating Network of Ultrathin Gold Nanowires and Silver Nanowires toward “Invisible” Wearable Sensors for Detecting Emotional Expression and Apexcardiogram. Adv. Funct. Mater. 2017, 27, 1700845. [Google Scholar] [CrossRef]
- Wang, L.; Wu, A.G.; Wei, G. Graphene-based aptasensors: From molecule-interface interactions to sensor design and biomedical diagnostics. Analyst 2018, 143, 1526–1543. [Google Scholar] [CrossRef] [PubMed]
- Wang, L.; Zhang, Y.J.; Wu, A.G.; Wei, G. Designed graphene-peptide nanocomposites for biosensor applications: A review. Anal. Chim. Acta 2017, 985, 24–40. [Google Scholar] [CrossRef] [PubMed]
- Tiwari, J.N.; Vij, V.; Kemp, K.C.; Kim, K.S. Engineered Carbon-Nanomaterial-Based Electrochemical Sensors for Biomolecules. ACS Nano 2016, 10, 46–80. [Google Scholar] [CrossRef]
- Lin, D.M.; Li, Y.; Zhang, P.P.; Zhang, W.S.; Ding, J.W.; Li, J.F.; Wei, G.; Su, Z. Fast preparation of MoS2 nanoflowers decorated with platinum nanoparticles for electrochemical detection of hydrogen peroxide. RSC Adv. 2016, 6, 52739–52745. [Google Scholar] [CrossRef]
- Shetti, N.P.; Nayak, D.S.; Kuchinad, G.T. Electrochemical oxidation of erythrosine at TiO2 nanoparticles modified gold electrode—An environmental application. J. Environ. Chem. Eng. 2017, 5, 2083–2089. [Google Scholar] [CrossRef]
- Dakshayini, B.S.; Reddy, K.R.; Mishra, A.; Shetti, N.P.; Malode, S.J.; Basu, S.; Naveen, S.; Raghu, A.V. Role of conducting polymer and metal oxide-based hybrids for applications in amperometric sensors and biosensors. Microchem. J. 2019, 147, 7–24. [Google Scholar] [CrossRef]
- Shetti, N.P.; Malode, S.J.; Nayak, D.S.; Bagihalli, G.B.; Kalanur, S.S.; Malladi, R.S.; Reddy, C.V.; Aminabhavi, T.M.; Reddy, K.R. Fabrication of ZnO nanoparticles modified sensor for electrochemical oxidation of methdilazine. Appl. Surf. Sci. 2019, 496, 143656. [Google Scholar] [CrossRef]
- Xue, L.; Zheng, L.Y.; Zhang, H.L.; Jin, X.; Lin, J.H. An ultrasensitive fluorescent biosensor using high gradient magnetic separation and quantum dots for fast detection of foodborne pathogenic bacteria. Sens. Actuators B 2018, 265, 318–325. [Google Scholar] [CrossRef]
- Zhu, C.H.; Meng, G.W.; Zheng, P.; Huang, Q.; Li, Z.B.; Hu, X.; Wang, X.; Huang, Z.; Li, F.; Wu, N. A Hierarchically Ordered Array of Silver-Nanorod Bundles for Surface-Enhanced Raman Scattering Detection of Phenolic Pollutants. Adv. Mater. 2016, 28, 4871–4876. [Google Scholar] [CrossRef]
- Aldewachi, H.; Chalati, T.; Woodroofe, M.N.; Bricklebank, N.; Sharrack, B.; Gardiner, P. Gold nanoparticle-based colorimetric biosensors. Nanoscale 2018, 10, 18–33. [Google Scholar] [CrossRef] [PubMed]
- Piriya, V.S.A.; Joseph, P.; Daniel, S.C.G.K.; Lakshmanan, S.; Kinoshita, T.; Muthusamy, S. Colorimetric sensors for rapid detection of various analytes. Mater. Sci. Eng. C 2017, 78, 1231–1245. [Google Scholar] [CrossRef] [PubMed]
- Priyadarshini, E.; Pradhan, N. Gold nanoparticles as efficient sensors in colorimetric detection of toxic metal ions: A review. Sens. Actuators B 2017, 238, 888–902. [Google Scholar] [CrossRef]
- Zhai, J.F.; Yong, D.M.; Li, J.; Dong, S.J. A novel colorimetric biosensor for monitoring and detecting acute toxicity in water. Analyst 2013, 138, 702–707. [Google Scholar] [CrossRef]
- Dincer, C.; Bruch, R.; Costa-Rama, E.; Abedul, M.T.F.; Merkoçi, A.; Manz, A.; Urban, G.A.; Güder, F. Disposable Sensors in Diagnostics, Food, and Environmental Monitoring. Adv. Mater. 2019, 31, e1806739. [Google Scholar] [CrossRef]
- Nery, E.W.; Kubota, L.T. Sensing approaches on paper-based devices: A review. Anal. Bioanal. Chem. 2013, 405, 7573–7595. [Google Scholar] [CrossRef]
- Maruo, Y.Y.; Kunioka, T.; Akaoka, K.; Nakamura, J. Development and evaluation of ozone detection paper. Sens. Actuat. B Chem. 2009, 135, 575–580. [Google Scholar] [CrossRef]
- Li, C.; Vandenberg, K.; Prabhulkar, S.; Zhu, X.; Schneper, L.; Methee, K.; Rosser, C.J.; Almeide, E. Paper based point-of-care testing disc for multiplex whole cell bacteria analysis. Biosens. Bioelectron. 2011, 26, 4342–4348. [Google Scholar] [CrossRef]
- Ellerbee, A.K.; Phillips, S.T.; Siegel, A.C.; Mirica, K.A.; Martinez, A.W.; Striehl, P.; Jain, N.; Prentiss, M.; Whitesides, G.M. Quantifying colorimetric assays in paper-based microfluidic devices by measuring the transmission of light through paper. Anal. Chem. 2009, 81, 8447–8452. [Google Scholar] [CrossRef]
- Kangas, M.J.; Burks, R.M.; Atwater, J.; Lukowicz, R.M.; Williams, P.; Holmes, A.E. Colorimetric Sensor Arrays for the Detection and Identification of Chemical Weapons and Explosives. Crit. Rev. Anal. Chem. 2017, 47, 138–153. [Google Scholar] [CrossRef]
- Jolliffe, I.T.; Cadima, J. Principal component analysis: A review and recent developments. Philos. Trans. R. Soc. A 2016, 374, 20150202. [Google Scholar] [CrossRef] [PubMed]
- Zhou, Y.; Huang, W.; He, Y. pH-Induced silver nanoprism etching-based multichannel colorimetric sensor array for ultrasensitive discrimination of thiols. Sens. Actuators B 2018, 270, 187–191. [Google Scholar] [CrossRef]
- Salles, M.O.; Meloni, G.N.; De Araujo, W.R.; Paixao, T.R.L.C. Explosive colorimetric discrimination using a smartphone, paper device and chemometrical approach. Anal. Methods. 2014, 6, 2047–2052. [Google Scholar] [CrossRef]
- Bueno, L.; Meloni, G.N.; Reddy, S.M.; Paixao, T.R.L.C. Use of plastic-based analytical device, smartphone and chemometric tools to discriminate amines. RSC Adv. 2015, 5, 20148–20154. [Google Scholar] [CrossRef]
- Chen, Y.; Zilberman, Y.; Mostafalu, P.; Sonkusale, S.R. paper based platform for colorimetric sensing of dissolved NH3 and CO2. Biosens. Bioelectron. 2015, 67, 477–484. [Google Scholar] [CrossRef] [PubMed]
- Alberti, G.; Re, S.; Tivelli, A.M.C.; Biesuz, R. Smart sensory materials for divalent cations: A dithizone immobilized membrane for optical analysis. Analyst 2016, 141, 6140–6148. [Google Scholar] [CrossRef]
- Bang, J.H.; Lim, S.H.; Park, E.; Suslick, K.S. Chemically Responsive Nanoporous Pigments: Colorimetric Sensor Arrays and the Identification of Aliphatic Amines. Langmuir 2008, 24, 13168–13172. [Google Scholar] [CrossRef]
- Chulvi, K.; Gavina, P.; Costero, A.M.; Gil, S.; Parra, M.; Gotor, R.; Royo, S.; Martínez-Máñez, R.; Sancenóna, F.; Vivancos, J.-L. Discrimination of Nerve Gases Mimics and Other Organophosphorous Derivatives in Gas Phase Using a Colorimetric Probe Array. Chem. Commun. 2012, 48, 10105–10107. [Google Scholar] [CrossRef]
- Feng, L.; Musto, C.J.; Suslick, K.S. A Simple and Highly Sensitive Colorimetric Detection Method for Gaseous Formaldehyde. J. Am. Chem. Soc. 2010, 132, 4046–4047. [Google Scholar] [CrossRef]
- Salinas, Y.; Ros-Lis, J.V.; Vivancos, J.-L.; Martínez-Máñez, R.; Marcos, M.D.; Aucejo, S.; Herranz, N.; Lorente, I.; Garcia, E. A Novel Colorimetric Sensor Array for Monitoring Fresh Pork Sausages Spoilage. Food Control 2014, 35, 166–176. [Google Scholar] [CrossRef]
- Soga, T.; Jimbo, Y.; Suzuki, K.; Citterio, D. Inkjet-Printed Paper-Based Colorimetric Sensor Array for the Discrimination of Volatile Primary Amines. Anal. Chem. 2013, 85, 8973–8978. [Google Scholar] [CrossRef] [PubMed]
- Magnaghi, L.R.; Capone, F.; Zanoni, C.; Alberti, G.; Quadrelli, P.; Biesuz, R. Colorimetric sensor array for monitoring, modelling and comparing spoilage processes of different meat and fish foods. Foods 2020, 9, 684. [Google Scholar] [CrossRef]
- Feng, L.; Musto, C.J.; Kemling, J.W.; Lim, S.H.; Zhong, W.; Suslick, K.S. Colorimetric Sensor Array for Determination and Identification of Toxic Industrial Chemicals. Anal. Chem. 2010, 82, 9433–9440. [Google Scholar] [CrossRef] [PubMed]
- Brereton, R.G. Unsupervised Pattern Recognition: Cluster Analysis. In Chemometrics: Data Analysis for the Laboratory and Chemical Plant; John Wiley and Sons Ltd.: Chichester, UK, 2003; pp. 224–229. [Google Scholar]
- Gerlach, R.W.; Kowalski, B.R.; Wold, H.O.A. Partial least-squares path modeling with latent variables. Anal. Chim. Acta 1979, 112, 417–421. [Google Scholar] [CrossRef]
- Huang, L.; Zhang, X.; Zhang, Z. Sensor array for qualitative and quantitative analysis of metal ions and metal oxyanion based on colorimetric and chemometric methods. Anal. Chim. Acta 2018, 1044, 119–130. [Google Scholar] [CrossRef] [PubMed]
- Ferri, D.; Gavina, P.; Costero, A.M.; Parra, M.; Vivancos, J.L.; Martínez-Mánez, R. Detection and discrimination of organophosphorus pesticides in water by using a colorimetric probe array. Sens. Actuators B 2014, 202, 727–731. [Google Scholar] [CrossRef]
- Wang, Y.; Li, Y.; Bao, X.; Han, J.; Xia, J.; Tian, X.; Ni, L. A smartphone-based colorimetric reader coupled with a remote server for rapid on-site catechols analysis. Talanta 2016, 160, 194–204. [Google Scholar] [CrossRef]
- Biesuz, R.; Nurchi, V.M.; Magnaghi, L.R.; Alberti, G. Inexpensive Alizarin Red S-based optical device for the simultaneous detection of Fe(III) and Al(III). Microchem. J. 2019, 149, 104036. [Google Scholar] [CrossRef]
- Alberti, G.; Zanoni, C.; Magnaghi, L.R.; Biesuz, R. Low-cost, disposable colorimetric sensors for metal ions detection. J. Anal. Sci. Technol. 2020, 11, 30. [Google Scholar] [CrossRef]
- Alberti, G.; Nurchi, V.M.; Magnaghi, L.R.; Biesuz, R. A portable, disposable, and low-cost optode for sulphide and thiol detection. Anal. Methods 2019, 11, 4464–4470. [Google Scholar] [CrossRef]
- Hamedi, M.M.; Ainla, A.; Güder, F.; Christodouleas, D.C.; Fernández-Abedul, M.T.; Whitesides, G.M. Integrating Electronics and Microfluidics on Paper. Adv. Mater. 2016, 28, 5054–5063. [Google Scholar] [CrossRef] [PubMed]
- Yang, Y.; Noviana, E.; Nguyen, M.P.; Geiss, B.J.; Dandy, D.S.; Henry, C.S. Paper-Based Microfluidic Devices: Emerging Themes and Applications. Anal. Chem. 2017, 89, 71–91. [Google Scholar] [CrossRef] [PubMed]
- Kim, J.H.; Mun, S.; Ko, H.U.; Yun, G.Y.; Kim, J. Disposable chemical sensors and biosensors made on cellulose paper. Nanotechnology 2014, 25, 092001. [Google Scholar] [CrossRef] [PubMed]
- Xu, M.; Bunes, B.R.; Zang, L. Paper-Based Vapor Detection of Hydrogen Peroxide: Colorimetric Sensing with Tunable Interface. Appl. Mater. Interfaces 2011, 3, 642–647. [Google Scholar] [CrossRef]
- Mentele, M.M.; Cunningham, J.; Koehler, K.; Volckens, J.; Henry, C.S. Microfluidic paper-based analytical device for particulate metals. Anal. Chem. 2012, 84, 4474–4480. [Google Scholar] [CrossRef]
- Carpenter, T.S.; Rosolina, S.M.; Xue, Z.L. Quantitative, colorimetric paper probe for hydrogen sulfide gas. Sens. Actuators B Chem. 2017, 253, 846–851. [Google Scholar] [CrossRef]
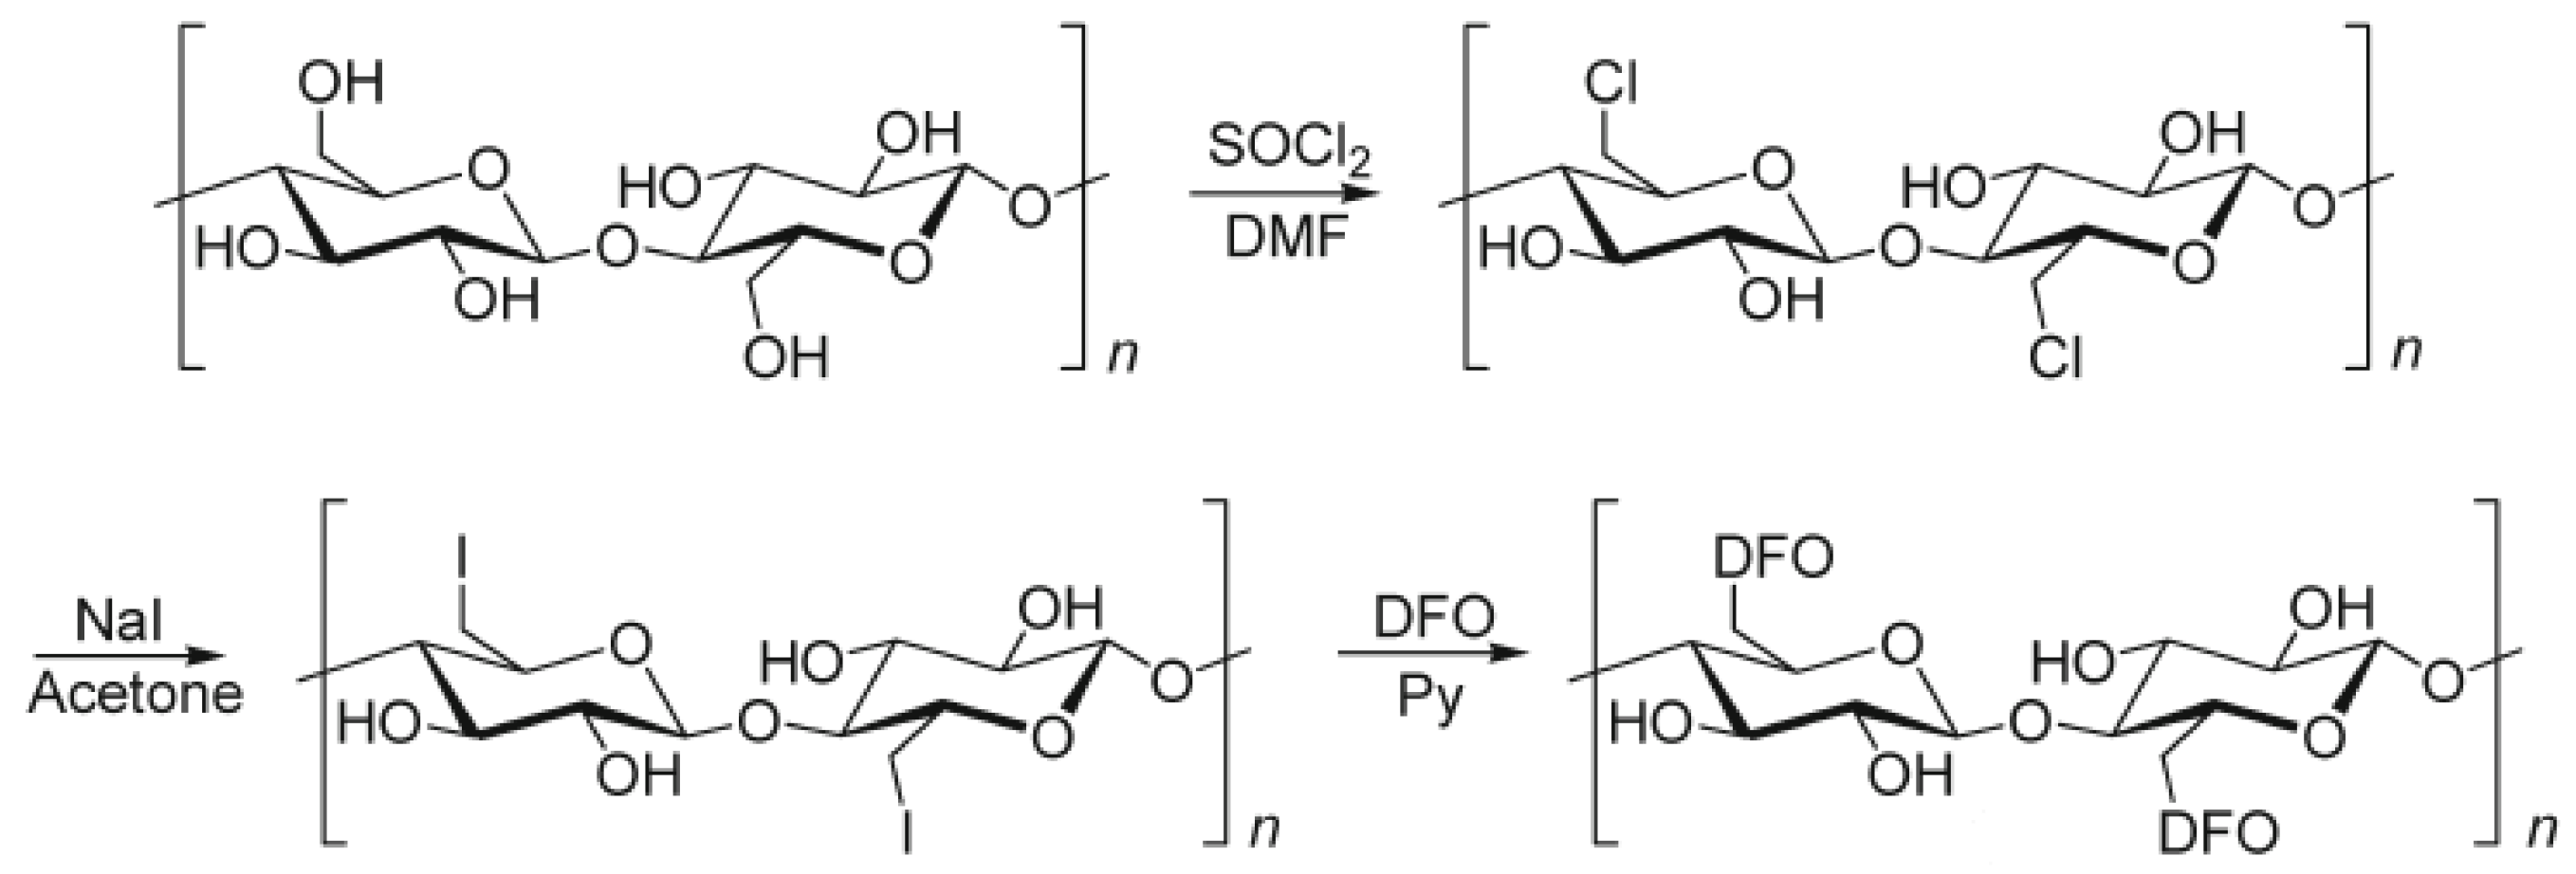
- Alberti, G.; Quattrini, F.; Colleoni, R.; Nurchi, V.M.; Biesuz, R. Deferoxamine–paper for iron(III) and vanadium(V) sensing. Chem. Pap. 2015, 69, 1024–1032. [Google Scholar] [CrossRef]
- Takagai, Y.; Yamaguchi, H.; Kubota, T.; Igarashi, S. Selective visual determination of vanadium(V) ion in highly acidic solution using desferrioxamine B immobilization cellulose. Chem. Lett. 2007, 36, 136–137. [Google Scholar] [CrossRef]
- Takagai, Y.; Takahashi, A.; Yamaguchi, H.; Kubota, T.; Igarashi, S. Adsorption behaviors of highvalence metal ions on desferrioxamine B immobilization nylon 6,6 chelate fiber under highly acidic conditions. J. Colloid Interface Sci. 2007, 313, 359–362. [Google Scholar] [CrossRef]
- Xu, L.Q.; Neoh, K.G.; Kang, E.T.; Fu, G.D. Rhodamine derivative-modified filter papers for colorimetric and fluorescent detection of Hg2+ in aqueous media. J. Mater. Chem. A 2013, 1, 2526–2532. [Google Scholar] [CrossRef]
- Sicard, C.; Glen, C.; Aubie, B.; Wallace, D.; Jahanshahi-Anbuhi, S.; Pennings, K.; Daigger, G.T.; Pelton, R.; Brennan, J.D.; Filipe, C.D.M. Tools for water quality monitoring and mapping using paper-based sensors and cell phones. Water Res. 2015, 70, 360–369. [Google Scholar] [CrossRef] [PubMed]
- Pávai, M.; Szabó, T.; Paszternák, A. The potential use of cellophane test strips for the quick determination of food colours. Cellulose 2015, 22, 1883–1891. [Google Scholar] [CrossRef][Green Version]
- Pávai, M.; Orosz, E.; Paszternák, A. Smartphone-Based Extension of the Curcumin/Cellophane pH Sensing Method. Food Anal. Methods 2016, 9, 1046–1052. [Google Scholar] [CrossRef][Green Version]
- Guo, W.; He, H.; Zhu, H.; Hou, X.; Chen, X.; Zhou, S.; Wang, S.; Huang, L.; Lin, J. Preparation and properties of a biomass cellulose-based colorimetric sensor for Ag+ and Cu2+. Ind. Crops Prod. 2019, 137, 410–418. [Google Scholar] [CrossRef]
- Golmohammadi, H.; Morales-Narváez, E.; Naghdi, T.; Merkoçi, A. Nanocellulose in Sensing and Biosensing. Chem. Mater. 2017, 29, 5426–5446. [Google Scholar] [CrossRef]
- Chauhan, P.; Hadad, C.; López, A.H.; Silvestrini, S.; La Parola, V.; Frison, E.; Maggini, M.; Prato, M.; Carofiglio, T. A nanocellulose–dye conjugate for multi-format optical pH-sensing. Chem. Commun. 2014, 50, 9493–9496. [Google Scholar] [CrossRef]
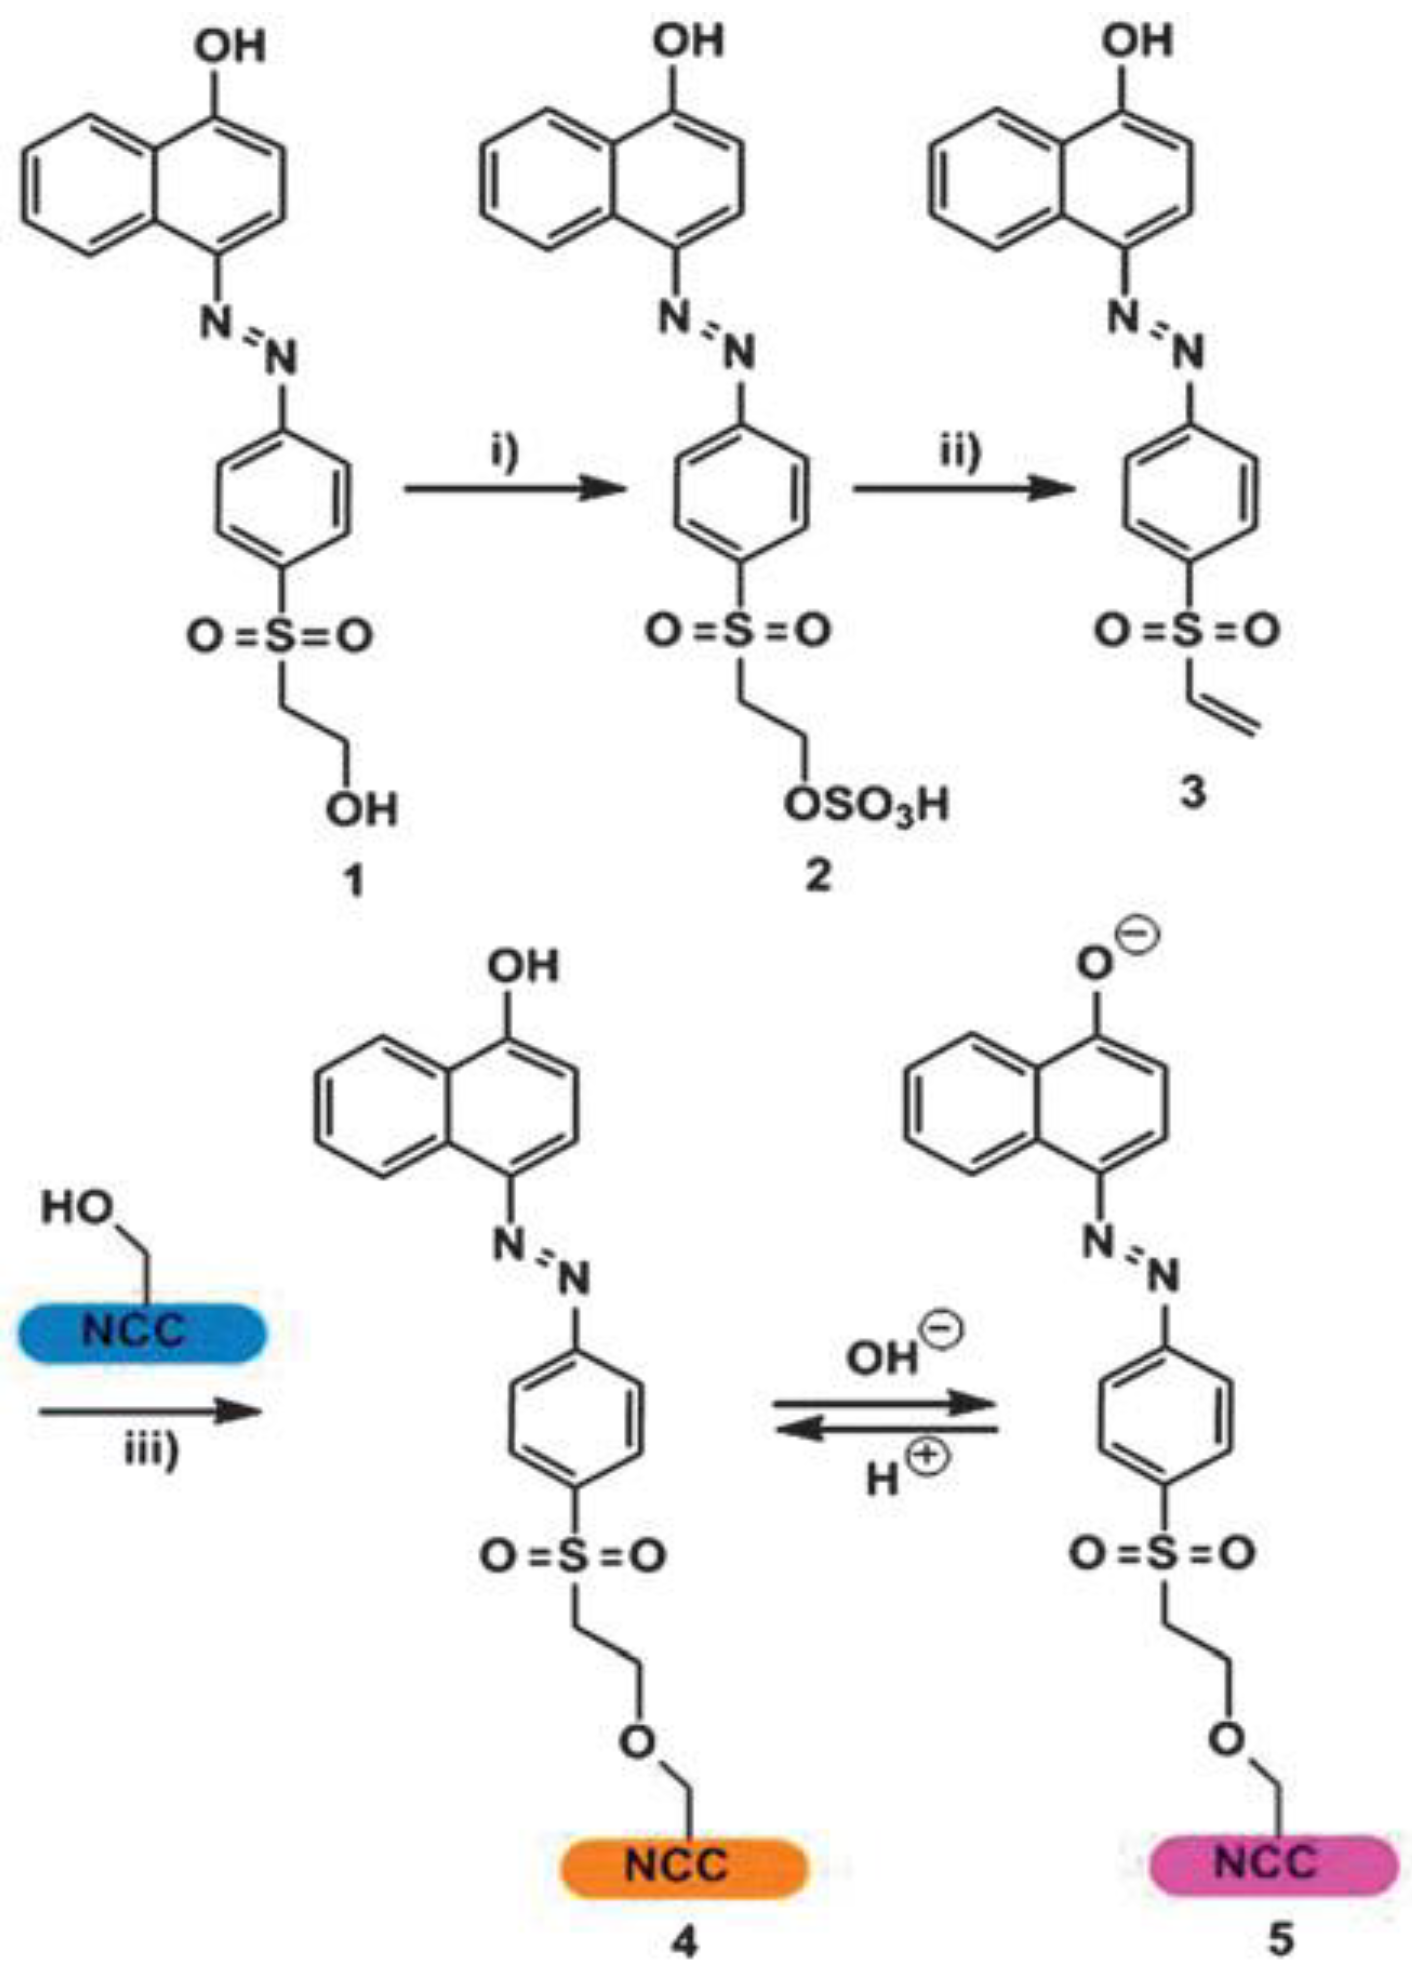
- Carofiglio, T.; Fregonese, C.; Mohr, G.J.; Rastrelli, F.; Tonellato, U. Optical sensor arrays: One-pot, multiparallel synthesis and cellulose immobilization of pH and metal ion sensitive azo-dyes. Tetrahedron 2006, 62, 1502–1507. [Google Scholar] [CrossRef]
- Ramlow, H.; Andrade, K.L.; Serafini Immich, A.P. Smart textiles: An overview of recent progress on chromic textiles. J. Text. Inst. 2020. [Google Scholar] [CrossRef]
- Lin, J.; Tan, Z.; Zhang, J.; Wang, L. Preparation and properties of Fe(II)-ionsensitive colour-changing fabric. Color. Technol. 2015, 131, 131–135. [Google Scholar] [CrossRef]
- Baysal, G.; Önder, S.; Göcek, İ.; Trabzon, L.; Kızıl, H.; Kök, F.N.; Kayaoğlu, B.K. Design and fabrication of a new non woven-textile based platform for biosensor construction. Sens. Actuators B Chem. 2015, 208, 475–484. [Google Scholar] [CrossRef]
- Owyeung, R.E.; Panzer, M.J.; Sonkusale, S.R. Colorimetric Gas Sensing Washable Threads for Smart Textiles. Sci. Rep. 2019, 9, 5607. [Google Scholar] [CrossRef] [PubMed]
- Wujcika, E.K.; Duirk, S.E.; Chasec, G.G.; Monty, C.N. A visible colorimetric sensor based on nanoporous polypropylene fiber membranes for the determination of trihalomethanes in treated drinking water. Sens. Actuators B Chem. 2016, 223, 1–8. [Google Scholar] [CrossRef]
- Moss, M.; Rylance, H. The Fujiwara Reaction: Some Observations on the Mechanism. Nature 1966, 210, 945–946. [Google Scholar] [CrossRef]
- Salcedo, A.R.M.; Sevilla, F.B., III. Colorimetric determination of mercury vapor using smartphone camera-based imaging. Instrum. Sci. Technol. 2018, 46, 450–462. [Google Scholar] [CrossRef]
- Deng, S.; Zhang, G.; Wang, P. Visualized fibrous adsorbent prepared by the microwave-assisted method for both detection and removal of heavy metal ions. ACS Sustain. Chem. Eng. 2018, 7, 1159–1168. [Google Scholar] [CrossRef]
- Azzouz, A.; Vikrant, K.; Kim, K.-H.; Ballesteros, E.; Rhadfi, T.; Malik, A.K. Advances in colorimetric and optical sensing for gaseous volatile organic compounds. TRAC Trend. Anal. Chem. 2019, 118, 502–516. [Google Scholar] [CrossRef]
- Wang, X.; Sun, X.; Hu, P.A.; Zhang, J.; Wang, L.; Feng, W.; Lei, S.; Yang, B.; Cao, W. Colorimetric sensor based on self-assembled polydiacetylene/graphene stacked composite film for vapor-phase volatile organic compounds. Adv. Funct. Mater. 2013, 23, 6044–6050. [Google Scholar] [CrossRef]
- Sarika, R.; Kavitha, K.; Shankaran, D.R. Preparation of Polyethyleneimine Functionalized Poly(methyl methacrylate) Nanofiber Membrane and Its Evaluation for Colorimetric Sensing of Formaldehyde. Sens. Lett. 2016, 14, 382–388. [Google Scholar] [CrossRef]
- Safavi, A.; Bagheri, M. A novel optical sensor for uranium determination. Anal. Chim. Acta 2005, 530, 55–60. [Google Scholar] [CrossRef]
- Tavallali, H.; Kazempourfard, F. Determination of Cadmium Ions by Designing an Optode Based on Immobilization of Dithizone on a Triacetylecelluose Membrane in Polluted Soil and Water Samples. J. Korean Chem. Soc. 2009, 53, 144–150. [Google Scholar] [CrossRef]
- Tavallali, H.; Vahdati, P.; Shaabanpur, E. Developing a new method of 4-(2-pyridylazo)-resorcinol immobilization on triacetylcellulose membrane for selective determination of Ga3+ in water samples. Sens. Actuators B Chem. 2011, 159, 154–158. [Google Scholar] [CrossRef]
- Tavallali, H.; Shaabanpur, E.; Vahdati, P. A highly selective optode for determination of Hg (II) by a modified immobilization of indigo carmine on a triacetylcellulose membrane. Spectrochim. Acta A 2012, 89, 216–221. [Google Scholar] [CrossRef] [PubMed]
- Tavallali, H.; Dorostghoal, L. Design and Evaluation of a Lead (II) Optical Sensor Based on Immobilization of Dithizone on Triacetylcellulose Membrane. Int. J. ChemTech Res. 2014, 6, 3179–3186. [Google Scholar]
- Danks, A.E.; Hall, S.R.; Schnepp, Z. The evolution of ‘sol–gel’ chemistry as a technique for materials synthesis. Mater. Horiz. 2016, 3, 91–112. [Google Scholar] [CrossRef]
- Li, Z.; Hao Li, H.; LaGasse, M.K.; Suslick, K.S. Rapid Quantification of Trimethylamine. Anal. Chem. 2016, 88, 5615–5620. [Google Scholar] [CrossRef]
- Idros, N.; Ho, M.Y.; Pivnenko, M.; Qasim, M.M.; Xu, H.; Gu, Z.; Chu, D. Colorimetric-Based Detection of TNT Explosives Using Functionalized Silica Nanoparticles. Sensors 2015, 15, 12891–12905. [Google Scholar] [CrossRef]
- Li, Z. Nanoporous Silica-Dye Microspheres for Enhanced Colorimetric Detection of Cyclohexanone. Chemosensors 2018, 6, 34. [Google Scholar] [CrossRef]
- Das, J.; Sarkar, P. A new dipstick colorimetric sensor for detection of arsenate in drinking water. Environ. Sci. Water Res. Technol. 2016, 2, 693–704. [Google Scholar] [CrossRef]
- Pipattanawarothai, A.; Trakulsujaritchok, T. Hybrid polymeric chemosensor bearing rhodamine derivative prepared by sol-gel technique for selective detection of Fe3+ ion. Dyes Pigm. 2020, 173, 107946. [Google Scholar] [CrossRef]


Publisher’s Note: MDPI stays neutral with regard to jurisdictional claims in published maps and institutional affiliations. |
© 2020 by the authors. Licensee MDPI, Basel, Switzerland. This article is an open access article distributed under the terms and conditions of the Creative Commons Attribution (CC BY) license (http://creativecommons.org/licenses/by/4.0/).
Share and Cite
Alberti, G.; Zanoni, C.; Magnaghi, L.R.; Biesuz, R. Disposable and Low-Cost Colorimetric Sensors for Environmental Analysis. Int. J. Environ. Res. Public Health 2020, 17, 8331. https://doi.org/10.3390/ijerph17228331
Alberti G, Zanoni C, Magnaghi LR, Biesuz R. Disposable and Low-Cost Colorimetric Sensors for Environmental Analysis. International Journal of Environmental Research and Public Health. 2020; 17(22):8331. https://doi.org/10.3390/ijerph17228331
Chicago/Turabian StyleAlberti, Giancarla, Camilla Zanoni, Lisa Rita Magnaghi, and Raffaela Biesuz. 2020. "Disposable and Low-Cost Colorimetric Sensors for Environmental Analysis" International Journal of Environmental Research and Public Health 17, no. 22: 8331. https://doi.org/10.3390/ijerph17228331
APA StyleAlberti, G., Zanoni, C., Magnaghi, L. R., & Biesuz, R. (2020). Disposable and Low-Cost Colorimetric Sensors for Environmental Analysis. International Journal of Environmental Research and Public Health, 17(22), 8331. https://doi.org/10.3390/ijerph17228331