Glucocorticoids in Freshwaters: Degradation by Solar Light and Environmental Toxicity of the Photoproducts

 , , ,
, , ,  ,
,  and
and 
Abstract
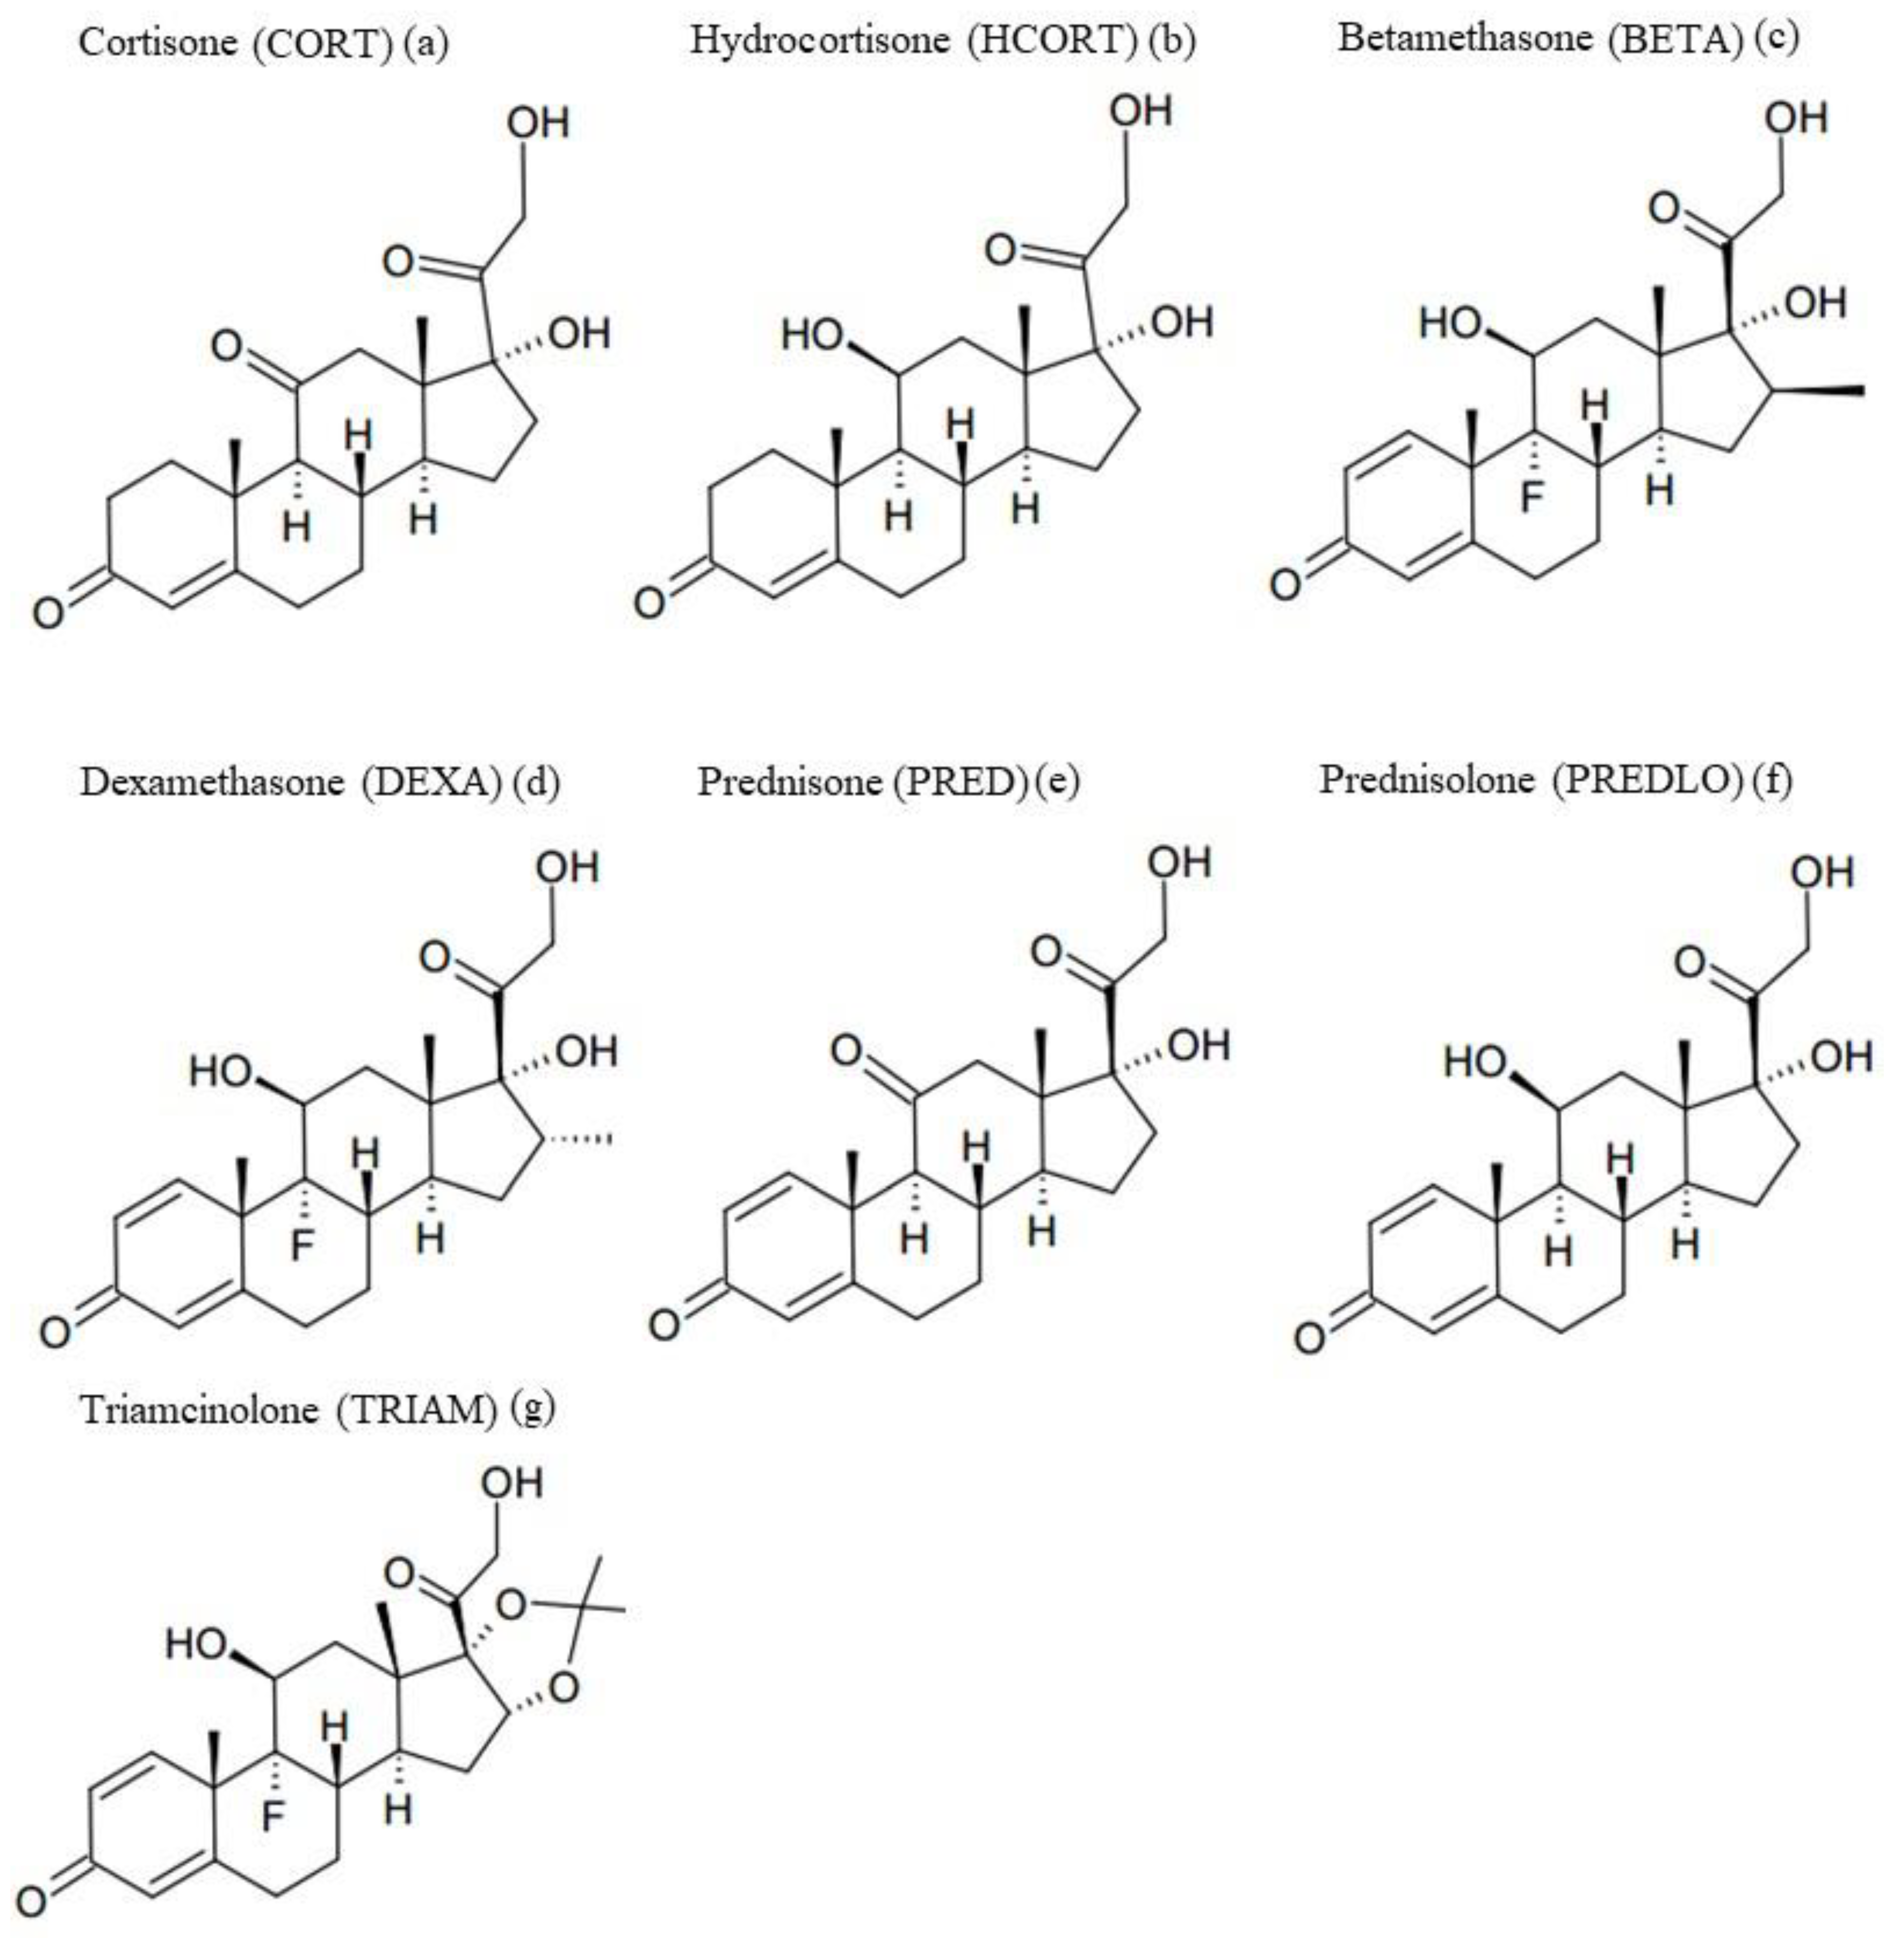
1. Introduction
2. Materials and Methods
2.1. Reagents and Materials
2.2. Irradiation Experiments
2.2.1. Kinetic Profiles at 50 µg L−1 Concentration
2.2.2. Kinetic Profiles at 10 mg L−1 Concentration and Identification of the Photoproducts
2.3. Analytical Determinations
2.3.1. Kinetic Profiles at 50 µg L−1 Concentration
2.3.2. Kinetic Profiles at 10 mg L−1 Concentration
2.3.3. Identification of the photoproducts
2.4. Toxicity Assays
2.4.1. Bioluminescence Inhibition Assay
2.4.2. Algal Growth Inhibition Assay
3. Results and Discussion
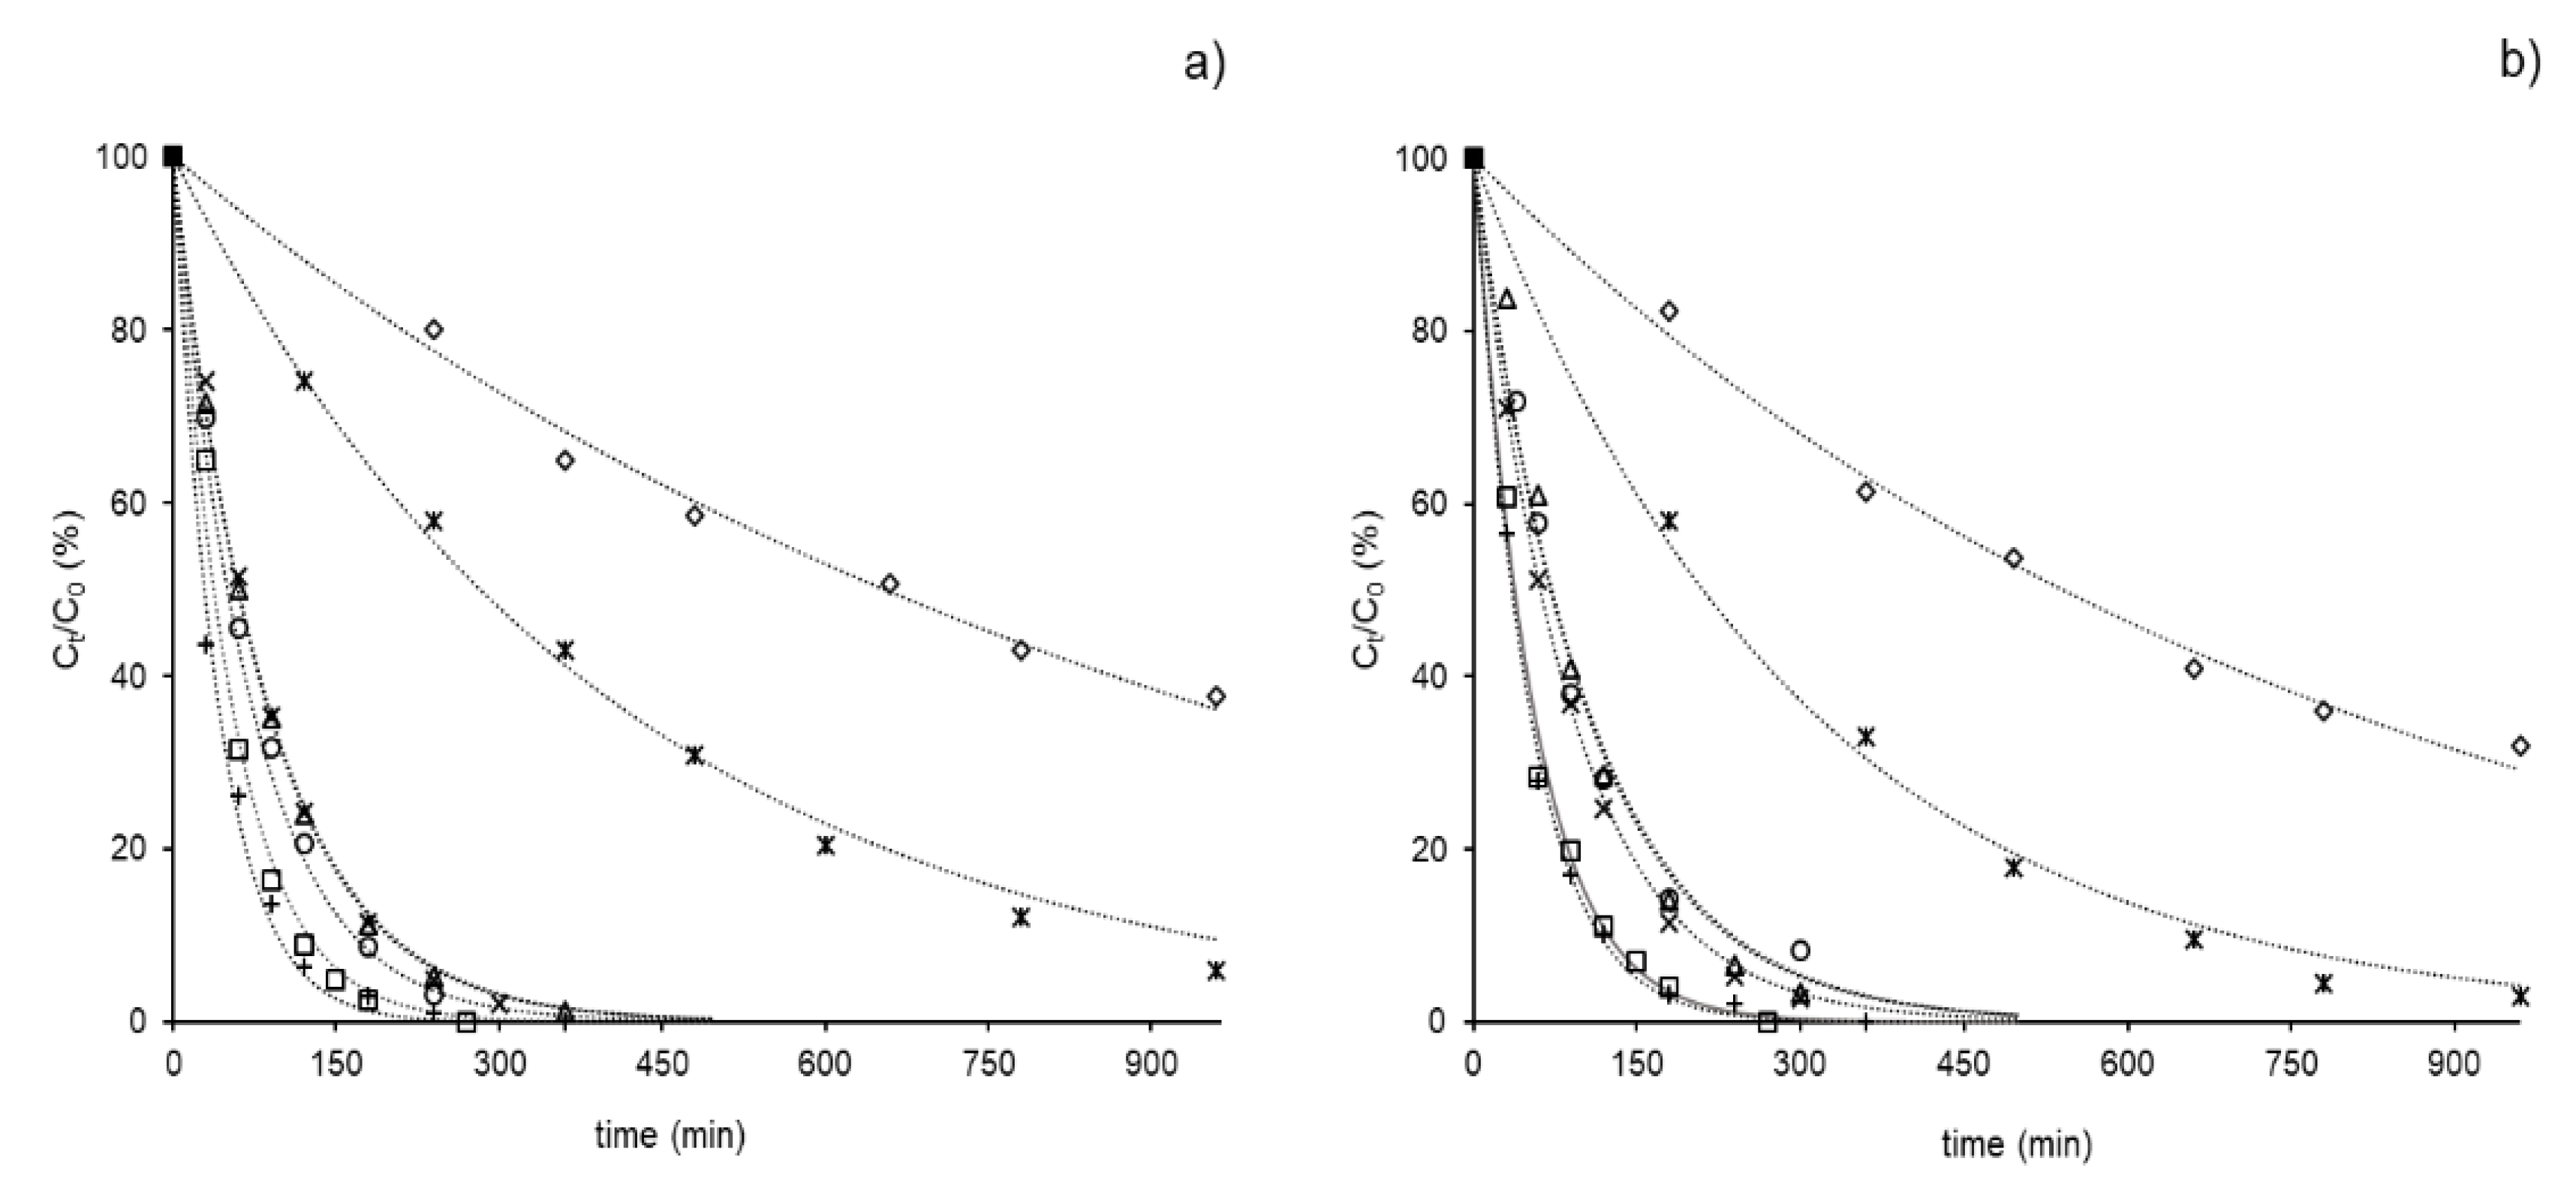
3.1. Photolysis of GCs in Environmental Samples
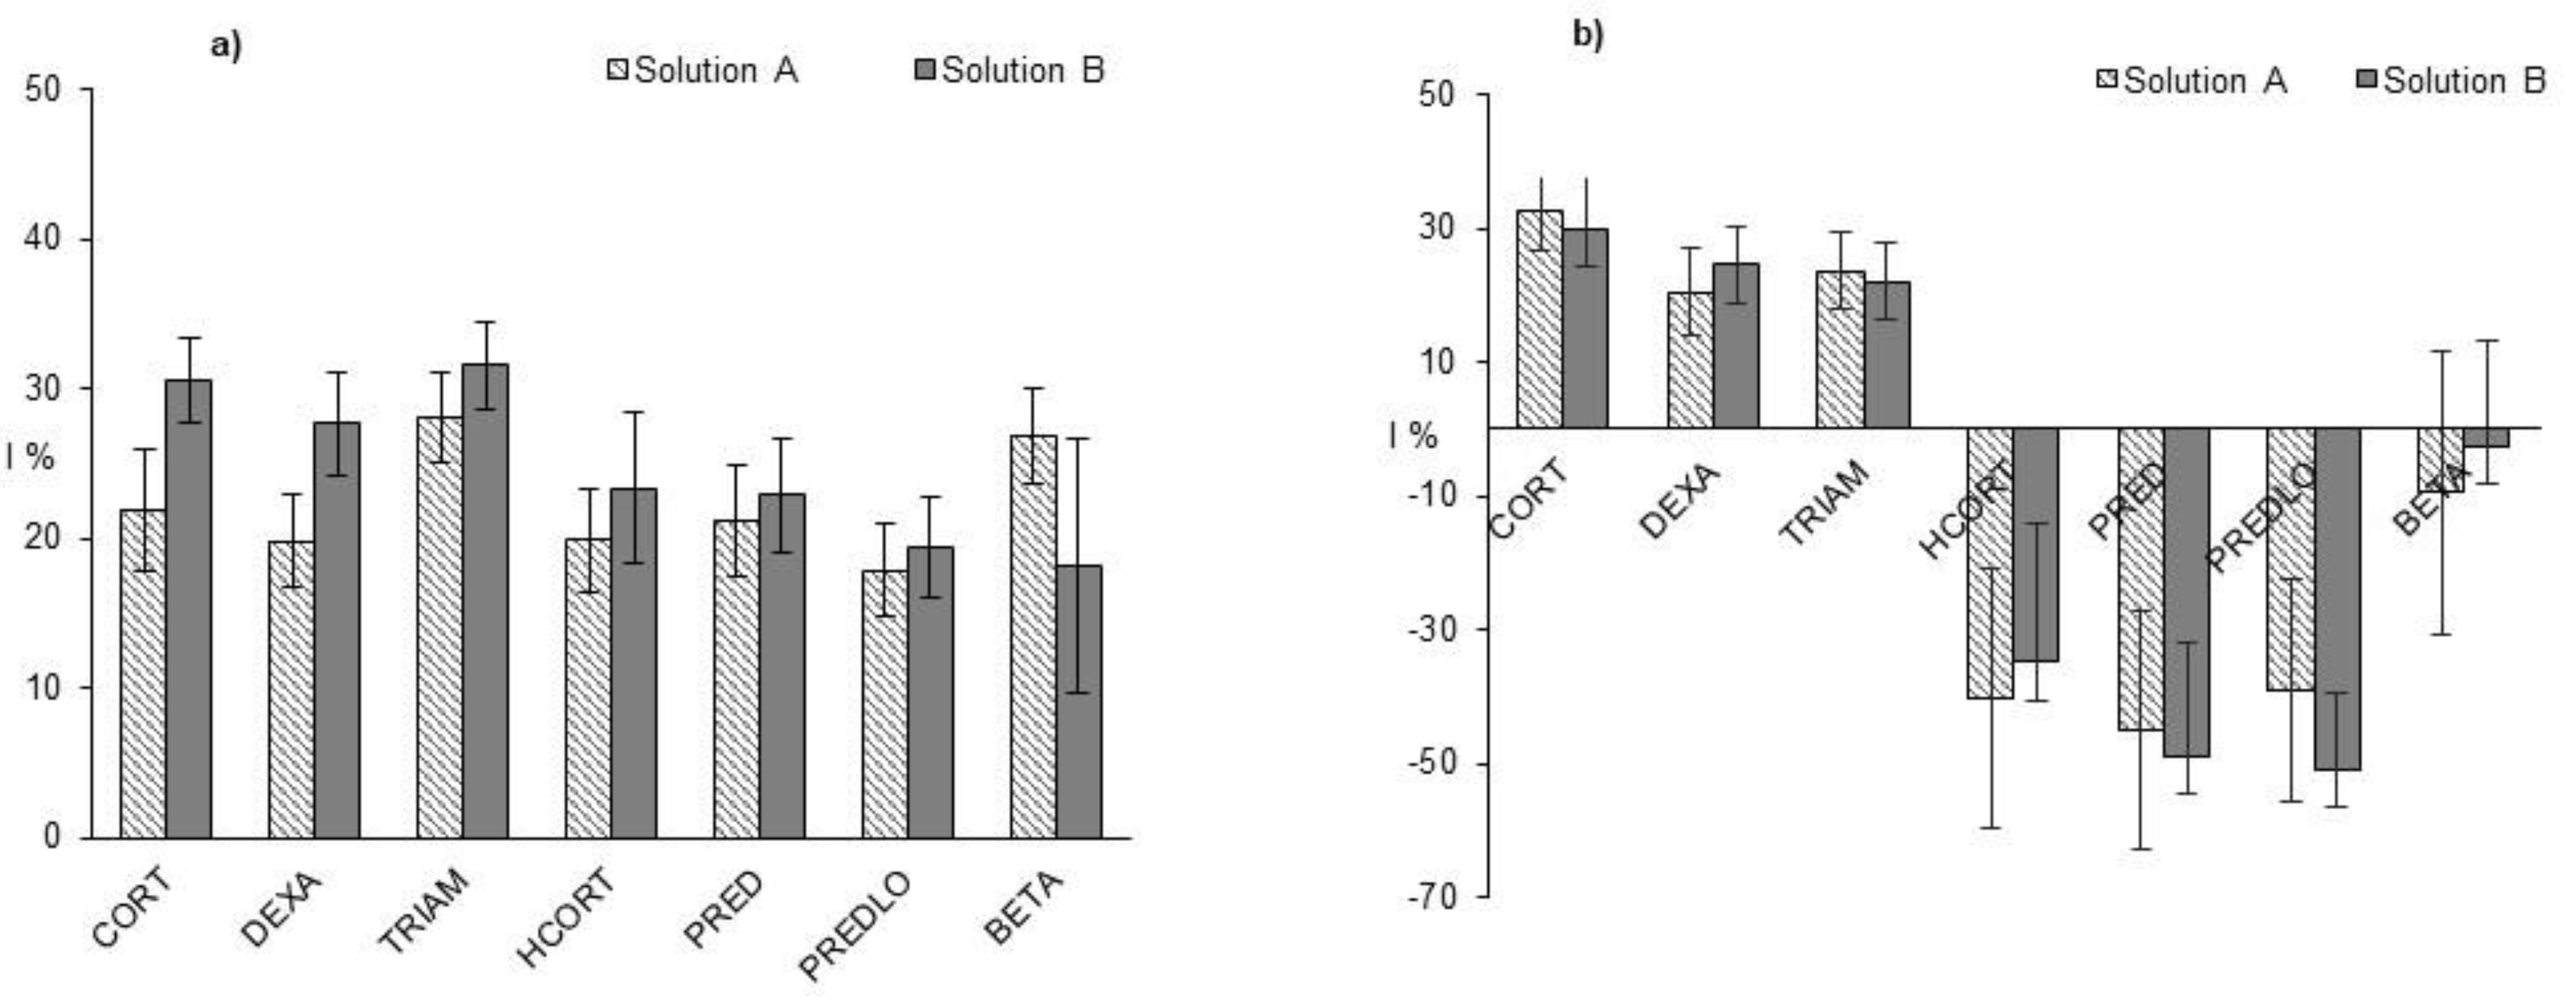
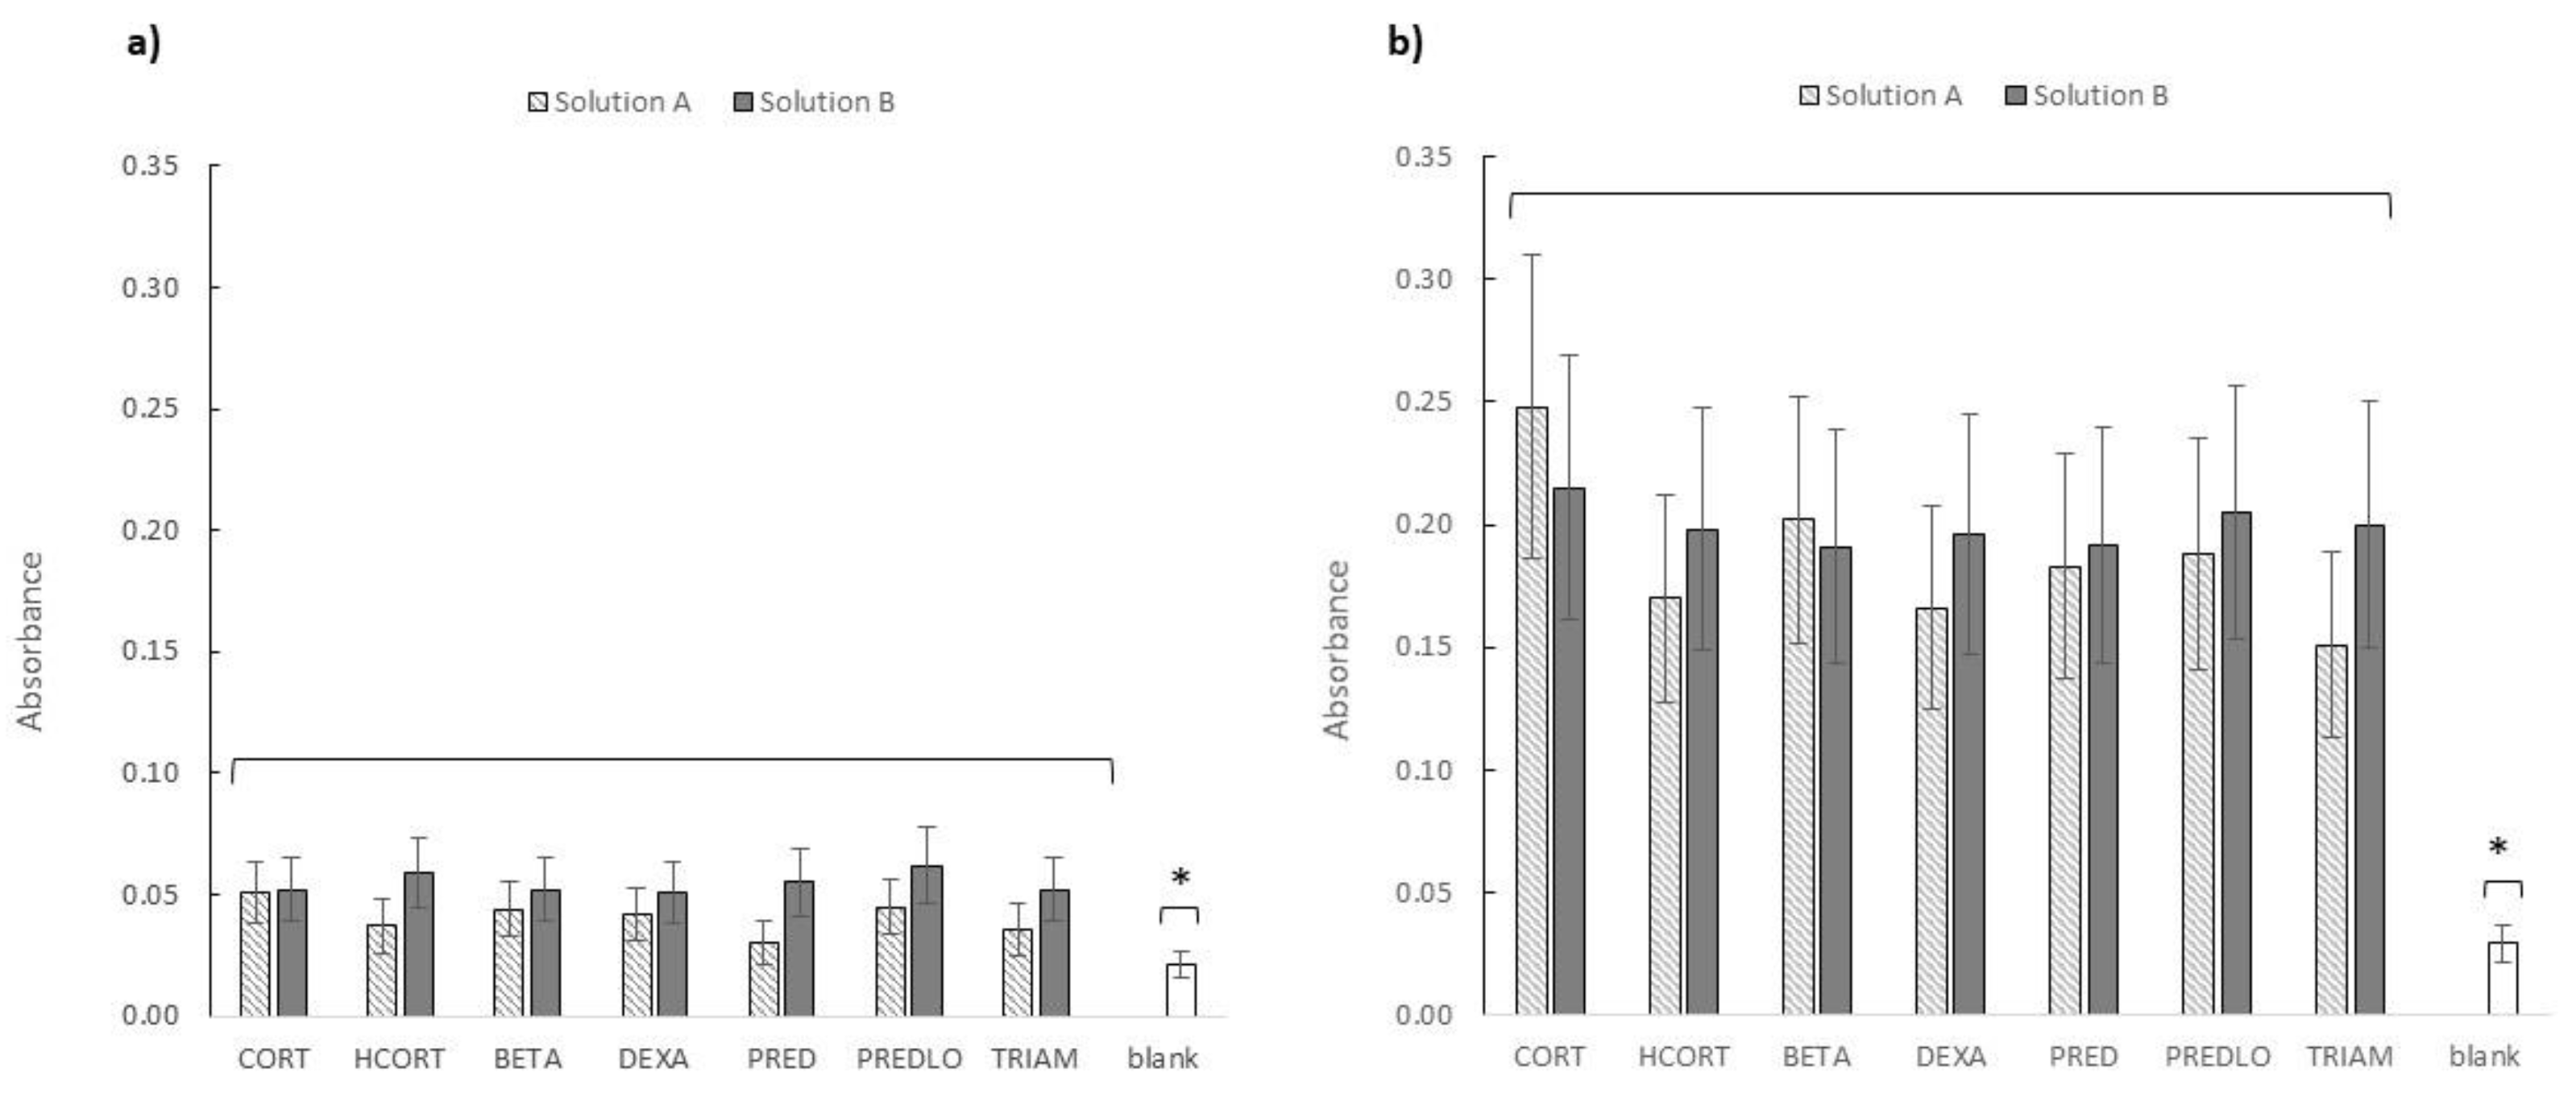
3.2. Ecotoxicity of GCs Photoproducts
4. Conclusions
Supplementary Materials
Author Contributions
Funding
Acknowledgments
Conflicts of Interest
References
- Corticosteroids-Glucocorticoid Effects (Veterinary—Systemic). The United States Pharmacopeial Convention. 2008. Available online: https://cdn.ymaws.com/www.aavpt.org/resource/resmgr/imported/corticosteroids2008.pdf (accessed on 20 March 2020).
- Oakley, R.H.; John, A.; Cidlowski, A. The biology of the glucocorticoid receptor: New signaling mechanisms in health and disease. J. Allergy Clin. Immunol. 2013, 132, 1033–1044. [Google Scholar] [CrossRef]
- Jia, A.; Wu, S.; Daniels, K.D.; Snyder, S.A. Balancing the budget: Accounting for glucocorticoid bioactivity and fate during water treatment. Environ. Sci. Technol. 2016, 50, 2870–2880. [Google Scholar] [CrossRef]
- Weizel, A.; Schlüsener, M.P.; Dierkes, G.; Wick, A.; Ternes, T.A. Analysis of the aerobic biodegradation of glucocorticoids: Elucidation of the kinetics and transformation reactions. Water Res. 2020, 174, 115561–115575. [Google Scholar] [CrossRef] [PubMed]
- Weizel, A.; Schlusener, M.P.; Dierkes, G.; Ternes, T.A. Occurrence of glucocorticoids, mineralocorticoids, and progestogens in various treated wastewater, rivers, and streams. Environ. Sci. Technol. 2018, 52, 5296–5307. [Google Scholar] [CrossRef] [PubMed]
- Daniels, K.D.; VanDervort, D.; Wu, S.; Leusch, F.D.L.; van de Merwe, J.P.; Jia, A.; Snyder, S.A. Downstream trends of in vitro bioassay responses in a wastewater effluent-dominated river. Chemosphere 2018, 212, 182–192. [Google Scholar] [CrossRef] [PubMed]
- Allijn, I.E.; Oldenkamp, R.; Storm, G.; Ragas, A.M.J.; Schiffelers, R.M. Environmental Impact of Switching from the Synthetic Glucocorticoid Prednisolone to the Natural Alkaloid Berberine. PLoS ONE 2018, 13, e0199095. Available online: https://research.utwente.nl/en/publications/environmental-impact-of-switching-from-the-synthetic-glucocortico (accessed on 14 November 2020). [CrossRef] [PubMed]
- Schriks, M.; Vanleerdam, J.A.; Van Derlinden, S.C.; Van Der Burg, B.; Van Wezel, A.P.; De Voogt, P. High-resolution mass spectrometric identification and quantification of glucocorticoid compounds in various wastewaters in the Netherlands. Environ. Sci. Technol. 2010, 44, 4766–4774. [Google Scholar] [CrossRef] [PubMed]
- Mehinto, A.C.; Jia, A.; Snyder, S.A.; Jayasinghe, S.B.; Denslow, N.D.; Crago, J.; Schlenk, D.; Menzie, C.; Westerheide, S.D.; Leusch, F.D.L.; et al. Interlaboratory comparison of in vitro bioassays for screening of endocrine active chemicals in recycled water. Water Res. 2015, 83, 303–309. [Google Scholar] [CrossRef] [PubMed]
- Wu, S.; Jia, A.; Daniels, K.D.; Park, M.; Snyder, S.A. Trace analysis of corticosteroids (CSs) in environmental waters by liquid chromatography–tandem mass spectrometry. Talanta 2019, 195, 830–840. [Google Scholar] [CrossRef] [PubMed]
- Chang, H.; Hu, J.; Shao, B. Occurrence of natural and synthetic glucocorticoids in sewage treatment plants and receiving river waters. Environ. Sci. Technol. 2007, 41, 3462–3468. [Google Scholar] [CrossRef]
- Gong, J.; Lin, C.; Xiong, X.; Chen, D.; Chen, Y.; Zhou, Y.; Wu, C.; Du, Y. Occurrence, distribution, and potential risks of environmental corticosteroids in surface waters from the Pearl River Delta, South China. Environ. Pollut. 2019, 251, 102–109. [Google Scholar] [CrossRef] [PubMed]
- Shen, X.; Chang, H.; Sun, Y.; Wan, Y. Determination and occurrence of natural and synthetic glucocorticoids in surface waters. Environ. Int. 2020, 134, 105278. [Google Scholar] [CrossRef] [PubMed]
- Leusch, F.D.L.; Neale, P.A.; Hebert, A.; Scheurer, M.; Schriks, M.C.M. Analysis of the sensitivity of in vitro bioassays for androgenic, progestagenic, glucocorticoid, thyroid and estrogenic activity: Suitability for drinking and environmental waters. Environ. Int. 2017, 99, 120–130. [Google Scholar] [CrossRef] [PubMed]
- Chen, Q.; Li, C.; Gong, Z.; Chun, Y.; Chan, E.; Snyder, S.A.; Hong Lam, S. Common deregulated gene expression profiles and morphological changes in developing zebrafish larvae exposed to environmental-relevant high to low concentrations of glucocorticoids. Chemosphere 2017, 172, 429–439. [Google Scholar] [CrossRef] [PubMed]
- Willi, R.A.; Faltermann, S.; Hettich, T.; Fent, K. Active glucocorticoids have a range of important adverse developmental and physiological effects on developing zebrafish embryos. Environ. Sci. Technol. 2018, 52, 877–885. [Google Scholar] [CrossRef]
- McNeil, P.L.; Nebot, C.; Sloman, K.A. Physiological and behavioral effects of exposure to environmentally relevant concentrations of prednisolone during zebrafish (Danio rerio) embryogenesis. Environ. Sci. Technol. 2016, 50, 5294–5304. [Google Scholar] [CrossRef]
- Xin, N.; Jiang, Y.; Liu, S.; Zhou, Y.; Cheng, Y. Effects of prednisolone on behavior and hypothalamic–pituitary–interrenal axis activity in zebrafish. Environ. Toxicol. Pharmacol. 2020, 75, 103325. [Google Scholar] [CrossRef]
- Willi, R.A.; Salgueiro-González, N.; Carcaiso, G.; Fent, K. Glucocorticoid mixtures of fluticasone propionate, triamcinolone acetonide and clobetasol propionate induce additive effects in zebrafish embryos. J. Hazard. Mater. 2019, 374, 101–109. [Google Scholar] [CrossRef]
- Fiorentino, A.; Ferro, G.; Castro Alferez, M.; Polo-López, M.I.; Fernández-Ibañez, P.; Rizzo, L. Inactivation and regrowth of multidrug resistant bacteria in urban wastewater after disinfection by solar-driven and chlorination processes. J. Photochem. Photobiol. B 2015, 148, 43–50. [Google Scholar] [CrossRef]
- Collivignarelli, M.C.; Abbà, A.; Benigna, I.; Sorlini, S.; Torretta, V. Overview of the main disinfection processes for wastewater and drinkingwater treatment plants. Sustainability 2018, 10, 86. [Google Scholar] [CrossRef]
- Della Greca, M.; Fiorentino, A.; Iesce, M.R.; Isidori, M.; Nardelli, A.; Previtera, L.; Temussi, F. Identification of phototransformation products of prednisone by sunlight: Toxicity of the drug and its derivatives on aquatic organisms. Environ. Toxicol. Chem. 2003, 22, 534–539. [Google Scholar] [CrossRef]
- Della Greca, M.; Fiorentino, A.; Isidori, M.; Lavorgna, M.; Previtera, L.; Rubino, M.; Temussi, F. Toxicity of prednisolone, dexamethasone and their photochemical derivatives on aquatic organisms. Chemosphere 2004, 54, 629–637. [Google Scholar] [CrossRef] [PubMed]
- Cacciari, R.D.; Reynoso, E.; Montejano, H.A.; Biasutti, M.A. Photodegradation of prednisolone under UVB solar irradiation. Role of photogenerated ROS in the degradation mechanism. Photochem. Photobiol. Sci. 2017, 16, 1717–1726. [Google Scholar] [CrossRef] [PubMed]
- ISO 11348-3:2007. Water Quality—Determination of the Inhibitory Effect of Water Samples on the Light Emission of Vibrio Fischeri (Luminescent Bacteria Test). Available online: https://www.iso.org/standard/40518.html (accessed on 20 March 2020).
- ISO 14442:2006. Water Quality—Guidelines for Algal Growth Inhibition Tests with Poorly Soluble Materials, Volatile Compounds, Metals, and Wastewater. Available online: https://www.iso.org/standard/34814.html (accessed on 20 March 2020).
- Sturini, M.; Speltini, A.; Maraschi, F.; Profumo, A.; Pretali, L.; Irastorza, E.A.; Fasani, E.; Albini, A. Photolytic and photocatalytic degradation of fluoroquinolones in untreated river water under natural sunlight. Appl. Catal. B Environ. 2012, 119, 32–39. [Google Scholar] [CrossRef]
- Sturini, M.; Speltini, A.; Maraschi, F.; Pretali, L.; Profumo, A.; Fasani, E.; Albini, A.; Migliavacca, R.; Nucleo, E. Photodegradation of fluoroquinolones in surface water and antimicrobial activity of the photoproducts. Water Res. 2012, 46, 5575–5582. [Google Scholar] [CrossRef]
- Sturini, M.; Speltini, A.; Maraschi, F.; Pretali, L.; Ferri, E.N.; Profumo, A. Sunlight-induced degradation of fluoroquinolones in wastewater effluent: Photoproducts identification and toxicity. Chemosphere 2015, 134, 313–318. [Google Scholar] [CrossRef]
- Pretali, L.; Maraschi, F.; Cantalupi, A.; Albini, A.; Sturini, M. Water depollution and photo-detoxification by means of TiO2: Fluoroquinolone antibiotics as a case study. Catalysts 2020, 10, 628. [Google Scholar] [CrossRef]
- Ricci, A.; Fasani, E.; Mella, M.; Albini, A. Noncommunicating photoreaction paths in some pregna-1,4-diene-3,20-diones. J. Org. Chem. 2001, 66, 8086–8093. [Google Scholar] [CrossRef]
- Sturini, M.; Speltini, A.; Maraschi, F.; Profumo, A.; Pretali, L.; Fasani, E.; Albini, A. Photochemical degradation of marbofloxacin and enrofloxacin in natural waters. Environ. Sci. Technol. 2010, 44, 4564–4569. [Google Scholar] [CrossRef]
- Vione, D.; Koehler, B. Modelled phototransformation kinetics of the antibiotic sulfadiazine in organic matter-rich lakes. Sci. Total Environ. 2018, 645, 1465–1473. [Google Scholar] [CrossRef]
- Calza, P.; Pelizzetti, E.; Brussino, M.; Baiocchi, C. Ion trap tandem mass spectrometry study of dexamethasone transformation products on light activated TiO2 surface. J. Am. Soc. Mass Spectr. 2001, 12, 1286–1295. [Google Scholar] [CrossRef]
- Caffieri, S.; Dall’Acqua, S.; Castagliuolo, I.; Brun, P.; Miolo, G. UVB photolysis of hydrocortisone 21-acetate. J. Pharmaceut. Biomed. 2008, 47, 771–777. [Google Scholar] [CrossRef] [PubMed]
- Miolo, G.; Gallocchio, F.; Levorato, L.; Dalzoppo, D.; Beyersbergen van Henegouwen, G.M.J.; Caffieri, S. UVB photolysis of betamethasone and its esters: Characterization of photoproducts in solution, in pig skin and in drug formulations. J. Photochem. Photobiol. B 2009, 96, 75–81. [Google Scholar] [CrossRef] [PubMed]
- Ricci, A.; Fasani, E.; Mella, M.; Albini, A. General Patterns in the Photochemistry of Pregna-1,4-dien-3,20-diones. J. Org. Chem. 2003, 68, 4361–4366. [Google Scholar] [CrossRef]
- Ricci, A.; Fasani, E.; Mella, M.; Albini, A. Photochemistry of some steroidal bicyclo[3.1.0]hexenones. Tetrahedron 2004, 60, 115–120. [Google Scholar] [CrossRef]
- Williams, J.R.; Moore, R.H.; Li, R.; Weeks, C.M. Photochemistry of 11. alpha.-and 11. beta.-hydroxy steroidal 1, 4-dien-3-ones and 11. alpha.-and 11. beta.-hydroxy steroidal bicyclo [3.1. 0] hex-3-en-2-ones in neutral and acidic media. J. Org. Chem. 1980, 45, 2324–2331. [Google Scholar] [CrossRef]
- Milstein, D.; Stille, J.K. Palladium-catalyzed coupling of tetraorganotin compounds with aryl and benzyl halides. Synthetic utility and mechanism. J. Am. Chem. Soc. 1979, 101, 4992–4998. [Google Scholar] [CrossRef]
- Girotti, S.; Ferri, E.N.; Fumo, M.G.; Maiolini, E. Monitoring of environmental pollutants by bioluminescent bacteria. Anal. Chim. Acta 2008, 608, 2–29. [Google Scholar] [CrossRef]
- Guengerich, F.P. Mechanisms of drug toxicity and relevance to pharmaceutical development. Drug Metab. Pharmacokinet. 2011, 26, 3–14. [Google Scholar] [CrossRef]
- Guo, Z.; Guo, A.; Guo, Q.; Rui, M.; Zhao, Y.; Zhang, H.; Zhu, S. Decomposition of Dexamethasone by gamma irradiation: Kinetics, degradation mechanisms and impact on algae growth. Chem. Eng. J. 2016, 307, 722–728. [Google Scholar] [CrossRef]


| Parameters/Ions | Tap Water | River Water | |
|---|---|---|---|
| pH | 7.7 | 7.9 | |
| Conductivity at 20 °C | μS cm−1 | 271 | 293 |
| Total organic carbon (TOC) | mg L−1 | 4.2 | 7.0 |
| Cl− | mg L−1 | 5.0 | 4.0 |
| NO3− | mg L−1 | 0.6 | 1.6 |
| SO42− | mg L−1 | 5.0 | 13 |
| HCO3− | mg L−1 | 182 | 209 |
| Ca2+ | mg L−1 | 35 | 54 |
| Mg2+ | mg L−1 | 10 | 7.8 |
| Na+ | mg L−1 | 12 | 5.4 |
| Compound | 10 mg L−1 | 50 µg L−1 | 50 µg L−1 |
|---|---|---|---|
| kdeg (min−1), Tap Water | kdeg (min−1), Tap Water | kdeg (min−1), River Water | |
| CORT | 0.00082 (8) | 0.00106 (5) | 0.00128 (3) |
| HCORT | 0.00110 (7) | 0.00246 (9) | 0.0033 (2) |
| BETA | 0.0133 (3) | 0.0115 (6) | 0.0114 (1) |
| DEXA | 0.0139 (5) | 0.0117 (1) | 0.0097 (6) |
| PRED | 0.024 (1) | 0.0185 (9) | 0.0186 (6) |
| PREDLO | 0.0181 (4) | 0.024 (1) | 0.0199 (4) |
| TRIAM | 0.0130 (5) | 0.0139 (3) | 0.0099 (4) |
| Compound | Irradiation Time (min) | Conversion (%) | Parent Compound Residue (mg L−1) |
|---|---|---|---|
| CORT | 1320 | 73 | 2.7 |
| HCORT | 1320 | 77 | 2.3 |
| BETA | 90 | 67 | 3.2 |
| DEXA | 90 | 69 | 3.1 |
| PRED | 120 | 93 | 0.7 |
| PREDLO | 30 | 41 | 5.9 |
| TRIAM | 60 | 62 | 3.8 |
Publisher’s Note: MDPI stays neutral with regard to jurisdictional claims in published maps and institutional affiliations. |
© 2020 by the authors. Licensee MDPI, Basel, Switzerland. This article is an open access article distributed under the terms and conditions of the Creative Commons Attribution (CC BY) license (http://creativecommons.org/licenses/by/4.0/).
Share and Cite
Cantalupi, A.; Maraschi, F.; Pretali, L.; Albini, A.; Nicolis, S.; Ferri, E.N.; Profumo, A.; Speltini, A.; Sturini, M. Glucocorticoids in Freshwaters: Degradation by Solar Light and Environmental Toxicity of the Photoproducts. Int. J. Environ. Res. Public Health 2020, 17, 8717. https://doi.org/10.3390/ijerph17238717
Cantalupi A, Maraschi F, Pretali L, Albini A, Nicolis S, Ferri EN, Profumo A, Speltini A, Sturini M. Glucocorticoids in Freshwaters: Degradation by Solar Light and Environmental Toxicity of the Photoproducts. International Journal of Environmental Research and Public Health. 2020; 17(23):8717. https://doi.org/10.3390/ijerph17238717
Chicago/Turabian StyleCantalupi, Alice, Federica Maraschi, Luca Pretali, Angelo Albini, Stefania Nicolis, Elida Nora Ferri, Antonella Profumo, Andrea Speltini, and Michela Sturini. 2020. "Glucocorticoids in Freshwaters: Degradation by Solar Light and Environmental Toxicity of the Photoproducts" International Journal of Environmental Research and Public Health 17, no. 23: 8717. https://doi.org/10.3390/ijerph17238717
APA StyleCantalupi, A., Maraschi, F., Pretali, L., Albini, A., Nicolis, S., Ferri, E. N., Profumo, A., Speltini, A., & Sturini, M. (2020). Glucocorticoids in Freshwaters: Degradation by Solar Light and Environmental Toxicity of the Photoproducts. International Journal of Environmental Research and Public Health, 17(23), 8717. https://doi.org/10.3390/ijerph17238717