Abstract
Background: Assessing the use of multiple medications in cancer patients is crucial as such use may affect cancer outcomes. This study reports the prevalence of non-cancer medication use at breast cancer diagnosis, its associated factors, and its effect on survival. Methods: We identified all women diagnosed with primary invasive breast cancer between 1 January 2007 and 31 December 2016, from four population-based breast cancer registries, in Auckland, Waikato, Wellington, and Christchurch, New Zealand. Through linkage to the pharmaceutical records, we obtained information on non-cancer medications that were dispensed for a minimum of 90 days’ supply between one year before cancer diagnosis and first cancer treatment. We performed ordered logistic regressions to identify associated factors and Cox regressions to investigate its effect on patient survival. Results: Of 14,485 patients, 52% were dispensed at least one drug (mean—1.3 drugs; maximum—13 drugs), with a higher prevalence observed in patients who were older, treated at a public facility, more economically deprived, and screen-detected. The use of 2–3 drugs showed a reduced non-breast cancer mortality (HR = 0.75, 95%CI = 0.60–0.92) in previously hospitalised patients, with other groups showing non-significant associations when adjusted for confounding factors. Drug use was not associated with changes in breast cancer-specific mortality. Conclusions: Non-cancer medication use at breast cancer diagnosis was common in New Zealand, more prevalent in older and disadvantaged women, and showed no effect on breast cancer-specific mortality, but a reduction in other cause mortality with the use of 2–3 drugs.
1. Introduction
Breast cancer is the most common cancer in women in New Zealand, with 3286 new cases in 2017 and an age-standardised rate of 94 women per 100,000 population [1]. Patient survival has improved with advances in cancer care so that five-year survival is now 80% or higher [2]. Prolonged survival, together with population ageing and less healthy lifestyles, poses a risk for multi-morbidities [3] and therefore polypharmacy [4].
The use of multiple medications taken concurrently, defined as polypharmacy [5], is often prevalent in cancer patients [6]. In a study of advanced cancer patients across 11 European countries, patients were medicated with as many as 20 drugs, with a mean of 7.8 drugs, and more than a quarter of total patients used 10 or more drugs [7]. Unnecessary medication use is also common in cancer patients. Previous research reported that 22% to 45% of advanced cancer patients were prescribed at least one unnecessary medication [7,8,9], which poses a risk of adverse events, increased costs, and impacting the wellbeing of cancer patients [6].
Thus, assessing the use of non-cancer medications in cancer patients is important in various aspects. Using prospectively collected population-based data, we explored the prevalence of non-cancer medication use in New Zealand women at diagnosis of primary invasive breast cancer, identified associated factors, and assessed their effect on survival.
2. Materials and Methods
2.1. Data Sources
The data were obtained from four regional breast cancer registries: Auckland, Waikato, Wellington, and Christchurch. The registry data were linked to three routinely collected national data sources using unique National Health Index (NHI) numbers. These were the Pharmaceutical Collection (PHARMS), which contains dispensing information and medication identifiers from pharmacists for subsidised dispensing [10]; the National Minimum Dataset (NMDS), which contains information on all day-patients and inpatients discharged from both public and private hospitals [11]; and the Mortality Collection, which contains information about all deaths recorded in New Zealand [12].
2.2. Patient Data
The study sample comprised all women who were newly diagnosed with primary invasive breast cancer (stage I–IV) between 01 January 2007 and 31 December 2016 (n = 14,979). Patients who did not have a record of any first cancer treatment within 1 year after cancer diagnosis (n = 494) were excluded, which was mainly contributed by advanced stage (anatomic stage IV) patients. Our final dataset for analysis included 14,485 patients.
2.2.1. Non-Cancer Medication Use
Non-cancer medication use was defined as having a dispensing record of one or more drugs (except oncology agents and dermatologicals) supplied for at least 90 days at a time in a period between one year before the date of cancer diagnosis and the date of first cancer treatment (i.e., surgery, chemotherapy, hormonal therapy, or biotherapy). This information was extracted from the PHARMS records.
2.2.2. Mortality Outcomes
Patients were followed from one year after their date of cancer diagnosis until death or last follow-up. To avoid immortal time bias, patient follow-up started from one year after cancer diagnosis, thereby ensuring that any “immortal time” between cancer diagnosis and first cancer treatment was not misclassified [13,14,15]. Information on deaths from breast cancer and other causes during follow-up was extracted from the regional breast cancer registries and the Mortality Collection.
2.2.3. Other Variables of Interest
Information on patient demographics such as age, ethnicity, health domicile code, and facility (private or public); diagnosis and treatment-related information such as tumour histology, anatomic stage, grade, oestrogen receptor (ER), progesterone receptor (PR), and HER2 status, whether the cancer was screen-detected, types of cancer treatment, and treatment date was extracted from the regional breast cancer registers.
The health domicile codes represent patients’ usual residential address and were mapped onto the 2013 New Zealand Deprivation Index (NZDep) with decile ten the most deprived and decile one the least [16]. Staging was based on the anatomic extent of the disease, histologic grade, and biological subtype according to ER, PR, and HER2 status, defined by the American Cancer Society [17].
Information on previous hospitalisations in the period between five years before and five years after breast cancer diagnosis was extracted from the NMDS. Previous hospitalisations indicate the presence of serious comorbidities that require hospital admission.
2.3. Data Analysis
Use of non-cancer medications was conceptualised as the number of drugs used by individual patients, grouped into no drug, one drug, two or three drugs, and four or more drugs, and its prevalence was categorised by patients’ demographic, diagnosis, and treatment-related factors. Single and multi-variable ordered logistic regression models were used to identify the demographic factors associated with non-cancer medication use.
To examine the effect of non-cancer medication use on survival, the Kaplan–Meier analyses and log-rank tests were performed to assess differences in mortality from breast cancer-specific causes and mortality from other and unknown causes across the four categories of non-cancer medication use.
Cox regression analyses were then conducted to explore the effect of medication use on survival in terms of breast cancer and other or unknown causes. The multi-variable models were tested for the proportional hazards (PH) assumption by using Schoenfeld residuals. To comply with the PH assumptions, the Cox regression analyses were performed separately based on the presence of previous hospitalisation history (which indicates presence of severe comorbidities) and were further stratified by variables that violated the PH assumption, which were ER, PR, HER2 status, grade, anatomical stage, and histology. Patient demographics, diagnosis, and treatment-related factors were then included in the models.
The data analyses were conducted using Stata version 16. A two-sided p-value of <0.05 was regarded as statistically significant in this study.
2.4. Ethics Approval
This study was approved by the Central Health and Disability Ethics Committee (Ref: 19/CEN/4).
3. Results
A total of 14,485 women were included in this analysis. Table 1 presents the demographic and clinical characteristics of the study sample.

Table 1.
Patient characteristics shown in subgroups.
3.1. Prevalence of Non-Cancer Medication Use
Around 52% of patients used at least one non-cancer medication for a minimum of 90 days between one year before the date of cancer diagnosis and the date of first cancer treatment (Figure 1). The number of medications used ranged from one drug to 13 different drugs (Figure 1), with a mean of 1.3 drugs. The drug categories most commonly dispensed were those of the agents affecting the renin-angiotensin system (n = 2911, 15.4%), followed by the lipid modifying agents (n = 2543, 13.4%) and anti-ulcerants (n = 1971, 10.4%) (Figure 2). The top three drugs dispensed in each of the 15 most common drug categories are shown in Table 2. A detailed report on the number of medications regarding the subgroups of patients is presented in Table 3.
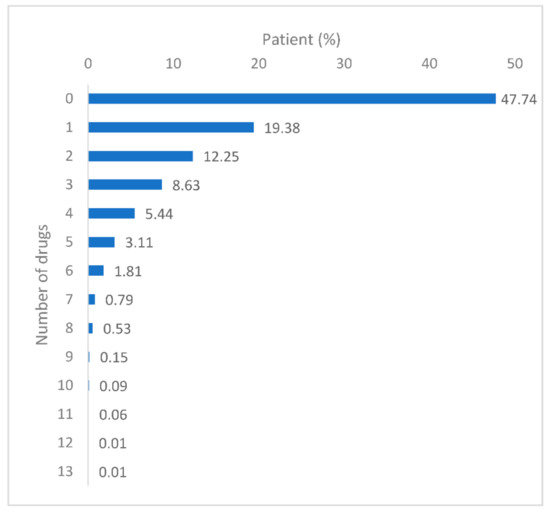
Figure 1.
Patient proportions for the number of drugs used.
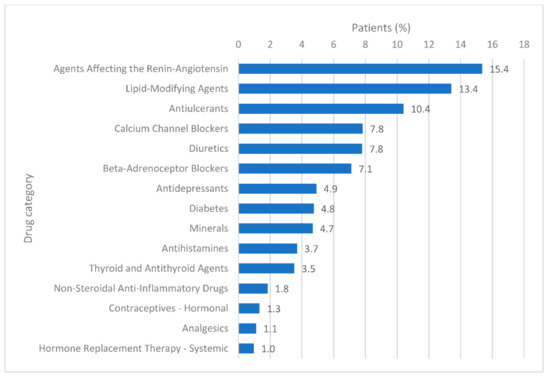
Figure 2.
Patient proportions for each drug category, showing the 15 most common categories of a total of 57 categories.
Table 2.
Three most common drugs dispensed in each drug category, showing the 15 most common categories of a total of 57 categories.
Table 3.
Prevalence of medication use and associated demographic factors.
3.2. Factors Associated with Amount of Medication Use
The single factor ordered logistic regression showed that the use of a larger number of drugs was significantly associated with older age, European ethnicity, a public facility where first cancer treatment was received, a higher deprivation score, the Christchurch and Waikato regions, and screen-detected cancer in comparison to their respective counterparts (Table 3). The associations remained significant in the multi-variable analysis except for ethnicity.
3.3. Effects of Medication Use on Survival
Of the 14,485 women included in this analysis, 813 had been followed for less than one year and were therefore excluded from the survival analysis. During a median follow-up of 4.6 years, 1048 died from breast cancer and 875 from other causes.
The Kaplan–Meier graphs (Figure 3) show significant differences in breast cancer-specific mortality across the different groups of medication use (p = 0.0001) in patients with a history of previous hospitalisations, an indicator of the presence of severe comorbidities. Mortality from other and unknown causes differed significantly across the different groups of medication use regardless of the history of previous hospitalisations.
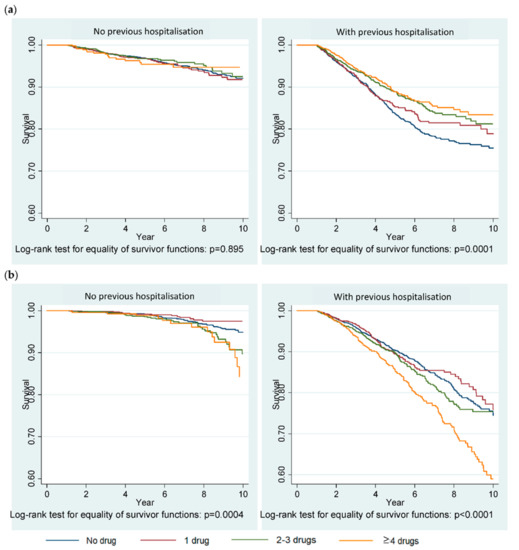
Figure 3.
Kaplan–Meier survival graphs showing (a) mortality from breast cancer-specific causes and (b) mortality from other and unknown causes. Previous hospitalisation indicates presence of a severe comorbidity(-ies) that requires hospitalisation.
Table 4 reports the results of Cox regression analyses that examined the association between medication use and survival of patients. The single factor analyses (crude effects) support the findings of Kaplan–Meier analysis. In the adjusted models, however, medication use was not associated with mortality from breast cancer in patients with or without previous hospitalisations. Mortality from other and unknown causes, however, significantly decreased with the use of 2–3 drugs (HR = 0.76, 95%CI 0.61–0.94) compared to the “no drugs” group in women with a history of previous hospitalisations.
Table 4.
Cox regression survival analysis showing the effects of medication use on mortality from breast cancer-specific causes and other and unknown causes.
4. Discussion
Our research, to the best of our knowledge, is the first to study the use of medications at the diagnosis of primary invasive breast cancer in New Zealand women. We found that more than half (52%) of the patient population used one or more non-cancer medications, with an average of 1.3 drugs, for at least 90 days within our specified timeframe, exemplifying the frequent use of medications around breast cancer diagnosis. The average number of medications reported in other studies varied widely: 5 to 6.8 depending on age in breast cancer patients [18]; 7.8 in all advanced cancer patients [7]; and as many as 15 in hospice patients, of which one-third had cancer [19]. Due to the varied study population and inclusion criteria of medications, it is complex to compare the results to different studies. Nonetheless, the relatively lower average number of medications in our study was likely because we excluded those dispensed temporarily as well as measuring the use of non-cancer medications up to first breast cancer treatment only.
The number of medications at cancer diagnosis was significantly higher in elderly patients, especially those over 70 years in our study. A previous study of polypharmacy comparing <65 year-old and ≥65 year-old breast cancer patients also observed a significant increase in the prevalence of polypharmacy (50% and 74%, respectively) as well as the average number of drugs (5 and 6.8, respectively) in the elderly group [18]. This pattern also occurs for other types of cancer over the course of the disease and can be explained by a higher number of comorbidities and the complex management of cancer that involves multiple anti-cancer agents and supportive care agents in elderly cancer patients [20]. Our study also showed that patients treated in public facilities, more disadvantaged patients, and those detected through screening used a higher number of medications than their respective counterparts. Medications appeared to be dispensed less to Māori, Pacific, and Asian ethnic groups according to our non-adjusted analysis, but the association became non-significant when adjusted for other factors. A previous New Zealand study indicated that Māori and Pacifica are likely to receive and take less medications for health needs in general [21].
Our study did not show any significant association between medication use and breast cancer-specific mortality but mortality from other and unknown causes was lower in previously hospitalised patients who used 2–3 drugs at cancer diagnosis compared to those who used none. It is likely that the use of 2–3 drugs at cancer diagnosis was more appropriate in patients with severe comorbidities that require hospitalisation. On the other hand, we cannot rule out the fact that the benefits and harms from individual medications may have cancelled each other out. Several studies have reported the benefits from specific medications on cancer survival [22,23,24,25,26] as well as potential adverse effects including various potential drug–drug interactions (PDDI) [27,28] but these are beyond the scope of this paper.
The use of several medications in cancer patients raises several related issues. In a US study of 5490 breast cancer patients aged over 65 years who received intravenous chemotherapy, the median number of prescribed medications for non-cancer reasons prior to cancer treatment was nine, and the number of medications used was related to an increase in post chemotherapy hospitalisation, even after controlling for age, comorbidities, and other factors [29]. In an Australian study, polypharmacy (defined as using five or more medications) was seen in 57% of cancer patients and was associated with being frail rather than robust [30]. Polypharmacy increases the risk of PDDI, which are also related to frailty in breast cancer patients [31], and these include potential interactions with chemotherapy or radiation treatment [32,33]. With multiple medications, there are likely to be potentially inappropriate medications (PIM); studies in the US show that 62% of 17,630 breast cancer patients over age 65 had one or more PIM and had increased inpatient and emergency visits and healthcare costs in the 12 months after cancer diagnosis [34]. PIM were more common than in the age-matched non-cancer subjects [35]. These general issues related to polypharmacy, particularly in elderly cancer patients, show that careful review of medication, particularly prior to specific cancer treatments, and where appropriate, deprescribing to reduce PDDI and PIM, could have considerable benefits [32,33].
We found that simvastatin and omeprazole were most frequently dispensed in our study. Previous studies of polypharmacy in cancer patients also profiled similar drugs of the same drug categories as the most common, besides painkillers [6,18]. While statins are likely to reduce breast cancer recurrence [23] and breast cancer deaths [24] in early diagnosed cases, a large proportion of statin use was deemed unnecessary in patients with limited life expectancy [6]. A multicentre randomised controlled trial in palliative care settings observed that discontinuing statins was not only safe but also associated with improved quality of life and cost saving where approximately half of the patients had cancer [26]. This indicates an opportunity to reduce well-known burdens of polypharmacy in cancer patients, especially in those who are terminally ill.
The key advantage of our study was the use of robust population-based data sources, which include the regional breast cancer registries and the Ministry of Health’s national databases of drug dispensing, hospital discharges, and mortality information. These prospectively maintained breast cancer registry databases contain much more comprehensive and accurate information than national data sources [36,37,38] and capture almost all newly diagnosed breast cancer cases in the respective district health board regions, representing 67% of all breast cancer patients in New Zealand [39]. Our study also had limitations. We aimed to present the burden of non-cancer medications in breast cancer patients, and therefore, we selected the medications that were dispensed for at least 90 days. This excluded the temporary but frequent use of some medications such as painkillers and non-prescription medications, although this limitation also applies to many other studies [29]. We were not able to account for less severe comorbidities that did not require hospitalisation. Our study did not investigate the effect of individual drugs and drug–drug interactions in survival analysis, which may be an opportunity for future research.
5. Conclusions
The prevalence of non-cancer medication use is substantial in New Zealand women with newly diagnosed primary invasive breast cancer. Over half of patients used one or more drugs for at least 90 days between one year before cancer diagnosis and first cancer treatment. Medication use was more prevalent in older women and disadvantaged women. The use of 2–3 non-cancer medications at cancer diagnosis reduced mortality from other causes; however, non-cancer medication use had no effect on breast cancer-specific mortality.
Author Contributions
Conceptualization, S.T.T., J.M.E. and P.S.A.; methodology, S.T.T., J.M.E. and P.S.A.; software, P.S.A. and S.T.T.; validation, P.S.A., S.T.T. and J.M.E.; formal analysis, P.S.A. and S.T.T.; investigation, S.T.T., P.S.A. and J.M.E.; resources, S.T.T. and J.M.E.; data curation, S.T.T., P.S.A. and O.W.S.; writing—original draft preparation, P.S.A.; writing—review and editing, all authors; visualization, P.S.A. and S.T.T.; supervision, S.T.T. and J.M.E.; project administration, S.T.T.; funding acquisition, S.T.T., J.M.E., D.S., R.L., I.D.C., M.K.-H. All authors have read and agreed to the published version of the manuscript.
Funding
This research was funded by Auckland Medical Research Foundation (Ref: 1118017). O.W.S. was also supported by the Auckland Medical Research Foundation doctoral scholarship (Ref: 1217004).
Conflicts of Interest
The authors declare no conflict of interest. The funders had no role in the design of the study; in the collection, analyses, or interpretation of data; in the writing of the manuscript, or in the decision to publish the results.
References
- Ministry of Health. New Cancer Registrations 2017; Ministry of Health: Wellington, New Zealand, 2019.
- Ministry of Health. Cancer Patient Survival 1994–2011; Ministry of Health: Wellington, New Zealand, 2015.
- Sarfati, D.; Koczwara, B.; Jackson, C. The impact of comorbidity on cancer and its treatment. CA Cancer J. Clin. 2016, 66, 337–350. [Google Scholar] [CrossRef] [PubMed]
- Millar, E.; Gurney, J.K.; Stanley, J.; Stairmand, J.; Davies, C.; Semper, K.; Dowell, A.; Lawrenson, R.; Mangin, D.; Sarfati, D. Pill for this and a pill for that: A cross-sectional survey of use and understanding of medication among adults with multimorbidity. Australas. J. Ageing 2018, 38, 91–97. [Google Scholar] [CrossRef] [PubMed]
- Viktil, K.K.; Blix, H.S.; Moger, T.A.; Reikvam, A. Polypharmacy as commonly defined is an indicator of limited value in the assessment of drug-related problems. Br. J. Clin. Pharmacol. 2006, 63, 187–195. [Google Scholar] [CrossRef] [PubMed]
- Leblanc, T.W.; McNeil, M.J.; Kamal, A.H.; Currow, D.C.; Abernethy, A.P. Polypharmacy in patients with advanced cancer and the role of medication discontinuation. Lancet Oncol. 2015, 16, e333–e341. [Google Scholar] [CrossRef]
- Kotlinska-Lemieszek, A.; Paulsen, Ø.; Kaasa, S.; Klepstad, P. Polypharmacy in Patients with Advanced Cancer and Pain: A European Cross-Sectional Study of 2282 Patients. J. Pain Symptom Manag. 2014, 48, 1145–1159. [Google Scholar] [CrossRef] [PubMed]
- Riechelmann, R.P.; Krzyzanowska, M.K.; Zimmermann, C. Futile medication use in terminally ill cancer patients. Support. Care Cancer 2008, 17, 745–748. [Google Scholar] [CrossRef] [PubMed]
- Fede, A.; Miranda, M.; Antonangelo, D.; Trevizan, L.; Schaffhausser, H.; Hamermesz, B.; Zimmermann, C.; Del Giglio, A.; Riechelmann, R.P. Use of unnecessary medications by patients with advanced cancer: Cross-sectional survey. Support. Care Cancer 2010, 19, 1313–1318. [Google Scholar] [CrossRef]
- Ministry of Health. Pharmaceutical Claims Data Mart (PHARMS); Ministry of Health: Wellington, New Zealand, 2017.
- Ministry of Health. National Minimum Dataset (Hospital Events) Data Mart data dictionary. 2019. Available online: https://www.health.govt.nz/nz-health-statistics/national-collections-and-surveys/collections/national-minimum-dataset-hospital-events (accessed on 9 June 2020).
- Ministry of Health. Mortality Collection Data Dictionary; Ministry of Health: Wellington, New Zealand, 2017.
- Platt, R.W.; Hutcheon, J.A.; Suissa, S. Immortal Time Bias in Epidemiology. Curr. Epidemiol. Rep. 2019, 6, 23–27. [Google Scholar] [CrossRef]
- Suissa, S. Immortal Time Bias in Pharmacoepidemiology. Am. J. Epidemiol. 2008, 167, 492–499. [Google Scholar] [CrossRef]
- Lévesque, L.E.; Hanley, J.A.; Kezouh, A.; Suissa, S. Problem of immortal time bias in cohort studies: Example using statins for preventing progression of diabetes. BMJ 2010, 340, b5087. [Google Scholar] [CrossRef]
- Atkinson, J.; Salmond, C.; Crampton, P. NZDep2013 Index of Deprivation; University of Otago: Dunedin, New Zealand, 2014. [Google Scholar]
- American Cancer Society. Breast Cancer Hormone Receptor Status. 2020. Available online: https://www.cancer.org/cancer/breast-cancer/understanding-a-breast-cancer-diagnosis/breast-cancer-hormone-receptor-status.html (accessed on 21 August 2020).
- Topaloğlu, U.S.; Ozaslan, E. Comorbidity and polypharmacy in patients with breast cancer. Breast Cancer 2020, 27, 477–482. [Google Scholar] [CrossRef]
- Sera, L.; McPherson, M.L.; Holmes, H.M. Commonly Prescribed Medications in a Population of Hospice Patients. Am. J. Hosp. Palliat. Med. 2013, 31, 126–131. [Google Scholar] [CrossRef] [PubMed]
- Jørgensen, T.L.; Hallas, J.; Land, L.H.; Herrstedt, J. Comorbidity and polypharmacy in elderly cancer patients: The significance on treatment outcome and tolerance. J. Geriatr. Oncol. 2010, 1, 87–102. [Google Scholar] [CrossRef]
- Metcalfe, S.; Laking, G.; Arnold, J. Variation in the use of medicines by ethnicity during 2006/07 in New Zealand: A preliminary analysis. N. Z. Med. J. 2013, 126. [Google Scholar]
- Childers, W.K.; Hollenbeak, C.S.; Cheriyath, P. β-Blockers Reduce Breast Cancer Recurrence and Breast Cancer Death: A Meta-Analysis. Clin. Breast Cancer 2015, 15, 426–431. [Google Scholar] [CrossRef] [PubMed]
- Kwan, M.L.; Habel, L.A.; Flick, E.D.; Quesenberry, C.P.; Caan, B. Post-diagnosis statin use and breast cancer recurrence in a prospective cohort study of early stage breast cancer survivors. Breast Cancer Res. Treat. 2007, 109, 573–579. [Google Scholar] [CrossRef] [PubMed]
- Murtola, T.J.; Visvanathan, K.; Artama, M.; Vainio, H.; Pukkala, E. Statin Use and Breast Cancer Survival: A Nationwide Cohort Study from Finland. PLoS ONE 2014, 9, e110231. [Google Scholar] [CrossRef]
- Barron, T.I.; Connolly, R.M.; Sharp, L.; Bennett, K.; Visvanathan, K. Beta Blockers and Breast Cancer Mortality: A Population-Based Study. J Clin Oncol. 2011, 29. [Google Scholar] [CrossRef]
- Kutner, J.S.; Blatchford, P.J.; Taylor, D.H.; Ritchie, C.S.; Bull, J.H.; Fairclough, D.L.; Hanson, L.C.; Leblanc, T.W.; Samsa, G.P.; Wolf, S.; et al. Safety and Benefit of Discontinuing Statin Therapy in the Setting of Advanced, Life-Limiting Illness a randomized clinical trial. JAMA Intern. Med. 2015, 175, 691–700. [Google Scholar] [CrossRef]
- Blower, P.; De Wit, R.; Goodin, S.; Aapro, M. Drug–drug interactions in oncology: Why are they important and can they be minimized? Crit. Rev. Oncol. 2005, 55, 117–142. [Google Scholar] [CrossRef]
- Riechelmann, R.P.; Del Giglio, A. Drug interactions in oncology: How common are they? Ann. Oncol. 2009, 20, 1907–1912. [Google Scholar] [CrossRef] [PubMed]
- Lu-Yao, G.; Nightingale, G.; Nikita, N.; Keith, S.; Gandhi, K.; Swartz, K.; Zinner, R.; Sharma, S.; Kelly, W.K.; Chapman, A. Relationship between polypharmacy and inpatient hospitalization among older adults with cancer treated with intravenous chemotherapy. J. Geriatr. Oncol. 2020, 11, 579–585. [Google Scholar] [CrossRef] [PubMed]
- Turner, J.P.; Shakib, S.; Singhal, N.; Hogan-Doran, J.; Prowse, R.; Johns, S.; Bell, J.S. Prevalence and factors associated with polypharmacy in older people with cancer. Support. Care Cancer 2014, 22, 1727–1734. [Google Scholar] [CrossRef] [PubMed]
- Domínguez-Alonso, J.A.; Conde-Estévez, D.; Bosch, D.; Pi-Figueras, M.; Tusquets, I. Breast cancer, placing drug interactions in the spotlight: Is polypharmacy the cause of everything? Clin. Transl. Oncol. 2020, 1–9. [Google Scholar] [CrossRef]
- Turner, J.; Kantilal, K.; Holmes, H.; Koczwara, B. Optimising Medications for Patients With Cancer and Multimorbidity: The Case for Deprescribing. Clin. Oncol. 2020, 32, 609–617. [Google Scholar] [CrossRef]
- Lees, J.; Chan, A. Polypharmacy in elderly patients with cancer: Clinical implications and management. Lancet Oncol. 2011, 12, 1249–1257. [Google Scholar] [CrossRef]
- Feng, X.; Higa, G.M.; Safarudin, F.; Sambamoorthi, U.; Tan, X. Potentially inappropriate medication use and associated healthcare utilization and costs among older adults with colorectal, breast, and prostate cancers. J. Geriatr. Oncol. 2019, 10, 698–704. [Google Scholar] [CrossRef]
- Feng, X.; Higa, G.M.; Safarudin, F.; Sambamoorthi, U.; Chang, J. Prevalence and factors associated with potentially inappropriate medication use in older medicare beneficiaries with cancer. Res. Soc. Adm. Pharm. 2019. [Google Scholar] [CrossRef]
- Gurney, J.K.; Sarfati, D.; Dennett, E.R.; Koea, J. The completeness of cancer treatment data on the National Health Collections. N. Z. Med. J. 2013, 126. [Google Scholar]
- Neave, L.; Harvey, V.; Benjamin, C.; Thompson, P.; Pellett, O.; Whitlock, J.; Jones, W.; Poole, G. The Auckland Breast Cancer Register: A special project of the Auckland Breast Cancer Study Group. N. Z. Med. J. 2003, 116. [Google Scholar]
- Seneviratne, S.; Campbell, I.; Scott, N.; Shirley, R.; Peni, T.; Lawrenson, R. Accuracy and completeness of the New Zealand Cancer Registry for staging of invasive breast cancer. Cancer Epidemiol. 2014, 38, 638–644. [Google Scholar] [CrossRef] [PubMed]
- Breast Cancer Foundation. National Register. Available online: https://breastcancerregister.org.nz/about (accessed on 5 June 2020).


Publisher’s Note: MDPI stays neutral with regard to jurisdictional claims in published maps and institutional affiliations. |
© 2020 by the authors. Licensee MDPI, Basel, Switzerland. This article is an open access article distributed under the terms and conditions of the Creative Commons Attribution (CC BY) license (http://creativecommons.org/licenses/by/4.0/).