Abstract
This study collected 11 parameters regarding the labial and lingual strength for maximum isometric and swallowing tasks among 150 healthy Chinese adults in Taiwan. Measurements were performed using the Iowa Oral Performance Instrument (IOPI). All of the labial and lingual strength parameters were measured three times. The maximal value of three trials represents the pressure of every parameter. The overall mean (±standard deviation) and maximum isometric pressures of the lips, anterior tongue, and posterior tongue were 24.81 ± 5.64, 55.95 ± 14.13, and 53.23 ± 12.24 kPa, respectively. The mean value of posterior tongue strength was less than that of the anterior tongue by approximately 5%. The percentages of maximum isometric tongue pressure during the swallowing of saliva and water were 85% and 80% for the anterior tongue and 90% and 81% for the posterior tongue, respectively. The average endurances for the anterior tongue and posterior tongue were 13.86 ± 7.08 and 10.06 ± 5.40 s, respectively. The maximum isometric pressures were greater than both the saliva and water swallowing pressures, and the saliva swallowing pressures were greater than the water swallowing pressures. A value of 33 kPa in maximum isometric pressure could serve as a demarcation of weak tongue strength for healthy Chinese adults. As for the repeated trials of labial and lingual strength, there were no statistically significant differences for any of the pressures obtained from the 11 labial and lingual strength parameters. The normative data can be used for the objective assessment of labial and lingual strength in healthy Chinese adults.
1. Introduction
There is a three-stage sequential model of the process of normal swallowing, which is divided into oral, pharyngeal, and esophageal stages according to the location of the bolus. The orbicularis oris muscle is located in the lower part of the face; it is responsible for lip closure and prevents food from spilling out of the mouth during swallowing. Lip strength is measured based on the pressure generated by the orbicularis oris muscle. Decreased lip strength causes difficulty in lip closure, resulting in food leakage and a reduction in intraoral pressure that leads to swallowing impairment [1].
Regarding the function of swallowing, tongue muscles are responsible for bolus retention in the oral cavity and bolus transport from the oral cavity to the pharynx. The maximal tongue pressure exerted on the hard palate may offer a quantitative parameter for evaluating tongue motor biomechanics during swallowing [2]. The exact and objective evaluation of tongue pressure is thus important for the monitoring of swallowing and oropharyngeal movements [3].
Adams et al. [4] conducted a systematic review and meta-analysis of measurements of tongue strength and found 38 studies that addressed this purpose. Among them, 12 studies reported tongue strength data for health adults. Nine studies illustrated the values of anterior tongue strength in the healthy adult population. Three studies measured tongue strength in both the anterior and posterior position. The maximum isometric pressure (MIP) of the tongue, including the anterior and posterior regions, has a range of 43–78 kPa in healthy adults. The maximum anterior tongue strength was observed to decrease with increasing age in nine studies. Two age groups were considered (below 60 years and above 60 years) in conducting the meta-analysis. The results indicated that the maximum tongue strength of the younger adults was 10–15 kPa higher than that of the oldest adults. There were some inconsistencies with the finding that tongue strength is reduced with increasing age. Clark and Solomon [5] reported that significant main effects of age were identified for both of the anterior and posterior tongue pressure. Although both of the means for the anterior and posterior tongue pressures in the middle-age group were greater than the means for the young-age and old-age group, pairwise comparisons revealed no differences from each other. The value of 40 kPa can be used as a cut-off value to demarcate a weak or strong tongue strength for healthy older adults [6,7].
The tongue plays an important role in both speech and swallowing; however, the strength requirements for the two functions are markedly different [8]. Typically, adults use ≤20% and 40–60% of the maximum tongue strength for speech production and swallowing, respectively [9,10]. The lingual-palatal swallowing pressures generated during swallowing tasks are termed the maximum swallowing pressure (MSP). The swallowing pressure reserve is the difference between the MIP and the MSP. The MIP has been shown to decrease with age, whereas age does not appear to have a significant effect on the MSP [9,11,12].
Tongue muscle endurance is defined as the length of time one can maintain a submaximal contraction [5,13]. Healthy adults can maintain half of their maximum tongue strength for at least 25–35 s for both tongue regions [14]. A value ≤ 10 s is viewed as a negative indicator for the maintenance of adequate tongue function [4,13].
Dysphagia problems increase gradually with age and are frequently undetected or untreated [15]. The reported incidence of dysphagia in community-dwelling adults is 22.6% (mean age: 48.1 years). Of adults with dysphagia, 46% had not consulted a physician regarding their symptoms [16]. Swallowing problems can occur even in healthy order adults, which is called presbyphagia and is associated with age-related decrease in tongue muscle strength [17,18]. In Taiwan, there are four hundred thousand individuals suffering from dysphagia [19]. The availability of normative data is a prerequisite when seeking to determine the impact of lingual strength on observed swallowing disorders [20].
Some participants in a previous study reported feeling orofacial muscle soreness immediately after their tongue strength measurement, and it is described in the Iowa Oral Performance Instrument (IOPI) user manual that a participant who is to perform the tongue strength measurement may experience “throat soreness” due to normal muscle fatigue [21,22]. After the establishment of the reference data for tongue strength in healthy Chinese adults, the tongue strength measurement will be applied in a wide range of clinical practice—for example, with frail patients, individuals with physical disability, or older adults. Whether this research population can withstand the muscle fatigue during tongue strength measurement in three consecutive trials motivated us to explore the relationship between the three trials.
Therefore, the present study aimed to provide data from Chinese individuals in Taiwan by measuring the tongue endurance, the pressure exerted by the lips and tongue on the oral cavity during the maximum isometric contraction and during saliva and water swallowing. The difference in three trials in labial and tongue strength under the conditions of maximum isometric pressure, saliva and water swallowing, and tongue endurance were also investigated.
2. Materials and Methods
2.1. Participants
Participants were recruited from the general public. A total of 150 healthy adults participated in this study. Adults aged >20 years with normal lips, teeth, tongue, palate, and chewing were included. Those with a history of orthodontic treatment or temporomandibular disorders, a history of major surgery of the head or neck, oral disease, or a history of neurologic impairment were excluded. Written informed consent was provided by all the participants for inclusion in this study. Approval for data collection was obtained from the Research Ethics Committee of Jen-Ai Hospital (no. 107-47).
2.2. Lingual and Labial Strength Evaluation
The Iowa Oral Performance Instrument (IOPI Medical LCC, Redmond, WA, USA) was used to measure the lingual and labial strength. The IOPI is characterized by a high test-retest reliability and is frequently utilized in healthy adults and patients with various diagnoses [4,23]. This method also exhibits a high inter- and intra-rater reliability [9,24,25].
The examiner demonstrated the lingual and labial strength task and permitted the participant to squeeze a tongue bulb with his or her fingers prior to the participant performing the task. This intermediate step was important to facilitate familiarity and cooperation. Each participant was allowed to practice twice prior to any data collection. A new bulb was used for every participant because of hygienic concerns and to minimize measurement errors due to possible compliance variations in the bulb after extended use.
2.3. Procedures
Table 1 shows the eleven measuring procedures (for the three parts) developed to assess the MIPs, tongue endurance, and swallowing pressure [20,23,26]. All of the labial and lingual strength parameters were measured 3 times. The maximal value of three trials represents the pressure of every parameter. Participants who complained of orofacial musculature soreness during the assessment stopped performing the measurement and were excluded.

Table 1.
Measuring procedures for the maximum isometric pressure, tongue endurance, and swallowing pressure.
2.3.1. Maximum Isometric Pressures
The evaluation of the lingual pressure included the MIP of the anterior and posterior tongue. The tongue bulb placement was located behind the central incisors (anterior tongue) and aligned with the first molars (posterior tongue) [26]. The examiner placed a permanent mark directly on the participant’s closed lips on the plastic tubing attached to the tongue bulb in both the anterior and posterior lingual regions. As such, the examiner could monitor the tongue bulb placement for consistency across all trials [23,27].
Tongue strength, or MIP, was measured as the greatest pressure exerted across three consecutive trials at both the anterior and posterior lingual regions. The participants were requested to squeeze the bulb between the tongue and hard palate with maximum effort for approximately 2 s. The participants were allowed to rest for 10 s between trials.
Labial strength was measured by placing the tongue bulb inside the cheek immediately lateral to the corner of the mouth, and the participants squeezed the bulb against the buccal surface of the teeth by pouting the lips as hard as possible [28].
2.3.2. Tongue Endurance
Following the completion of the tongue and labial strength measurements, the participants were allowed to rest for 1 min. Tongue endurance was the period of time when the participants maintained 50% of their MIP for the anterior and posterior tongue. For tongue endurance, the LCD screen on the IOPI displayed the exerted pressure in kPa and the LED lights displayed how long the participants held the top (green) light on to signify tongue endurance.
2.3.3. Swallowing Pressure
Swallowing pressure was defined as the non-effortful swallowing pressure across three consecutive trials for saliva swallowing and thin liquid (commercially bottled water) swallowing. The bolus was offered by the investigator in a cup (5 mL) and swallowed by the participant with the tongue bulb in the labial and lingual regions.
2.4. Statistical Analysis
All the descriptive and inferential statistical analyses were performed using SPSS version 23.0 (IBM Corp., Armonk, NY, USA). The significance level was set at 0.05. The normality of the data was investigated using a histogram, normal quantile–quantile (Q–Q) plots, skewness, kurtosis, and the Shapiro–Wilk test [29]. Descriptive statistics (means and 95% confidence intervals (C)] of the mean, and minimum and maximum values) were calculated for all the variables. A repeated-measures analysis of variance (ANOVA) was performed to evaluate the effect of three trials in attaining the labial and lingual strength.
3. Results
Of the 150 recruited participants, 49 were males and 101 were females (age range: 20–79 years; mean ± standard deviation (SD): 36.1 ± 14.9 years). There were no participants with oral motor disease. More than half of the participants (54.0%) had an abnormal body mass index value (<18.5 or >24.0 kg/m2) (Table 2). No participant was excluded for orofacial musculature soreness during measurement.
Table 2.
Characteristics of the participants (N = 150).
3.1. The Normality Test of Variables
There were several different methods used to test the normality of data on the maximum isometric pressures and swallowing pressures of both the lips and tongue, and tongue endurance, including the analysis of the histogram, Q–Q plots, skewness, kurtosis, and Shapiro–Wilk test (Table 3). For example, the histogram for the MIP of the posterior tongue (MIPpost) indicated symmetry (p = 0.079), and the spread of the sample illustrated a normal distribution (Figure 1). The Q–Q plot (Figure A1g in Appendix A) compared the ordered distribution of the MIPpost with the quantiles of a standard normal distribution indicated by the straight line. Figure A1g shows a normal distribution because the points lie along the line.
Table 3.
The normality test of variables without outliers.
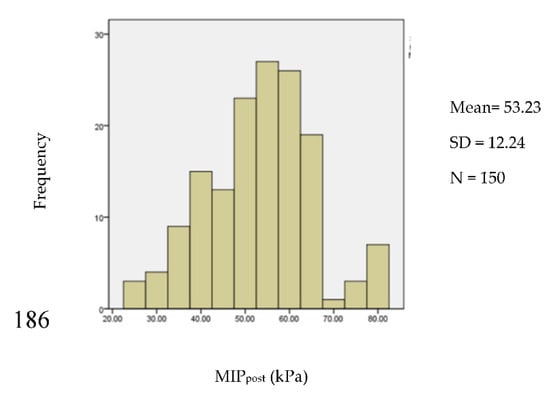
Figure 1.
The histogram of the maximum isometric pressure of the posterior tongue.
Data analysis revealed some outliers in the measurement of labial strength and tongue endurance. Outliers in statistical analyses are extreme values that do not appear to fit with the majority of a data set. If not removed, these extreme values can have a large effect on any conclusions that may be drawn from the data in question, because they can skew the correlation coefficients and lines of best fit in the wrong direction. After removing the outliers, nonsignificant Shapiro–Wilk tests were observed in the data for the SSP of the lips (SSPlip) (n = 145) (p = 0.190) and water swallowing pressure (WSP) of the lips (WSPlip) (n = 144) (p = 0.197) (Table 3). A normal distribution was not uniformly present even after removing the outliers for the measurements of the MIP of the lips (MIPlip) (n = 145), WSP of the anterior tongue (WSPant) (n = 150) or posterior tongue (WSPpost) (n = 150), and endurance of the anterior tongue (Eant) (n = 132) or posterior tongue (Epost) (n = 136) (Table 3).
There were no outliers removed in the measurements of tongue strength for both anterior and posterior locations. The datasets for the MIP of the anterior (MIPant) (p = 0.127) and posterior (MIPpost) (p = 0.079) tongue strength were normally distributed. It is common to consider values below the 5th percentile to be “abnormal” [22,30]. The formula (mean − 1.65 × SD) [31] can subsequently be used to determine the cut-off point from these data (e.g., 55.95 − 1.65 × 14.13 = 32.64 for anterior tongue strength; and 53.23 − 1.65 × 12.24 = 33.0 for posterior tongue strength). Values <33 kPa indicate a weak tongue strength (Table 4).
Table 4.
Normal values of tongue strength (kPa).
3.2. Labial and Lingual Strength Pattern
Descriptive statistics (mean, SD, and 95% CI) for the generation of labial and lingual pressure in the total sample are reported in Table 3. The average MIPlip, MIPant, and MIPpost were 24.81 ± 5.64, 55.95 ± 14.13, and 53.23 ± 12.24 kPa, respectively. The mean value of posterior tongue strength was less than that of the anterior tongue strength by approximately 5%. The average SSPlip, SSPant, and SSPpost were 23.82 ± 6.91, 47.91 ± 15.29, and 48.11 ± 14.91 kPa, respectively. The average WSPlip, WSPant, and WSPpost were 21.95 ± 7.89, 45.16 ± 16.21, and 43.38 ± 15.42 kPa, respectively. The average Eant and Epost were 13.86 ± 7.08 and 10.06 ± 5.40 s, respectively.
The average swallowing pressures were divided by the MIP for each bolus and multiplied by 100 to derive the proportion or percentage of the maximum isometric lip or tongue pressure generated during the swallowing trials. Hence, the percentages of the maximum isometric lip pressure generated during the swallowing of saliva and water were 96% and 88%, respectively. The percentages of the maximum isometric tongue pressure generated during the swallowing of saliva and water were 85% and 80% for the anterior tongue, and 90% and 81% for the posterior tongue, respectively.
3.3. Repeated Trials of Labial and Lingual Strength
A repeated-measures analysis of covariance was used to analyze the differences among three trials of labial and lingual strength parameters. Prior to performing repeated measurements of ANOVAs, the values obtained from the three trials were subject to spherical verification; p > 0.05 denotes that the three repeated measurements are not correlated and conform to spherical verification. In contrast, p < 0.05 denotes that the three measurements are highly correlated and do not conform to spherical verification; hence, they must be corrected using the Greenhouse–Geisser method. When repeated measurements of ANOVAs showed significant differences, the least significant difference was further used to perform pairwise comparisons among the three measurement values. These results did not show a statistically significant difference for any of the pressures obtained from the labial and lingual strength parameters (Table 5).
Table 5.
Repeated trials for the labial and lingual pressure analysis.
4. Discussion
This study aimed to investigate and establish reference values for the labial and lingual strength of healthy Chinese adults. It is important to point out that the values for tongue strength and endurance in the present study fell within the normative range of 40–80 kPa and >10 s, respectively [5,13,20]. The mean MIPant in this Chinese population was 55.95 kPa (CI: 53.67–58.22). In a Belgian population, Vanderwegen et al. found a mean of 44.27 kPa (CI: 42.83–45.71) [20]. In an American population, Stierwalt and Youmans reported a mean of 59.78 kPa (CI: 57.88–61.68) [13]. The average MIPpost of 53.23 kPa (CI: 51.26–55.21) observed in our study was also higher than that reported by Vanderwegen et al. (mean: 41.08 kPa; CI: 39.67–42.48) [20], but similar to that found by Clark and Solomon (mean: 53.60 kPa; CI: 51.28–55.92) [5]. However, compared with this study, the overall measurements of maximal tongue strength in a Korean population were lower by approximately 10 kPa [32]; the mean Eant was 13.86 s (CI: 12.64–15.07), which is lower than that recorded by Vanderwegen et al. (mean: 22.39 s; CI: 20.78–24.12) [20]. The mean Epost in our study group was 10.06 s (CI: 9.14–10.97), while Vanderwegen et al. [20] observed a mean of 14.90 s (CI: 13.96–15.90). In contrast, the overall measurements of tongue endurance across different age decades in the Korean population were found to be higher than those revealed by our study [32].
Maximum tongue strength declines with advanced age and is lower in females [17,18]. The average age of participants in our study and in the studies conducted by Stierwalt and Youmans [13], Clark and Solomon [5], and Vanderwegen et al. [20] was 36.1 ± 14.9, 42.34 ± 20.3, 43.79 ± 20.4, and 54.8 ± 20.9 years, respectively. This may explain why the value of the tongue strength measurement in the study conducted by Vanderwegen et al. [20] was the lowest. Although the average age of participants in the current study was the lowest one, the tongue endurance value was the lowest one. In terms of gender ratio, the male to female ratio of the current study and the studies conducted by Stierwalt and Youmans [13], Clark and Solomon [5], Vanderwegen et al. [20], and Jeong et al. [32] was 49:101, 80:20, 88:83, 210:210, and 60:60, respectively. Data on the effects of age and gender on tongue endurance are relatively scarce, and most often indicate no effects with advanced age and gender [13,20,32]. The present study is a comparative research on labial and lingual strength among Chinese, European, American, and Korean populations. This issue merits further research in different regional standard values and cross-national surveys of tongue strength with considering diverse perspectives, including age, gender, race, and nationality.
In the present study, the value of 33 kPa was used to demarcate a weak tongue strength for this Chinese population; this value is lower than those reported in previous studies [4,9,13]. The literature suggests that healthy adults should have maximum isometric tongue pressures ≥ 40 kPa, and SSPs between 20 and 30 kPa [13]. The percentages of maximum isometric tongue pressure generated during saliva swallowing and water swallowing were 40–60% [9,33]. However, Peladeau-Pigeon et al. analyzed the swallowing tasks of 84 healthy participants and found that the peak amplitudes of saliva swallowing, on average, ranged from 70% to 81% of the values obtained for the MIPant [34]. These findings were more similar to those of the present study (i.e., using > 80% of the total tongue MIP range during saliva and water swallowing). Although the participants were guided to perform saliva and water swallowing as naturally as possible, we cannot preclude the possibility that the prior performance of lingual maximum isometric tasks influenced the use of effort during the saliva and water swallowing tasks.
Future studies with the aim to shed light on the influence of racial differences on normal oral swallowing are warranted. Although maximal tongue strength decreases gradually with aging, tongue strength during swallowing remains static. It may impact on the swallowing pressure reserve. Hence, it is strongly suggested that the Chinese population should perform tongue exercises early to improve the maximum isometric tongue pressure and swallowing pressure reserve. The maximum isometric contraction of tongue and the activity of pressing the palate during the oral phase of saliva and water swallowing help in the comprehension of swallowing physiology, and will thus contribute to therapeutic planning for individuals with dysphagia. Owing to its convenience and limited invasiveness, maximum isometric tongue pressure may be useful for the early detection of presbyphagia in the general public.
In this study, there were 11 muscle measuring procedures, each of which was evaluated for three consecutive trials as recommended in the IOPI user manual, and a total 33 trials for muscle strength measurements. Following the completion of measurements, some participants experienced orofacial muscle soreness for 24 h. Similar results were reported in previous studies with tongue strength measurements [21,22]. Repeated trials had no effect on the measurement of labial and lingual strength parameters; this result was in line with the findings reported by Vanderwegen et al. [20]. Previous research also demonstrated that the correlation between mean pressure and maximal pressure across the three trials of tongue strength is strong [25]. Since both are related to the oral phase swallowing function, the use of the maximal pressure of the three trials is more efficient in a clinical setting because there is no need for calculation.
There was no significant difference in the three trials in terms of the anterior and posterior tongue strength and labial strength for the MIP, saliva swallowing, water swallowing, and endurance of the tongue. Owing to the variability of the participants, the SDs of the measurement values ranged widely (7.16–21.46 kPa) (Table 5). The measurement of tongue strength and labial strength will be popularized to clinical practice in the future for patients, individuals with physical disability, or older adults. The reliability and validity of the measured values are essential; therefore, it is advisable to have a conservative attitude. In addition to specifying the location of the bulb and the procedure prior to measurement, the participants should practice placing the pressure bulb in the mouth and become familiar with the feeling of the pressure bulb in the mouth. Once the participants have the opportunity to practice before the formal measurement, the formal measurement can be performed once or twice to reduce participant fatigue.
The present study had several limitations that should be acknowledged. This sample was composed of healthy adults recruited from the general public. Therefore, this dataset may have been vulnerable to volunteer bias. The number of older adults was only 10, and the data were insufficient to assume the statistical normality of the distribution regarding tongue and lip strength in the normal population. In addition, the female percentage (101) was two times higher than the male (49), and this could have affected the results. Future research should recruit participants who are evenly distributed among different age and gender categories. Thus, the data can be broken down by age group and sex to help elucidate the findings and compare with previous publications.
5. Conclusions
This study explored the reference values of lingual and labial strength measurements in different tasks for healthy Chinese adults. The maximum isometric pressures of the lips, anterior tongue, and posterior tongue were 24.81 ± 5.64, 55.95 ± 14.13, and 53.23 ± 12.24 kPa, respectively. The percentages of maximum isometric tongue pressure during the swallowing of saliva and water were 85% and 80% for the anterior tongue and 90% and 81% for the posterior tongue, respectively. The average endurances for the anterior tongue and posterior tongue were 13.86 ± 7.08 and 10.06 ± 5.40 s, respectively. As for the repeated trials of labial and lingual strength, there were no statistically significant differences for any of the pressures obtained from the 11 labial and lingual strength parameters.
Large samples of data that quantify a range of normal tongue function are important to serve as a basis of comparison for individuals with impairments. Therefore, a larger sample size is necessary to extend the findings of this study to the general healthy population in China. Extensive population examination including abled and disabled participants would be recommended for establishing normative data.
Author Contributions
Conceptualization, Y.-J.H.; methodology, S.-J.W. and Y.-J.H.; validation, K.-Y.T. and F.-Y.L.; data curation, S.-J.W., K.-Y.T., and C.-C.W.; formal analysis, S.-J.W., C.-C.W., and F.-Y.L.; investigation, S.-J.W. and K.-Y.T.; project administration, Y.-J.H.; resources, Y.-J.H. and S.-J.W.; supervision, Y.-J.H. and F.-Y.L.; writing—original draft, Y.-J.H.; writing—review and editing, S.-J.W., C.-C.W., and F.-Y.L.; funding acquisition, Y.-J.H. All authors have read and agreed to the published version of the manuscript.
Funding
This research was funded by Taichung Veterans General Hospital Puli Branch and Central Taiwan University of Science and Technology, Taiwan (TCVGH-P-CTUST10801 and TCVGH-P-CTUST10901).
Acknowledgments
The authors gratefully acknowledge the participants for their contributions to this research.
Conflicts of Interest
The authors declare no conflict of interest. The funder had no role in the study design, analysis, interpretation, or preparation of the manuscript.
Appendix A

Figure A1.
Quantile-quantile (Q-Q) plots of the dependent variables. The 95% confidence intervals are indicated by the dotted lines. (a) Q-Q plot of MIPlip; (b) Q-Q plot of SSPlip; (c) Q-Q plot of WSPlip; (d) Q-Q plot of MIPant; (e) Q-Q plot of SSPant; (f) Q-Q plot of WSPant; (g) Q-Q plot of MIPpost; (h) Q-Q plot of SSPpost; (i) Q-Q plot of WSPpost; (j) Q-Q plot of Eant; (k) Q-Q plot of Epost.

References
- Park, H.S.; Kim, J.U.; Park, J.Y.; Oh, D.H.; Kim, H.J. Comparison of orbicularis oris muscle strength and endurance in young and elderly adults. J. Phys. Sci. 2018, 30, 1477–1478. [Google Scholar] [CrossRef] [PubMed]
- Yano, J.; Yamamoto-Shimizu, S.; Yokoyama, T.; Kumakura, I.; Hanayama, K.; Tsubahara, A. Effects of tongue-strengthening exercise on the geniohyoid muscle in young healthy adults. Dysphagia 2019, 34, 1–7. [Google Scholar] [CrossRef] [PubMed]
- Balou, M.; Herzberg, E.G.; Kamelhar, D.; Molfenter, S.M. An intensive swallowing exercise protocol for improving swallowing physiology in older adults with radiographically confirmed dysphagia. Clin. Interv. Aging 2019, 14, 283–288. [Google Scholar] [CrossRef] [PubMed]
- Adams, V.; Mathisen, B.; Baines, S.; Lazarus, C.; Callister, R. A systematic review and meta-analysis of measurements of tongue and hand strength and endurance using the Iowa Oral Performance Instrument (IOPI). Dysphagia 2013, 28, 350–369. [Google Scholar] [CrossRef]
- Clark, H.M.; Solomon, N.P. Age and sex differences in orofacial strength. Dysphagia 2012, 27, 2–9. [Google Scholar] [CrossRef]
- Steele, C.M. The influence of tongue strength on oral viscosity discrimination acuity. J. Texture Stud. 2018, 49, 249–255. [Google Scholar] [CrossRef]
- Fei, T.; Polacco, R.C.; Hori, S.E.; Molfenter, S.M.; Peladeau-Pigeon, M.; Tsang, C.; Steele, C.M. Age-related differences in tongue-palate pressures for strength and swallowing tasks. Dysphagia 2013, 28, 575–581. [Google Scholar] [CrossRef]
- Stierwalt, J.A.; Youmans, S.R. Tongue measures in individuals with normal and impaired swallowing. Am. J. Speech Lang. Pathol. 2007, 16, 148–156. [Google Scholar] [CrossRef]
- Youmans, S.R.; Youmans, G.L.; Stierwalt, J.A. Differences in tongue strength across age and gender: Is there a diminished strength reserve? Dysphagia 2009, 24, 57–65. [Google Scholar] [CrossRef]
- Potter, N.L.; Nievergelt, Y.; VanDam, M. Tongue strength in children with and without speech sound disorders. Am. J. Speech Lang. Pathol. 2019, 28, 612–622. [Google Scholar] [CrossRef]
- Kent, R.D. Nonspeech oral movements and oral motor disorders: A narrative review. Am. J. Speech Lang. Pathol. 2015, 24, 763–789. [Google Scholar] [CrossRef]
- Robbins, J.; Gangnon, R.E.; Theis, S.M.; Kays, S.A.; Hewitt, A.L.; Hind, J.A. The effects of lingual exercise on swallowing in older adults. J. Am. Geriatr. Soc. 2005, 53, 1483–1489. [Google Scholar] [CrossRef]
- Steele, C.M.; Bayley, M.T.; Peladeau-Pigeon, M.; Nagy, A.; Namasivayam, A.M.; Stokely, T.W. A randomized trial comparing two tongue-pressure resistance training protocols for post-stroke dysphagia. Dysphagia 2016, 31, 452–461. [Google Scholar] [CrossRef] [PubMed]
- VanRavenhorst-Bell, H.A.; Coufal, K.L.; Patterson, J.A.; Mefferd, A.S. A comparative study: Tongue muscle performance in weightlifters and runners. Physiol. Rep. 2018, 6, e13923. [Google Scholar] [CrossRef] [PubMed]
- Baijens, L.W.; Clavé, P.; Cras, P.; Ekberg, O.; Forster, A.; Kolb, G.F.; Leners, J.C.; Masiero, S.; Mateos-Nozal, J.; Ortega, O.; et al. European Society for Swallowing Disorders–European Union Geriatric Medicine Society white paper: Oropharyngeal dysphagia as a geriatric syndrome. Clin. Interv. Aging 2016, 11, 1403–1428. [Google Scholar] [CrossRef]
- Wilkins, T.; Gillies, R.A.; Thomas, A.M.; Wagner, P.J. The prevalence of dysphagia in primary care patients: A HamesNet Research Network study. J. Am. Board Fam. Med. 2007, 20, 144–150. [Google Scholar] [CrossRef] [PubMed]
- Namiki, C.; Hara, K.; Tohara, H.; Kobayashi, K.; Chantaramanee, A.; Nakagawa, K.; Saitou, T.; Yamaguchi, K.; Yoshimi, K.; Nakane, A.; et al. Tongue-pressure resistance training improves tongue and suprahyoid muscle functions simultaneously. Clin. Interv. Aging 2019, 22, 601–608. [Google Scholar] [CrossRef] [PubMed]
- Park, J.S.; Oh, D.H.; Chang, M. Comparison of maximal tongue strength and tongue strength used during swallowing in relation to age in healthy adults. J. Phys. Sci. 2016, 28, 442–445. [Google Scholar] [CrossRef]
- No Problems with Swallowing and Guarantee for Nutritional Intake. Available online: https://www.hpa.gov.tw/Pages/Detail.aspx?nodeid=1137&pid=8068 (accessed on 10 July 2020).
- Vanderwegen, J.; Guns, C.; VanNuffelen, G.; Elen, R.; DeBodt, M. The influence of age, sex, bulb position, visual feedback, and the order of testing on maximum anterior and posterior tongue strength and endurance in healthy Belgian adults. Dysphagia 2013, 28, 159–166. [Google Scholar] [CrossRef]
- Chun, H.L.; Chung, S.Y.; Hwu, Y.J. The Discourse on Measuring Frequency of Tongue Strength. Open J. Dent. Oral Health 2019, 1, 3–7. [Google Scholar] [CrossRef]
- IOPI User Manual. Available online: https://manualzz.com/doc/7303147/iopi%C2%AE-user-manual (accessed on 10 July 2020).
- Chung, S.Y.; Kuo, C.T.; Liou, B.K.; Lu, C.W.; Hwu, Y.J. The influence of age, gender, and BMI on tongue and lip strength in healthy adults. Ann. Otolaryngol. Rhinol. 2019, 6, 1225. [Google Scholar]
- Youmans, S.R.; Stierwalt, J.A. Measures of tongue function related to normal swallowing. Dysphagia 2006, 21, 102–111. [Google Scholar] [CrossRef]
- Gingrich, L.L.; Stierwalt, J.A.G.; Hageman, C.F.; LaPointe, L.L. Lingual propulsive pressures across consistencies generated by the anteromedian and posteromedian tongue by healthy young adults. J. Speech Lang. Hear. Res. 2012, 55, 960–972. [Google Scholar] [CrossRef]
- Clark, H.M.; Henson, P.A.; Barber, W.D.; Stierwalt, J.A.; Sherrill, M. Relationships among subjective and objective measures of tongue strength and oral phase swallowing impairments. Am. J. Speech Lang. Pathol. 2003, 12, 40–50. [Google Scholar] [CrossRef]
- Pitts, L.L.; Stierwalt, J.A.G.; Hageman, C.F.; LaPointe, L.L. The Influence of oropalatal dimensions on the measurement of tongue strength. Dysphagia 2017, 32, 759–766. [Google Scholar] [CrossRef] [PubMed]
- IOPI Medical Professionals. Available online: https://iopimedical.com/medical-professionals/ (accessed on 13 October 2020).
- Henderson, B. Testing experimental data for univariate normality. Clin. Chim. Acta 2006, 366, 112–129. [Google Scholar] [CrossRef]
- Vitali, C.; Baldanzi, C.; Crispiatico, V.; Polini, F.; Ammenti, P.; Montesano, A.; Cattaneo, D. Effect of Impairment-Oriented and Function-Oriented Exercises on Mouth Function in Subjects with Systemic Sclerosis. Folia Phoniatr. Logop. 2020, 72, 389–401. [Google Scholar] [CrossRef]
- An Introduction to Value at Risk (VAR). Available online: https://www.investopedia.com/articles/04/092904.asp (accessed on 2 July 2020).
- Jeong, D.M.; Shin, Y.J.; Lee, N.R.; Lim, H.K.; Choung, H.W.; Pang, K.M.; Kim, B.J.; Kim, S.M.; Lee, J.H. Maximal strength and endurance scores of the tongue, lip, and cheek in healthy, normal Koreans. J. Korean Assoc. Oral Maxillofac. Surg. 2017, 43, 221–228. [Google Scholar] [CrossRef] [PubMed]
- Prandini, E.L.; Totta, T.; da Rocha Salles Bueno, M.; Rosa, R.R.; Giglio, L.D.; Trawitzki, L.V.; Berretin-Felix, G.; de Felício, C.M.; Genaro, K.F. Analysis of tongue pressure in Brazilian young adults. CoDAS 2015, 27, 478–482. [Google Scholar] [CrossRef]
- Peladeau-Pigeon, M.; Steele, C.M. Age-related variability in tongue pressure patterns for maximum isometric and saliva swallowing tasks. J. Speech Lang. Hear. Res. 2017, 60, 3177–3184. [Google Scholar] [CrossRef] [PubMed]

Publisher’s Note: MDPI stays neutral with regard to jurisdictional claims in published maps and institutional affiliations. |
© 2020 by the authors. Licensee MDPI, Basel, Switzerland. This article is an open access article distributed under the terms and conditions of the Creative Commons Attribution (CC BY) license (http://creativecommons.org/licenses/by/4.0/).