Article

#Antivaccination on Instagram: A Computational Analysis of Hashtag Activism through Photos and Public Responses

1
Division of Media Communication, Hankuk University of Foreign Studies, Seoul 02450, Korea
2
Business School, Hankuk University of Foreign Studies, Seoul 02450, Korea
3
Division of Applied Mathematical Sciences, Korea University, Seoul 30019, Korea
*
Author to whom correspondence should be addressed.
Int. J. Environ. Res. Public Health 2020, 17(20), 7550; https://doi.org/10.3390/ijerph17207550
Submission received: 14 September 2020 / Revised: 14 October 2020 / Accepted: 15 October 2020 / Published: 17 October 2020

Abstract

:
A dramatic increase has been registered in the number of social media posts in photo form as well as in hashtag activism. Hashtags, which manifest thoughts and feelings clearly and concisely, originated on Twitter, where the length of a post is limited; their use, however, has expanded into other social media services, including Instagram. Hashtags, which make it easy to find and express support for posts of interest, have been widely used for online activism, although they have been criticized for fostering confirmation bias. Moreover, hashtag activism in photo form has been relatively understudied. This research analyzed Instagram photos with antivaccination hashtags as an example of hashtag activism through photos. In addition, we examined how the photo features were related to public response, which was manifested via engagement and comment sentiment. The results suggest that the photos which were categorized into “text” took the largest share. It was also found that the major way of claiming was to imprint key messages that persuade people not to vaccinate with remarks from professionals on photos and provide a source of supporting information in the post text with hashtags of antivaccine intention. Various photo features showed associations with engagement and comment sentiment, but the directions of correlation were usually the opposite: these results suggest that engagement and comment sentiment are separate domains that reveal different public responses.

1. Introduction

Social media has been playing an increasingly influential role in expressing one’s opinion online, and the means of expression utilizing the functions of social media are various, with hashtags being one of the most popular ones. A hashtag is a brief keyword prefixed by the symbol # (hash) included in social media posts in order for them to be easily searched for among the huge volume of posts on the platform [1]. The hashtag is known to have been first introduced by Twitter, although it is now widely used on other social media services. It serves not only as a guide for finding and following posts of interest but also as a marker that shows one’s stance on an issue explicitly and succinctly [1]. These characteristics make the hashtag a useful tool for activists who need an efficient way to widely disseminate their belief and interactively communicate with the public.
Hashtag activism is a realization of this potential—it is an attempt to use the hashtag functions in social media to incite social change [2]. Individual users or activists devise tags that manifest their belief on an issue concisely and attach them to their social media posts; similarly, users or activists who support or approve of their belief use the same tag to show their endorsement. Like other memes on social media [3], some of these tags are shared by the general public and spread throughout the social media space, and some of them, including #MeToo or #BlackLivesMatter, have gone viral beyond online spaces, becoming symbols of social movements. The hashtag has been acknowledged as one of the major forms of online activism [4].
However, hashtag activism has also been criticized. It has been argued that the effectiveness of hashtag activism is questionable [5], and that activism by short hashtags may obscure the rich context of a movement [2]. Yet, one of the biggest criticisms is that it can foster confirmation bias [6]. Hashtags make it easy to find posts of interest, but this function may worsen the tendency of networking only with likeminded users or paying attention only to posts with similar viewpoints. This can result in polarization [7,8], which may harm society at large.
The antivaccination movement can be considered an example of this phenomenon. Activists upload posts with hashtags displaying antivaccine intentions on social media, and these are used by other social media users who share their belief. Such activism via hashtags can foster confirmation bias, and concern has been increasing about its possible harm to the society—for example, the breakdown of herd immunity. In this regard, the interest in the antivaccination movement on social media has been considerable, and many studies have analyzed the social media data of the movement [9,10,11].
It must be noted that most of the previous studies about hashtag activism in general and antivaccination on social media in particular have analyzed text data. While text is still the major form of online data, it is also true that the share of visual data such as photographs has been rapidly increasing, and photo-centric social media services (e.g., Instagram) have attracted many users, significantly growing their impact. Yet, hashtag activism via photos on social media has been relatively understudied. Furthermore, while the literature has paid much attention to the role of social media photos in public health [12], the vast majority of previous studies about photo content have used the content analysis method with human coders, whereas computational analysis has been employed in a limited number of studies [13,14]. Meanwhile, the relationship between features of the photos and the engagement of the public has been understudied. Public engagement, which is usually measured by the number of likes and comments on social media [15], can show what kind of photos would induce public endorsement through photos of hashtag activism; however, little research has been conducted on it, especially in the literature on the antivaccination movement.
In this regard, the present study aims to explore how the antivaccination movement is represented on Instagram. In addition, it aims to investigate the relationship between the features of antivaccination Instagram photos and public engagement. With these aims, Instagram photos with antivaccination hashtags were downloaded, and photo features at various levels were extracted. Moreover, the current study measured the public engagement with the photos as well as the sentiment of the comments on the photos; finally, it analyzed how photo features are associated with them, and whether these features can predict them. The following research questions are proposed:
RQ1. What are the key characteristics of the content of Instagram photos with antivaccination hashtags?
RQ2. What are the relationships between the features of Instagram photos with antivaccination hashtags and the engagement of the public with the photos?
RQ3. What are the relationships between the features of Instagram photos with antivaccination hashtags and the sentiments of comments on the photos?
This study is structured as follows. First, it reviews previous studies about social media photos and public health, hashtag activism, and the antivaccination movement on social media. Next, it describes how the data were gathered and which features were extracted and used for the analysis of the Instagram photos. Furthermore, it presents the key characteristics of the content of Instagram photos, the associations of photo features with public responses, and the predictability of photo features regarding engagement and comment sentiment. Finally, it discusses the implications of the results.

2. Related Works

2.1. Social Media Photos and Public Health

Many previous studies have paid attention to social media photos of topics pertaining to public health. First, photos about diseases were analyzed. Yi-Frazier et al. [16] asked 20 adolescents with type 1 diabetes to post diabetes-related photos for three weeks on Instagram. They analyzed the uploaded photos and found that their major categories were diabetes care, humor, and food. Seltzer et al. [17] analyzed the Instagram photos with the #zika tag and found that they were primarily related to the prevention and transmission of the disease. Fung et al. [18] also analyzed the content of Zika-related photos and found that its prevention, its effects on pregnancy, and the deaths associated with it were major categories. Instagram posts with the #melanomasucks tag were analyzed by Cho et al. [19], with the most frequent content being controlling melanoma and the effects of having melanoma. Nobles et al. [14] examined the demographic profile of faces in Instagram posts with the #HIV tag and compared it with the profile of those at most risk of a new HIV diagnosis. Their results suggest that the faces on Instagram photos were older, more female, more white, less black, and less Hispanic than those of new HIV diagnoses.
Photos about cigarettes have also been analyzed in previous research. Chu et al. [20] categorized Instagram photos about the electronic cigarette and found that advertisement was the most common type of content, followed by product and activity. The results of Lee et al. [21] also revealed that the most popular category of Instagram posts of electronic cigarettes was marketing. Laestadius et al. [22] examined what kind of user mainly posted about electronic cigarettes on Instagram; it was found that over half of the posts were uploaded by corporate users. Allem et al. [23] analyzed the content of Instagram photos of cigars and found that about one fourth of the photos were about marijuana.
Next, previous studies have analyzed social media photos related to the human body. For example, they examined photos uploaded on Instagram by body-positive accounts [24] and health influencers [25] and investigated what kind of body images these accounts convey. Self-injury is another topic that previous studies on Instagram photos have focused on, showing that pictures with a high degree of injury generated more comments [26], though the majority did not contain any advisory warning [27]. Previous studies also analyzed social media photos about alcohol [28], junk food [29], pregnancy [30], and surgery [31].
It must be noted that, however, most of those studies used the content analysis method with human coders, whereas advanced computational analysis methods were used in a limited number of studies. To name a few, Kim and Kim [13] analyzed the photos on the CDC (Centers for Disease Control and Prevention) Instagram account using various features at the content and pixel levels which were extracted by computational methods. Moreover, Nobles et al. [14] analyzed the faces in Instagram photos with the #HIV hashtag with automated methods and compared the demographics of the faces with the ones at risk of diagnosis. The current study is in line with the abovementioned research, adopting computational methods to analyze photos about antivaccination.

2.2. Hashtag Activism

Since hashtags have been widely used in a variety of movements, many previous studies have examined hashtag activism using diverse methods. A group of studies have used “hashtag ethnography” [32]—an ethnographic description of how hashtags have been used in social movements. They have investigated movements mainly concerned with race [32,33] and gender [34,35,36], as well as movements by students [37] and teachers [38].
Another group of studies analyzed the content of hashtagged social media posts. Papacharissi and Oliveira [39] examined the form of news exhibited under the hashtag #egypt on Twitter. Giglietto and Lee [40] analyzed tweets containing the #JeNeSuisPasCharlie hashtag and revealed the various discursive strategies that the users of the hashtag employed. Brown et al. [41] conducted a content analysis of tweets with the hashtag #SayHerName, focusing on the Black women who are victims of police violence. Xiong et al. [42] analyzed tweets with the #MeToo hashtag and identified its themes, which included the antecedents of the main event and suggested actions for women’s rights. Ince et al. [43] analyzed the content of #BlackLivesMatter tweets and categorized them into five groups, including solidarity or approval of the movement. Ray et al. [44] also examined #BlackLivesMatter tweets and showed the evolution of both anti- and pro-police narratives on Twitter. This coexistence of counter- and counter-counter-narratives is also visible in the work of Drüeke and Zobl [45], who analyzed tweets with #aufschrei, which means “cry out”; the hashtag was originally used to encourage critical voices against sexual assault, but a persistent number of anti-feminist and sexist messages also employed the hashtag.
A network analysis method has also been used in the literature about hashtag activism. Concerning the #wirecall hashtag, which was used in activism around the 2012 Wisconsin recall election, Xu et al. [46] built and analyzed the follower-following network on Twitter. Their results showed that users with a higher level of connectivity were more involved in the information flow. Jackson and Welles [47] analyzed the network of retweets and mentions with the #Ferguson hashtag on Twitter and found that the network was a broadcast network, where a small number of influential users transmit messages to the vast majority of users unilaterally. Yan et al. [48] also analyzed the network of retweets and mentions on Twitter to reach similar results, revealing that the #ConcernedStudent1950 hashtag network has evolved to be highly concentrated. Wang et al. [49] paid attention to the hashtag co-occurrence network; their analysis of tweets with #OccupyWallStreet revealed that the role of hashtags in information virality may vary with the context of the tweets. Further, concerning the #OccupyWallStreet hashtag, Tremayne [50] generated a bimodal network whose nodes are one of the two kinds—user account or hashtag—and identified a small number of key nodes that are important for the spread of the movement.
While hashtag activism has been examined in previous research, studies that have paid attention to hashtag activism through photos are still rare. The work by Stefanone et al. [51] is one of the exceptions; they analyzed the photos with the #guncontrol hashtag on Twitter and showed that photos with an attribute frame, fear and humor appeals, and positive valence were retweeted more. Moreover, Ichau et al. [52] analyzed the content of Instagram photos with the #jews hashtag, finding that the photos can be categorized into five groups, including people and private lives, culture and history, and cultural production. The present research is in line with these studies and investigates hashtag activism through photos using computational methods.

2.3. Social Media Data Analysis on Antivaccination Movement

Social media has a major impact on the way that people interact and exchange information, and this is also the case in the antivaccination debate [53]. Since information on the internet may influence people’s behavior regarding vaccination, it is important that facts are shared; yet, the social media platforms that enable individual users to find and share information easily can have two side effects on vaccination decision: they can lead people to get vaccinated [54], but antivaccination movements also can be strengthened [55,56]. Thus, it is relevant to observe the vaccination debate on social media and to examine how antivaccination movements proceed [57].
In this regard, previous studies have analyzed the social media posts about the antivaccination movement. Keelan et al. [58] analyzed the Human Papilloma Virus (HPV) vaccination debate on Myspace blogs and found the difference in the points that positive and negative blogs made; positive blogs focused on the effectiveness of the vaccine, whereas negative blogs focused on its risks. Salathe and Khandelwal [9] conducted a sentiment analysis of tweets about H1N1 vaccination and found that users who posted about vaccination generally formed communities, and that most communities were dominated by either positive or negative sentiments. Radzikowski et al. [10] presented the Twitter narrative regarding vaccination after the 2015 measles outbreak; the major themes included the political aspects of the vaccination, anti-antivaccination activism, and more health-oriented issues. Broniatowski et al. [59] examined how Twitter bots promote online vaccination debate and found that bots and “content polluters” tweeted more about vaccination than average users. Jang et al. [60] compared the vaccine-related content in Twitter, Reddit, and online news in the US, Canada, and the UK, and showed that both Twitter and Reddit discussed the vaccine–autism link more than online news.
A network analysis method has been used to observe antivaccination movements on social media. Yuan et al. [61] analyzed the retweet network related to the MMR vaccine; they discovered that users with pro- and antivaccine views retweet much more from their own opinion communities. Himelboim et al. [62] also found subgroups regarding the HPV vaccine conversation on Twitter, noting that interactions and information flows mainly occurred inside each subgroup. Johnson et al. [63] revealed the difference in the network clusters; antivaccination clusters were smaller in size but highly entangled with undecided clusters, whereas pro-vaccination clusters were more peripheral. Francia et al. [64] showed that opinion groups regarding vaccination could be characterized according to their political perspectives. Smith and Graham [65] examined the discourses present within anti-vaccination Facebook pages using social network analysis and found that the present-day discourses were located at the center of discourses.
While antivaccination movements on social media have been investigated in previous studies, limited research has focused on social media photos about antivaccination. Guidry et al. [66] analyzed vaccine-related photos on Pinterest and showed that most photos were concerned with antivaccination. Kearney et al. [67] conducted a sentiment analysis of the Instagram photos about the HPV vaccine and showed that the proportion of pro-vaccine posts was higher than that of the antivaccine posts, but the pro-vaccine posts were liked less than the antivaccine posts. Chen and Dredze [68] analyzed vaccination photos on Twitter, showing that the sentiment of a photo could be one of the predictive factors of whether the photo would be retweeted. Following these studies, the present research analyzes antivaccination photos on Instagram, employing features both at the content and pixel levels for analysis and investigating their associations with and the predictability of public responses to the photos.

3. Method

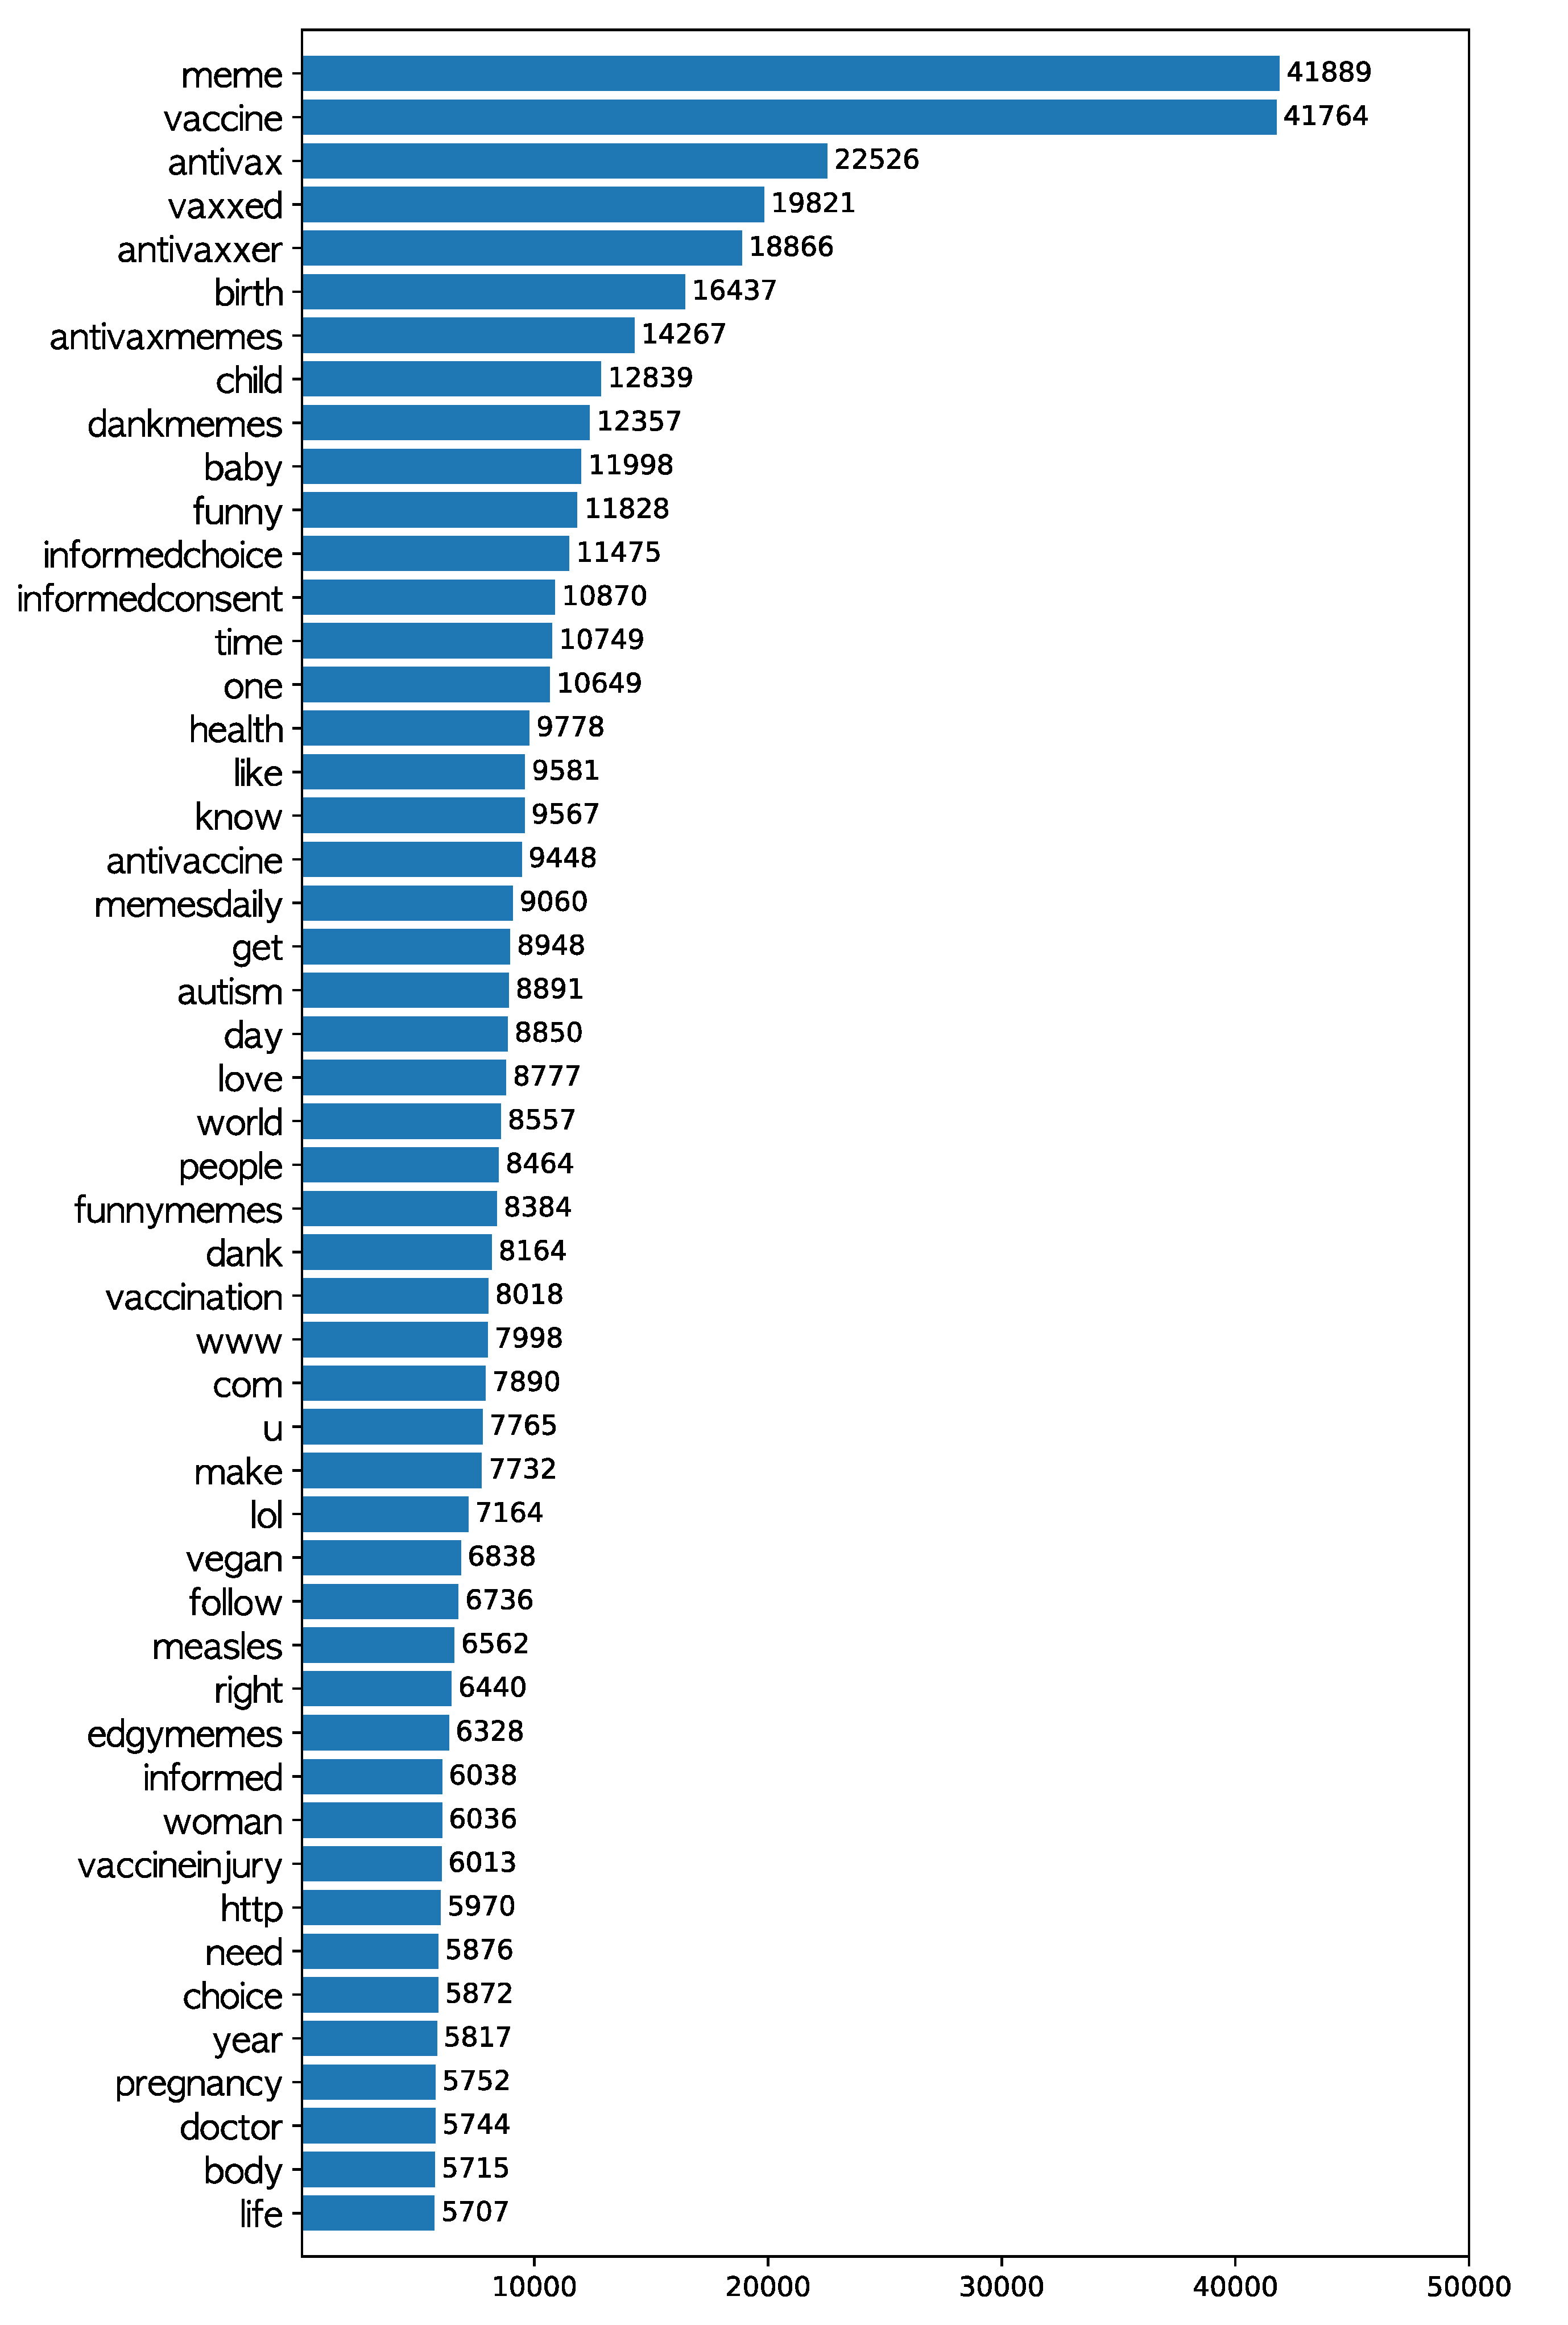
3.1. Data Collection

We crawled the Instagram posts with antivaccination hashtags; Instagram-scraper (https://github.com/rarcega/instagram-scraper) was used for this purpose. Data were gathered from 13 to 20 June 2019. In order to obtain a pool of hashtags about antivaccination, we examined the tags from the best-hashtag.com website (http://best-hashtags.com/hashtag/antivaccine/). After removing hashtags which are unsuitable or too general from the pool, we manually inserted each hashtag in the Instagram search bar and inspected the number of posts with the hashtag. Then, we selected hashtags with a sufficient number of posts for data gathering. As a result, the following hashtags were used for searching: #antivaccination, #antivaccine, #antivax, #antivaxmemes, #antivaxxer, #informedchoice, #informedconsent, #vaccineinjuryawareness, and #vaxxed. After removing duplicates, 96,302 photos in total were used for analysis, and 513,694 comments and 12,579,345 likes accompanying the photos were also collected and analyzed.

3.2. Photo Features

3.2.1. Content Category

For a given photo, its content was categorized into one of the predetermined classes; Computer Vision API in Microsoft Azure Cognitive Services (https://azure.microsoft.com/services/cognitive-services/computer-vision/) [69] was used for this purpose. Each photo was uploaded to the server and the pretrained artificial intelligence service categorized its content into one of following 15 classes: abstract, animal, building, dark, drink, food, indoor, others, outdoor, people, plant, object, sky, text, or transportation.

3.2.2. Face Features

From a given photo, we extracted features regarding human faces using Face API in Microsoft Azure Cognitive Services (https://azure.microsoft.com/services/cognitive-services/face/). The pretrained artificial intelligence service detected human faces from each photo, and features including age, gender, and size were measured. Additionally, the emotions expressed on each face on the photos were determined; the sum of all emotion scores was 1.
The face features used for the analysis were as follows: (1) the number of faces was measured by counting how many faces were on a given photo, (2) closeup was the ratio of the size of the biggest face to the size of the photo, and (3) face ratio was the ratio of the sum of the sizes of all faces to the size of the photo. Then, (4) age was the average age of all appearing faces, and (5) female was the count of female faces in a given photo. The emotion scores of each emotion classes, (6) anger, (7) contempt, (8) disgust, (9) fear, (10) happiness, (11) neutral, (12) sadness, and (13) surprise, were averaged across all the detected faces in a given photo.

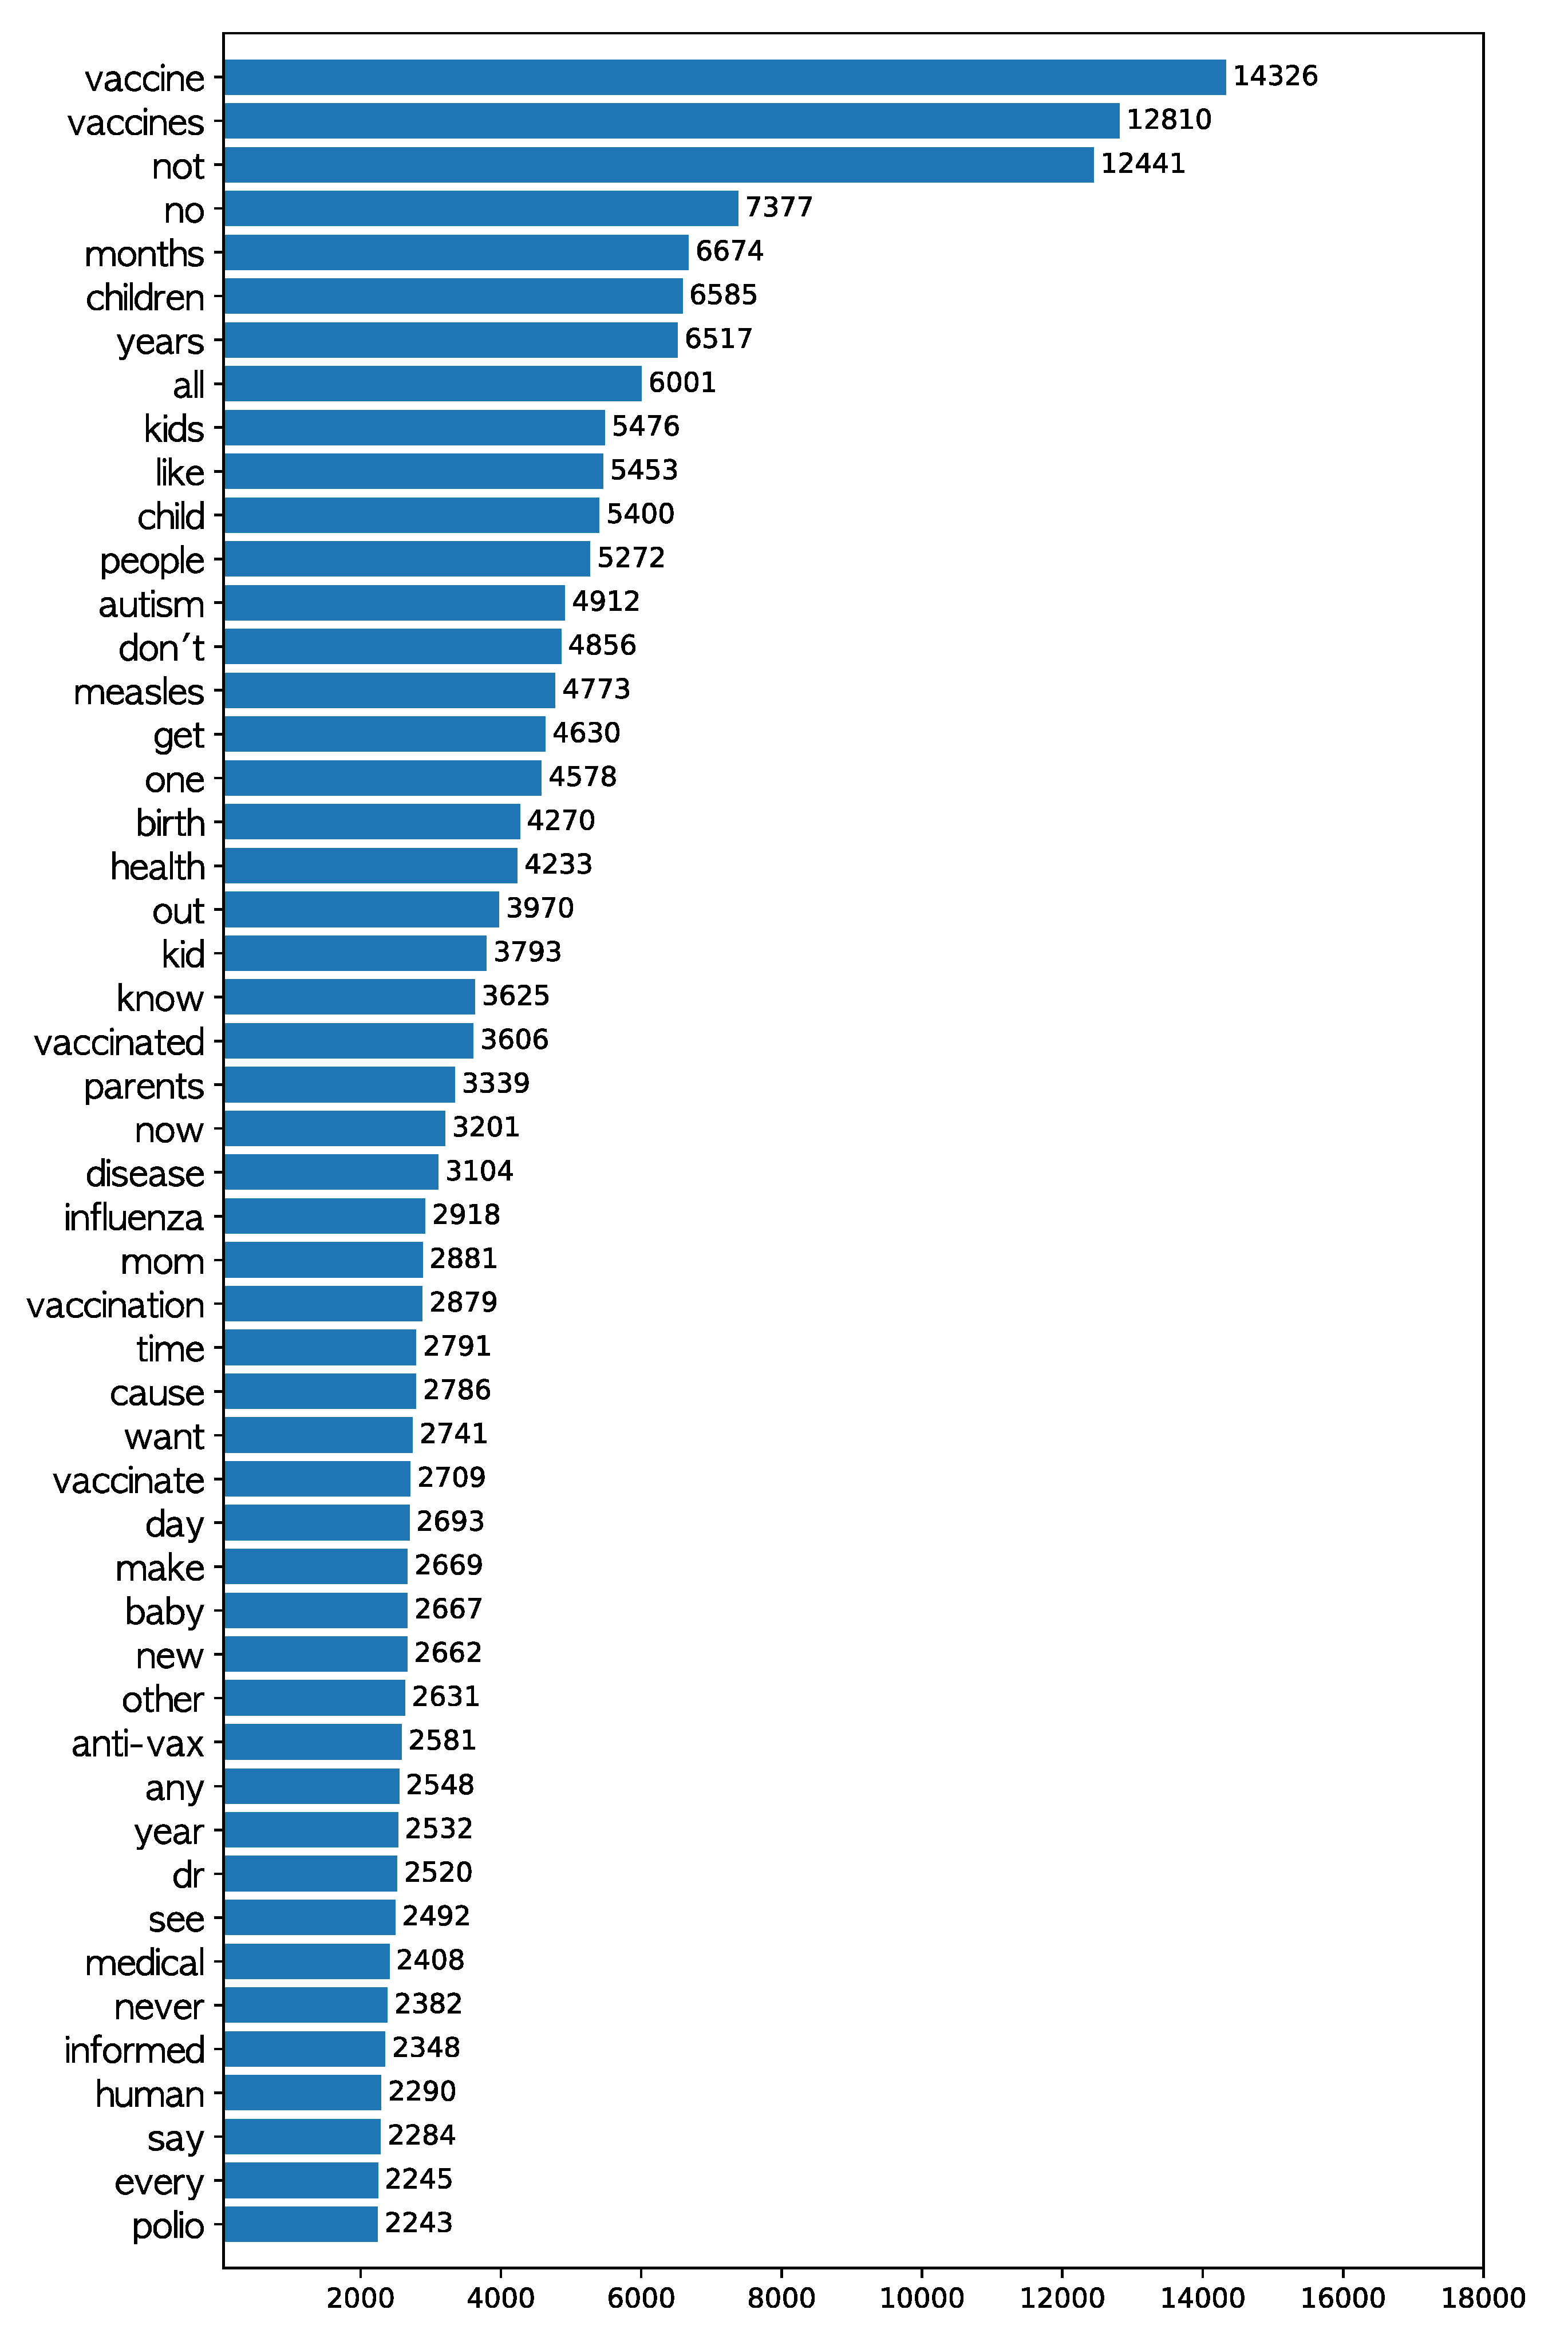
3.2.3. Optical Character Recognition Features

The English words appearing in a given photo were detected using the Optical Character Recognition (OCR) function of Computer Vision API in Microsoft Azure Cognitive Services. The number of words feature was measured as the number of English words detected in a given photo.

3.2.4. Pixel Features

The pixel information was processed to extract low-level features using the Python programming language and OpenCV library [70]. The numbers contained in each pixel of a digital photo represent colors—RGB (red, green, blue), HSV (hue, saturation, value), or others according to the color space model—and various features of a photo can be extracted using these numbers.
First, the means and variances were calculated for the red, green, and blue in each photo’s pixels; thus, the resulting features were (1) red mean, (2) red variance, (3) green mean, (4) green variance, (5) blue mean, and (6) blue variance. In the same way, the means and variances were calculated for the saturation and value (i.e., brightness) in each photo pixels; the resulting features were (7) saturation mean, (8) saturation variance, (9) value mean, and (10) value variance. Since hue, unlike saturation and value, is a nominal feature, its total range (0 to 179 in OpenCV) was divided into intervals (7, 23, 35, 90, 136, 169), each of which correspond to each key color: red, orange, yellow, green, blue, and violet [71]. The share of pixels whose hue falls into each color interval was calculated; the resulting features were (11) red share, (12) orange share, (13) yellow share, (14) green share, (15) blue share, and (16) violet share. Further, the share of red, orange, and yellow was calculated to be (17) the share of warm colors, and the share of green, blue, and violet was calculated to be (18) the share of cold colors. In addition, the number of peaks in a hue histogram [72,73] ((19) hue peaks) was also employed for analysis; we generated the hue histogram, smoothed it with Kernel Density Estimation, and counted how many local maximums were in the smoothed hue histogram [71]. Finally, the affection features from the PAD (pleasure, arousal, and dominance) model were calculated using the formula (Pleasure = 0.69 × Value + 0.22 × Saturation; Arousal = −0.31 × Value + 0.60 × Saturation; Dominance = −0.76 × Value + 0.32 × Saturation) from previous research [74]; the features were (20) pleasure, (21) arousal, and (22) dominance.

3.2.5. Visual Features

The current study examined the features that represent the attractiveness of a given photo [75]. First, (1) brightness measured how bright a given photo was using the average of luminance (Y values in the YUV color space) in the pixels of the photo. Next, (2) colorfulness measured how colorful a given photo was using the relative amounts of red, green, and blue values in the pixels and their means and standard deviations [76]. (3) Naturalness measured the degree of correspondence between a given image and the human perception of reality [77]; we counted the proportion of pixels whose saturation and luminance were located in a certain range [75]. (4) Contrast and (5) RGB contrast were also measured; the former was calculated by the ratio of the standard deviation of the luminance in pixels to the number of pixels [75], and the latter was calculated by extending the former into RGB color space with three dimensions. (6) Sharpness, which represents the clarity and how detailed a given photo is, was calculated by getting the Laplacian of each pixel’s luminance and normalized it with the average luminance of neighboring pixels [78].
Concerning color, two additional metrics were also employed for analysis. (7) Color diversity, which represents the degree of diversity in the colors of a given photo, was measured by fractal dimension using the box-counting method [79], as has been done in previous studies [71,80]. (8) Color harmony, which represents the degree of harmony among the dominant colors in a given photo, was measured by the geometric characteristics that were generated by the dominant color on the color wheel [81]. For this, we generated a hue histogram, smoothed it with Kernel Density Estimation, and identified the highest and the second highest peaks that represent the top two dominant colors. We located the top two colors on the color wheel and measured the internal angle between the two colors as the color harmony [82].

3.2.6. Engagement

The first measure of public response is engagement, which shows the connection between a social media message and the action of the public [83]. As in previous research [15], we measured engagement as the number of likes and comments, which represent online behaviors responsive to a message.

3.2.7. Comment Sentiment

Another measure of public response is the sentiment expressed in the comment on a given post. Sentiment analysis was conducted using Text Analytics API in Microsoft Azure Cognitive Services (https://azure.microsoft.com/services/cognitive-services/text-analytics/). For each comment, it returned a score between 0, which represents being most negative, and 1, which represents being most positive. The sentiment scores across all comments on each photo were averaged and employed for analysis.

4. Results

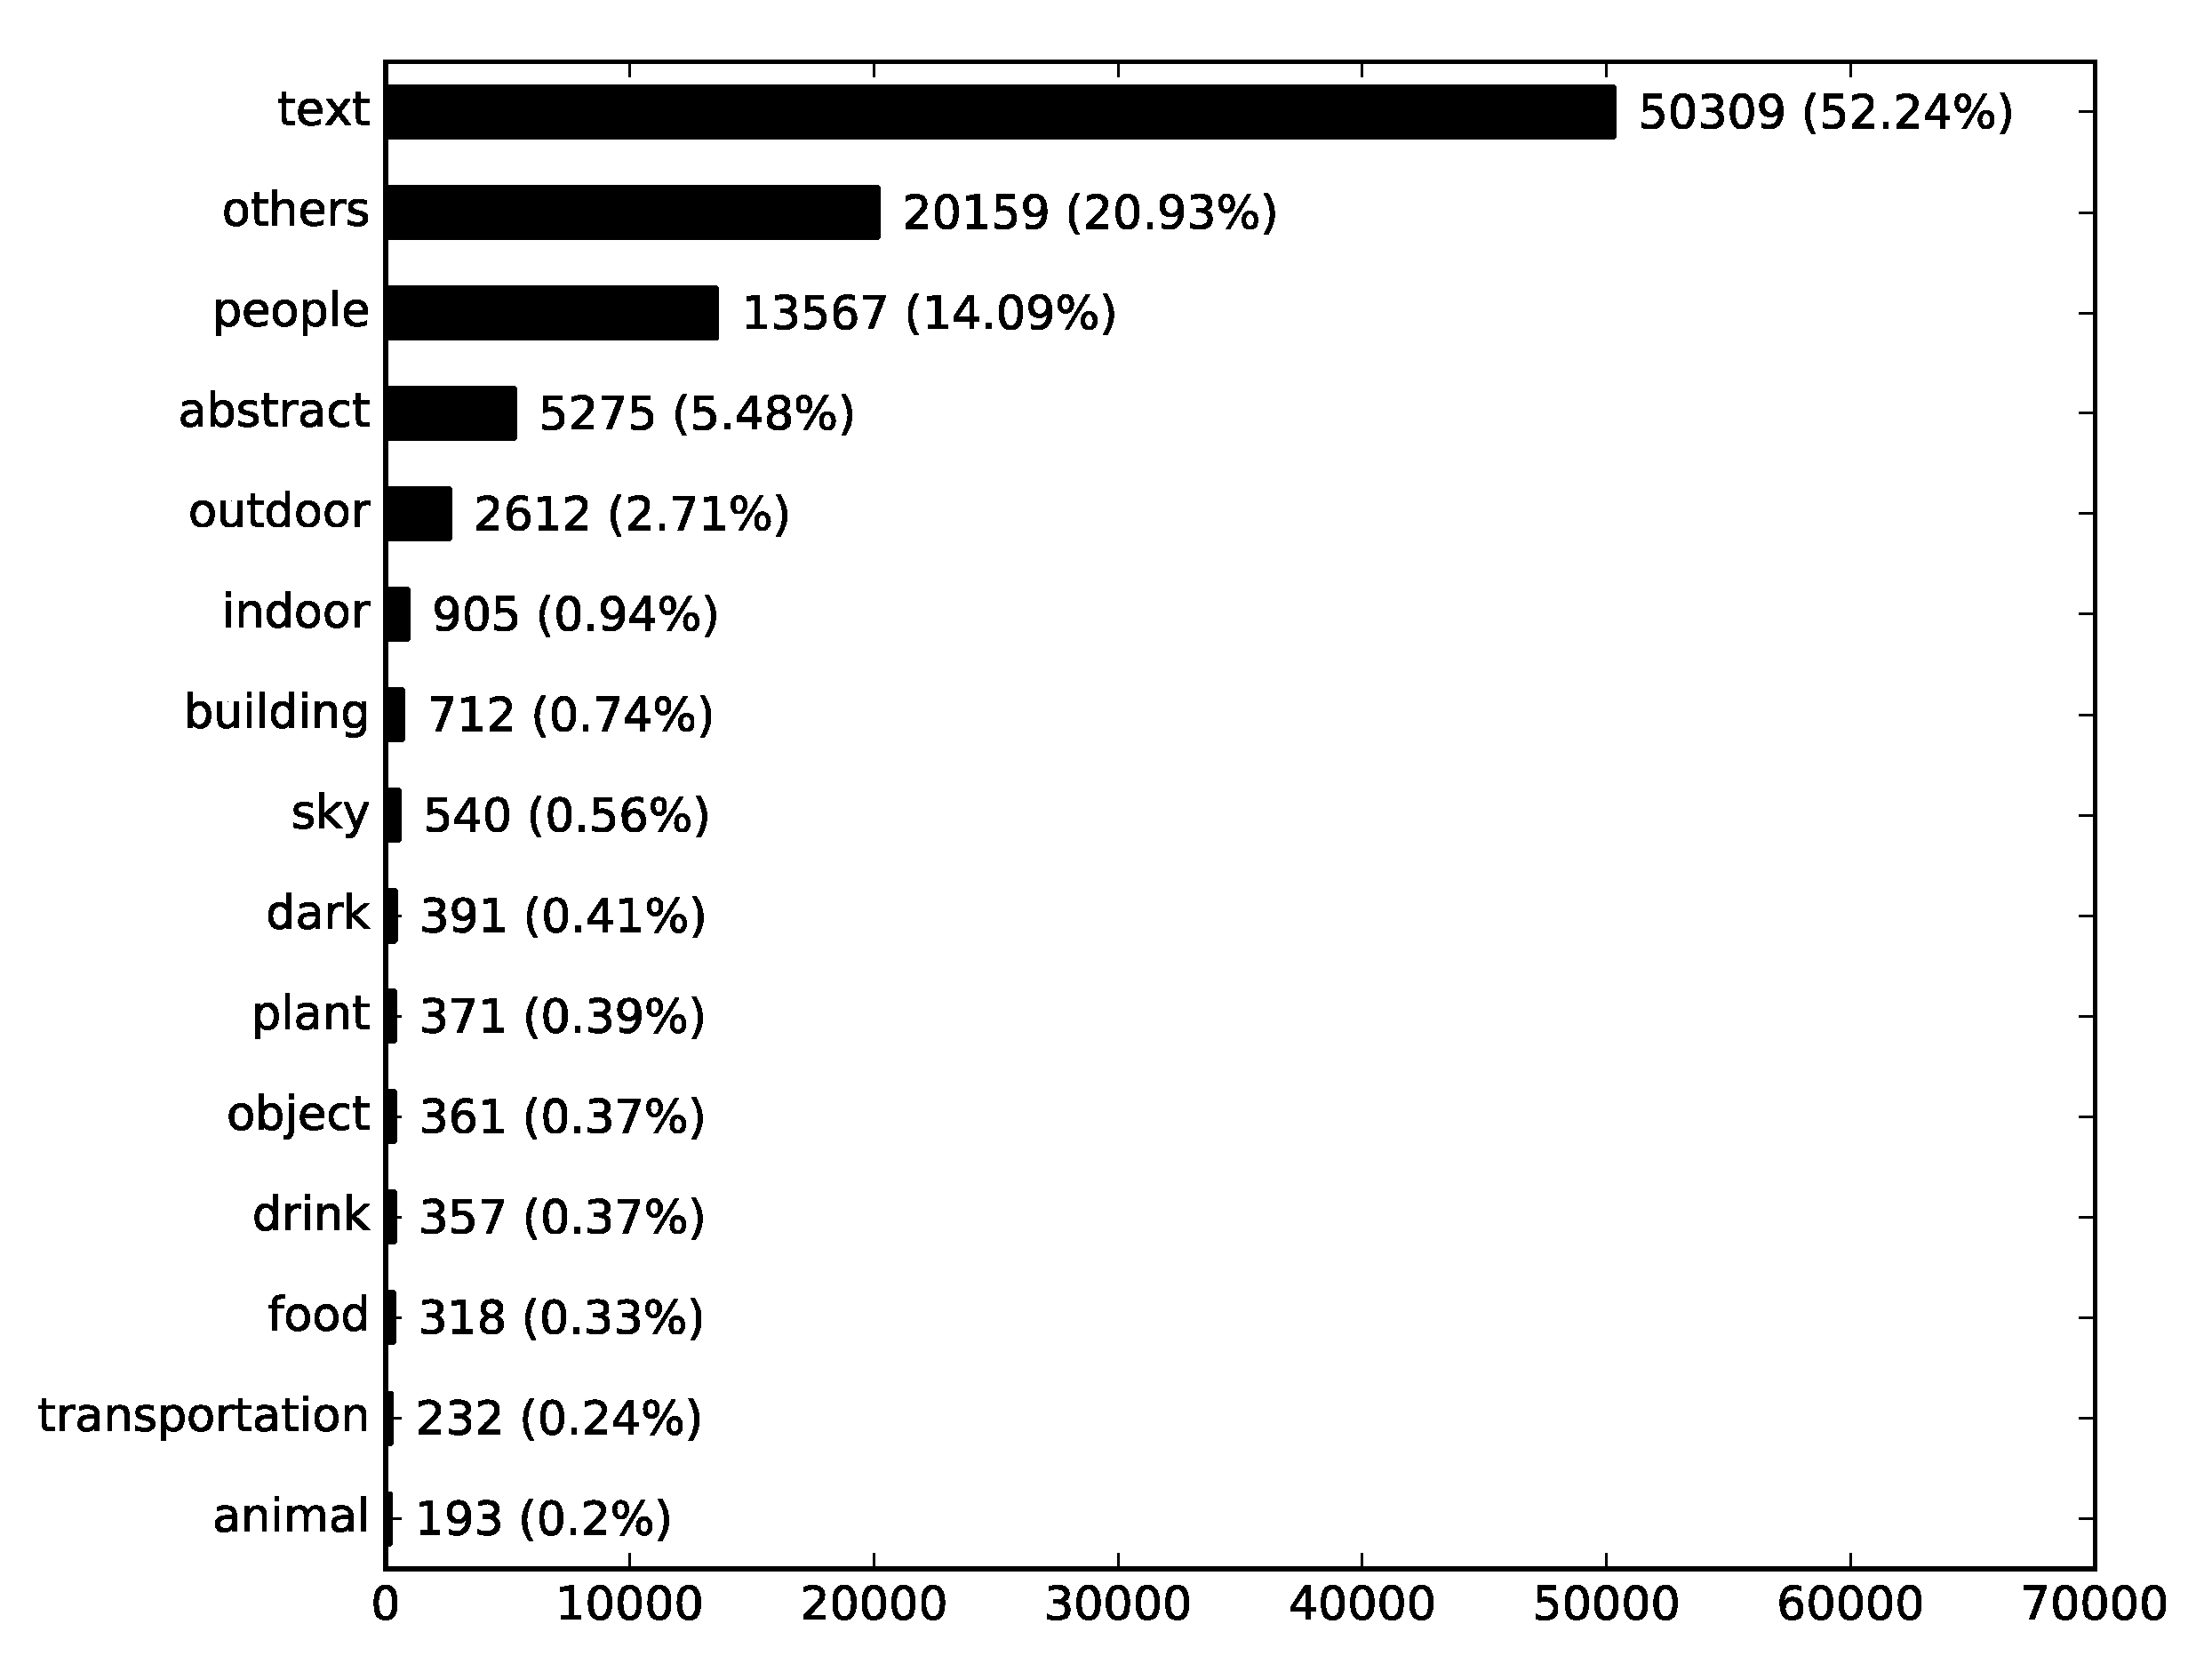
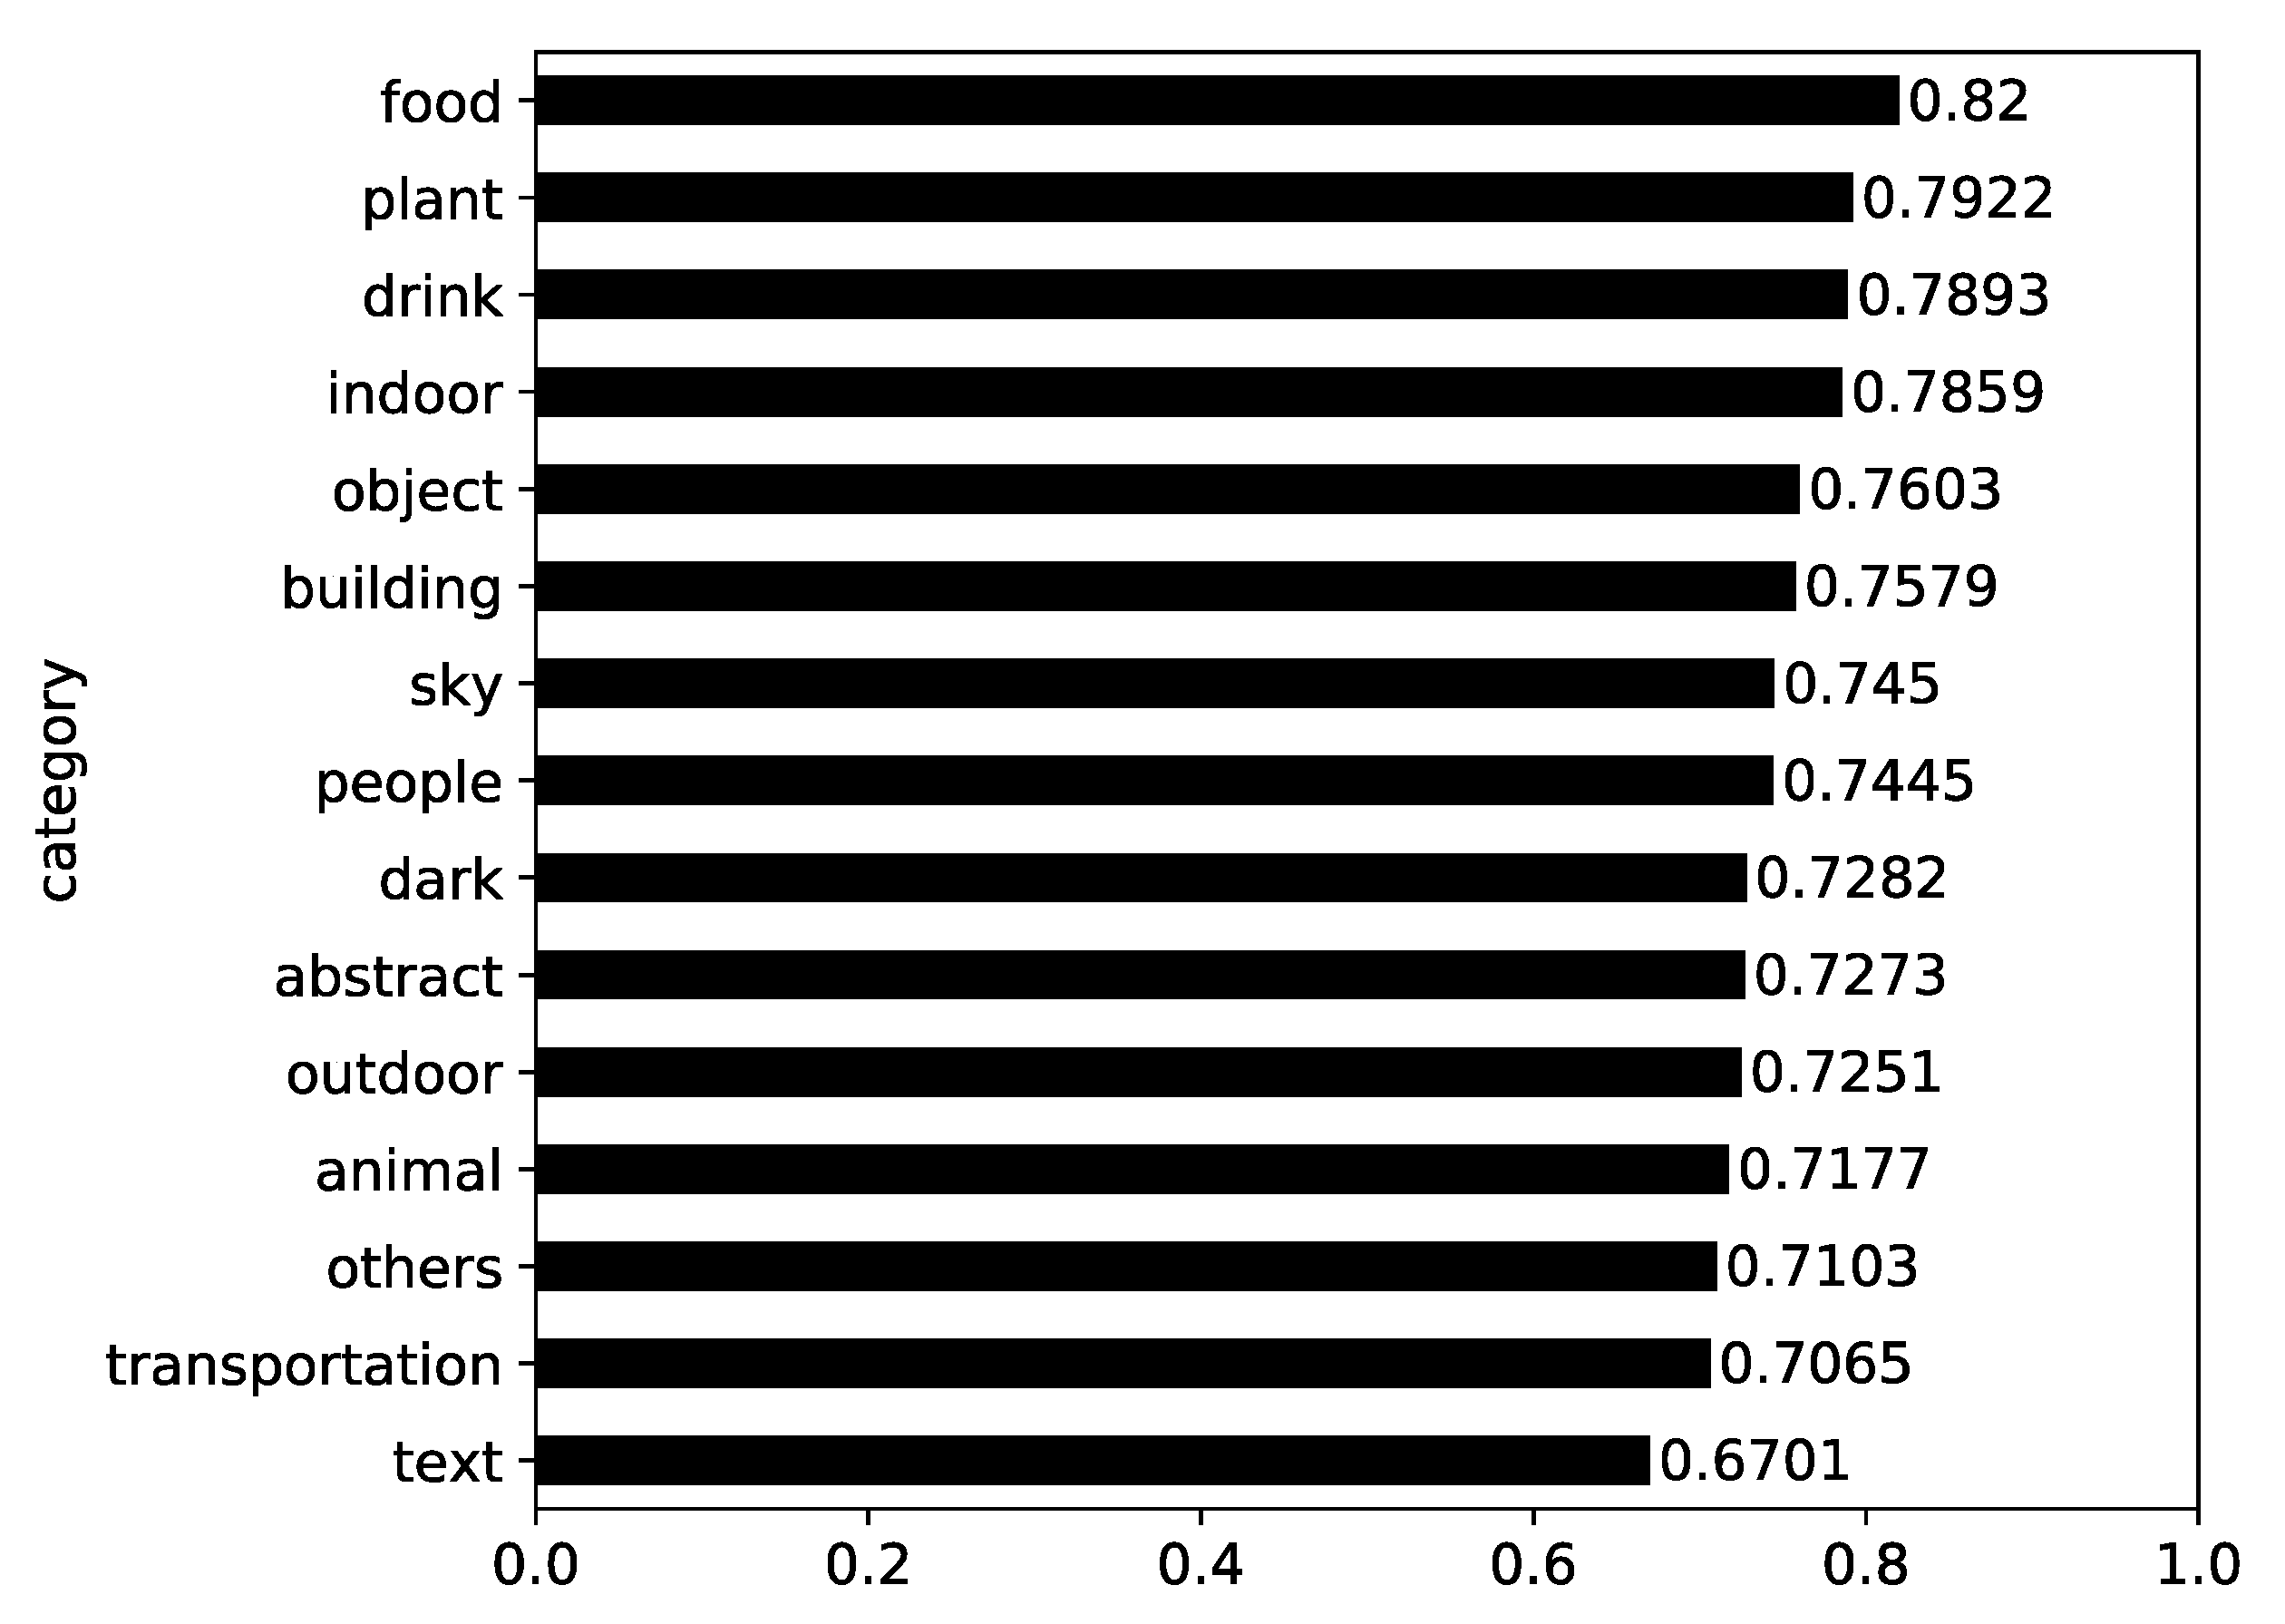
4.1. The Content of Antivaccination Instagram Photos

The frequency of the antivaccination Instagram photos by content category is presented in Figure 1. This shows that “text” photos make up the largest part (52.24%), as more than half of the photos had words on them. And, besides “others” category, “people” photos follow (14.09%).
Considering that “text” photos make up the largest share, the messages delivered by the words on photos (rather than the post text) were examined. The total number of photos from which OCR detected any word was 78,581, and a total of 2,595,259 detected words were analyzed. Since the OCR detects words one by one without contextual information, the detected words were transformed into lowercase without further preprocessing. Punctuation marks and stop words (&; -; 0; 1; 10; 12; 2; 3; 4; 5; 6; a; about; after; am; an; and; are; as; at; b; be; because; been; but; by; c; can; do; e; et; for; from; had; has; have; he; her; his; how; i; if; in; into; is; it; it’s; i’m; just; may; me; more; my; of; on; only; or; our; s; she; should; so; than; that; the; their; them; there; they; this; to; up; us; v; was; we; were; what; when; which; who; why; will; with; would; you; your; —; •) were removed. Here, a custom list of stop words was used, because the results seemed to contain much noise, which may be due to the errors in OCR. The frequency of the remaining words is presented in Figure 2. The figure shows that many words relate to children: “child”, “children”, “kid”, “kids”, and “baby”. It also demonstrates that “autism” was ranked high in the frequency ranking. Detected words such as “doctor” and “dr” stand for the professionals that might be remarked on concerning the antivaccination movement. Words that prohibit actions—“not”, “no”, “never”, and “don’t”—were also observed, and the key issues highlighted were “measles”, “polio”, “flu”, and others.
We also analyzed the text accompanying to the photos for the purpose of comparison. Each post texts were tokenized into words, transformed into lowercase, lemmatized, and had punctuation marks and English stop words (listed at https://gist.github.com/sebleier/554280) removed. The frequency of the remaining words is presented in Figure 3, suggesting that words (including hashtags) that significantly reveal the antivaccine intention, such as “antivax”, “antivaxxer”, “antivaxmemes”, “informedchoice”, and “informedconsent”, appeared in the post texts. It also shows that the words for Uniform Resource Locations (URLs), such as “http”, “com”, and “www”, appeared frequently, as well as those related to children, such as “birth”, “baby”, and “child”. Taking the results from the analysis of OCR and post texts into consideration together, persuading people not to vaccinate through words imprinted on photos including remarks from professionals and providing the source of supporting information in the post text with hashtags of antivaccine intention seems to be the major means of delivering messages in antivaccination movements on Instagram.
In addition, the content tags network was generated and analyzed. First, for each photo, the tags corresponding to the content of the photo were acquired using Computer Vision API from Microsoft Azure Cognitive Services. Next, only tags whose confidence score was greater than or equal to 0.9, which stands for a high degree of correspondence with the photo content, remained. Networks were generated by connecting pairs of tags using a set of criteria defining co-occurrence—for example, if tag A and tag B were suggested by Computer Vision API with a confidence score of over 0.9, two tags became the nodes of the network and an undirected, weighted link was placed between the two nodes (see Figure 4). Finally, the network was analyzed. A centrality analysis was conducted to determine the central words using four centrality measures: weighted degree centrality, betweenness centrality, closeness centrality, and eigenvector centrality.
The result in Table 1 suggests that the content of the photos was primarily textual. The words that represent the subject in the photos were mostly “person”, “man”, “woman”, “baby”, and “toddler”, whereas the words that represent the action and the location in the photos were mainly “indoor”, “outdoor”, “wall”, “ground”, “grass”, “clothing”, “smile”, and “sitting”. In addition, community detection was conducted using the Louvain algorithm [84] to detect the main themes of the content tag network. The result is presented in Table 2. It suggests that the major themes in the content tag network were text and joy, personal and indoor life, and medical issues.

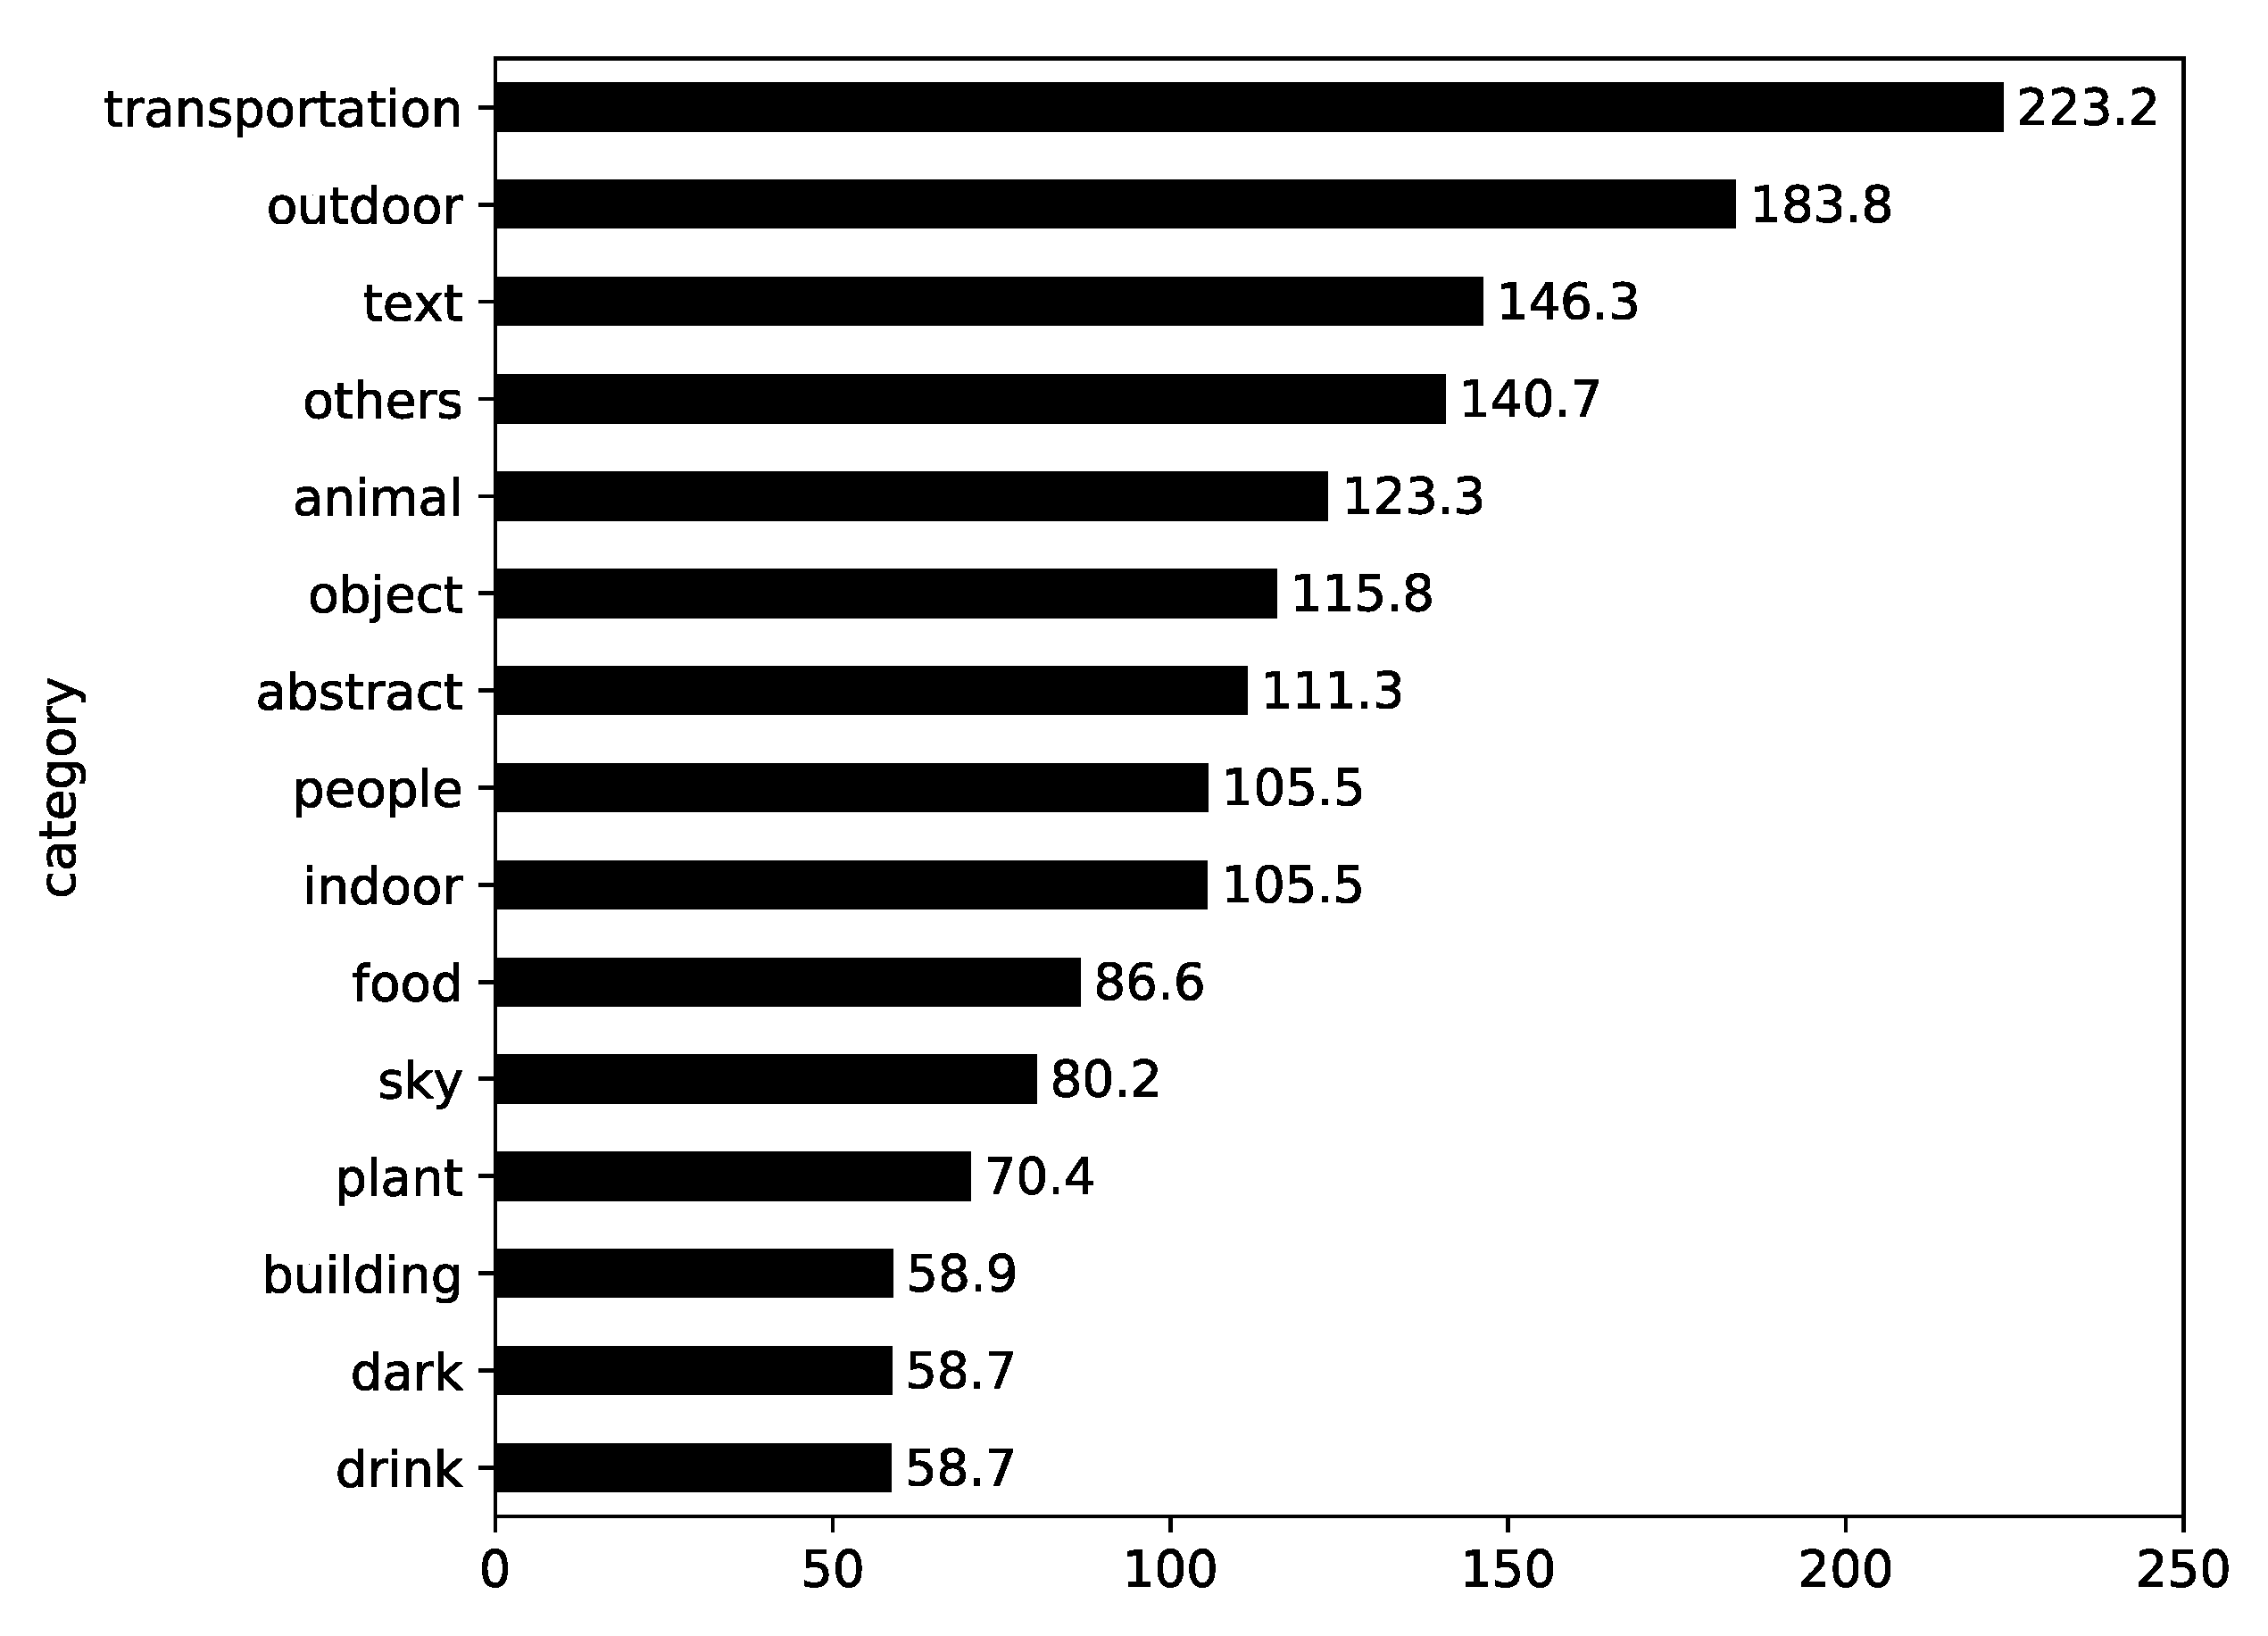
4.2. Photo Features and Engagement of Antivaccination Instagram Photos

First, the mean engagement by content category was investigated. In Figure 5, it is shown that Instagram photos that were categorized into “transportation” and “outdoor” induced the most public engagement, and that photos in the “text” category were also relatively high in terms of mean engagement. The degrees of engagement differed by content category (F = 4.043, p < 0.001).
Next, the association between photo features and engagement was examined, and the results are presented in Table 3. From the table, we can observe that most face features were not associated with engagement; yet, the exceptions were age and neutral, as photos that contained faces of older people and those without particular emotion induced more engagement. Moreover, the positive correlation between the number of words and engagement suggests that photos with more imprinted words generate higher engagement. Concerning pixel-level features, the means of red, green, and blue were significantly associated with engagement. We can also observe from the table that photos with splendid color drew less engagement; saturation mean, all color shares (except violet share), and colorfulness were negatively associated with engagement. In contrast, brighter photos induced more engagement, as value mean and brightness were positively correlated with engagement. The affections from the PAD model showed significant associations; pleasure was positively correlated with engagement, whereas arousal and dominance were negatively associated with it.
Finally, predictive models were built and analyzed to investigate how accurately photo features predict engagement. Support vector regression models were trained with 10-fold cross validation, and their root mean square errors (RMSEs) are presented in Table 4. Considering the means and standard deviations of likes (M = 130.624, SD = 891.051), comments (M = 5.334, SD = 22.644), and engagement (M = 135.958, SD = 901.344), we can conclude that the RMSEs are relatively small and that photo features have an acceptable level of predictability in terms of engagement.

4.3. Photo Features and Comment Sentiment of Antivaccination Instagram Photos

First, the mean comment sentiments by content category were investigated. In Figure 6, it is shown that the photos categorized into “food” and “plant” received the most positive comments from the public. Furthermore, we can observe from the figure that the comments on the photos in all categories were positive (above 0.5), although it must be noted that the photos in the “text” category, which were largest in number and ranked high in mean engagement, registered the least positive comment sentiment. The comment sentiments differed by content category (F = 85.546, p < 0.001).
Next, we examined the association between photo features and comment sentiment, and the results are displayed in Table 5, which shows that most face features were significantly associated with comment sentiment rather than engagement. The number of faces, age, and female showed positive correlations with the comment sentiment. Moreover, it is observed that happiness was positively associated with it, whereas most negative and neutral emotions—disgust, fear, sadness, surprise, and neutral—were negatively associated with comment sentiment. The negative correlation between the number of words and comment sentiment suggests that photos with more words on them have comments with more negative sentiment; this result is also opposed to the one obtained in the analysis of photo features and engagement. Concerning pixel-level features, the means and variances of red, green, and blue were significantly associated with comment sentiment. In the case of means, the associations were negative, which was the opposite in engagement. From the table, we can also observe that photos with splendid color induced more positive comments from the public, as the saturation mean, all color shares (except the blue share and violet share), and colorfulness were positively associated with comment sentiment. In contrast, brighter photos drew more negative comments, as the value mean and brightness were negatively correlated with the comment sentiment. The affections from the PAD model showed significant associations; pleasure was negatively associated with comment sentiment, and arousal and dominance were positively associated with it. This was also opposite in engagement. The positive correlation of hue peaks suggests that photos that feel mussier had more positive comments, and the visual features showed significant associations with comment sentiment—naturalness and sharpness were positively associated with comment sentiment, and contrast and RGB contrast were negatively associated with it.
Finally, predictive models were built and analyzed to investigate how accurately the photo features predict comment sentiment. Support vector regression models were trained with 10-fold cross validation and their RMSEs are presented in Table 6. Considering the means and standard deviations of the comment sentiment (M = 0.699, SD = 0.251), we can conclude that the RMSEs are relatively large and that the predictability of photo features on comment sentiment is unsatisfactory.

5. Discussion

The share of social media posts in photo form has been increasing dramatically, and this is also the case in hashtag activism. Hashtags, which manifest thoughts and feelings clearly and concisely, originated on Twitter, where the length of a message is limited, but their use has been expanded to other social media services, including Instagram. Hashtags, which make it easy to find and express support for posts of interest, have been widely used for online activism, but hashtag activism in photo form has been relatively understudied. This study analyzed Instagram photos with antivaccination hashtags as an example of hashtag activism through photos. In addition, we examined how the photo features were related to public response, which was manifested via engagement and comment sentiment. The major findings and discussions about them are as follows.
First, the photos that were categorized into “text” took the largest share (more than half) among Instagram photos with antivaccination hashtags. This indicates that, while antivaccination posts were uploaded on the photo-centric platform, the photos manifested their idea mainly through the text imprinted on them. One may argue that this is not the best way to exploit the potential of the photographic medium, and that using a photo-centric platform then becomes meaningless. Yet, this can be an efficient way of using the characteristics of visual data, because texts imprinted on photos usually draw attention more easily due to their large size and variety in color and font.
Next, the primary means of delivering messages in antivaccination Instagram posts was found to be imprinting key messages persuading people not to vaccinate through words imprinted on the photos, including remarks from professionals, and providing the source of more information in the post text with hashtags of antivaccine intention. The results revealed that the photos contained words that refer to professionals and that prohibit actions, as well as showing words linked to URLs. Combining the above results, citing remarks from professionals on the photo-imprinted text can be an effective strategy of persuasion, because it can make the content look more convincing. Putting the key messages in the text imprinted on photos and the source of detailed information in the post text separately can also be effective, making it easier to reach the source via hyperlinks in the post text.
Concerning public responses, engagement and comment sentiment appeared to be separate domains, revealing different responses. The photos in the “text” category ranked relatively high in mean engagement but induced the least positive comments among all categories of photos. The more words imprinted on photos, the higher the level of engagement the photos induced, but the less positive comments they had. Photo features which had an insignificant correlation with engagement showed significant associations with comment sentiment (for example, a part of face features), and the directions of correlation tended to be the opposite in the case of photo features that had a significant correlation with both engagement and comment sentiment (for example, a part of pixel and visual features). Moreover, the predictability of photo features was different in terms of engagement and comment sentiment: the former was predictable by photo features with acceptable accuracy, while the latter was not. These results suggest that messages can be designed differently depending on whether they aim to obtain more likes and comments or to induce more positive responses from the public.
Finally, some of the low-level features (pixel and visual features) showed significant correlations with public responses. The features whose high values made the colors of photos splendid were negatively associated with engagement, but those whose high values make photos look bright were positively correlated with engagement. The opposite must be noted regarding comment sentiment, as discussed in the above; the features whose high values would make the colors of photos splendid were positively associated with comment sentiment, but those whose high values made photos look bright were negatively correlated with comment sentiment. These results suggest that photos with particular low-level characteristics can appeal more to the public, and that activists ought to have this in mind when aiming to use photos as their medium.
Concerning antivaccination movements, it needs to be noted that it can be considered as disinformation based on conspiracy theories, hoaxes, and rumors. It is not only an example of confirmation bias in social media but also disorienting public opinion or generating noise. Thus, it should be warned equally against the side-effects of social media that enable connections among only like-minded people and social activities based on anti-social norms. The combination of these two threats would cause serious harm to individuals’ health as well as to society at large. In this regard, future studies will have to explore the motivation, context, and personal experiences concerning why social media users are engaged in these confirmation biases in general and the antivaccination movement in particular. Additionally, we can investigate in future studies how the word difference (e.g., scientific vs. emotional words [85,86]) in social media posts would influence the response from the public.
The major implication of this study is that it investigated how photos are used for hashtag activism. Despite their rapidly growing share in social media data and the increasing role they have been playing in online communication, visual materials have drawn relatively little attention from researchers of online activism. This study tackled the issue of using Instagram photos for hashtag activism and contributes to the body of literature by extending the research domain. Furthermore, it examined the content of antivaccination Instagram photos and revealed the characteristics of their way of delivering messages. In addition, this study showed that public responses to antivaccination Instagram photos can be manifested in two domains—engagement and comment sentiment—which can be different to each other. It can also be meaningful with regard to the photo features that were used for the analysis; low-level (pixel-level features) features as well as high-level (content-level) features can be a useful route through which implicit information can be conveyed, and analyzing them can produce other kinds of results than those generated by content analysis. A major limitation of this study is that it dealt with only one instance of hashtag activism. The approach used in this study is expected to be extended to analyze other hashtag activisms of various kinds—particularly those through photos—by comparing them with one another.

6. Conclusions

The aim of the present research was to analyze Instagram photos with antivaccination hashtags as an example of hashtag activism through photos and examine how the photo features were related to the public response, which was manifested via engagement and comment sentiment. This study identified that the photos categorized as “text” took the largest share. It was also found that the major way of delivering messages was to imprint the key messages that persuade people not to vaccinate with remarks from professionals on the photos and provide a source of complementary information in the post text with hashtags of antivaccine intention. Various photo features showed associations with engagement and comment sentiment, but the directions of correlation were usually the opposite: these results suggest that engagement and comment sentiment were separate domains that revealed the different public responses.

Author Contributions

Conceptualization, Y.K.; methodology, Y.K.; software, D.S.; writing—original draft preparation, Y.K.; writing—review and editing, Y.K.; visualization, D.S.; supervision, Y.J.L.; funding acquisition, Y.J.L. All authors have read and agreed to the published version of the manuscript.

Funding

This work was supported by NRF-2017R1E1A1A03071025 through the National Research Foundation of Korea (NRF) grant funded by the Ministry of Education, Science and Technology.

Conflicts of Interest

The authors declare no conflict of interest.

References

  1. Bruns, A.; Stieglitz, S. Towards more systematic Twitter analysis: Metrics for tweeting activities. Int. J. Soc. 2013, 16, 91–108. [Google Scholar]
  2. Dadas, C. Hashtag activism: The promise and risk of “attention”. In Social Writing/Social Media: Publics, Presentations, Pedagogies; Walls, D.M., Vie, S., Eds.; The WAC Clearinghouse and University Press of Colorado: Fort Collins, CO, USA, 2018; pp. 17–36. [Google Scholar]
  3. Bruns, A.; Moon, B.; Paul, A.; Münch, F. Towards a typology of hashtag publics: A large-scale comparative study of user engagement across trending topics. Commun. Res. Pract. 2016, 2, 20–46. [Google Scholar] [CrossRef]
  4. Anderson, M.; Toor, S.; Rainie, L.; Smith, A. Activism in the Social Media Age; Pew Research Center: Washington, DC, USA, 2018. [Google Scholar]
  5. Crandall, H.; Cunningham, C.M. Media ecology and hashtag activism: Kaleidoscope. Explor. Media Ecol. 2016, 15, 21–32. [Google Scholar] [CrossRef]
  6. Kowald, D.; Lex, E. Studying confirmation bias in hashtag usage on Twitter. arXiv 2018, arXiv:1809.03203. Available online: https://arxiv.org/pdf/1809.03203.pdf (accessed on 17 October 2020).
  7. Lai, M.; Bosco, C.; Patti, V.; Virone, D. Debate on political reforms in Twitter: A hashtag-driven analysis of political polarization. In Proceedings of the 2015 IEEE International Conference on Data Science and Advanced Analytics (DSAA), Paris, France, 19–21 October 2015. [Google Scholar]
  8. Weber, I. Political polarization of web search queries and hashtags. SIGWEB Newsl. 2013, 56, 1–10. [Google Scholar] [CrossRef]
  9. Salathé, M.; Khandelwal, S. Assessing vaccination sentiments with online social media: Implications for infectious disease dynamics and control. PLoS Comput. Biol. 2011, 7, e1002199. [Google Scholar] [CrossRef] [PubMed] [Green Version]
  10. Radzikowski, J.; Stefanidis, A.; Jacobsen, K.H.; Croitoru, A.; Crooks, A.; Delamater, P.L. The Measles vaccination narrative in Twitter: A quantitative analysis. JMIR Public Health Surveill. 2016, 2, e1. [Google Scholar] [CrossRef] [PubMed]
  11. Jenkins, M.C.; Moreno, M.A. Vaccination discussion among parents on social media: A content analysis of comments on parenting blogs. J. Health Commun. 2020, 25, 232–242. [Google Scholar] [CrossRef] [PubMed]
  12. Fung, I.C.-H.; Blankenship, E.B.; Ahweyevu, J.O.; Cooper, L.K.; Duke, C.H.; Carswell, S.L.; Jackson, A.M.; Jenkins, J.C.; Duncan, E.A.; Liang, H.; et al. Public health implications of image-based social media: A systematic review of Instagram, Pinterest, Tumblr, and Flickr. Perm. J. 2020, 24, 307. [Google Scholar]
  13. Kim, Y.; Kim, J.H. Using photos for public health communication: A computational analysis of the Centers for Disease Control and Prevention Instagram photos and public responses. J. Health Inform. 2020, 26, 2159–2180. [Google Scholar] [CrossRef]
  14. Nobles, A.L.; Leas, E.C.; Noar, S.; Dredze, M.; Latkin, C.A.; Strathdee, S.A.; Ayers, J.W. Automated image analysis of Instagram posts: Implications for risk perception and communication in public health using a case study of #HIV. PLoS ONE 2020, 15, e0231155. [Google Scholar]
  15. Park, H.; Reber, B.H.; Chon, M.G. Tweeting as health communication: Health organizations’ use of Twitter for health promotion and public engagement. J. Health Commun. 2015, 21, 188–198. [Google Scholar] [CrossRef] [PubMed]
  16. Yi-Frazier, J.P.; Cochrane, K.; Mitrovich, C.; Pascual, M.; Buscaino, E.; Eaton, L.; Panlasigui, N.; Clopp, B.; Malik, F. Using Instagram as a modified application of photovoice for storytelling and sharing in adolescents with type 1 diabetes. Qual. Health Res. 2015, 25, 1372–1382. [Google Scholar] [CrossRef]
  17. Seltzer, E.K.; Horst-Martz, E.; Lu, M.; Merchant, R.M. Public sentiment and discourse about Zika virus on Instagram. Public Health 2017, 150, 170–175. [Google Scholar] [CrossRef]
  18. Fung, I.C.-H.; Blankenship, E.B.; Goff, M.E.; Mullican, L.A.; Chan, K.C.; Saroha, N.; Duke, C.H.; Eremeeva, M.E.; Fu, K.W.; Tse, Z.T.H. Zika-virus-related photo sharing on Pinterest and Instagram. Disaster Med. Public 2017, 11, 656–659. [Google Scholar] [CrossRef] [PubMed]
  19. Cho, H.; Silver, N.; Na, K.; Adams, D.; Luong, K.T.; Song, C. Visual cancer communication on social media: An examination of content and effects of #melanomasucks. J. Med. Internet Res. 2018, 20, e10501. [Google Scholar] [PubMed]
  20. Chu, K.H.; Allem, J.P.; Cruz, T.B.; Unger, J.B. Vaping on Instagram: Cloud chasing, hand checks and product placement. Tob. Control 2016, 26, 575–578. [Google Scholar] [CrossRef]
  21. Lee, A.S.; Hart, J.L.; Sears, C.G.; Walker, K.L.; Siu, A.; Smith, C. A picture is worth a thousand words: Electronic cigarette content on Instagram and Pinterest. Tob. Prev. Cessation 2017, 3, 119. [Google Scholar] [CrossRef]
  22. Laestadius, L.I.; Wahl, M.M.; Cho, Y.I. #Vapelife: An exploratory study of electronic cigarette use and promotion on Instagram. Subst. Use Misuse 2016, 51, 1669–1673. [Google Scholar]
  23. Allem, J.P.; Escobedo, P.; Chu, K.H.; Boley Cruz, T.; Unger, J.B. Images of little cigars and cigarillos on Instagram identified by the hashtag #swisher: Thematic analysis. J. Med. Internet Res. 2017, 19, e255. [Google Scholar]
  24. Cohen, R.; Irwin, L.; Newton-John, T.; Slater, A. #bodypositivity: A content analysis of body positive accounts on Instagram. Body Image 2019, 29, 47–57. [Google Scholar] [PubMed]
  25. Pilgrim, K.; Bohnet-Joschko, S. Selling health and happiness how influencers communicate on Instagram about dieting and exercise: Mixed methods research. BMC Public Health 2019, 19, 1054. [Google Scholar] [CrossRef] [Green Version]
  26. Brown, R.C.; Fischer, T.; Goldwich, A.D.; Keller, F.; Young, R.; Plener, P.L. #cutting: Non-suicidal self-injury (NSSI) on Instagram. Psychol. Med. 2018, 48, 337–346. [Google Scholar]
  27. Fulcher, J.A.; Dunbar, S.; Orlando, E.; Woodruff, S.J.; Santarossa, S. #selfharn on Instagram: Understanding online communities surrounding non-suicidal self-injury through conversations and common properties among authors. Digital Health 2020, 6. [Google Scholar] [CrossRef]
  28. Hendriks, H.; Van den Putte, B.; Gebhardt, W.A.; Moreno, M.A. Social drinking on social media: Content analysis of the social aspects of alcohol-related posts on Facebook and Instagram. J. Med. Internet Res. 2018, 20, e226. [Google Scholar] [CrossRef] [Green Version]
  29. Vassallo, A.J.; Kelly, B.; Zhang, L.; Wang, Z.; Young, S.; Freeman, B. Junk food marketing on Instagram: Content analysis. JMIR Public Health Surveill. 2018, 4, e54. [Google Scholar] [CrossRef]
  30. Oviatt, J.R.; Reich, S.M. Pregnancy posting: Exploring characteristics of social media posts around pregnancy and user engagement. mHealth 2019, 5, 46. [Google Scholar] [CrossRef] [PubMed]
  31. Buyuk, S.K.; Imamoglu, T. Instagram as a social media tool about orthognathic surgery. Health Promot. Perspect. 2019, 9, 319–322. [Google Scholar] [CrossRef] [PubMed]
  32. Bonilla, Y.; Rosa, J. #Ferguson: Digital protest, hashtag ethnography, and the racial politics of social media in the United States. Am. Ethnol. 2015, 42, 4–17. [Google Scholar]
  33. Yang, G. Narrative agency in hashtag activism: The case of #BlackLivesMatter. Media Commun. 2016, 4, 13–17. [Google Scholar]
  34. Clark, R. “Hope in a hashtag”: The discursive activism of #WhyIStayed. Fem. Media Stud. 2016, 16, 788–804. [Google Scholar]
  35. Kim, J. #iamafeminist as the “mother tag”: Feminist identification and activism against misogyny on Twitter in South Korea. Fem. Media Stud. 2017, 17, 804–820. [Google Scholar]
  36. Fischer, M. #Free_CeCe: The material convergence of social media activism. Fem. Media Stud. 2016, 16, 755–771. [Google Scholar]
  37. Ramírez, B.G.; Metcalfe, A.S. Hashtivism as public discourse: Exploring online student activism in response to state violence and forced disappearances in Mexico. Res. Educ. 2017, 97, 56–75. [Google Scholar] [CrossRef]
  38. Krutka, D.G.; Asino, T.I.; Haselwood, S. Editorial: Eight lessons on networked teacher activism from #OklaEd and the #OklaEdWalkout. CITE 2018, 18, 379–391. [Google Scholar]
  39. Papacharissi, Z.; de Fatima Oliveira, M. Affective news and networked publics: The rhythms of news storytelling on #Egypt. J. Commun. 2012, 62, 266–282. [Google Scholar]
  40. Giglietto, F.; Lee, Y. A hashtag worth a thousand words: Discursive strategies around #JeNeSuisPasCharlie after the 2015 Charlie Hebdo shooting. SM+S 2017, 3. [Google Scholar] [CrossRef] [Green Version]
  41. Brown, M.; Ray, R.; Summers, E.; Fraistat, N. #SayHerName: A case study of intersectional social media activism. Ethn. Racial Stud. 2017, 40, 1831–1846. [Google Scholar]
  42. Xiong, Y.; Cho, M.; Boatwright, B. Hashtag activism and message frames among social movement organizations: Semantic network analysis and thematic analysis of Twitter during the #MeToo movement. Public Relat. Rev. 2019, 45, 10–23. [Google Scholar]
  43. Ince, J.; Rojas, F.; Davis, C.A. The social media response to Black Lives Matter: How Twitter users interact with Black Lives Matter through hashtag use. Ethn. Racial Stud. 2017, 40, 1814–1830. [Google Scholar] [CrossRef]
  44. Ray, R.; Brown, M.; Fraistat, N.; Summers, E. Ferguson and the death of Michael Brown on Twitter: #BlackLivesMatter, #TCOT, and the evolution of collective identities. Ethn. Racial Stud. 2017, 40, 1797–1813. [Google Scholar]
  45. Drüeke, R.; Zobl, E. Online feminist protest against sexism: The German-language hashtag #aufschrei. Fem. Media Stud. 2016, 16, 35–54. [Google Scholar]
  46. Xu, W.W.; Sang, Y.; Blasiola, S.; Park, H.W. Predicting opinion leaders in Twitter activism networks. Am. Behav. Sci. 2014, 58, 1278–1293. [Google Scholar] [CrossRef]
  47. Jackson, S.J.; Foucault Welles, B. #Ferguson is everywhere: Initiators in emerging counterpublic networks. Inf. Commun. Soc. 2016, 19, 397–418. [Google Scholar]
  48. Yan, G.; Pegoraro, A.; Watanabe, N.M. Student-athletes’ organization of activism at the University of Missouri: Resource mobilization on Twitter. J. Sport Manag. 2018, 32, 24–37. [Google Scholar] [CrossRef]
  49. Wang, R.; Liu, W.; Gao, S. Hashtags and information virality in networked social movement. Online Inf. Rev. 2016, 40, 850–866. [Google Scholar] [CrossRef]
  50. Tremayne, M. Anatomy of protest in the digital era: A network analysis of Twitter and Occupy Wall Street. Soc. Mov. Stud. 2014, 13, 110–126. [Google Scholar] [CrossRef]
  51. Stefanone, M.A.; Saxton, G.D.; Egnoto, M.J.; Wei, W.; Fu, Y. Image attributes and diffusion via Twitter: The case of #guncontrol. In Proceedings of the 48th Hawaii International Conference on System Sciences, Kauai, HI, USA, 5–8 January 2015; pp. 1788–1797. [Google Scholar]
  52. Ichau, E.; Frissen, T.; d’Haenens, L. From #selfie to #edgy. Hashtag networks and images associated with the hashtag #jews on Instagram. Telemat. Inform. 2019, 44, 101275. [Google Scholar]
  53. Witteman, H.O.; Zikmund-Fisher, B.J. The defining characteristics of Web 2.0 and their potential influence in the online vaccination debate. Vaccine 2012, 30, 3734–3740. [Google Scholar] [CrossRef]
  54. Connolly, T.; Reb, J. Toward interactive, Internet-based decision aid for vaccination decisions: Better information alone is not enough. Vaccine 2012, 30, 3813–3818. [Google Scholar] [CrossRef]
  55. Betsch, C.; Brewer, N.T.; Brocard, P.; Davies, P.; Gaissmaier, W.; Haase, N.; Leask, J.; Renkewitz, F.; Renner, B.; Reyna, V.F.; et al. Opportunities and challenges of Web 2.0 for vaccination decisions. Vaccine 2012, 30, 3727–3733. [Google Scholar] [CrossRef] [Green Version]
  56. Meppelink, C.S.; Smit, E.G.; Fransen, M.L.; Diviani, N. “I was right about vaccination”: Confirmation bias and health literacy in online health information seeking. J. Health Commun. 2019, 24, 129–140. [Google Scholar] [CrossRef] [Green Version]
  57. Amicizia, D.; Domnich, A.; Gasparini, R.; Bragazzi, N.L.; Lai, P.L.; Panatto, D. An overview of current and potential use of information and communication technologies for immunization promotion among adolescents. Hum. Vaccines Immunother. 2013, 9, 2634–2642. [Google Scholar] [CrossRef] [PubMed] [Green Version]
  58. Keelan, J.; Pavri, V.; Balakrishnan, R.; Wilson, K. An analysis of the Human Papilloma Virus vaccine debate on MySpace blogs. Vaccine 2010, 28, 1535–1540. [Google Scholar] [CrossRef]
  59. Broniatowski, D.A.; Jamison, A.M.; Qi, S.; AlKulaib, L.; Chen, T.; Benton, A.; Quinn, S.C.; Dredze, M. Weaponized health communication: Twitter bots and Russian trolls amplify the vaccine debate. Am. J. Public Health 2018, 108, 1378–1384. [Google Scholar] [CrossRef] [PubMed]
  60. Jang, S.M.; Mckeever, B.W.; Mckeever, R.; Kim, J.K. From social media to mainstream news: The information flow of the vaccine-autism controversy in the US, Canada, and the UK. Health Commun. 2019, 34, 110–117. [Google Scholar] [CrossRef]
  61. Yuan, X.; Schuchard, R.J.; Crooks, A.T. Examining emergent communities and social bots within the polarized online vaccination debate in Twitter. SM+S 2019, 5. [Google Scholar] [CrossRef] [Green Version]
  62. Himelboim, I.; Xiao, X.; Lee, D.K.L.; Wang, M.Y.; Borah, P. A social networks approach to understanding vaccine conversations on Twitter: Network clusters, sentiment, and certainty in HPV social networks. Health Commun. 2020, 35, 607–615. [Google Scholar] [CrossRef] [PubMed]
  63. Johnson, N.F.; Velásquez, N.; Restrepo, N.J.; Leahy, R.; Gabriel, N.; El Oud, S.; Zheng, M.; Manrique, P.; Wuchty, S.; Lupu, Y. The online competition between pro- and anti-vaccination views. Nature 2020, 582, 230–233. [Google Scholar] [CrossRef]
  64. Francia, M.; Gallinucci, E.; Golfarelli, M. Social BI to understand the debate on vaccines on the Web and social media: Unraveling the anti-, free, and pro-vax communities in Italy. SNAM 2019, 9, 46. [Google Scholar] [CrossRef]
  65. Smith, N.; Graham, T. Mapping the anti-vaccination movement on Facebook. Inf. Commun. Soc. 2019, 22, 1310–1327. [Google Scholar] [CrossRef]
  66. Guidry, J.P.; Carlyle, K.; Messner, M.; Jin, Y. On pins and needles: How vaccines are portrayed on Pinterest. Vaccine 2015, 33, 5051–5056. [Google Scholar] [CrossRef] [PubMed]
  67. Kearney, M.D.; Selvan, P.; Hauer, M.K.; Leader, A.E.; Massey, P.M. Characterizing HPV vaccine sentiments and content on Instagram. Health Educ. Behav. 2019, 46, 37S–48S. [Google Scholar] [CrossRef] [Green Version]
  68. Chen, T.; Dredze, M. Vaccine images on Twitter: Analysis of what images are shared. J. Med. Internet Res. 2018, 20, e130. [Google Scholar] [CrossRef] [PubMed]
  69. Del Sole, A. Microsoft Computer Vision APIs Distilled: Getting Started with Cognitive Services; Apress: Berkeley, CA, USA, 2018. [Google Scholar]
  70. Bradski, G. The OpenCV library. DDJST 2000, 120, 122–125. [Google Scholar]
  71. Kim, Y.; Kim, J.H. Using computer vision techniques on Instagram to link users’ personalities and genders to the features of their photos: An exploratory study. Inform. Process Manag. 2018, 54, 1101–1114. [Google Scholar] [CrossRef]
  72. Ke, Y.; Tang, X.; Jing, F. The design of high-level features for photo quality assessment. In Proceedings of the 2006 IEEE Computer Society Conference on Computer Vision and Pattern Recognition, New York, NY, USA, 17–22 June 2006; pp. 419–426. [Google Scholar]
  73. Mao, X.; Chen, B.; Muta, I. Affective property of image and fractal dimension. Chaos Soliton Fract. 2003, 15, 905–910. [Google Scholar] [CrossRef]
  74. Valdez, P.; Mehrabian, A. Effects of color on emotions. J. Exp. 1994, 123, 394–409. [Google Scholar] [CrossRef]
  75. San Pedro, J.; Siersdorfer, S. Ranking and classifying attractiveness of photos in folksonomies. In Proceedings of the 18th international conference on World Wide Web (WWW ‘09), Madrid, Spain, 20–24 April 2009; pp. 771–780. [Google Scholar]
  76. Hasler, D.; Süsstrunk, S. Measuring colorfulness in natural images. In Human Vision and Electronic Imaging VIII; Rogowitz, B.E., Pappas, T.N., Eds.; International Society for Optics and Photonics: Bellingham, WA, USA, 2003; pp. 87–95. [Google Scholar]
  77. Huang, K.Q.; Wang, Q.; Wu, Z.Y. Natural color image enhancement and evaluation algorithm based on human visual system. Comput. Vis. Image Underst. 2006, 103, 52–63. [Google Scholar] [CrossRef]
  78. Savakis, A.E.; Etz, S.P.; Loui, A.C. Evaluation of image appeal in consumer photography. In Human Vision and Electronic Imaging V; Rogowitz, B.E., Pappas, T.N., Eds.; SPIE–IS&T: San Jose, CA, USA, 2000; pp. 110–120. [Google Scholar]
  79. Feng, J.; Lin, W.C.; Chen, C.T. Fractional box-counting approach to fractal dimension estimation. In Proceedings of the 13th International Conference on Pattern Recognition, Vienna, Austria, 25–29 August 1996; pp. 854–858. [Google Scholar]
  80. Kim, D.; Son, S.W.; Jeong, H. Large-scale quantitative analysis of painting arts. Sci. Rep. 2014, 4, 7370. [Google Scholar] [CrossRef] [Green Version]
  81. Moon, P.; Spencer, D.E. Geometric formulation of classical color harmony. J. Opt. Soc. Am. B 1944, 34, 46. [Google Scholar] [CrossRef]
  82. Datta, R.; Joshi, D.; Li, J.; Wang, J.Z. Studying aesthetics in photographic images using a computational approach. In Computer Vision: ECCV 2006; Leonardis, A., Bischof, H., Pinz, A., Eds.; Springer: Berlin/Heidelberg, Germany, 2006; pp. 288–301. [Google Scholar]
  83. Neiger, B.L.; Thackeray, R.; Van Wagenen, S.A.; Hanson, C.L.; West, J.H.; Barnes, M.D.; Fagen, M.C. Use of social media in health promotion: Purposes, key performance indicators, and evaluation metrics. Health Promot. Pract. 2012, 13, 159–164. [Google Scholar] [CrossRef] [PubMed]
  84. Zinoviev, D. Complex Network Analysis in Python; Pragmatic Bookshelf: Raleigh, NC, USA, 2018. [Google Scholar]
  85. Bientzle, M.; Griewatz, J.; Kimmerle, J.; Küppers, J.; Cress, U.; Lammerding-Koeppel, M. Impact of scientific versus emotional wording of patient questions on doctor-patient communication in an internet forum: A randomized controlled experiment with medical students. J. Med. Internet Res. 2015, 17, e268. [Google Scholar] [CrossRef] [Green Version]
  86. Kimmerle, J.; Bientzle, M.; Cress, U. “Scientific evidence is very important for me”: The impact of behavioral intention and the wording of user inquiries on replies and recommendations in a health-related online forum. Comput. Hum. Behav. 2017, 73, 320–327. [Google Scholar] [CrossRef]
Figure 1. Frequency of antivaccination Instagram photos by content category.
Ijerph 17 07550 g001
Figure 2. Top 50 frequent words detected by OCR (Optical Character Recognition) from the antivaccination Instagram photos.
Ijerph 17 07550 g002
Figure 3. Top 50 frequent words in the text accompanying antivaccination Instagram photos.
Ijerph 17 07550 g003
Figure 4. Content tag network of the antivaccination Instagram photos. Node size represents the weighted degree, and nodes with the same color belong to the same subgroup, determined by community detection using the Louvain algorithm. To make it easier to see, only nodes with the top 15% of weighted degree (occupying 95.01% of the total weighted degree) were displayed.
Ijerph 17 07550 g004
Figure 5. Mean engagement by content category.
Ijerph 17 07550 g005
Figure 6. Mean comment sentiment by content category.
Ijerph 17 07550 g006
Table 1. Top 30 central words of the content tag network by weighted degree centrality, betweenness centrality, closeness centrality, and eigenvector centrality.
RankingWeighted DegreeBetweennessClosenessEigenvector
1texttexttexttext
2personpersonpersonperson
3human faceindoorindoorindoor
4screenshotoutdooroutdooroutdoor
5clothingfoodclothingclothing
6indoorclothingwallhuman face
7smilescreenshotfoodwall
8cartoonwallscreenshotman
9outdooranimalhuman facescreenshot
10manfloorgroundwoman
11postergroundskyground
12womantablemansmile
13toddlerskyfloorsky
14babyfashion accessorywomantree
15bookgrassgrassgrass
16wallhuman facetreefloor
17drawingtreetablebook
18designcartoonsmilesitting
19abstractmanbookcartoon
20treewomancartoontoddler
21grasscamerasittingtable
22posingfruitwaterfood
23skyplanttoddlerbaby
24newspaperwaterbabybuilding
25sketchcupanimalfashion accessory
26fooddesignbuildingposter
27handwritingbookfashion accessorygirl
28animalsportposterholding
29childplateholdingchild
30bottlefast fooddesignwater
Table 2. Part of words in subgroups of the content tag network. To make it easier to see, only nodes with the top 10% of weighted degree (occupying 95.01% of the total weighted degree) were included.
ThemeWords
text and joytext, screenshot, cartoon, poster, book, drawing, design, abstract, newspaper, sketch, food, handwriting, animal, bottle, sign, table, carnivore, illustration, child art, dog, soft drink, art, cup, graphic, drink, painting, fast food, mammal, typography, plate, cat, fruit, baked goods, coffee, map, snack, dessert, toy, monitor, billboard, music, cake, bird, letter, tableware, television, vegetable, funny, birthday cake, anime, weapon, green, juice, whiteboard, screen, black, menu, orange, concert, comic, pink, electronics, cocktail, lemon, coffee cup, shelf, tin can, mug, beer, Christmas tree
personal and indoor lifeperson, human face, clothing, indoor, smile, outdoor, man, woman, toddler, baby, wall, tree, grass, posing, sky, child, ground, standing, floor, fashion accessory, suit, glasses, sitting, vehicle, boy, land vehicle, car, water, group, hat, girl, building, little, face, people, footwear, furniture, bed, computer, road, holding, tie, wearing, wheel, selfie, dress, fedora, young, beach, flower, active shirt, eyes, cowboy hat, jeans, sunglasses, t-shirt, shirt, ceiling, black and white, sleeve, couch, laptop, chair, sports equipment, snow, sun hat, kiss, window, plant, vase, dance, goggles, wedding dress, cloud, jacket, swimming, trousers, smiling, presentation, sofa, laying, sport, sports uniform, bride, mountain, auto part, bicycle, helmet, swimwear, soccer, ball, field, shorts, bicycle wheel, ship, red, nature, lake, top, street, fashion, bathroom, lipstick, cellphone, football, brassiere, hand, room, athletic game, phone, scene, different, sink, sweatshirt, playground, human beard, coffee table, watch, grave, way, cemetery, transport, undergarment, bus, necktie, necklace, cosmetics
medicalmedical equipment, medical, health care
Table 3. Correlations of photo features with engagement.
KindFeatureLikeCommentEngagement
Face featuresNumber of faces0.0030.0050.003
Closeup−0.0050.011 *−0.005
Face ratio−0.0060.010 *−0.006
Age0.008 *−0.0010.008 *
Female−0.0010.014 *0.000
Anger−0.001−0.005−0.001
Contempt0.0040.0040.004
Disgust0.0010.008 *0.002
Fear0.000−0.0020.000
Happiness−0.0050.008 *−0.005
Sadness−0.0020.007 *−0.002
Surprise0.0020.0020.002
Neutral0.021 *0.010 *0.021 *
OCR featureNumber of words0.011 *0.035 *0.012 *
Pixel featuresRed mean0.024 *0.021 *0.025 *
Red var−0.004−0.013 *−0.004
Green mean0.028 *0.023 *0.028 *
Green var0.001−0.011 *0.000
Blue mean0.027 *0.025 *0.028 *
Blue var0.008 *−0.009 *0.008 *
Saturation mean−0.028 *−0.030 *−0.028 *
Saturation var−0.007 *−0.025 *−0.008 *
Value mean0.020 *0.018 *0.020 *
Value var−0.001−0.007 *−0.001
Red share−0.010 *−0.004−0.010 *
Orange share−0.021 *−0.010 *−0.021 *
Yellow share−0.014 *−0.011 *−0.014 *
Green share−0.020 *−0.023 *−0.021 *
Blue share−0.012 *−0.008 *−0.012 *
Violet share---
Share of warm colors−0.025 *−0.014 *−0.025 *
Share of cold colors−0.023 *−0.021 *−0.023 *
Hue peaks−0.003−0.015 *−0.003
Pleasure0.013 *0.010 *0.013 *
Arousal−0.030 *−0.031 *−0.031 *
Dominance−0.026 *−0.025 *−0.026 *
Visual featuresBrightness0.027 *0.024 *0.028 *
Colorfulness−0.022 *−0.028 *−0.022 *
Naturalness0.000−0.009 *0.000
Contrast0.006−0.0040.006
RGB Contrast0.001−0.010 *0.001
Sharpness−0.0050.020 *−0.005
Color diversity0.008 *−0.021 *0.007 *
Color harmony0.011 *−0.0040.011 *
* p < 0.05.
Table 4. Root mean square error of the 10-fold cross validation of support vector regression to engagement.
FeatureLikeCommentEngagement
Face features10.3682.24910.584
OCR feature10.3662.2510.582
Pixel features10.3632.24910.580
Visual features10.3552.24810.572
All features10.3522.24510.568
Table 5. Correlations of photo feature and comment sentiment.
KindFeatureSentiment
Face featuresNumber of faces0.020 *
Closeup0.002
Face ratio0.005
Age0.011 *
Female0.037 *
Anger0.004
Contempt−0.008
Disgust−0.012 *
Fear−0.011 *
Happiness0.046 *
Sadness−0.023 *
Surprise−0.016 *
Neutral−0.027 *
OCR featureNumber of words−0.129 *
Pixel featuresRed mean−0.046 *
Red var−0.028 *
Green mean−0.056 *
Green var−0.040 *
Blue mean−0.066 *
Blue var−0.044 *
Saturation mean0.059 *
Saturation var0.006
Value mean−0.044 *
Value var−0.026 *
Red share0.024 *
Orange share0.074 *
Yellow share0.038 *
Green share0.054 *
Blue share−0.005
Violet share-
Share of warm colors0.081 *
Share of cold colors0.028 *
Hue peaks0.017 *
Pleasure−0.030 *
Arousal0.066 *
Dominance0.057 *
Visual featuresBrightness−0.056 *
Colorfulness0.037 *
Naturalness0.027 *
Contrast−0.046 *
RGB Contrast−0.040 *
Sharpness0.021 *
Color diversity0.041 *
Color harmony−0.011 *
* p < 0.05.
Table 6. Root mean square error of the 10-fold cross validation of support vector regression to comment sentiment.
FeatureComment Sentiment
Face features0.451
OCR feature0.447
Pixel features0.448
Visual features0.448
All features0.432
Publisher’s Note: MDPI stays neutral with regard to jurisdictional claims in published maps and institutional affiliations.

