Article

An Assessment of Annual Mortality Attributable to Ambient PM2.5 in Bangkok, Thailand

1
Institute for the Environment, University of North Carolina at Chapel Hill, Chapel Hill, NC 27599, USA
2
The Joint Graduate School of Energy and Environment (JGSEE), King Mongkut’s University of Technology Thonburi, 126 Pracha Uthit Road, Bangmod, Thungkru, Bangkok 10140, Thailand
*
Author to whom correspondence should be addressed.
Int. J. Environ. Res. Public Health 2020, 17(19), 7298; https://doi.org/10.3390/ijerph17197298
Submission received: 14 July 2020 / Revised: 11 September 2020 / Accepted: 29 September 2020 / Published: 6 October 2020
(This article belongs to the Special Issue Health Impact Assessment)

Abstract

:
Multiple studies indicate that PM2.5 is the most deleterious air pollutant for which there are ambient air quality standards. Daily concentrations of PM2.5 in Bangkok, Thailand, continuously exceed the World Health Organization (WHO) and the Thai National Ambient Air Quality Standards (NAAQSs). Bangkok has only recently begun to measure concentrations of PM2.5. To overcome this paucity of data, daily PM2.5/PM10 ratios were generated over the period 2012–2018 to interpolate missing values. Concentration-response coefficients (β values) for PM2.5 versus non-accidental, cardiopulmonary, and lung cancer mortalities were derived from the literature. Values were also estimated and were found to be comparable to those reported in the literature for a Chinese population, but considerably lower than those reported in the literature from the United States. These findings strongly suggest that specific regional β values should be used to accurately quantify the number of premature deaths attributable to PM2.5 in Asian populations. Health burden analysis using the Environmental Benefits Mapping and Analysis Program (BenMAP) showed that PM2.5 concentration in Bangkok contributes to 4240 non-accidental, 1317 cardiopulmonary, and 370 lung cancer mortalities annually. Further analysis showed that the attainment of PM2.5 levels to the NAAQSs and WHO guideline would reduce annual premature mortality in Bangkok by 33%and 75%, respectively.

1. Introduction

Globally, it is estimated that fine particles with aerodynamic diameters equal to or less than 2.5 µm (PM2.5) are responsible for approximately 3 to 9 million excess annual deaths [1,2,3,4,5,6,7]. It is thus not surprising that PM2.5 is considered one of the most dangerous pollutants [8]. Fine particles have the ability to enter the smallest airways and alveoli within the lungs, and ultrafine particles can subsequently diffuse into the bloodstream [9]. PM2.5 has been found to cause respiratory disease, specifically acute lower respiratory infection and chronic obstructive pulmonary disease, cardiovascular disease, specifically ischemic heart disease, cerebrovascular disease and stroke, and lung cancer [8,9,10,11,12].
Megacities around the world are rapidly expanding. This is particularly the case in Asian countries, where population growth is driving the need for continuous urbanization. Bangkok, the capital city of Thailand with a growing population of about 6 million inhabitants, [13] is on the cusp of emerging as the world’s next megacity. It is indeed witnessing major infrastructure development, which accounts for the majority of the country’s urbanization [14]. When one includes greater Bangkok, which extends beyond the formal Bangkok governmental boundary, there are more than 10 million people. Such expansion is associated with a number of environmental challenges, with air pollution becoming a notorious issue. In recent years, there have been increasing concerns over the situation of air quality in Bangkok. Pollution has risen to harmful levels resulting in unsafe concentrations of PM2.5, particularly during the dry season, as indicated by the Thai Pollution Control Department. Increased PM2.5 concentrations have been linked to consequential impacts that cause premature deaths [13,15]. Since 2012, pollution levels of PM2.5 have been monitored at various ambient air pollution stations around the country. However, the number of such stations is still limited compared to that of PM10. In 2015, only 12 stations were equipped to monitor PM2.5, 3 of which were located within the formal boundary of Bangkok. In 2018, the number of PM2.5 monitoring stations in Bangkok had increased to 19, thus providing better coverage of PM2.5 levels in the city. During 2016–2019, according to the 2018 Thailand State of Pollution Report, the 24-h NAAQSs standard of 50 µg/m3 was exceeded approximately 50 days per year. Maximum daily concentrations above 100 µg/m3 were observed during the dry season (November to April).
Health impacts related to unsafe air quality have been the subject of many studies, and focus on correlating particulate matter concentrations and premature mortality as well as related economic losses [8,12,14,15,16,17,18,19,20,21,22,23,24,25,26,27,28,29,30]. Some of these studies were performed using Thai populations [27,28,29,30]. Vichit-Vadakan et al. [27], in 2008, under the Public Health and Air Pollution program in Asia (PAPA), reported on the mortality impact of particle exposures with aerodynamic diameters equal to or less than 10 µm (PM10). They observed a 1.3% increase in mortality risk per 10 μg/m3 increase in PM10. This is higher than for similar exposures in some Western cities, as reported by Schwartz [23]. Wong et al. [29] investigated the excess risks associated with sulfur dioxide (SO2), ozone (O3), and PM10 also under the PAPA project for three main causes of mortality: non-accidental, cardiovascular disease, and respiratory disease. This study included Bangkok and three cities in China: Hong Kong, Shanghai, and Wuhan. The excess risks identified for Bangkok were found to be 2–5 times higher than those identified for China [29]. Another study by Guo et al. [30], in 2014, focused on assessing the excess risks associated with NOX, SO2, O3, and PM10 on mortality, including non-accidental, cardiovascular disease, and respiratory disease for 18 provinces in Thailand. They confirmed that air pollutants had significant short-term impacts on non-accidental mortality, and the effect was higher during the winter, compared to the rainy season. The study also highlighted that O3 is related to cardiovascular mortality, while PM10 is significantly related to respiratory mortality [30]. In the United States of America, Fann et al. [31] used the U.S. Environmental Protection Agency’s Environmental Benefits Mapping and Analysis Program (BenMAP) to investigate the health burden and benefits of PM2.5. However, to this day, the effects of PM2.5 on mortality in Thailand, specifically in Bangkok, have not been well-documented.
This study investigates annual mortality associated with PM2.5 in Bangkok based on available air quality monitoring data. There are currently no such studies with PM2.5. The specific objectives are (1) generate missing PM2.5 data by interpolation applied to existing PM2.5 and PM10 data to determine daily PM2.5/PM10 ratios, (2) investigate the association of PM2.5 with meteorological parameters, (3) identify relative risks and resulting concentration-response coefficients (β values) for all-cause, cardiopulmonary, and lung cancer mortalities, and (4) determine the annual mortality attributable to PM2.5 pollution utilizing BenMAP-CE.

2. Methodology

The specific steps to quantify mortality attributable to PM2.5 in Bangkok are illustrated in Figure 1. It begins with daily PM2.5/PM10 ratios, interpretation of PM2.5 values, and ends with a health benefits analysis.

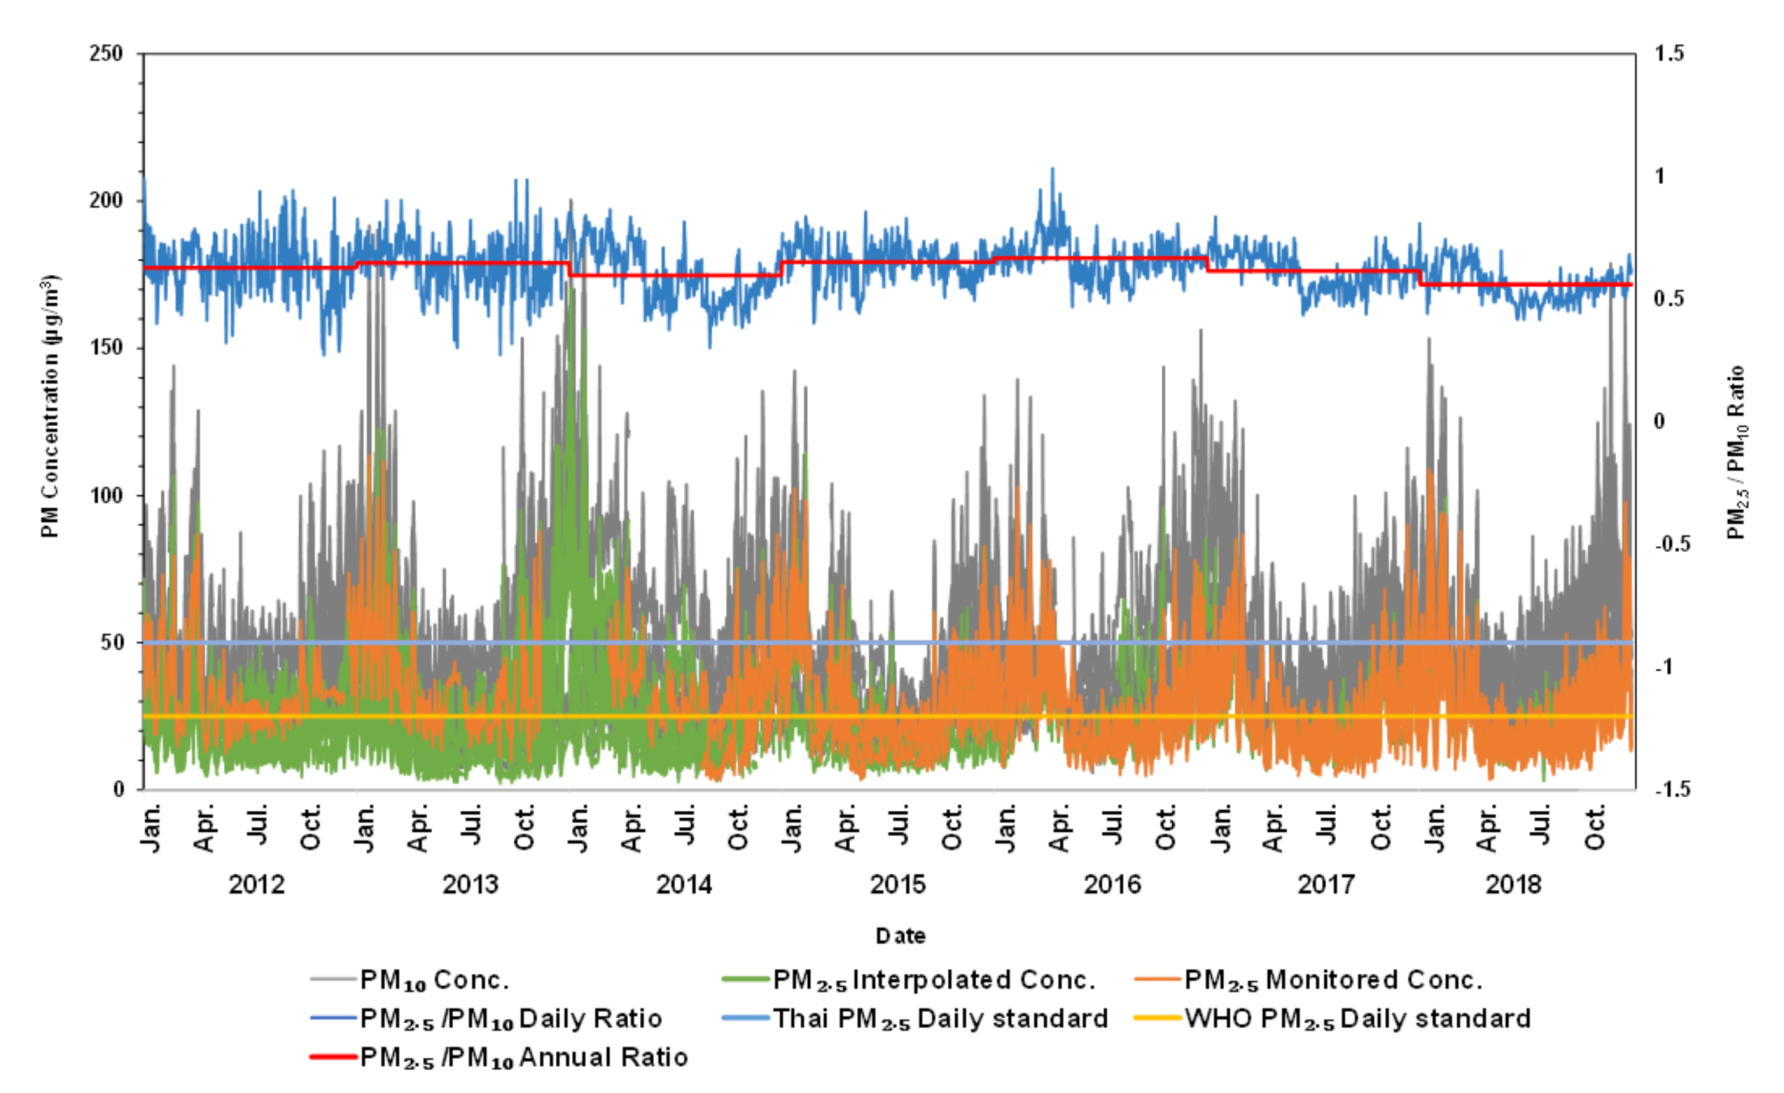
2.1. Estimation of Daily PM2.5/PM10 Ratios and PM2.5 Interpolation

As seen in Figure 2, fixed-site monitoring stations are clustered around Bangkok, especially in the central part of the city. Figure 2 additionally provides the associated sub-district population density nearby to each monitoring station. PM2.5 was measured by the Beta Ray attenuation method, following the United States Environmental Protection Agency (USEPA) reference method. In 2008, the USEPA designated this method as a federal equivalent method for measuring PM2.5 according to the US Federal register, 73 FR 22362, EQPM-0308-170 method. The equipment is from two main manufacturers, i.e., MetOne and Thermo. For the former, PM2.5 concentrations were recorded on an hourly basis. For the latter, PM2.5 concentrations were recorded every 10–15 min, and hourly average concentrations were calculated accordingly. Information on PM2.5 monitoring data and associated statistical values are presented in Table 1. We focused on data from 2012 to 2018 because all available monitoring stations collected data during these years.
During the years observed, the average PM2.5 concentration was 27.9 (±16.8) µg/m3 with maximum and minimum values of 170.7 µg/m3 and 2.15 µg/m3, respectively. The median concentration for PM2.5 was 24.0 µg/m3 with first and third quartiles of 16.9 µg/m3 and 35.0 µg/m3, respectively (interquartile range (IQR) = 18.0 µg/m3). As the quality of data varied between stations, the inclusion of specific data was based on the following criteria. A station’s PM2.5 data were accepted only if it contained at least 70% of the daily PM2.5 values in the original data. Daily means were only included if a station had at least 17 hourly PM2.5 measurements for each day. PM2.5 values were estimated from the average ratio of all available PM10 and PM2.5 values from other stations for that day. According to the USEPA, the PM2.5/PM10 ratio should fall between a range of 0.50–0.65 and must be applied to data from the same year [32]. Previous studies used a fixed annual PM2.5/PM10 ratio [33,34,35].

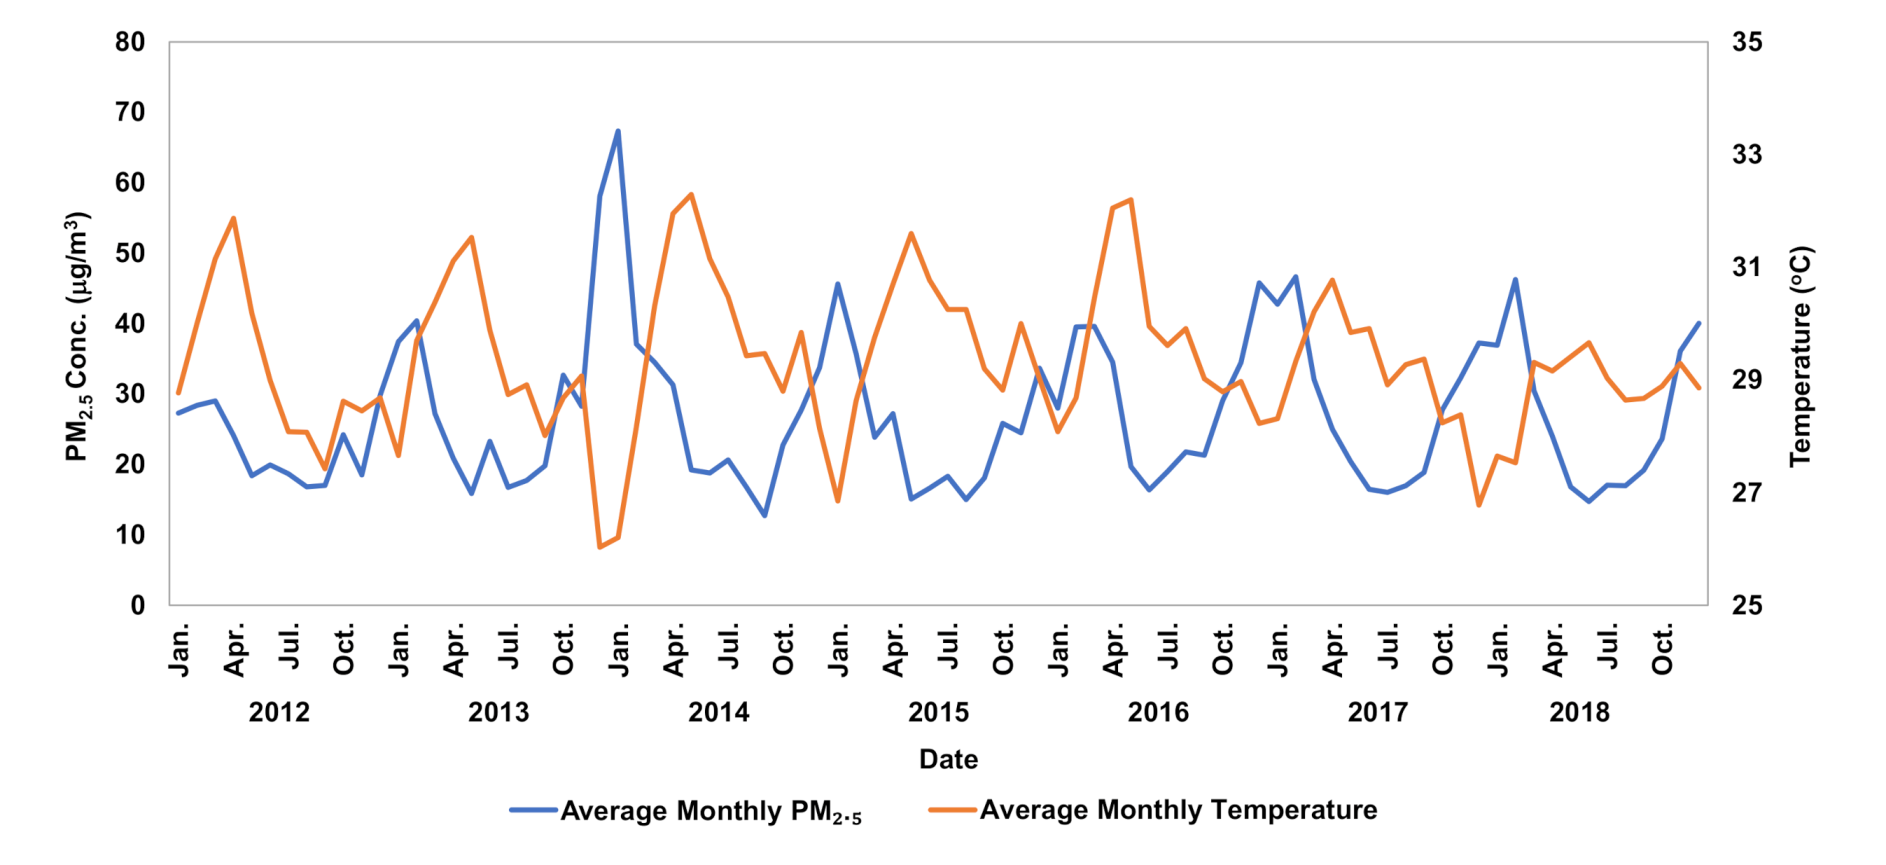
2.2. Estimation of Correlation between PM2.5 and Meteorological Conditions

Each ambient air quality station from the Pollution Control Department also measured a set of meteorological variables, including wind speed, wind direction, relative humidity, temperature, and rainfall, from 2012 to 2018. Wind direction and wind speed at each monitoring station were sampled 10 m above the ground with a 2-dimensional (2D) potentiometer wind vane and cup propeller for respective measurements. Temperature and relative humidity were measured 2 m above the ground using a multistage solid-state thermistor and a thin-film polymer capacitor for respective measurements. Rainfall was measured three meters above the ground with a tipping bucket. The equipment is from two main manufacturers, i.e., Met One and Thermo. Data were continuously recorded at an hourly frequency.
Meteorological variables had a seasonal influence on PM2.5 concentrations. Seasonality was defined for each month based on the weather conditions in a given month. Table 2 depicts the monthly averages of meteorological occurrences and associated PM2.5 concentrations. The dry/cool season was associated with lower temperatures and reduced cumulative rainfall (averages of 28 °C and 36 mm), as compared to the rest of the year. The hot season was associated with elevated temperatures (average of 30 °C) and was higher than the rest of the year. The rainy season was characterized by high levels of cumulative precipitation, averaging 225 mm during each month involved. June had characteristics of both the rainy and hot season, with an average temperature of 30 °C and rainfall of 197 mm. It was, therefore, assigned a mixed season classification of “Hot and Rainy”.

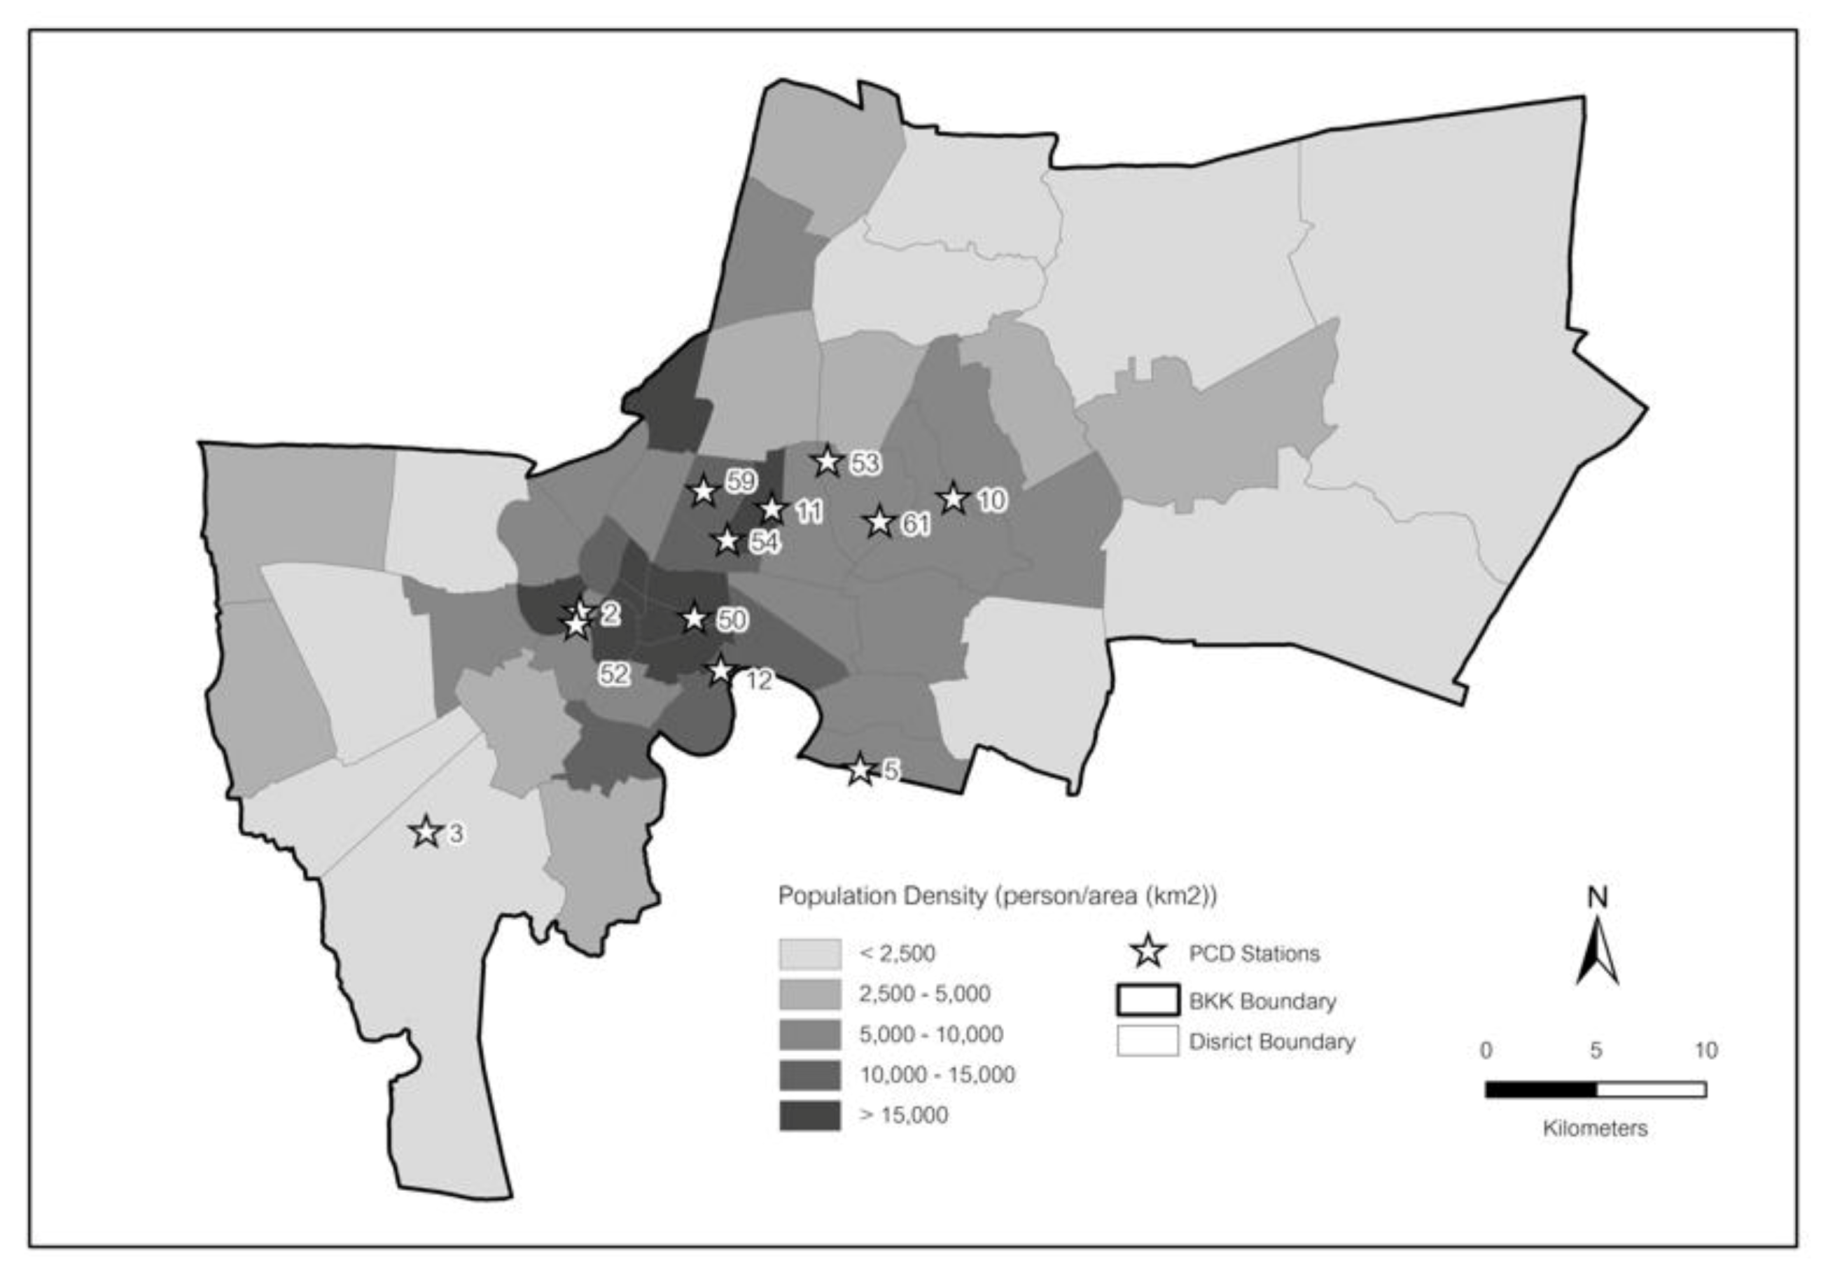
2.3. Mortality Data in Bangkok

Individual mortality records, including data on the location of death, age, sex, and primary causes of death from 2007–2016, were obtained from the Thailand Ministry of Public Health for the entire Bangkok metropolis area. There were approximately 460,000 non-accidental deaths during this time. The mean age was identified to be 64 (±20) years with a median age of 69 years, and first and third quartiles of 53 years and 79 years, respectively (IQR = 26 years). More men died during this period representing 59.3% of the total number of deaths. All deaths in the data set were classified as all-cause non-accidental, with cardiopulmonary disease and lung cancer contributing 15.7% and 3.2% of the mortalities, respectively. Mortality data in Bangkok are recorded by the Ministry of Public Health in the civil registration database. They are certified based on the death certificates. According to this information, it was assumed that the subjects registered in Bangkok had also lived and died in Bangkok. Each mortality datum was assigned a code classifying the cause of death according to the International Classification of Diseases, Tenth Revision (ICD-10) [36]. Previous epidemiological studies in China [10], India [8], and the United States of America [12,14,25,26] showed associations between PM2.5 concentration and cause-specific mortalities. Specifically, concordance was noted between PM2.5 pollution and cardiopulmonary diseases (ICD-10: I10-I15, I20-I52, I60-I70), and lung cancer (ICD-10: C33-C34, D022-D024). Here we also examined the mortality causes of cardiopulmonary disease and lung cancer, and these were coupled with all-cause (non-accidental) mortality (ICD: A00-R99) as a baseline reference. Mortality data were limited to an age range of 30–99 years since specific concentration-response variables from previous studies [10,25] focused on this age range. The age range 30–99 years accounts for 94.6% of the total number of deaths during 2007–2016, with approximately 440,000 deaths. It comprised 54.2% males and 45.8% females. For the age range 30–99 years, the mean age was 67 (± 15) years with a median of 70 years, and first and third quartiles of 56 years and 80 years, respectively (IQR = 24 years). Regarding cardiopulmonary mortality, ages in the range 30–99 years represented 96.3% of the total number of deaths in this category; the range 0–30 years accounted for the remaining 3.7%. For lung cancer mortality, the age range 30–99 years represented 98.4% of the total number of deaths in this category; the age range 0–30 years accounted for the remaining 1.6%. As a significant proportion of the mortalities observed in this study were attributable to the age range 30–99 years, the focus of the investigations of this study was on this age range. We determined a daily sum of each specific mortality category according to each ICD-10 mortality code, then determined each category’s incidence rate by dividing the number of deaths in each specific ICD-10 category by the total population during the same year.

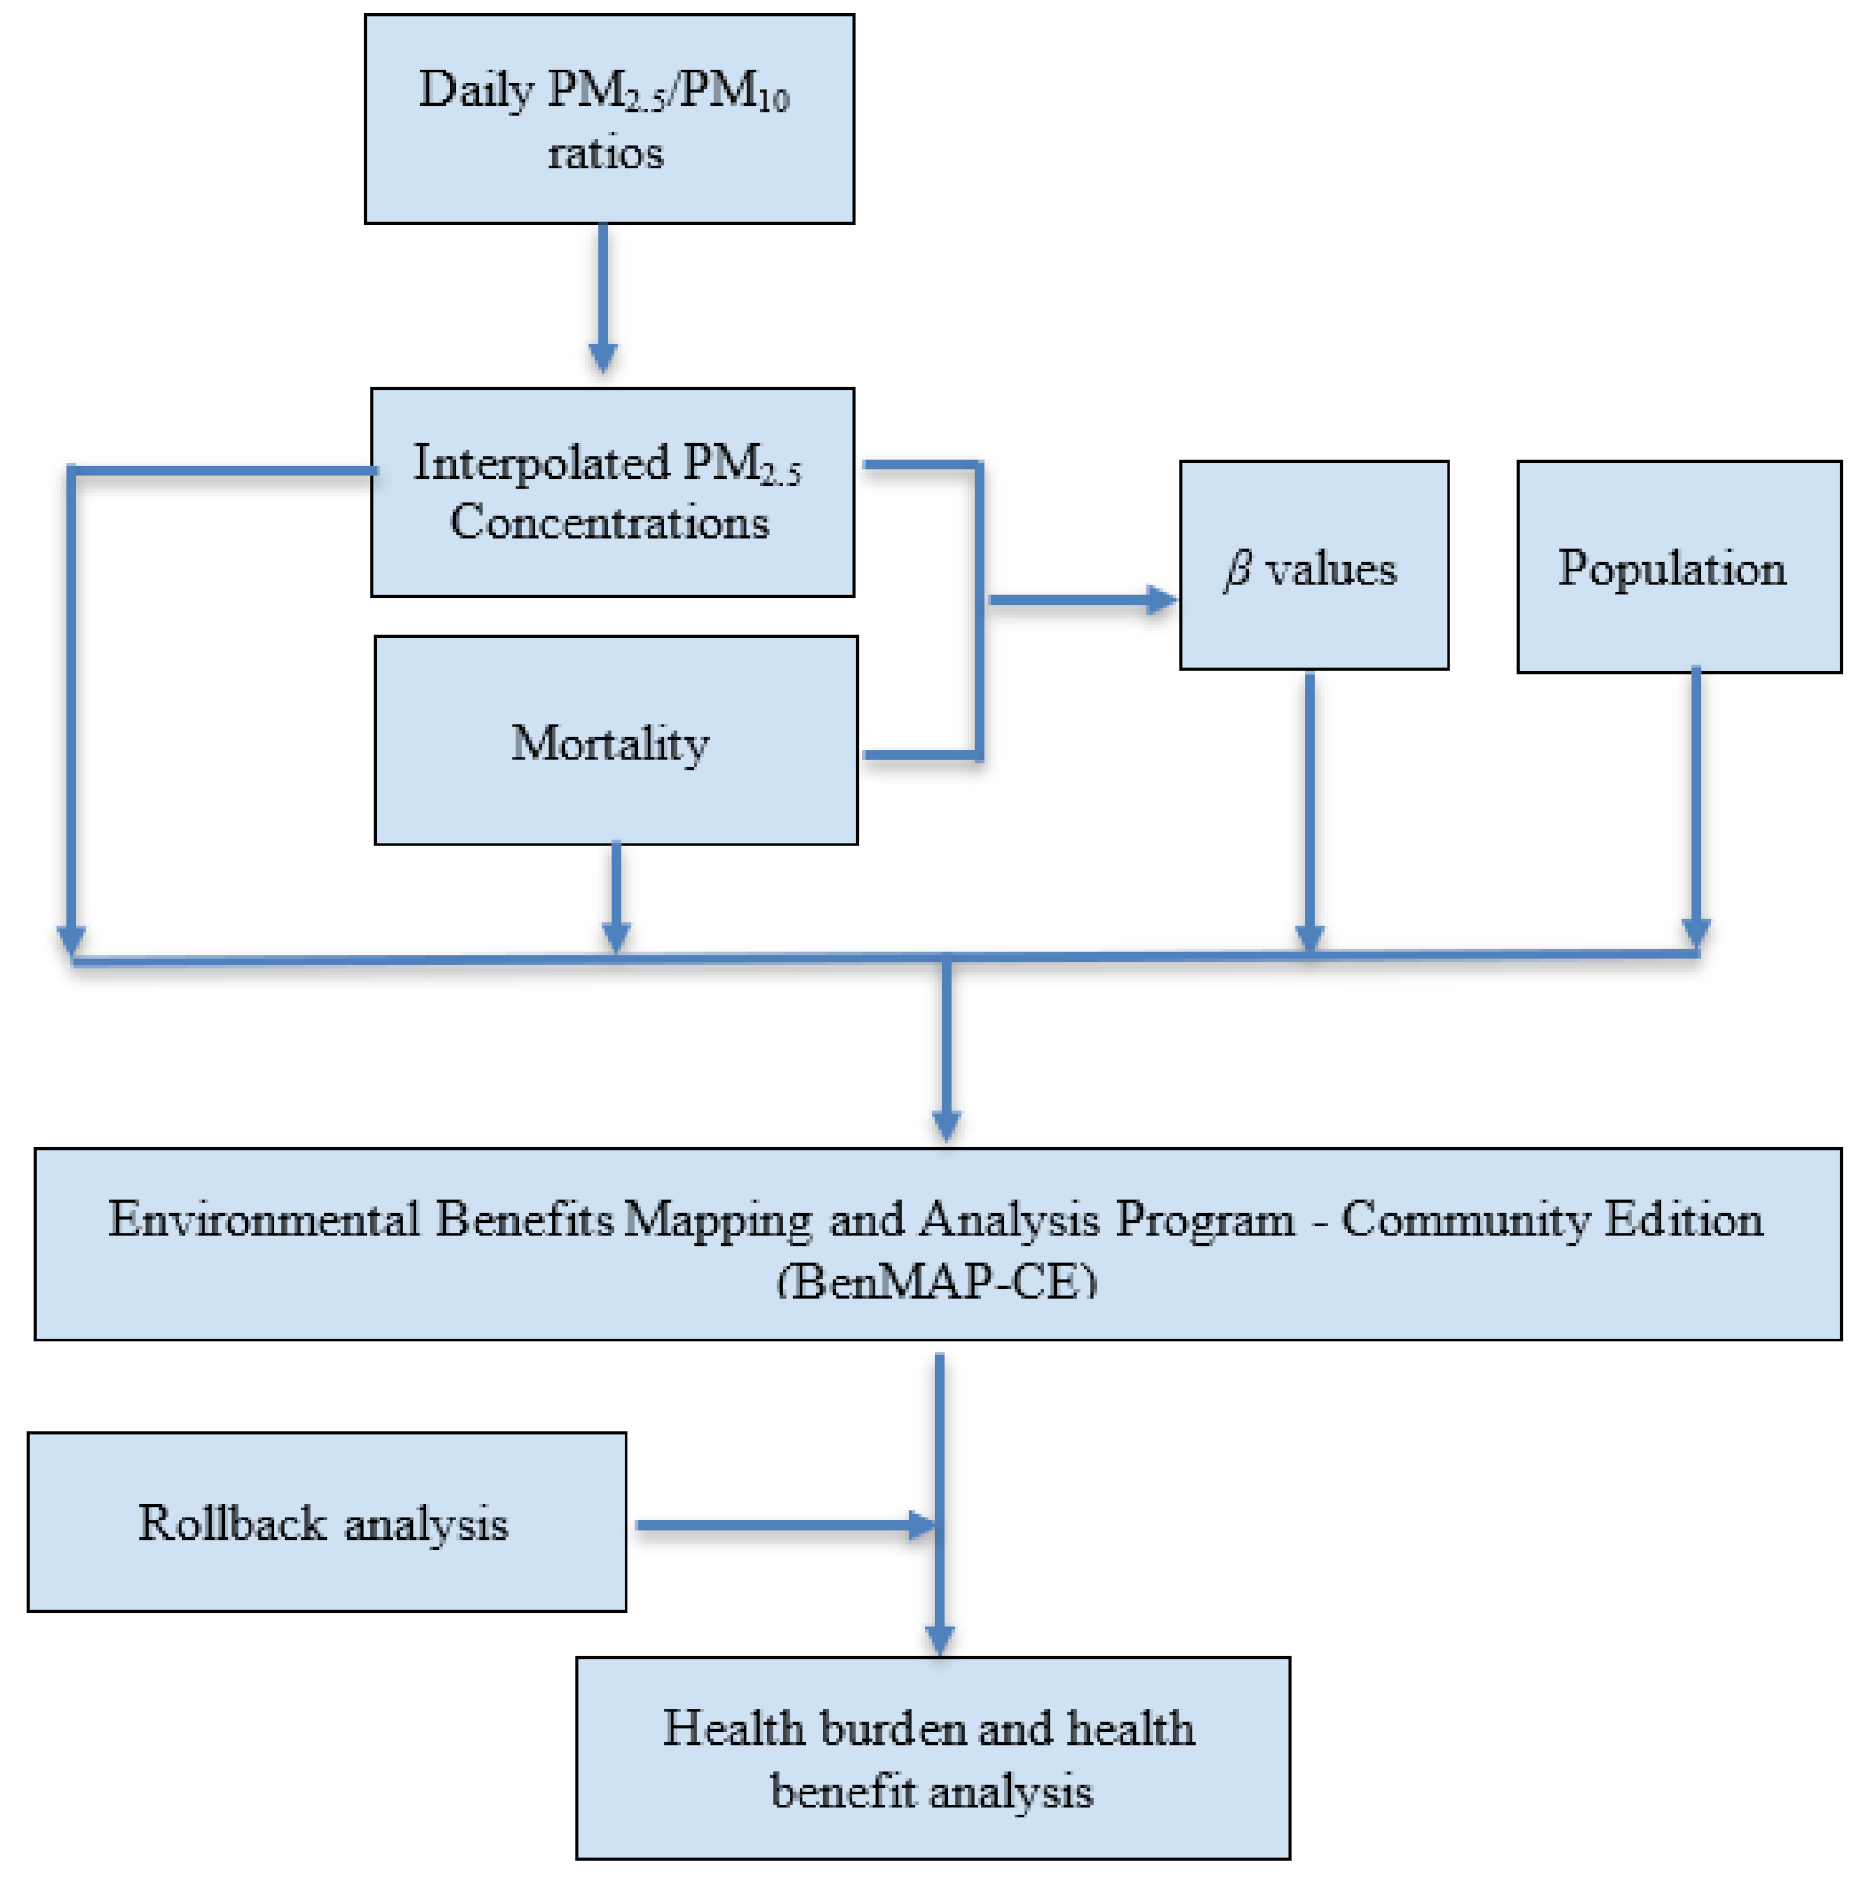
2.4. Health Impact Assessment Using BenMAP

BenMAP-CE, a Geographic Information System (GIS)-based tool that estimates health impacts resulting from air pollution, was used to determine the links between PM2.5 concentrations and mortality. BenMAP-CE utilizes a health impact function that incorporates monitored air-quality data, population data, baseline incidence rates, and an effect estimate to calculate health impacts [15,37].
Relative risk (RR) is a ratio that compares, in this case, the mortality of a PM2.5 exposed group (at some PM2.5) to the mortality of a group with no PM2.5 exposure. The slope of the natural log of RR versus PM2.5 is called β, or the concentration-response (C-R) coefficient, and it is frequently used across different studies to compare the strength of the relative risk for a similar change in PM2.5 exposure (∆PM2.5). β can also be calculated from β = l n R R P M 2.5 . A ∆PM2.5 of 10 μg/m3 is often used, but ∆PM2.5 can be used to estimate the reduction in mortality from an ambient value to some target or standard. In BenMAP-CE, β is used to calculate the change in the incidence rate, as a function of ∆PM2.5 as per Equation (1):
∆Y = Y0 (1 − eβ∆PM2.5) * pop
where
  • ΔY is the change in incidence rate;
  • Y0 is the baseline incidence rate of the health effects;
  • β is the C-R coefficient;
  • pop is the exposed population, and
  • ∆PM2.5 is the change in PM2.5 concentration to some target or health standard value.
The year 2016 was selected for the health burden and benefit analysis based on the completeness of data collected for that year. Baseline mortality data were obtained from the Ministry of Health and population data from the National Statistic Office. Concentration-response coefficients were derived as described above based on RR values retrieved from the literature. Estimates were also determined for Bangkok, as detailed in Section 3.3. The β values thereby obtained were used as input into Ben-MAP to assess the annual mortality endpoints considered in this study.

3. Results and Discussion

3.1. PM2.5 Interpolation

Figure 3 shows the original available PM2.5 and PM10 data from 2012 to 2018, as well as annual ratios and daily ratios. The graph shows gap-filled data (PM2.5 interpolated in green) compared to non-gap filled data (PM2.5 original in orange). Further, the Thai and WHO PM2.5 air quality standards of 50 µg/m3 and 25 µg/m3, respectively, are denoted in Figure 3 to indicate days when air quality exceeded each set standard. PM2.5 data had a diminished density of data points during the first three years, which then increased through 2018. The above described daily ratio approach permitted the interpolation of more than 8000 PM2.5 values from all stations that were not previously available. The PM2.5/PM10 relationship was determined by generating a linear plot of PM10 as the independent variable and PM2.5 as the dependent variable, with PM2.5/PM10 as the slope of the line. Ten-fold cross-validation was run on the data utilizing a 90–10 model where 90% of the data were trained, and the residual 10% was tested using a generated PM2.5/PM10 ratio from the trained data. Cross-validation was carried out over 10 iterations, and the root-mean-squared error (RMSE) and coefficient of determination (R2) were averaged over the trials. When using the annual PM2.5/PM10 ratio to interpolate PM2.5 values, an accompanying R2 value of 0.634 (±0.042) and an RMSE of 15.137 (±2.51) µg/m3 were observed. In contrast, the daily ratio was proven to be significantly more accurate at predicting interpolated values with an averaged R2 value of 0.866 (± 0.018) and an RMSE of 3.607 (± 0.891) µg/m3. Data enhancement from the daily ratio allowed for more accurate predictions of PM2.5 concentrations, which further strengthened the relationships between variables analyzed in this study.
During the dry and cool months, PM2.5 concentration was high, and the annual ratio underestimated PM2.5 levels. However, during the rainy season, there were diminished concentrations of PM2.5, and the annual ratio overestimated PM2.5 values. Employing the daily ratio in place of the annual ratio permitted us to generate more accurate data, which improved mortality estimates using BenMAP-CE.

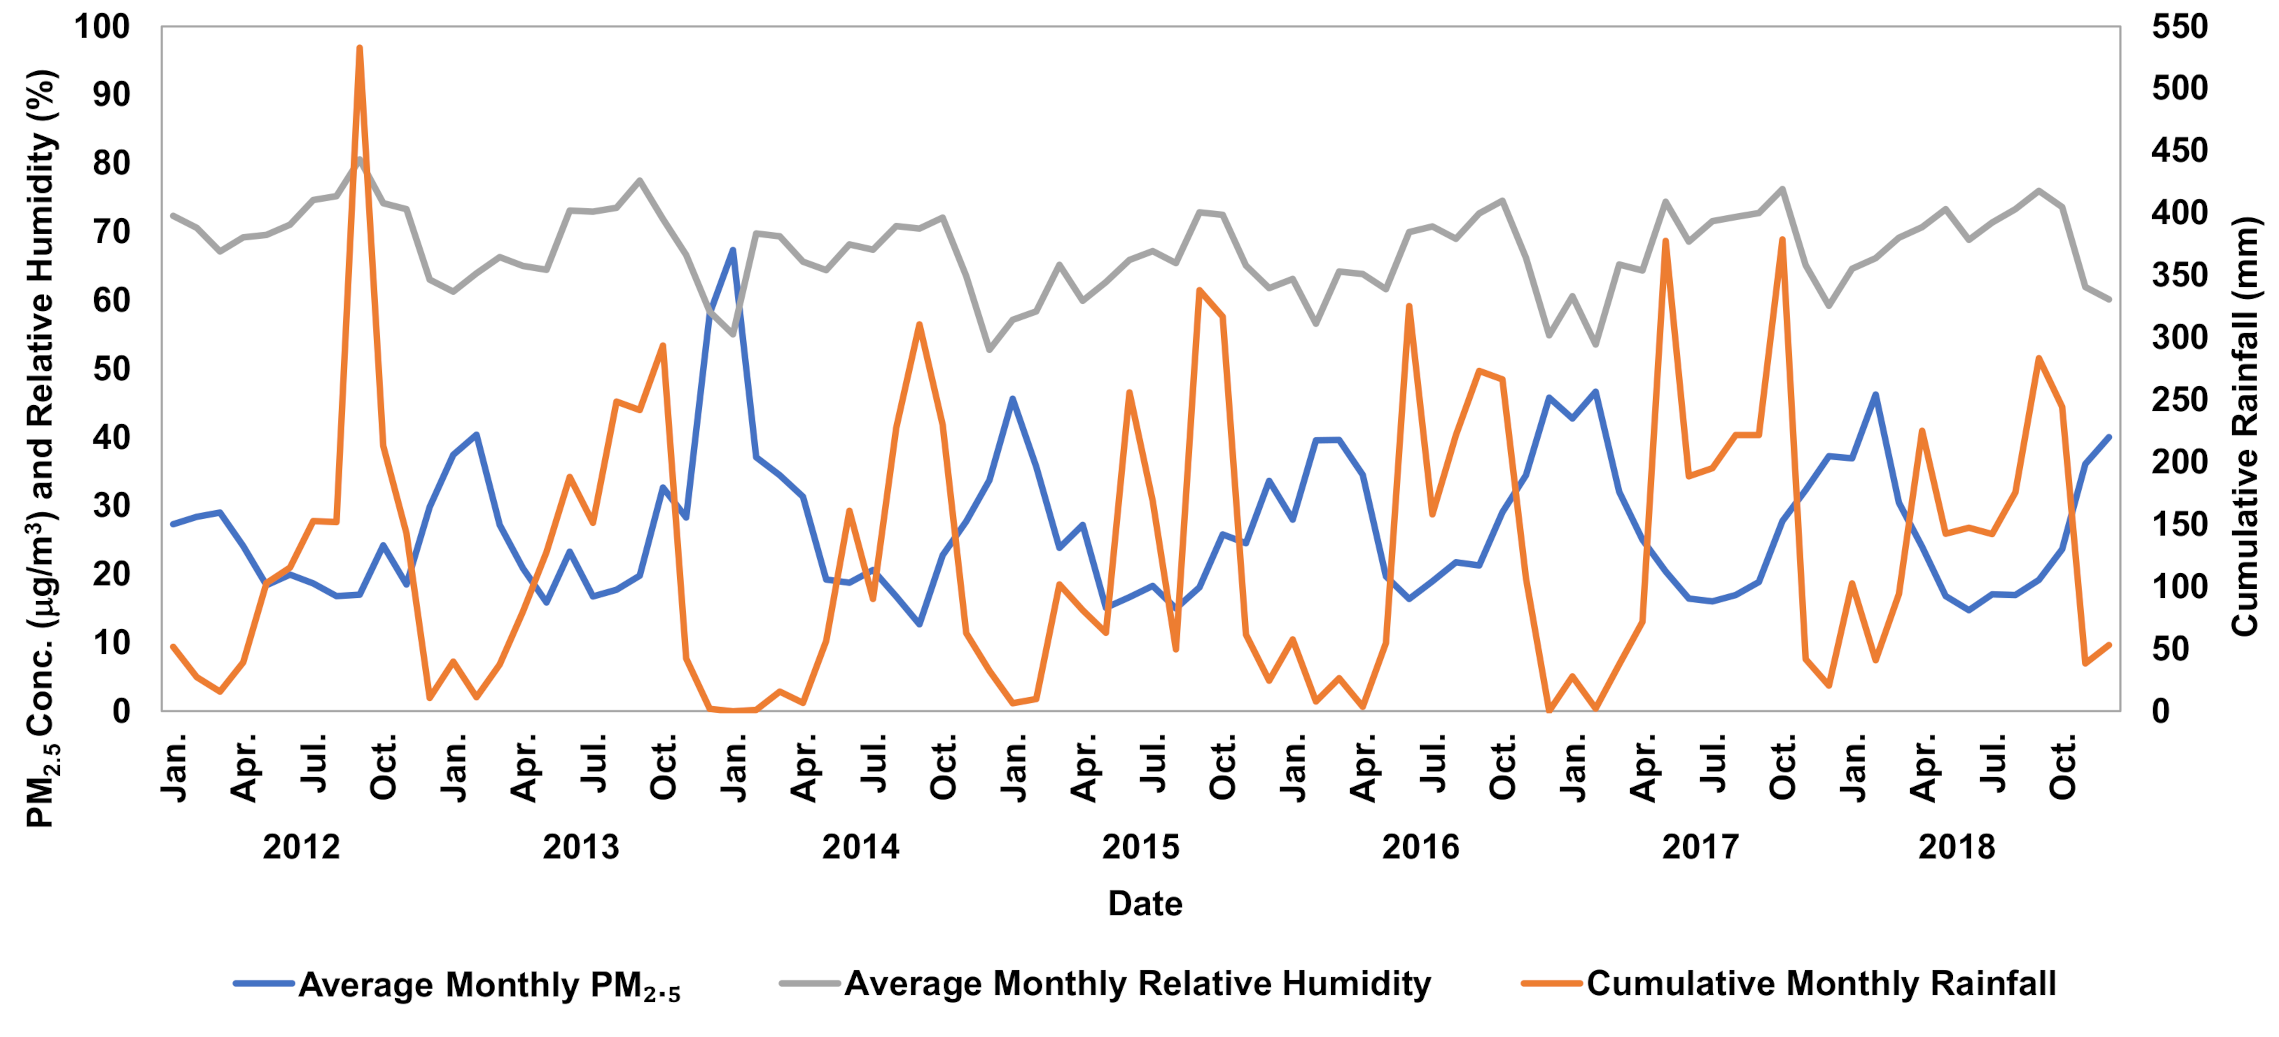
3.2. Correlation between PM2.5 and Meteorological Conditions

Observed correlations between particulate matter and meteorological factors showed a negative linear correlation between all meteorological variables and particulate matter. Relative humidity, temperature, and cumulative rainfall showed the strongest correlations with changes in pollutant concentrations, with Pearson correlation coefficients of −0.451, −0.240, and −0.201, respectively (Table 3). PM2.5 concentrations had an inverse relationship with changes in temperature and relative humidity (Figure 4 and Figure 5). Although the temperature in Bangkok varied less than 10 °C (mostly between 25 and 30°C) during the period observed, it was evident that as temperature increased, PM2.5 concentrations decreased and vice-versa. This trend was attributed to decreased mixing height from temperature inversions created by a change in temperature. These inversions trapped pollution and restricted vertical mixing, making pollution stagnant, thus increasing PM2.5 concentrations [38,39]. Increased rainfall reduced PM2.5 concentration through wet deposition by washing out the particles from the atmosphere [40]. Stagnation was perpetuated by lower wind speeds, although a decrease in wind speed did not cause an immediate increase in PM2.5 concentration because there was a brief lag period in which PM2.5 concentrations would build up. This lag became more significant throughout the study as stagnation in the atmosphere increased; overall, wind speed decreased by 31% from 2012 to 2018. Future climate is expected to become more stagnant, exacerbating air pollution and subsequent health problems [41,42]. The daily ratio accounted for the above meteorological occurrences and better depicted the daily fluctuations in PM2.5 concentration.

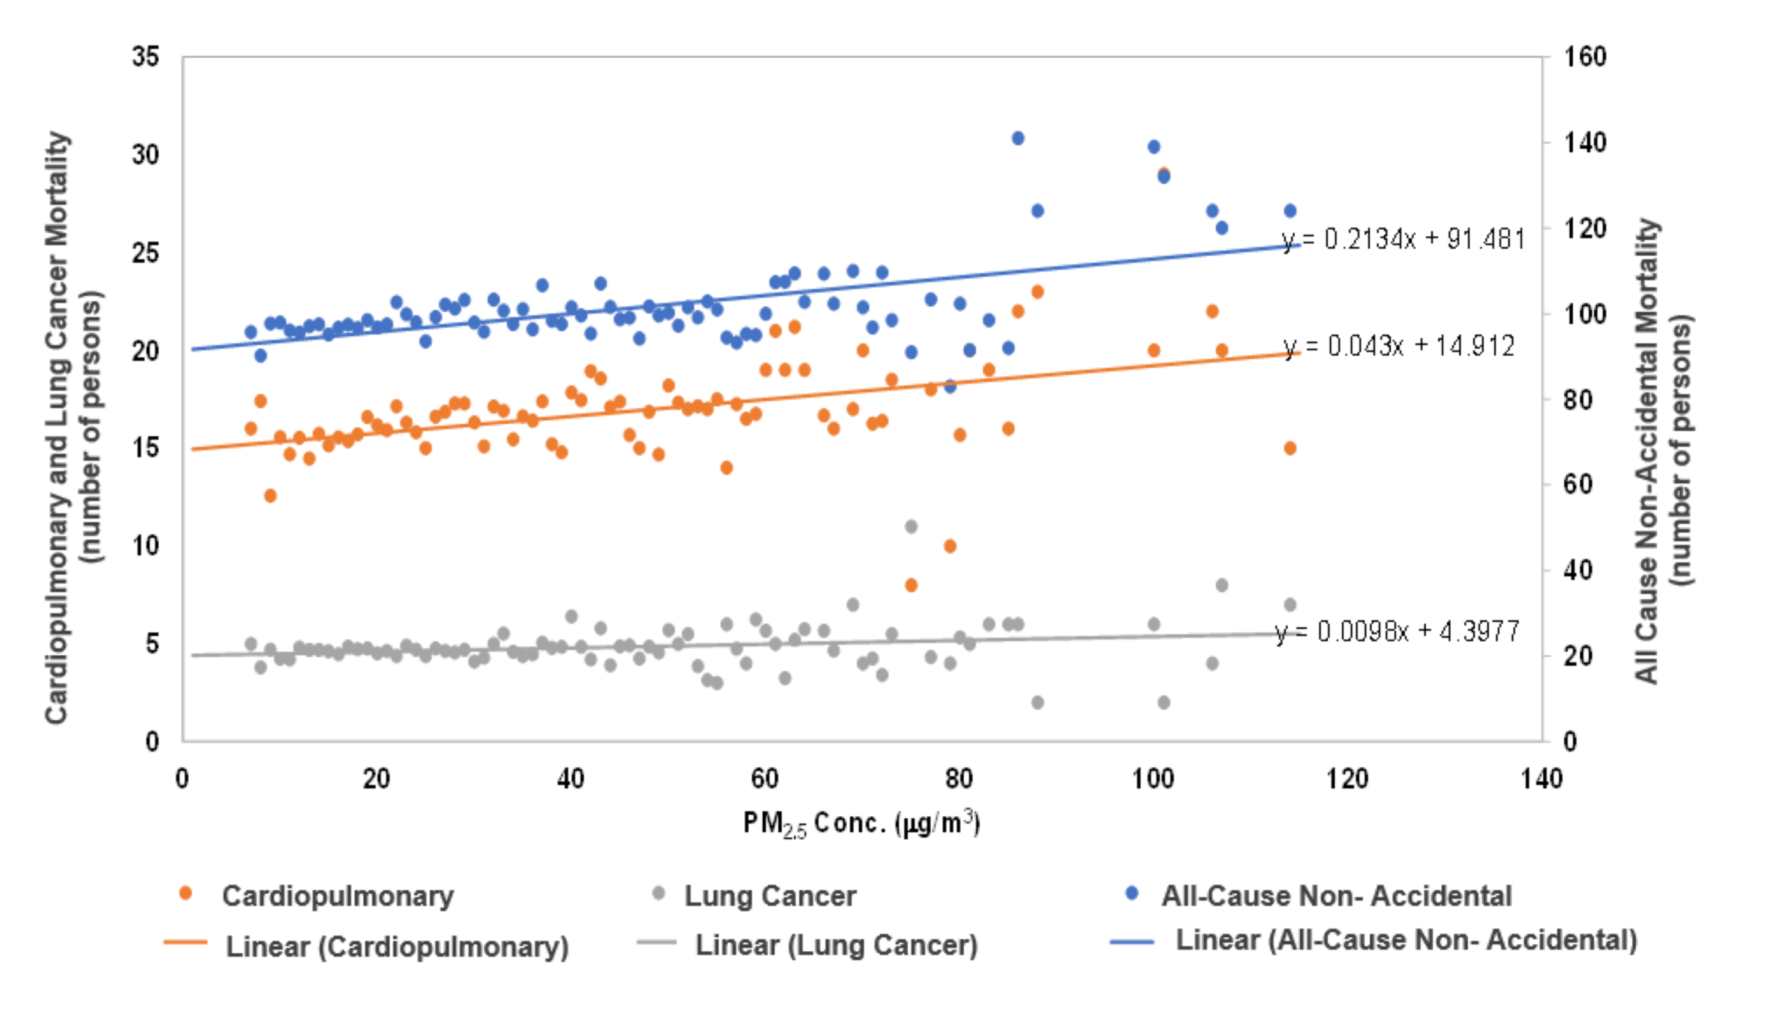
3.3. Health Benefit Analysis

In this study, we initially compared the US and Chinese values in BenMap, which represent different western and eastern global populations. These values were obtained by including other mortality risk factors such as sex, education, smoking, lifestyle, socioeconomic status, obesity, etc. As seen in Table 4, the Chinese β values [10] were much lower than the ones used for the United States [25]. The increment rollback function on Ben-MAP was applied to determine the impact of a 10 μg/m3 rollback in PM2.5 for the year 2016 (Table 4). This function reduced all PM2.5 observations by the same increment. A 10 µg/m3 rollback in Bangkok PM2.5 concentration utilizing the estimated Bangkok β values resulted in a 1.5%, 3.1%, and 4.1% decrease in annual mortality for non-accidental, cardiopulmonary disease, and lung cancer, respectively.
Differences in the number of avoided deaths in Bangkok were observed depending on the β values used. The number of avoided deaths in Bangkok, calculated from the Chinese β values [10], were found to be seven- (non-accidental), five- (cardiopulmonary), and four-times (lung cancer) lower when using β values reported in the literature for the United States [25].
It is also possible to obtain simple RR values from the Bangkok population directly, by plotting Bangkok mortality data versus Bangkok PM2.5. Average daily mortality was computed for every 1 μg/m3 increase in PM2.5 over the range of concentrations observed. This produced trends, as shown in Figure 6. Specific relations were observed between PM2.5 concentrations and all non-accidental mortality, cardiopulmonary diseases, and lung cancer. The incorporation of interpolated PM2.5 concentrations allowed for improvement in the R2 significance for all the relationships between particulate matter and cause of death in this study, which provided strengthened conclusions. Initial R2 values between PM2.5 and all-cause non-accidental, cardiopulmonary, and lung cancer mortality classifications were 0.324, 0.184, and 0.098, respectively. Following the adjustment of PM2.5 data through interpolation, these values increased to 0.554, 0.364, and 0.162.
From the ratio of the mortality response on the y-axis and the y-intercept (unexposed PM2.5 mortality) in Figure 6, it was possible to compute RR values for a given ∆PM2.5. These values were then utilized to yield β values and estimates of mortality attributable to a given PM2.5 exposure. The authors are aware that although this approach is rudimentary and does not include other RR mortality factors, as per the Chinese and United States studies, it is very interesting that β values (standard deviations in parentheses) obtained in this manner (0.001743 ( ± 0.0007458), 0.002284 ( ± 0.003878), 0.003134 ( ± 0.002754), for all-cause non-accidental, cardiopulmonary, and lung cancer mortality, were more similar with those determined from the Chinese population by Cao et al. [10]. Through generating our own β values, we were able to compare the associated population health risks from air pollution to other concentration-response values determined in studies from other countries.
These results suggest that populations in Bangkok and China tended to be more similarly affected by the same PM2.5 exposures, and were different from the US population. This observation is consistent with the study by Newell (2017) [43], which found regional differences in impacts on cardiorespiratory mortality and morbidity are observed for the same increase in particulate matter concentration. Populations in different regions of the world have a myriad of different traits (i.e., physiology, risk factors, lifestyle, etc.), which, apparently, influence their susceptibility and mortality response to PM2.5 exposures.
As reported in Table 5, anthropogenic PM2.5 levels above the background concentration of 2.15 µg/m3 in Bangkok using β values determined in this study, resulted in 4240 non-accidental mortalities, 1317 cardiopulmonary deaths, and 370 lung cancer mortalities. In comparison to meeting the Thailand annual standard of 25 µg/m3, meeting the WHO annual guideline of 10 µg/m3 would result in a significant reduction in premature mortality. While meeting the Thai annual standard is a goal that the Thai government is working towards, it is notable that this standard does not represent a PM2.5 level that is completely safe. Meeting the more stringent WHO annual standard is estimated to have a three-fold number of avoided non-accidental deaths. Meeting the Thai annual standard of PM2.5 would enable a 25% reduction in premature mortality, whereas meeting the WHO annual guideline would contribute a 71% reduction in premature mortality each year.

3.4. Uncertainty of the Analysis

BenMAP-CE required many data inputs. With each input, a layer of uncertainty is added that rests on the quality of the data. Mortality data had general limitations regarding the specificity of the district in which the mortality occurred. Because of this, the calculated incidence rates were generalized to the entire Bangkok province, as opposed to specific districts within the province. Of the available data, there were long periods in which PM2.5 values were not recorded. This was especially obvious between 2012 and 2014 when most monitoring stations only collected PM10 data. Missing PM2.5 concentration values were estimated using a daily PM2.5/PM10 ratio, which allowed for a continuous data set of PM2.5. For the BenMAP analysis, PM2.5 monitoring data from five monitoring stations in the year 2016 were used in accordance with the criteria of quality set out in this study. These five stations are located in central Bangkok and are not evenly dispersed. The Voronoi Neighbor Averaging (VNA) algorithm is an innate function of BenMAP-CE that was used to remediate the lack of PM2.5 monitoring stations in all 50 districts of the city. To determine the non-anthropogenic background concentrations of PM2.5, we used the lowest value recorded (2.15 µg/m3) from the 11 PM2.5 monitoring stations in Bangkok over 2012–2018. This procedure was followed because, to our knowledge, there is no established background concentration of PM2.5 in Bangkok. In regards to the health impact function, a key factor is the β value. Ideally, estimates of C-R coefficients should take into account other mortality covariates that could help provide additional insights into estimated Thai β values, such as male/female, BMI (body mass index), smoking/nonsmoking, alcohol intake, hypertension, educational level, individual socioeconomic status, other health conditions, medications, behaviors, etc. These well-known mortality determinants are missing in this analysis. Additional studies are needed to reduce their uncertainty.

4. Conclusions and Recommendations

This study used an innovative method for interpolating PM2.5 data based on seasonality and daily concentration changes in PM2.5 and PM10. Interpolating data points from this daily ratio, instead of annual ratios allowed for more accurate predictions of missing PM2.5 concentrations. With regard to human health, this study is the first health-related study linking annual mortality and PM2.5 in Bangkok. The results showed that by decreasing the annual PM2.5 concentration in Bangkok to the Thai NAAQS and WHO air quality standards, a consequential reduction of 1393 and 3159 in premature mortality attributable to unsafe PM2.5 levels can be achieved. Our results show that populations in Bangkok and China are more similarly affected by the same PM2.5 exposures than the population of the United States, and strongly suggest that regional β values be used in estimating PM2.5 mortality impacts.
Further studies should focus on investigating how PM2.5 may affect population health on episodic bases. In this study, meteorological information specific to Bangkok was gathered and investigated, and correlation analysis provided a rudimentary understanding of the potential of meteorological variables in assessing the concentration of PM2.5. This should be further investigated in future studies. Future epidemiological cohort studies should be carried out to determine concentration-response β values specific to Bangkok to more accurately quantify and model the relationship between PM2.5 levels and mortality. It is also very desirable to determine if these β values can be applied to non-Bangkok Thai populations.

Author Contributions

Conceptualization, S.G., P.T.B.T., R.K. and S.B.; Methodology, P.T.B.T., R.K., S.B. and S.G.; Software, P.T.B.T., N.R.F., M.R.A. and B.C.W.; Validation, P.T.B.T., R.K., S.B. and S.G.; Formal Analysis, N.R.F., M.R.A. and B.C.W.; Investigation, N.R.F., M.R.A. and B.C.W.; Data Curation, N.R.F., M.R.A., B.C.W. and S.P.; Writing—Original Draft Preparation, N.R.F., M.R.A. and B.C.W.; Writing—Review and Editing, P.T.B.T., R.K., S.B., N.R.F., M.R.A., B.C.W., S.P. and S.G.; Visualization, P.T.B.T., N.R.F., M.R.A., B.C.W. and S.P.; Supervision, R.K., S.G., P.T.B.T. and S.B.; Project Administration, S.G., R.K., P.T.B.T. and S.P.; Funding Acquisition, S.G. and R.K. All authors have read and agreed to the published version of the manuscript.

Funding

This research received no external funding

Acknowledgments

This work was financially supported by the Joint Graduate School of Energy and Environment, Centre of Excellence on Energy Technology and Environment at King Mongkut’s University of Technology Thonburi, Bangkok, Thailand, through the Exchange Program of the University of North Carolina Project and Development of Thailand’s Air Pollutants and Greenhouse Gases (GHGs) Emission Inventory and Projection for use in Air Quality Models Project. In addition, the authors would like to thank Orachorn Kamnoet for her assistance with the GIS work involved in this study.

Conflicts of Interest

The authors declare no conflict of interest.

References

  1. World Health Organisation Ambient (Outdoor) Air Quality and Health. Available online: https://www.who.int/news-room/fact-sheets/detail/ambient- (accessed on 23 June 2019).
  2. Cohen, A.J.; Brauer, M.; Burnett, R.; Anderson, H.R.; Frostad, J.; Estep, K.; Balakrishnan, K.; Brunekreef, B.; Morawska, L.; Pope, C.A., III; et al. Estimates and 25-year trends of the global burden of disease attributable to ambient air pollution: An analysis of data from the Global Burden of Diseases Study 2015. Lancet 2017, 6736, 1–12. [Google Scholar] [CrossRef] [Green Version]
  3. Xing, Y.-F.; Xu, Y.-H.; Shi, M.-H.; Lian, Y.-X. The impact of PM2.5 on the human respiratory system. J. Thorac. Dis. 2016, 8, E69–E74. [Google Scholar] [CrossRef] [PubMed]
  4. Kloog, I.; Ridgway, B.; Koutrakis, P.; Coull, B.; Schwartz, J. Long- and short-term exposure to PM2.5 and mortality. Epidemiology 2013, 24. [Google Scholar] [CrossRef] [PubMed]
  5. Krzyzanowski, M.; Künzli, N.; Gutschmidt, K.; Pope, A.; Romieu, I.; Samet, J.M.; Smith, K. The global burden of disease due to outdoor air pollution. J. Toxicol. Environ. Health Part A 2005, 68, 1301–1307. [Google Scholar] [CrossRef]
  6. Afshin, A.; Abate, K.H.; Cristiana, A.; Abbastabar, H. Global, regional, and national comparative risk assessment of 84 behavioural, environmental and occupational, and metabolic risks or clusters of risks for 195 countries and territories, 1990–2017: A systematic analysis for the Global Burden of Disease. Lancet 2018, 392, 1923–1924. [Google Scholar] [CrossRef] [Green Version]
  7. Burnett, R.; Chen, H.; Szyszkowicz, M.; Fann, N.; Hubbell, B.; Pope, C.; Apte, J.; Brauer, M.; Cohen, A.; Weichenthal, S.; et al. Global estimates of mortality associated with long-term exposure to outdoor fine particulate matter. Proc. Natl. Acad. Sci. USA 2018, 115, 9592–9597. [Google Scholar] [CrossRef] [Green Version]
  8. Limaye, V.S.; Schöpp, W.; Amann, M. Applying integrated exposure-response functions to PM 2.5 pollution in India. Int. J. Environ. Res. Public Health 2019, 16. [Google Scholar] [CrossRef] [Green Version]
  9. Du, Y.; Xu, X.; Chu, M.; Guo, Y.; Wang, J. Air particulate matter and cardiovascular disease: The epidemiological, biomedical and clinical evidence. J. Thorac. Dis. 2016, 8, E8–E19. [Google Scholar] [CrossRef]
  10. Cao, J.; Yang, C.; Li, J.; Chen, R.; Chen, B.; Gu, D.; Kan, H. Association between long-term exposure to outdoor air pollution and mortality in China: A cohort study. J. Hazard. Mater. 2011, 186, 1594–1600. [Google Scholar] [CrossRef]
  11. Simkhovich, B.Z.; Kleinman, M.T.; Kloner, R.A. Air pollution and cardiovascular injury: Epidemiology, toxicology, and mechanisms. J. Am. Coll. Cardiol. 2008, 52, 719–726. [Google Scholar] [CrossRef] [Green Version]
  12. Krewski, D.; Pope, C.A.; Thurston, G.D.; Thun, M.J. Extended Follow-Up and Spatial Analysis of the American Cancer Society Study Linking Particulate Air Pollution and Mortality; HEI Research Report 140; Health Effects Institute: Boston, MA, USA, 2009. [Google Scholar]
  13. National Statistical Office Thailand. Executive Summary: The 2010 Population and Housing Census; National Statistical Office Thailand: Bangkok, Thailand, 2010. [Google Scholar]
  14. Sarnat, J.A.; Schwartz, J.; Suh, H.H.; Samet, J.M.; Dominici, F.; Zeger, S.L. Fine particulate air pollution and mortality in 20 U.S. Cities. N. Engl. J. Med. 2001, 344, 1253–1254. [Google Scholar] [CrossRef] [PubMed]
  15. Chen, L.; Shi, M.; Gao, S.; Li, S.; Mao, J.; Zhang, H.; Sun, Y.; Bai, Z.; Wang, Z. Assessment of population exposure to PM2.5 for mortality in China and its public health benefit based on BenMAP. Environ. Pollut. 2017, 221, 311–317. [Google Scholar] [CrossRef] [PubMed]
  16. Qu, Z.; Wang, X.; Li, F.; Li, Y.; Chen, X.; Chen, M. PM2.5-related health economic benefits evaluation based on air improvement action plan in Wuhan city, middle China. Int. J. Environ. Res. Public Health 2020, 17. [Google Scholar] [CrossRef] [Green Version]
  17. Ngo, T.H.; Tsai, P.C.; Ueng, Y.F.; Chi, K.H. Cytotoxicity assessment of PM2.5 collected from specific anthropogenic activities in Taiwan. Int. J. Environ. Res. Public Health 2019, 16. [Google Scholar] [CrossRef] [PubMed] [Green Version]
  18. Zhang, X.; Hu, H. Combining data from multiple sources to evaluate spatial variations in the economic costs of PM2.5-related health conditions in the Beijing–Tianjin–Hebei region. Int. J. Environ. Res. Public Health 2019, 16. [Google Scholar] [CrossRef] [PubMed] [Green Version]
  19. Piscitelli, P.; Valenzano, B.; Rizzo, E.; Maggiotto, G.; Rivezzi, M.; Corcione, F.E.; Miani, A. Air pollution and estimated health costs related to road transportations of goods in Italy: A first healthcare burden assessment. Int. J. Environ. Res. Public Health 2019, 16. [Google Scholar] [CrossRef] [PubMed] [Green Version]
  20. Huang, R.; Hu, Y.; Russell, A.G.; Mulholland, J.A.; Odman, M.T. The impacts of prescribed fire on PM2.5 air quality and human health: Application to asthma-related emergency room visits in Georgia, USA. Int. J. Environ. Res. Public Health 2019, 16. [Google Scholar] [CrossRef] [Green Version]
  21. Yu, G.; Wang, F.; Hu, J.; Liao, Y.; Liu, X. Value assessment of health losses caused by PM2.5 in Changsha city, China. Int. J. Environ. Res. Public Health 2019, 16, 2063. [Google Scholar] [CrossRef] [Green Version]
  22. Kihal-Talantikite, W.; Legendre, P.; Le Nouveau, P.; Deguen, S. Premature adult death and equity impact of a reduction of NO2, PM10, and PM2.5 levels in paris—A health impact assessment study conducted at the census block level. Int. J. Environ. Res. Public Health 2019, 16. [Google Scholar] [CrossRef] [Green Version]
  23. Schwartz, J. The effects of particulate air pollution on daily deaths: A multi-city case crossover analysis. Occup. Environ. Med. 2004, 61, 956–961. [Google Scholar] [CrossRef] [PubMed] [Green Version]
  24. Vajanapoom, N.; Shy, C.M.; Neas, L.M.; Loomis, D. Associations of particulate matter and daily mortality in Bangkok, Thailand. Southeast Asian J. Trop. Med. Public Health 2002, 33, 389–399. [Google Scholar] [PubMed]
  25. Pope, C.A.; Burnett, R.T.; Thun, M.J.; Calle, E.E.; Krewski, D.; Ito, K.; Thurston, G.D. Lung cancer, cardiopulmonary mortality, and long-term exposure to fine particulate air pollution. J. Am. Med. Assoc. 2002, 287, 1132–1141. [Google Scholar] [CrossRef] [PubMed] [Green Version]
  26. Schwartz, J.; Dockery, D.W.; Neas, L.M. Is daily mortality associated specifically with fine particles? J. Air Waste Manag. Assoc. 1996, 46, 927–939. [Google Scholar] [CrossRef]
  27. Vichit-Vadakan, N.; Vajanapoom, N.; Ostro, B. The Public Health and Air Pollution in Asia (PAPA) Project: Estimating the mortality effects of particulate matter in Bangkok, Thailand. Environ. Health Perspect. 2008, 116, 1179–1182. [Google Scholar] [CrossRef] [PubMed]
  28. Vichit-Vadakan, N.; Vajanapoom, N. Health impact from air pollution in Thailand: Current and future challenges. Environ. Health Perspect. 2011, 119, 2–5. [Google Scholar] [CrossRef] [Green Version]
  29. Wong, C.M.; Vichit-Vadakan, N.; Kan, H.; Qian, Z. Public Health and Air Pollution in Asia (PAPA): A multicity study of short-term effects of air pollution on mortality. Environ. Health Perspect. 2008, 116, 1195–1202. [Google Scholar] [CrossRef] [PubMed] [Green Version]
  30. Guo, Y.; Li, S.; Tawatsupa, B.; Punnasiri, K.; Jaakkola, J.J.K.; Williams, G. The association between air pollution and mortality in Thailand. Sci. Rep. 2014, 4, 5509. [Google Scholar] [CrossRef] [Green Version]
  31. Fann, N.; Baker, K.R.; Fulcher, C.M. Characterizing the PM2.5-related health benefits of emission reductions for 17 industrial, area and mobile emission sectors across the U.S. Environ. Int. 2012, 49, 141–151. [Google Scholar] [CrossRef]
  32. US EPA. Review of the National Ambient Air Quality Standards for Particulate Matter: Policy Assessment of Scientific and Technical Information; Environmental Protection Agency: Research Triangle Park, NC, USA, 1996. [Google Scholar]
  33. Chuersuwan, N.; Nimrat, S.; Lekphet, S.; Kerdkumrai, T. Levels and major sources of PM2.5 and PM10 in Bangkok Metropolitan Region. Environ. Int. 2008, 34, 671–677. [Google Scholar] [CrossRef]
  34. Vichit-Vadakan, N.; Ostro, B.D.; Chestnut, L.G.; Mills, D.M.; Aekplakorn, W.; Wangwongwatana, S.; Panich, N. Air pollution and respiratory symptoms: Results from three panel studies in Bangkok, Thailand. Environ. Health Perspect. 2001, 109, 381–387. [Google Scholar] [CrossRef]
  35. Pinichka, C.; Makka, N.; Sukkumnoed, D.; Chariyalertsak, S.; Inchai, P.; Bundhamcharoen, K. Burden of disease attributed to ambient air pollution in Thailand: A GIS-based approach. PLoS ONE 2017, 12, e0189909. [Google Scholar] [CrossRef] [PubMed]
  36. WHO International Statistical Classification of Diseases and Related Health Problems 10th Revision (ICD-10). Available online: https://icd.who.int/browse10/2016/en# (accessed on 10 July 2019).
  37. US EPA. Environmental Benefits Mapping and Analysis Program—Community Edition User’s Manual; 2017. Available online: https://www.epa.gov/sites/production/files/2015-04/documents/benmap-ce_user_manual_march_2015.pdf (accessed on 1 June 2019).
  38. Nodzu, M.I.; Ogino, S.Y.; Tachibana, Y.; Yamanaka, M.D. Climatological description of seasonal variations in lower-tropospheric temperature inversion layers over the Indochina Peninsula. J. Clim. 2006, 19, 3307–3319. [Google Scholar] [CrossRef]
  39. Al-Hemoud, A.; Al-Sudairawi, M.; Al-Rashidi, M.; Behbehani, W.; Al-Khayat, A. Temperature inversion and mixing height: Critical indicators for air pollution in hot arid climate. Nat. Hazards 2019, 97, 139–155. [Google Scholar] [CrossRef]
  40. Kwak, H.Y.; Ko, J.; Lee, S.; Joh, C.H. Identifying the correlation between rainfall, traffic flow performance and air pollution concentration in Seoul using a path analysis. Transp. Res. Procedia 2017, 25, 3552–3563. [Google Scholar] [CrossRef]
  41. Jacob, D.J.; Winner, D.A. Effect of climate change on air quality. Atmos. Environ. 2009, 43, 51–63. [Google Scholar] [CrossRef] [Green Version]
  42. Lambert, S.J.; Fyfe, J.C. Changes in winter cyclone frequencies and strengths simulated in enhanced greenhouse warming experiments: Results from the models participating in the IPCC diagnostic exercise. Clim. Dyn. 2006, 26, 713–728. [Google Scholar] [CrossRef]
  43. Newell, K.; Kartsonaki, C.; Lam, K.B.H.; Kurmi, O.P. Cardiorespiratory health effects of particulate ambient air pollution exposure in low-income and middle-income countries: A systematic review and meta-analysis. Lancet Planet. Health 2017, 1, e360–e367. [Google Scholar] [CrossRef] [Green Version]
Figure 1. Workflow of the study procedure.
Ijerph 17 07298 g001
Figure 2. Population density and air quality monitoring stations over the study domain (stations include 59—PhayaThai; 02—ThonBuri; 03—Bangkhuntien; 05—Bang Na; 61—WangThonglang; 10—BangKapi; 11—DinDaeng; 12—Yannawa; 50—PathumWan; 52—ThonBuri; 53—LatPhrao; 54—DinDaeng).
Ijerph 17 07298 g002
Figure 3. Daily average PM2.5 and PM10 concentrations, and PM2.5/PM10 ratios during 2012–2018.
Ijerph 17 07298 g003
Figure 4. Monthly variation of PM2.5 concentrations and temperatures during 2012–2018.
Ijerph 17 07298 g004
Figure 5. Monthly variation of PM2.5 concentrations and relative humidity with cumulative monthly rainfall during 2012–2018.
Ijerph 17 07298 g005
Figure 6. Relationship between All-Cause Non-Accidental, Cardiopulmonary, and Lung Cancer Mortalities and PM2.5 concentrations in Bangkok.
Ijerph 17 07298 g006
Table 1. Descriptive statistics of PM2.5 measurements in Bangkok during 2012–2018.
YearNo. of StationMissing Data (%)Statistical Values (µg/m3)
Mean (±SD)Q1, Q3, and IQR
2012190.333.7 (±14.0)24.2, 38.5, and 14.3
2013192.035.5 (±17.7)22.5, 41.3, and 18.9
2014288.530.6 (±16.1)20.7, 39.4, and 18.8
2015373.228.1 (±15.4)17.5, 35.8, and 18.4
2016561.427.7 (±14.8)16.8, 34.3, and 17.5
2017646.426.1 (±14.2)15.6, 33.5, and 17.9
20181022.527.2 (±15.3)16.6, 33.7, and 17.0
SD: Standard deviation; Q1, Q3: First and third quartiles; IQR: Interquartile range.
Table 2. Seasonal variance in meteorological indicators and PM2.5 concentrations in Bangkok.
SeasonMonthAverage PM2.5 (µg/m3)Average % Relative HumidityAverage Wind Direction (°)Average Temperature (°C)Average Wind Speed (m/s)Monthly Cumulative Rainfall (mm)
Dry, CoolJanuary40.862.016527.71.140.9
Dry, CoolFebruary39.162.716928.91.114.3
HotMarch31.066.718530.21.247.0
HotApril26.765.518631.11.172.6
HotMay17.967.219431.01.1132.2
Hot, RainyJune18.069.421030.01.1197.4
RainyJuly18.170.821929.31.1151.3
RainyAugust17.471.322029.21.1185.2
RainySeptember18.274.721228.70.9314.6
RainyOctober26.673.617128.70.8277.6
Dry, CoolNovember28.866.015629.10.970.9
Dry, CoolDecember39.858.615428.01.020.5
Table 3. Pearson correlations coefficient between particulate matter and meteorological factors.
FactorsPM2.5PM10Relative HumidityWind DirectionTemperatureWind SpeedRain
PM2.51.000
PM100.9441.000
Relative Humidity−0.451−0.4621.000
Wind Direction−0.353−0.3700.2211.000
Temperature−0.240−0.255−0.1700.2911.000
Wind Speed−0.208−0.295−0.1740.1530.2181.000
Daily Rainfall−0.201−0.2010.4850.032−0.261−0.2151.000
Table 4. Avoided deaths in Bangkok from a 10 µg/m3 rollback of PM2.5 in the year 2016.
United States aChina b
Health Endpointsβ Values (Standard Deviation)Avoided Mortalityβ Values (Standard Deviation)Avoided Mortality
Mortality, All-cause non-accidental0.00583 (±0.00096)27720.000896 (±0.000538)374
Mortality, cardiopulmonary0.0122 (±0.00135)16860.002547 (±0.006250)316
Mortality, lung cancer0.0131 (±0.00379)2910.00334 (±0.001758)67
a: Pope et al. [25]; b: Cao et al. [10].
Table 5. Health burden and avoided deaths in 2016 due to rollbacks to the Thai National Ambient Air Quality Standards (NAAQS) and the World Health Organization (WHO) guidelines.
Health EndpointHealth BurdenThailand Standard 25 µg/m3WHO Guideline 10 µg/m3
Deaths * (95% CI)Avoided Deaths * (95% CI)Avoided Deaths * (95% CI)
Mortality, non-accidental4240 (1219–6938)1393 (593–2691)3159 (893–5248)
Mortality, cardiopulmonary1317 (1065–1551)360 (284–434)959 (769–1140)
Mortality, lung cancer370 (175–530)102 (45–156)270 (125–397)
* Specific for age 30–99.

