Article

Evaluation of the Nutritional Quality of Processed Foods in Honduras: Comparison of Three Nutrient Profiles

by
Adriana Hernandez Santana
1,*,
Sharyl Waleska Bodden Andrade
2,
Dina Rojas Aleman
3,
Jean Pierre Enríquez
4 and
Adriana Beatriz Di Iorio
1
1
Human Nutrition Laboratory, Department of Food Science and Technology, Zamorano University, San Antonio de Oriente, Francisco Morazan, Tegucigalpa 11101, Honduras
2
Faculty of Health Sciences, Central American Technological University, Tegucigalpa 3539, Honduras
3
Zamorano University, San Antonio de Oriente, Francisco Morazan, Tegucigalpa 11101, Honduras
4
Masters Program in Sustainable Tropical Agriculture, Graduate Department, Zamorano University, Tegucigalpa 11101, Honduras
*
Author to whom correspondence should be addressed.
Int. J. Environ. Res. Public Health 2020, 17(19), 7060; https://doi.org/10.3390/ijerph17197060
Submission received: 14 August 2020 / Revised: 5 September 2020 / Accepted: 16 September 2020 / Published: 27 September 2020
(This article belongs to the Section Global Health)

Abstract

:
Obesity is considered a global pandemic. Different countries have worked to implement front-of-package (FOP) labeling systems that define thresholds for critical nutrients (CN) as part of their public health policies. The objective of this study is to identify the proportion of Processed (PF) and Ultra-Processed (UPF) Foods marketed in Honduras, which meet or fall short of the criteria of three Nutrient Profile Models (NPM): PAHO (2016), Chile (2017) and the Central American Technical Regulation Proposal-Nutritional Warning Front Labeling (CATRP-NWFL 2017). This study is descriptive; 1009 products from 206 brands were collected nationwide. Descriptive statistics were performed. The mean CN compliance with the three models was 49.3% for sodium, 30.6% for sugars, 63.1% and 96% for saturated and trans fats. The PAHO and Chilean (NPM) similarly concentrated on the lower compliance with the established criteria, unlike the CATRP, which has less stringent criteria. This is the first assessment of CN content in PF and UPF in Honduras under three different NPMs. We highlight the importance of defining or adopting criteria for the implementation of NWFL as information for the consumer and thereby contribute to reducing the risks of obesity and related diseases.

1. Introduction

Globally, the number of people with obesity has tripled in the past 40 years [1,2]. The latest report from the World Health Organization (WHO) considers overweight and obesity as a global pandemic. In 2016, more than 1.9 billion adult people from age 18 and over were overweight; of these individuals, more than 650 million were obese. The prevalence of overweight and obesity among children and adolescents aged 5–19 has risen dramatically from 4% in 1975 to 18% in 2016 [2]. Moreover, the highest proportion of overweight and obesity corresponds to the countries affected in the Pacific and the Caribbean, countries of the Middle East and Central America. At the Latin American level, the highest proportion of obesity among boys is in to Chile (11.9%) and Mexico (10.5%), whereas the highest obesity rates for girls are observed in Uruguay (18.1%) and Costa Rica (12.4%) [3].
One of the determining factors for the global increase in obesity is the frequency of consumption of processed (PF) and ultra-processed (UPF) foods, causing alteration in people’s diet. These have been defined by the Pan American Health Organization (PAHO) as “industrial products that are characterized by having high caloric density together with high levels of sugar, saturated fats, sodium, and deficient levels of vitamins and minerals”. While PFs are mostly made up of two or three ingredients, UPFs can have five to twenty, or more, including substances that have been extracted from foods of unusual culinary use; substances made from food components; and additives used for modifications in color, flavor, taste and texture of the final product [4]. Some examples include sweet or salty packaged snacks, chocolates, candies, cookies, breakfast cereals, jams, jellies, carbonated and energy drinks, milk-based sugary drinks, and more [4,5].
Scientific evidence supports the strong association between UPF consumption and the risk of developing Non-Communicable Diseases (NCDs), especially obesity [5,6,7,8,9]. The prevalence of these conditions increases directly as the consumption of UP and UPF surges [10]. Some studies have shown that, in high-income countries, the consumption of processed foods and beverages provides for more than two-thirds of dietary energy [11]. Similarly, in low and middle-income countries, the consumption of these foods is increasing [12,13].
During the 2000–2013 period, a significant increase in the volume of sales of ultra-processed foods and beverages could be observed, considering Latin America as the potential market for this range of products, except for Argentina and Venezuela. Modern grocery stores, especially supermarkets and hypermarkets, tend to dominate the distribution channels for this type of food [5].
Research on the influence of eating habits and nutrition amongst the Honduran population is scarce for both children and adults. A study carried out in the municipality of San Antonio de Oriente (Honduras) identified that the consumption of energy-dense foods begins from an early age, observing deficiencies in the consumption of fruits and vegetables, followed by an excess of sodium intake throughout the subjects’ life-course, concluding that they suffer from a high nutritional risk and involvement of NCDs [14]. This situation highlights the need to implement policies aimed at informing consumers regarding the high content of calories, sugars, sodium, and saturated fats in foods and beverages. Reducing the intake of these products may prevent related NCDs due to an inadequate diet.
In order to guide countries in the prevention of obesity and other related diseases, PAHO published its Nutrient Profile Model (PAHO-NPM) [5] in 2016, which it defines as “the science of classifying foods according to its nutritional composition for reasons related to disease prevention and health promotion” [15].
The Nutrient Profile Model (NPM) can be used by national authorities to formulate policies such as restrictions on advertising to children, the inclusion of front labeling or health and nutritional claims [16]. Different countries have worked on the implementation of front-of-package (FOP) labeling systems, establishing criteria or thresholds on the content of Critical Nutrients (CN) to include specific warnings on the packaging of products that exceed the established thresholds [17].
A recent study carried out in Honduras (2018) on the content of CN in 520 PF and UPF available in the Honduran market reported that 75% of the products, analyzed under the PAHO-NPM, presented excess sugars, (37%) sodium, (33%) total fat, and (30%) contained sweeteners [18] per serving.
Chile in 2016 was the first country to implement a mandatory warning label system (Chilean-NPM) for foods high in caloric density, added sugar, sodium, and saturated fat with various stages of implementation that were finalized in 2019 [19,20,21]. Mexico, as part of a government strategy to prevent obesity and NCDs, has implemented the proposal for mandatory front labeling, with a special focus on providing easy-to-understand information on ingredients with a negative impact on health (added sugars, sodium, total fats, saturated fat) and caloric density, which facilitate the most convenient choice being made according to the health of each person [22].
Recently, the Institute of Nutrition of Central America and Panama (INCAP) has proposed the Central American Technical Regulation Proposal (CATRP) of “Food and Drinks Front Labeling of Nutritional Warning (FLNW): Requirements for its application” [23], based on the PAHO-NPM (2016), with minor variations. Moreover, this is the first study where the INCAP proposal is taken into consideration.
Honduras does not have an NPM or the obligation to include the nutritional label on food packaging, and since the current Central American Technical Regulation Proposal is voluntary [23], the CATRP-FLNW requires more evidence for its implementation. To date, the proportion of PF and UPF marketed in Honduras where CN content meets or disregards the criteria established by the PAHO-NPM or any other model, such as the Chilean-NPM and the CATRP-FLNW, is unknown, since Honduras imports most of these types of products. Mexico carried out this exercise with seven different NPMs [24] and observed differences between the food categories according to each NPM, with the PAHO-NPM being the most rigorous.
The objective of this study is to identify the proportion of PF and UPFs with excessive amounts of CN by using three nutrient profile models: PAHO-NPM, Chilean-NPM and CATRP-FLNW, and to compare their nutritional content among the products that meet, or not, the criteria established for each NPM. The information from this analysis will provide further evidence to drive the implementation of the CATRP-FLNW for the benefit of the Honduran population.

2. Materials and Methods

The descriptive study was carried out in the human nutrition laboratory of Zamorano University, located in the department of Francisco Morazán, Honduras. The products were collected from the main supermarket chains located in the two most important cities in Honduras (Tegucigalpa and San Pedro Sula).

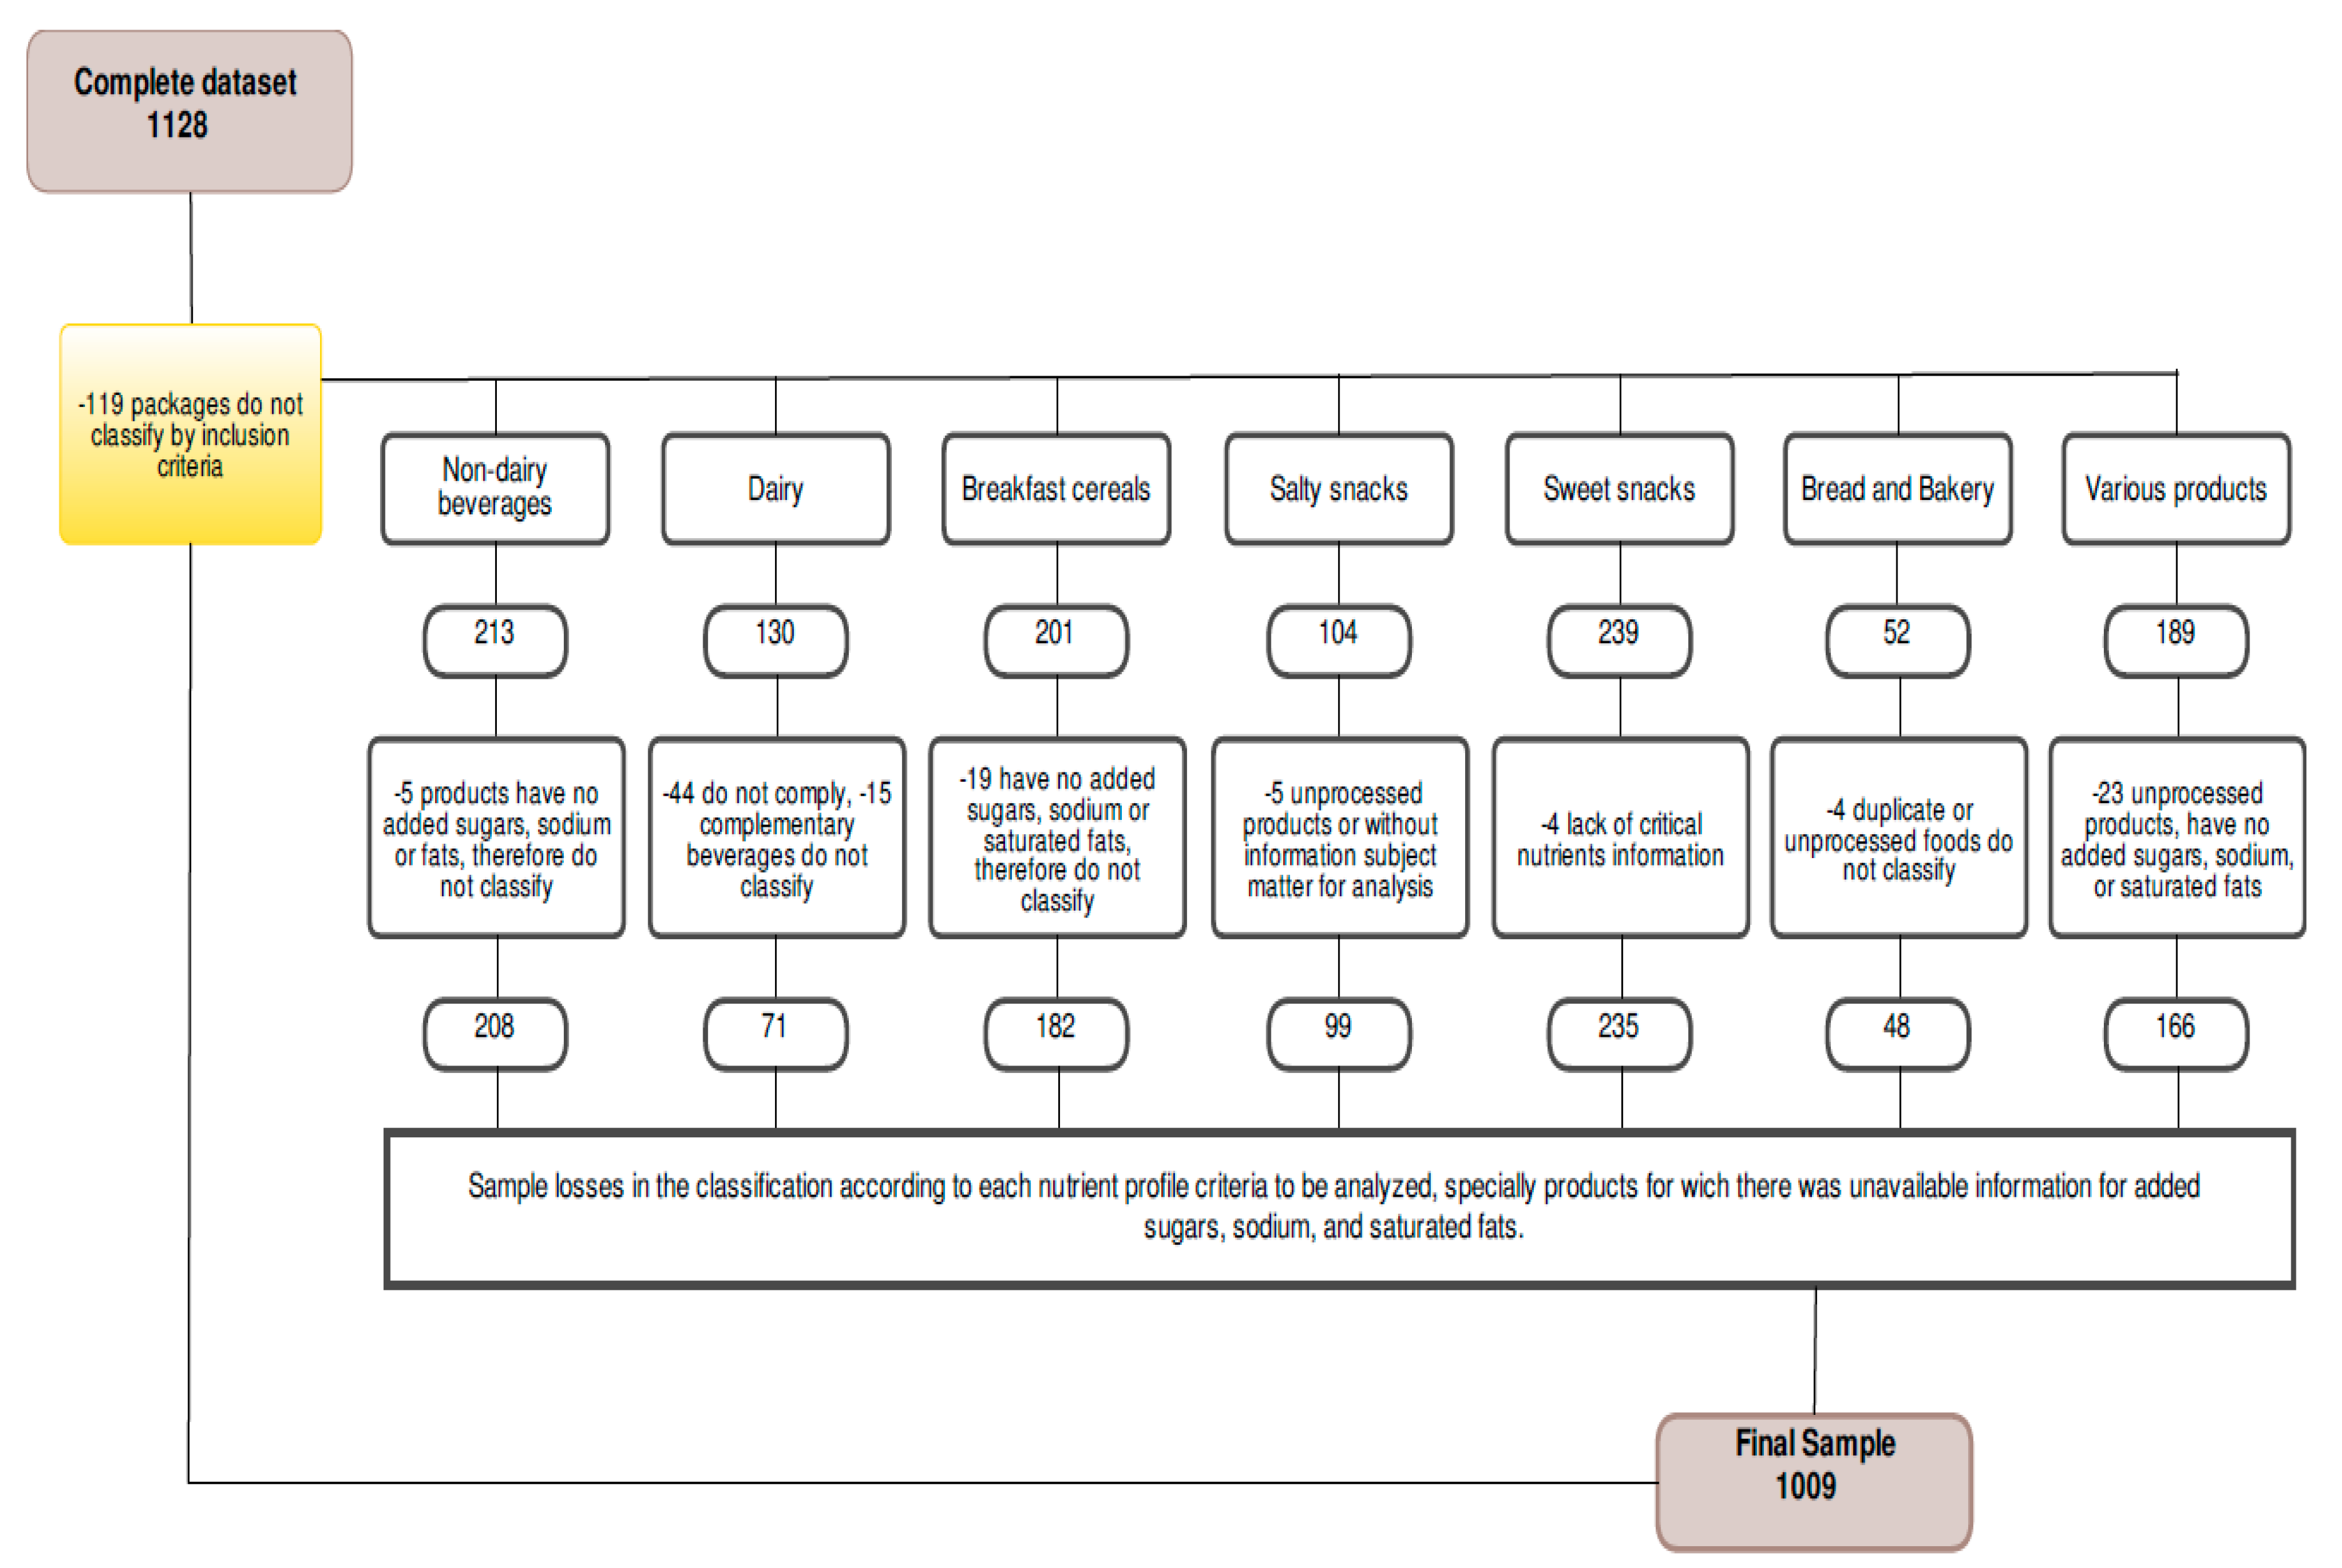
2.1. Data Collection

The data collection of the nutritional content of PF and UPF was carried out between July and September 2019 by a team of qualified professionals. The 2018 product database was updated, in which information was added on new products by purchasing and taking photographs of the labeling and packaging. Subsequently, a stratification was performed according to their nutrient profile in an Excel 2013 datasheet.
The PAHO-NPM and the NOVA classification were used as a reference to define the products in minimally processed, processed, and ultra-processed foods [5,25]. The categories selected usually included PFs and UPFs, which has been one of the largest discussions on nutrition policy [25].
For the selection of the products, whether they included information of the company, brand, country of origin, nutritional information, container size, and list of ingredients was taken into consideration. The products were classified into the following categories: non-dairy beverages, dairy products, salty snacks, sweet snacks, cereal products, bread and bakery, and various products. Food supplements and culinary ingredients, such as cooking oils, butter, salt, honey, sugar, sweeteners, and freshly prepared dishes, were excluded from the analysis [5,25]. Only PF and UPFs were considered for their respective analysis of compliance with the CN thresholds of each model used in the present study.
It was verified that the nutrient content of each product in the database was complete and correctly entered; any incomplete information was cross-verified with the photographic database. A random review of 5% of the products was carried out to ascertain the quality of the data, and no irregularities were found. When the nutritional label did not report the amount of free sugars, the method proposed by PAHO was used to calculate the free sugars based on the total declared sugars in the packages [5].
Duplicate or missing data was excluded from the analysis (n = 119), as well as those in which data errors were identified, or if the products were replicated, such as the same product in different presentations. The detailed breakdown of the excluded products is described in Figure 1. In this way, information on 1009 products (PF and UPF) corresponding to 206 brands present in the Honduran market was analyzed.

2.2. Nutrient Profiling Systems

Three NPMs used for Latin American countries were used to compare the nutrient content of PF and UPF:
(1)
Nutrient Profile Model of the Pan American Health Organization/PAHO (PAHO-NPM).
(2)
Chilean Nutrient Profile Model (Chilean-NPM).
(3)
The Central American Technical Regulation Proposal for “Frontal Labeling of Nutritional Warnings” (CATRP-FLNW) by INCAP (Institute of Nutrition of Central America and Panama).
The PAHO-NPM served as the basis for the creation of the Chilean-NPM and CATRP-FLNW, used in the countries’ food policy [26]. Each product was individually classified according to the criteria of each NPM, verifying the presence of sodium, sugar, saturated fats, and trans fats in particular (Table 1).

2.3. Statistical Anlysis

As part of the analytical statistics, the mean and standard deviation (SD) were estimated for each of the food groups present in the three NPMs. Confidence intervals with 95% reliability were obtained using the SAS version 9.4 program. The nutritional content of food and beverage categories was examined, and the percentage of products that did, or did not, meet the criteria for each nutrient limit was estimated. The Chilean-NPM has established thresholds to determine compliance or non-compliance with a permissible limit. For the PAHO-NPM and CATRP-FLNW, the analysis was performed based on the maximum allowable cut-offs for each product, according to the criteria mentioned in Table 1.

3. Results

Foods were cataloged into seven categories and classified as: non-dairy beverages (n = 208), dairy (n = 71), salty snacks (n = 99), sweet snacks (n = 235), cereal products (n = 182), bread and bakery (n = 48), and various (n = 166). Their descriptions are presented in Table 2.
The highest percentage of analyzed products came from the American continent, and the lowest proportions from Asia and Europe, as can be observed in category in Figure 2. By category, the majority of products from Asia are non-dairy beverages, and those from Europe are sweet snacks.
It is possible to identify PF and UPF where CN content complies with the thresholds of each of the models mentioned in Table 3, and estimate those found with excessive CN content. For example, 44.2% of the total products comply with the PAHO-NPM, in respects to sodium.
By NPM, of all the products analyzed under the PAHO-NPM, 44.2% met the threshold allowed for sodium, 25.0% for free sugars, 60.5% for saturated fats, and 94.9% of the total products analyzed in this study were within the established for trans-fats. This means that the lowest compliance with the established criteria corresponds to the content of free sugars (75.0% of the products do not meet the criteria). Bread and bakery (0%), non-dairy beverages (2.8%), dairy products (11.2%) and cereal products (12%) presented the lowest compliance percentages, which is why they constitute the PF and UPF categories with excessive contents of free sugars. Salty snacks were the products with the highest compliance percentage (86.8%) according to free sugar content, followed by the various product category (57.8%).
After the lower compliance in the content of free sugars applying the PAHO-NPM, the proportion of PF and UPF corresponded to an excessive content of sodium (55.8% of non-compliance). Most of the various products (90.3%) met the sodium criteria; bakery products, sweet snacks, dairy and non-dairy beverages were the categories with the least compliance; that is, they evinced excessive sodium contents.
Non-dairy beverages and cereal-based products met the criteria for saturated fat by more than 85% (94.2% and 89.5%, respectively). The bread and bakery category presented the lowest percentage of compliance for saturated fat (2.0%), in comparison to the other categories of products analyzed that obtained a higher percentage of compliance.
In the framework of the Chilean-NPM (Table 3), 31.4% of the products met the criteria for sodium, 60.3% for total sugars, and 32.6% of the products were within the established range for saturated fats. The categories of salty snacks, various products, bakery, and cereal products were the categories with the lowest compliance in respect to the limits established regarding sodium (25.2%, 27.7%, 45.8%, and 50%, respectively) with the Chilean model.
Additionally, low levels of compliance with total sugar criteria were also observed in the categories of sweet snacks (12.7%), cereal products (14.2%), dairy beverages (16.9%), and non-dairy beverages (22.5%). The majority (99.5%) of non-dairy beverages, dairy beverages (98.5%) and cereal products (85.7%) were within the established range for saturated fats. However, low percentages of compliance were identified in the categories of salty snacks, sweet snacks, bread and bakery (21.2%, 28.1%, and 47.9%, respectively).
With the CATRP-FLNW model (Table 3), for the total of analyzed products, only 43.3% met the sodium criteria, 34.2% for total sugars, 63.6% for saturated fat, and 97.2% for trans-fat.
The proportion of products that met the CATRP-FLNW criteria for total sugars represents a minimum percentage in the categories of non-dairy beverages (6.7%), dairy beverages (11.2%), bread and bakery (14.5%), sweet snacks (21.6%) and cereal products (25.8%). Most products met the criteria for saturated fat in the categories of non-dairy beverages and cereal products (98.5% and 89.5%, respectively), unlike salty snacks (32.3%), dairy beverages (35.2%), and sweet snacks (38.7%).
Dairy beverages, sweet snacks, and non-dairy beverages had low compliance in regards to the established sodium thresholds (18.3%, 20.8%, and 22.5%, respectively) in this model. The products with scant compliance with the criteria of total sugars are non-dairy beverages, dairy beverages, and bread and bakery (6.7%, 11.2%, and 14.5%, respectively).
Regarding the values of CN content in food products that were obtained by applying the reference models, the average content of each CN was lower in compliant products than in non-compliant products, as shown in Table 4.
The differences between the three models analyzed are statistically significant for total sugars (p < 0.05), sodium (p < 0.05), and free sugars (p < 0.05). These were the CN that showed the greatest difference in the mean contents of the food categories, followed by saturated fat (p < 0.05). Whereas, for trans fats in the PAHO-NPM, the nutritional content was approximately similar, without significant differences.
In Table 4, using the Chilean NPM, the products that met the threshold of the three CN presented a lower average compared to those that did not meet the threshold. However, products that complied with PAHO-NPM and CATRP-FLNW models, particularly sodium (p < 0.05), presented a higher mean compared to those that did not comply. Therefore, the Chilean model was stricter because it presented less compliance when compared to the other models.
Table 5 shows the percentages of food products that generally complied with all the criteria according to the applied NPM. In general, the PAHO-NPM (8.0%) was as strict as the Chilean-NPM (8.8%), whereas CATRP-FLNW was the least strict (11.6%) of the three models, specifically in the cereal categories, bread and bakery, and various products.

4. Discussion

We observed clear differences in the average nutritional content for each CN, especially for sodium, saturated fat, free and total sugars. The WHO recommends limited consumption of CN [27,28,29]. In Honduras, there have been no previous studies on the proportion of products available under various nutrient-profiling systems, as it has been done by Colombia [30] and Mexico [24], who reported similar results to this study.
The PAHO-NPM is the reference model since it is the one that proposes the strictest criteria in the CN content; therefore, it was the model capable of identifying those products that met these criteria, being the one that identifies the least compliance ratio in all CNs (8.0%).
The greatest disparity in terms of the proportion of products with excess in CN content, according to the criteria of the three models, was identified in sodium, followed by sugars, in which the three models had different criteria. The PAHO-NPM refers to free sugars (if the calories from free sugars were equal to or greater than 10% of the total calories), Chilean-NPM to total sugars (if per 100 mL of liquids it was greater than 5 mg; or 10 g per 100 g in solid products) and the CATRP-FLNW to total sugars (if it was greater than or equal to 20% of the total energy from sugars totals). A similar situation can be observed with saturated fats, where the PAHO-NPM was the strictest. Regarding trans-fat, the PAHO-NPM considers excess trans-fat if the calories from trans-fat were equal to or greater than 1% of the total calories. Meanwhile, the CATRP-FLNW did not accept the presence of any amount of trans-fat in its formulation.
In the analysis of Table 5, it can be seen from this sample that Honduran food does not meet the recommendations for Critical Nutrient intake, with the bakery category being the most critical in terms of its CN content. It is noteworthy that this category refers to broad artisanal production, being a micro-enterprise category, which requires regulation and training.
According to Table 6, the average of the three models was 49.3% for PF and UPF, which met the criteria for sodium content, and the remaining 50.7% had excessive contents of this critical nutrient. Particularly, a higher non-compliance percentage was observed among the sweet snacks category; however, the highest non-compliance was found in dairy beverages, according to the CATRP-FLNW (18.3% of compliance). In general, the highest compliance in all the categories was observed in the Chilean-NPM (60.3%), and the PAHO-NPM and CATRP-FLNW were similar to each other.
For sugars, Table 6 shows that, the average of the three models showed 30.6% for the PF and UPF met the sugar content criteria, whether they were free (PAHO-NPM) or total (Chilean-NPM and the CATRP-FLNW). Therefore, the remaining 69.4% bear an excessive content of this critical nutrient, especially higher percentages in non-dairy beverage category, with only 2.8% compliance according to the PAHO-NPM. In general, the highest compliance for the total of the categories was affected by the CATRP-FLNW (34.2%), followed by the Chilean-NPM (32.6%).
For saturated fats, Table 6 shows that the average of the three models, 63.1% of PF and UPF, met the criteria for saturated fat content, corresponding to the highest non-compliance ratio in salty snacks, followed by sweet snacks and the bread and bakery category, with the lowest compliance value (2.0%), followed by non-dairy drinks for free sugars (2.8%), according to the PAHO-NPM. In general, the highest compliance in all food categories was observed in the Chilean NPM (65.1%), which was close to the proportion estimated with the CATRP-FLNW (63.6%). Salty snacks was the category with the lowest compliance regarding saturated fat content (28.9%).
The category labeled as sweet snacks showed the lowest compliance for the three NPMs with respect to sodium, sugars, and saturated fat content. In the same way, non-dairy drinks, followed by dairy drinks, cereal products, and sweet snacks, were the product categories with the lowest compliances, in regards to sugar content in the three models. Bakery products were the foods with the lowest compliance with the trans-fat content criterion, according to the PAHO-NPM, which suggests that the offer of this type of product to Honduran food does not meet the recommendations for this CN.
Observing the analysis of the three models in Table 6, there is a clear trend regarding compliance in the bakery and sweet snack categories with respect to sodium limits, with an average of less than 43%. The above is of great interest because most of the breakfast and snack foods provided to school-age children fall within these categories. Therefore, this generates concern regarding the development of bad eating habits, increasing the rates of childhood overweight and obesity, along with the future adults with a higher risk of NCDs. This observation does not only apply to schoolchildren in low-income areas, but it is also observed in middle and upper-class areas.
A cross-sectional study carried out in Canada [31] analyzed foods and beverages with low nutritional quality under various NPMs and showed that, in general, the PAHO-NPM presented the strictest criteria, which was only met in 9.8% of foods. Nevertheless, they were classified as the most eligible for marketing to children. These results are consistent with the present study, especially in the categories of bakery products, snacks, beverages, and dairy products, which present low compliances. In addition, it is necessary to define strategies aimed at improving the supply of better nutritional quality food in national markets with the proposal to reduce the supply of PFs and UPFs, as well as promoting the reform of products to improve their nutritional quality.
Studies carried out in Mexico [32] and France [33] reported that the nutritional content of cereal products had great variability among all CNs with different NPM, particularly for sugars, saturated fats, and sodium, which did not concur with the results of this study. Regardless of the NPM used, this category showed similar results at the different CNs.
Moreover, another global study [34] on cereal products revealed a high content of CN such as sugar and sodium. This finding is consistent with the results of the present study, where low compliance prevails concerning sodium and sugars, and cereals were found to provide low nutritional quality in their formulation.
In Honduras, the analysis of a national sample of 144 commercial processed foods, determined to be functional, showed that sweetened breakfast cereals were the most caloric (180 kcal) per serving.
More than 70% of functional processed foods exceeded the sugar recommendation with the PAHO-NPM, mainly including sweetened breakfast cereals (100%) and sweetened juices (93%). Regarding sodium, 49% of the products exceeded the recommendation, certain baked products (100%) as well as cheeses (86%), just like 100% of the products exceeded the total fat recommendation. In that study, more than 60% of the products were selected simultaneously and exceeded between 2 and 3 PAHO-NPM criteria; 5% exceeded all the criteria and 4% met all the PAHO-NPM criteria [35]. In the present study, 8.0% met all the criteria for this model, without being classified as functional, which points to the urgent need to implement the respective regulations for the timely identification of products with excess in one or more CN.
A fundamental difference between the use of the PAHO-NPM and the CATRP-FLNW concerning the Chilean-NPM is the use of an approach based on nutrient density, concerning the volume of nutrients to classify foods. The former is based on energy density (nutrients per calorie), unlike the Chilean-NPM that calculates the content of nutrients per 100 g or 100 mL of the total products (nutrients in relation to volume) [21].
With the application of the PAHO-NPM, low-calorie density products could be regulated due to a high ratio of nutrients compared to calories. For example, for sodium, the PAHO-NPM is based on a 1:1 ratio (1 mg sodium/1 kcal), unlike the Chilean-NPM, in which the criteria being analyzed is based on sodium density, representing variations in respect to the type of product, that is, whether it belongs to the food or beverage category. Therefore, under the PAHO-NPM, product categories that are low in calories but high in sodium could exceed the thresholds for this critical nutrient [5]. Hence, sodium was the CN with the greatest variability in the three models, identifying that the Chilean-NPM is more permissive.
This study provides comparative evidence of what could happen with the implementation of the proposed CATRP-FLNW for the Central American region and review of the advisability of proposing stages of implementation to adjust these criteria. This situation is essential for the benefit of the population and to control the current NCDs epidemic, in addition to implementing regulations for zero use of trans fats in products to prevent cardiovascular disease [36]. From the models applied to this study, it can be seen that CATRP-FLNW would require strengthening its regulation towards sugars, since more permissiveness is observed with this specific CN, probably gradually and with the industry’s acceptance. Its application must be mandatory and for the benefit of the population.
A nutrient profile with weak criteria is on par with the classification of a higher percentage of processed foods as “regulated”, therefore it may be necessary to promote the intake of CN in lower amounts in the diet [19], with the respective implications. However, a nutrient profile with very strict criteria would not represent an attractive option for the food industry, and consequently, its efficiency in food promotion and regulation would be limited [37], unless there was a systematic reduction of CN, as seen in the example of Chile [20].
The products that present mostly excess contents of various critical nutrients should be regulated in their offer and their advertising, as some countries have already done, as well as the implementation of frontal labeling, such as in Chile [20], Ecuador [38] and France [39], and thus be able to include dietary guidelines to promote a healthy and balanced diet, allowing the inclusion of prefabricated foods in a healthy and responsible way [40]. This should include basic studies regarding the consumption of nutrients in the population to identify the existence of a positive impact on the practice of food selection based on its nutritional quality. The results obtained in this study can be useful for the elaboration of standardized educational material aimed at the school population to improve and modify the needs and eating styles of the Honduran population.
Equally important is the updating of the dietary guide, which would be based on the results of this study and the CATRP-FLNW, and if necessary, carry out more studies to establish the usefulness of the criteria for each model of interest [40,41], taking into account the target population, vulnerable population and knowledge of nutritional topics (diet and food availability), focused on improving public health [25], identifying agreements with the food industry, in light of the urgent need to promote reformulation of products [42] and regulation of advertising [43,44].
It is known that FLNW plays a priority role in the area of health, considering that not all FLNW contain abundant and detailed information on the nutritional value of the product, or do not convey data that facilitates the consumer’s understanding of the percentage of nutrients, and the value in the consumption of each one. Thus, there is a need for research on how FLNWs work in the real world. Does the population understand the values reflected in the FLNW? Does the FLNW create a real impact when making the purchase of food by the population [45]?
The limitations of this study include the inability to count the regulatory agents in Honduras regarding the limits of the critical nutrient content and control in the production of PF and UPF. There was also no front labeling implemented in national production; this highlights the importance of supporting the implementation of the CATRP-FLNW.
The strengths of this study rely on the information collected directly from Honduran supermarkets at various levels and locations. The sample was made up mostly of PFs and UPFs of Latin American origin that could be evaluated by the three nutrient profiles, although there are others worldwide, and those with relevance at the Latin American level were included. Analysis preference was given to the related critical nutrients of greatest interest, such as the content of sodium, sugars, and saturated fats.
The study used the PAHO-NPM as a reference, which has been previously validated using specific methods that show greater validity in the identification of foods with the presence of excess critical nutrients, which the CATRP-FLNW uses as a basis, as well as the experience from countries like Chile.
This study promotes the continuation of CN content analysis to support the implementation of the CATRP-FLNW for Honduras and the region, incorporating the strengths of the applied models.

5. Conclusions

Updated evidence was generated on the content of CN in PF and UPF in Honduras under three different nutrient profiles. The lowest compliance was found in sugar content, followed by sodium and saturated fats, and the best compliance was achieved by trans fats.
The PAHO model is the reference model since the products evince the lowest compliance when applying its criteria. The results confirm the important need to implement mandatory front labeling on the container, due to the low proportion of products that meet the criteria of the three NPMs. It is an important and useful tool to define and monitor actions and policies aimed at improving the quality of products on the market, raising awareness of the consumption habits of the population, and reducing the risks of obesity and NCDs.
The intervention of public health institutions is essential to focus special attention to promoting FLNW. With the population’s consumption of PF and UPF on the rise, the need for raising awareness of CNs is growing exponentially. This analysis highlights the importance of reform in products containing critical nutrients for the health of the population.

Author Contributions

A.H.S. and S.W.B.A. conceived and designed the study; J.P.E. performed data analysis; and A.H.S., S.W.B.A., D.R.A., J.P.E. and A.B.D.I. wrote the paper. All the authors provided a critical review of the manuscript. All authors have read and agreed to the published version of the manuscript.

Funding

This research received no external funding.

Acknowledgments

To the Institute for Technology in Health Care for funding the purchase of processed and ultra-processed foods to carry out the research and thereby support the formulation of public policies.

Conflicts of Interest

The authors express no conflicts of interest when writing the manuscript.

References

  1. NCD Risk Factor Collaboration. Trends in adult body-mass index in 200 countries from 1975 to 2014: A pooled analysis of 1698 population-based measurement studies with 19·2 million participants. Lancet 2016, 387, 1377–1396. [Google Scholar] [CrossRef] [Green Version]
  2. World Health Organization. Obesity and Overweight. Available online: https://www.who.int/news-room/fact-sheets/detail/obesity-and-overweight (accessed on 17 March 2020).
  3. Ng, M.; Fleming, T.; Robinson, M.; Thomson, B.; Graetz, N.; Margono, C.; Mullany, E.C.; Biryukov, S.; Abbafati, C.; Abera, S.F.; et al. Global, regional, and national prevalence of overweight and obesity in children and adults during 1980–2013: A systematic analysis for the Global Burden of Disease Study 2013. Lancet 2014, 384, 766–781. [Google Scholar] [CrossRef] [Green Version]
  4. Pan American Health Organization. Ultra-Processed Food and Drink Products in Latin America: Trends, Impact on Obesity, Policy Implications. Available online: https://iris.paho.org/bitstream/handle/10665.2/7699/9789275118641_eng.pdf (accessed on 19 September 2019).
  5. Serrano, M.M.; Castillo, N.; Pajita, D. Obesity in the world. An. Fac. Med. 2017, 78, 173–178. [Google Scholar] [CrossRef] [Green Version]
  6. Monteiro, C.A.; Cannon, G.; Moubarac, J.-C.; Levy, R.B.; Louzada, M.L.C.; Jaime, P.C. The UN Decade of Nutrition, the NOVA food classification and the trouble with ultra-processing. Public Health Nutr. 2017, 21, 5–17. [Google Scholar] [CrossRef] [PubMed] [Green Version]
  7. Duarte, R.M. Obesity and overweight a worldwide epidemic. Rev. Med. Hondur. 2015, 83, 5–6. Available online: http://www.bvs.hn/RMH/pdf/2015/pdf/Vol83-1-2-2015-2.pdf (accessed on 17 September 2020).
  8. Hall, K.D.; Ayuketah, A.; Brychta, R.; Cai, H.; Cassimatis, T.; Chen, K.Y.; Chung, S.T.; Costa, E.; Courville, A.; Darcey, V.L.; et al. Ultra-processed diets cause excess calorie intake and weight gain: An inpatient randomized controlled trial of ad libitum food intake. Cell Metab. 2019, 30, 67–77. [Google Scholar] [CrossRef] [Green Version]
  9. Ferretti, F.; Mariani, M. Sugar-sweetened beverage affordability and the prevalence of overweight and obesity in a cross section of countries. Glob. Health 2019, 15, 1–14. [Google Scholar] [CrossRef]
  10. Lawrence, M.A.; Baker, P. Ultra-processed food and adverse health outcomes. BMJ 2019, 365, 1–2. [Google Scholar] [CrossRef]
  11. Monteiro, C.A.; Moubarac, J.-C.; Cannon, G.; Ng, S.W.; Popkin, B. Ultra-processed products are becoming dominant in the global food system. Obes. Rev. 2013, 14, 21–28. [Google Scholar] [CrossRef]
  12. Baker, P.; Friel, S. Food systems transformations, ultra-processed food markets and the nutrition transition in Asia. Glob. Health 2016, 12, 1–15. [Google Scholar] [CrossRef] [Green Version]
  13. Stuckler, D.; McKee, M.; Ebrahim, S.; Basu, S. Manufacturing Epidemics: The Role of Global Producers in Increased Consumption of Unhealthy Commodities Including Processed Foods, Alcohol, and Tobacco. PLoS Med. 2012, 9, e1001235. [Google Scholar] [CrossRef] [PubMed] [Green Version]
  14. Hernandez, A. Riesgo Nutricional en Honduras: ¿Epidemia de Síndrome Metabólico? Caso de San Antonio de Oriente, Francisco Morazán. Escuela Agrícola Panamericana Zamorano (EAPZ), 1st ed.; Lithopress Industrial: Tegucigalpa, Honduras, 2017; ISBN 978-99979-811-0-3. [Google Scholar]
  15. Pan American Health Organization/World Health Organization. Nutrient Profiling: Reports of a WHO/IASO Technical Meeting. London. 2010. Available online: https://www.who.int/nutrition/publications/profiling/WHO_IASO_report2010.pdf?ua=1 (accessed on 23 September 2019).
  16. World Health Organization. WHO Regional Office for Europe Nutrient Profile Model. Available online: http://www.euro.who.int/__data/assets/pdf_file/0005/270716/Nutrient-children_web-new.pdf?ua=1 (accessed on 23 September 2019).
  17. Iberoamerican Nutrition Foundation. Nutrient Profiling: Scientific Aims Versus Actual Impact on Public Health. In Iberoamerican Nutrition Foundation (Fundación Iberoabericana de Nutrición-FINUT) Scientific-Technical Report; Iberoamerican Nutrition Foundation: Granada, Spain, 2016; Available online: https://www.finut.org/wp-content/uploads/2017/02/Nutrient_Profiling_Scientific_Aims_versus_Actual_Impact_Public_Health_FINUT_final_180117.pdf (accessed on 23 September 2019).
  18. Hernández, A.; Di Iorio, A.B.; Tejada, O.A. Contenido de azúcar, grasa y sodio en alimentos comercializados en Honduras, según el etiquetado nutricional: Prueba para la regulación de alimentos procesados y ultra procesados. Rev. Esp. Nutr. Hum. Diet. 2018, 22, 108–116. [Google Scholar] [CrossRef] [Green Version]
  19. Corvalán, C.; Reyes, M.; Garmendia, M.L.; Uay, R. Structural responses to the Obesity and non-communicable diseases epidemic: Update on the Chilean law of food labelling and advertising. Obes. Rev. 2018, 15, 79–87. [Google Scholar] [CrossRef] [PubMed]
  20. Ministerio de Salud; Gobierno de Chile; Subsecretaría de Salud Pública; División de Políticas Públicas Saludables y Promoción; Departamento de Alimentos y Nutrición Chile. Informe de Evaluación de la Implementación de la Ley Sobre Composición Nutricional de los Alimentos y su Publicidad. Available online: https://www.minsal.cl/wp-content/uploads/2018/05/Informe-Implementaci%C3%B3n-Ley-20606-febrero-18-1.pdf (accessed on 23 September 2019). (In Spanish).
  21. Diario Oficial de la República de Chile. Cuerpo I—12. Viernes 26 de Junio de 2015. No 41.193. (IdDO 918813) Modifica Decreto Supremo No 977, de 1996, Reglamento Sanitario de los Alimentos Núm. 13. 2015. Available online: https://www.minsal.cl/wp-content/uploads/2015/08/decreto_etiquetado_alimentos_2015.pdf (accessed on 23 September 2019). (In Spanish).
  22. Kaufer-Horwitz, M.; Tolentino-Mayo, L.; Jáuregui, A.; Sánchez-Bazán, K.; Bourges, H.; Martínez, S.; Perichart, O.; Rojas-Russell, M.; Moreno, L.; Hunot, C.; et al. Sistema de etiquetado frontal de alimentos y bebidas para México: Una estrategia para la toma de decisiones saludables. Salud Publica Mex. 2018, 60, 479–486. [Google Scholar] [CrossRef] [PubMed] [Green Version]
  23. Reglamento técnico Centroamericano. RTCA 67.01. XX:17. Alimentos y bebidas. Etiquetado Frontal de Advertencia Nutricional. Requisitos para su Aplicación. EFAN-RTCA-Propuesta INCAP-20171014. Available online: http://incap.int/index.php/es/listado-de-documentos/repositorio-efan/politicas-efan/397-efan-rtca-propuesta-incap/file (accessed on 19 September 2019). (In Spanish).
  24. Contreras-Manzano, A.; Jáuregui, A.; Velasco-Bernal, A.; Vargas-Meza, J.; Rivera, J.A.; Tolentino-Mayo, L.; Barquera, S. Comparative analysis of the classification of food products in the Mexican market according to seven different nutrient profiling systems. Nutrients 2018, 10, 737. [Google Scholar] [CrossRef] [PubMed] [Green Version]
  25. Monteiro, C.A.; Cannon, G.; Levy, R.B.; Moubarac, J.C.; Jaime, P.; Martins, A.P. NOVA. The star shines bright. [Food classification public health]. World Nutr. 2016, 7, 28–38. [Google Scholar]
  26. United Nations Children’s Fund (UNICEF). Review of Current Labelling Regulations and Practices for Food and Beverage Targeting Children and Adolescents in Latin America Countries (Mexico, Chile, Costa Rica and Argentina) and Recommendations for Facilitating Consumer Information. 2016. Available online: https://www.unicef.org/lac/media/1876/file/PDF%20An%C3%A1lisis%20de%20regulaciones%20y%20pr%C3%A1cticas%20para%20el%20etiquetado%20de%20alimentos%20y%20bebidas%20ING.pdf (accessed on 19 September 2019).
  27. WHO. Guideline: Sodium Intake for Adults and Children; World Health Organization: Geneva, Switzerland, 2012. [Google Scholar]
  28. WHO. New Guidance on Dietary Salt and Potassium; World Health Organization: Geneva, Switzerland, 2015; Available online: https://www.who.int/mediacentre/news/notes/2013/salt_potassium_20130131/en/ (accessed on 19 September 2019).
  29. WHO. Guideline: Sugars Intake for Adults and Children; World Health Organization: Geneva, Switzerland, 2012. [Google Scholar]
  30. Mora, M.; Gómez, L.; Miles, D.; Parra, D.; Taillie, L. Nutrition Quality of packaged foods in Bogotá, Colombia: A comparison of two nutrient profile models. Nutrients 2019, 11, 1011. [Google Scholar] [CrossRef] [Green Version]
  31. Labonté, M.È.; Poon, T.; Mulligan, C.; Bernstein, J.T.; Franco-Arellano, B.; L’Abbé, M.R. Comparison of global nutrient profiling systems for restricting the commercial marketing of foods and beverages of low nutritional quality to children in Canada. Am. J. Clin. Nutr. 2017, 106, 1471–1481. [Google Scholar] [CrossRef] [Green Version]
  32. Nieto, C.; Rincon-Gallardo Patiño, S.; Tolentino-Mayo, L.; Carriedo, A.; Barquera, S. Characterization of Breakfast Cereals Available in the Mexican Market: Sodium and Sugar Content. Nutrients 2017, 9, 884. [Google Scholar] [CrossRef]
  33. Julia, C.; Kesse-Guyot, E.; Ducrot, P.; Péneau, S.; Touvier, M.; Méjean, C.; Hercberg, S. Performance of a five-category front-of-pack labelling system—The 5-colour nutrition label—to differentiate nutritional quality of breakfast cereals in France. BMC Public Health 2015, 15, 179. [Google Scholar] [CrossRef]
  34. World Action on Salt and Health. International Breakfast Cereal Survey. NEW International Survey Reveals Huge Differences in the Sugar and Salt Content of Global Breakfast Cereal Brands. Available online: http://www.worldactiononsalt.com/projects/washsurveys/2016/ (accessed on 2 April 2020).
  35. Santana, A.H.; Motiño, S.R.M.; Di Iorio, A.B. Are Functional Foods Marketed in Honduras a Healthy Option? Food Nutr. Sci. 2019, 10, 719–734. [Google Scholar] [CrossRef] [Green Version]
  36. De Souza, R.J.; Mente, A.; Maroleanu, A.; Cozma, A.I.; Ha, V.; Kishibe, T.; Anand, S.S. Intake of saturated and trans unsaturated fatty acids and risk of all cause mortality, cardiovascular disease, and type 2 diabetes: Systematic review and meta-analysis of observational studies. BMJ 2015, 351, 1–15. [Google Scholar] [CrossRef] [PubMed] [Green Version]
  37. Samuels, F.; Hare, J.; De Man, W. Using the Nutrition Compass model for building healthy meals. Nutr. Bull. 2015, 40, 326–330. [Google Scholar] [CrossRef]
  38. Díaz, A.A.; Veliz, P.M.; Rivas-Mariño, G.; Mafla, C.V.; Altamirano, L.M.M.; Jones, C.V. Etiquetado de alimentos en Ecuador: Implementación, resultados y acciones pendientes. Rev. Panam. Salud Publica 2017, 41, 1–8. [Google Scholar] [CrossRef]
  39. Lehmann, U.; Charles, V.R.; Vlassopoulos, A.; Masset, G.; Spieldenner, J. Nutrient profiling for product reformulation: Public health impact and benefits for the consumer. Proc. Nutr. Soc. 2017, 76, 255–264. [Google Scholar] [CrossRef] [PubMed]
  40. Cooper, S.L.; Pelly, F.E.; Lowe, J.B. Construct and criterion-related validation of nutrient profiling models: A systematic review of the literature. Appetite 2016, 100, 26–40. [Google Scholar] [CrossRef]
  41. Jones, A.; Neal, B.; Reeve, B.; Ni Mhurchu, C.; Thow, A.M. Front-of-pack nutrition labelling to promote healthier diets: Current practice and opportunities to strengthen regulation worldwide. BMJ Glob. Health 2019, 4, 1–16. [Google Scholar] [CrossRef]
  42. Vin, K.; Beziat, J.; Seper, K.; Wolf, A.; Sidor, A.; Chereches, R.; Ménard, C. Nutritional composition of the food supply: A comparison of soft drinks and breakfast cereals between three European countries based on labels. Eur. J. Clin. Nutr. 2019, 74, 17–27. [Google Scholar] [CrossRef]
  43. Kickbusch, I.; Allen, L.N.; Franz, C. The commercial determinants of health. Lancet Glob. Health 2016, 4, e895–e896. [Google Scholar] [CrossRef] [Green Version]
  44. Marrón, J.A.; Mayo, L.T.; Hérnández, M.; Batis, C. Trends in Ultra-Processed Food Purchases from 1984 to 2016 in Mexican Households. Nutrients 2018, 11, 45. [Google Scholar] [CrossRef] [Green Version]
  45. Taillie, L.S.; Hall, M.G.; Popkin, B.M.; Ng, S.W.; Murukutla, N. Experimental Studies of Front-of-Package Nutrient Warning Labels on Sugar-Sweetened Beverages and Ultra-Processed Foods: A Scoping Review. Nutrients 2020, 12, 569. [Google Scholar] [CrossRef] [PubMed] [Green Version]
Figure 1. Description of PF and UPF dropouts: flow diagram. Products without critical nutrients information, or duplicated, were excluded from the final sample. Source: Made by the authors.
Ijerph 17 07060 g001
Figure 2. Percentage distribution of products (PF and UPF) by category according to origin by continent. The American continent had the majority of products, followed by Europe and Asia. Source: Made by the authors.
Ijerph 17 07060 g002
Table 1. Criteria for critical nutrient profiles (sodium, sugar, saturated, and trans fats) according to the PAHO-NPM, Chilean-NPM, and CATRP-FLNW model.
Nutrient ProfileReference QuantitySodium Reference QuantityTotal SugarsFree SugarSaturated Free FatsTrans Fat
Pan American Health Organization (PAHO, 2015) [5].Per kcal of energyExcess sodium if the ratio of sodium (mg) to calories is equal to or greater than 1:1N/AExcess free sugars if calories from free sugars are equal to or greater than 10% of total caloriesExcess saturated fat if calories from total fat are equal to or greater than 10% of total caloriesTrans fat excess if calories from trans fat are equal to or greater than 1% of total calories
Chilean NPM [19,20].Per portion of the product; expressed by 100 g or 100 mLExcess sodium mg if per 100 mL of liquids it is greater than 100 mg or greater than 400 mg per 100 g in solid productsExcess sodium mg if per 100 mL of liquids it is greater than 100 mg or greater than 400 mg per 100 g in solid productsN/AExcess saturated fat if per 100 mL of liquids it is greater than 3 mg; or 4 g per 100 g in solid productsN/A
Proposal INCAP CATRP-FLNW [23].By energy content of the product expressed per 100 g or 100 mL or per servingExcess sodium if the ratio of the amount of sodium mg to calories is equal to or greater than 1:1Excess of total sugars if it is greater than or equal to 20% of the total energy from total sugarsN/AExcess saturated fat if it is greater than or equal to 10% of the total energy from saturated fatPresence of any amount of trans fat
Depicted above are the thresholds and nutritional objective for each of the nutrient profile analyzed. NA: Not Applicable. Source: Elaborated by the authors.
Table 2. Number and proportion of products (PF and UPF) classified by food categories.
Food Category and Classification(n) Sample%
Non-dairy beverages20820.6
Juices, beverages and nectars 13263.5
Powders to prepare sugary flavored drinks 167.7
Energy drinks 83.9
Carbonated beverages 2913.9
Flavored teas 125.8
Zero calories 41.9
Vegetable milk (soy, almond, rice)73.4
Dairy717.0
Yogurt4056.3
Pudding 57.0
Flavored milk with added sugar2028.2
Coffee with milk beverages68.5
Salty snacks999.8
Packaged chips8282.8
Dried fruits with added salt1717.2
Sweet snacks23523.3
Cookies14762.6
Chocolates 4519.2
Candy4318.3
Cereal products with added sugar18218.0
Granola105.5
Oats179.3
Breakfast cereals11362.1
Cereal bars 4223.1
Bread and bakery484.5
Bread with added salt 2143.8
Sweet bread 2756.3
Various products16616.5
Canned meat 2213.3
Dressings and sauces 3319.9
Flour and pasta mixes 3621.7
Soups and creams 2313.9
Canned seafood116.6
Canned fruits and vegetables 84.8
Jams and jellies 159.0
Packed ground beans 31.8
Cheeses with added salt 159.0
Total 1009100
The proportions of products for categories (in bold format) and subcategories are depicted below. Source: Elaborated by the authors.
Table 3. Proportion of food products (PF and UPF) that meet the nutritional criteria according to PAHO-NPM, Chilean-NPM and CATRP-FLNW, by food category.
NPMCategorySodiumSugars *Saturated FatTrans Fat
n%n%n%n%
Non-dairy beverages (n = 208)
PAHO 5325.462.819694.2208100
Chile 20498.04722.520799.5NANA
CATRP-FLNW 4722.5146.720598.520699.0
Dairy beverages (n = 71)
PAHO 1825.3811.23042.271100
Chile 6287.31216.97098.5NANA
CATRP-FLNW 1318.3811.22535.271100
Salty snacks (n = 99)
PAHO 6262.68686.83333.399100
Chile 2525.28484.82121.2NANA
CATRP-FLNW 6161.69191.93232.39899.0
Sweet snacks (n = 235)
PAHO 5121.73514.88636.523198.0
Chile 15867.23012.76628.1NANA
CATRP-FLNW 4920.85821.69138.721993.2
Cereal products (n = 182)
PAHO 10256.02212.016389.5182100
Chile 9150.02614.215685.7NANA
CATRP-FLNW 9652.74725.816389.518199.5
Bread and bakery (n = 48)
PAHO 1020.800.012.04695.8
Chile 2245.82041.6247.9NANA
CATRP-FLNW 3062.5714.525524695.8
Various products (n = 166)
PAHO 15090.39657.810160.816498.7
Chile 4627.711066.211468.6NANA
CATRP-FLNW 14184.912072.210160.816094.8
Total products (n = 1009)
PAHO 446.044.2253.025.0610.060.5958.094.9
Chile 317.031.4608.060.3329.032.6NANA
CATRP-FLNW 43743.334534.264263.698197.2
* Free sugars for PAHO-NPM, Total sugars for Chilean-NPM and CATRP-FLNW. Percentages and proportions of products that met the nutritional criteria for each category. NA: Not applicable. Source: Elaborated by the authors.
Table 4. Mean content of critical nutrients in food products that met, or did not, the nutritional criteria by nutrient profile and by food category.
Critical Nutrient for Each NPM Non-Dairy Beverages
(n = 208)
Dairy Beverages
(n = 71)
Cereal Products
(n = 182)
Bread and Bakery
(n = 48)
Mean (SD) Mean (SD) Mean (SD) Mean (SD)
C NC C NC C NC CNC
PAHO
Sodium (mg)95.7 (184.6)33.9 (28.2)150.3 (86.8)83.6 (33.0)172.1 (53.3)83.9 (44.2)172.8 (77.3)149.5 (67.5)
Free Sugars (g)0.0 (0)23.5 (13.0)1.0 (1.47)9.0 (4.2)1.5 (1.3)9.5 (3.3)0 (0.0)7.2 (5.9)
Saturated Fat (g)0 (0.2)0.4 (0.8)0.6 (0.6)2.5 (1.2)0.3 (0.4)2.2 (0.8)1.5 (0.0)0.7 (0.5)
Trans Fat (g)0.0 (0.03)NA0.0 (0)NA0.0 (0)NA0 (0.0)2.3 (1.0)
Chile
Sodium (mg)15.4 (13.0)444.8 (273.2)51.7 (17.4)275.8 (324.6)259.9 (115.7)546.1 (120.7)254.0 (102.2)601.9 (368.2)
Total Sugar (g)2.2 (1.5)11.3 (7.3)2.0 (1.97)17.6 (33.9)5.2 (4.0)30.0 (9.0)5.6 (1.3)28.3 (8.2)
Saturated Fat (g)0.0 (0)10 (0)1.2 (0.8)29 (0.0)0.8 (1.1)7.15 (5.5)1.5 (1.1)8.0 (3.1)
CATRP-NWFL
Sodium(mg)107.9 (193.8)33.40 (27.2)159.3 (98.6)85.5 (34.5)173.1 (51.9)88.9 (50.0)188.2 (141.7)101.1 (50.1)
Total, Sugar (g)4.3 (4.4)23.9 (12.3)2.1 (2.9)18.5 (7.5)3.4 (2.5)10.3 (2.8)0.9 (0.2)8.1 (5.8)
Saturated Fat (g)0.0 (0.2)1.5 (0.8)6.8 (29.8)2.4 (1.2)0.3 (0.4)2.2 (0.8)0.6 (0.5)3.3 (1.8)
Trans Fat (g)0 (0.0)0.3 (0.3)0 (0.0)NA0 (0.0)0.03 (0)0 (0.0)2.3 (1.0)
Mean content of non-dairy beverages, dairy beverages, cereal products, bread and bakery among compliant products (those that met the criteria according the nutrient profile studied, and the critical nutrient analyzed) and non-compliant products (which did not meet the established criteria according to the nutrient profile models used). Cells in grey indicate statistical differences (p < 0.05) in the mean content between compliance (C) and non-compliance (NC). NA: Not applicable. Source: Elaborated by the authors.
Table 5. Percentage distribution of processed foods by category that met all the criteria in each NPM.
ModelOverall
(n = 1009)
Non-Dairy Beverages
(n = 208)
Dairy Beverages
(n = 71)
Salty Snacks
(n = 99)
Sweet Snacks
(n = 235)
Cereal
Products
(n = 182)
Bread and Bakery
(n = 48)
Various Products
(n = 166)
PAHO8.0%1.9%1.4%14.1%5.1%5.5%0%24.1%
Chile8.8%21.2%15.5%2.0%0.9%5.5%4.2%10.8%
CATRP11.6%3.4%1.4%15.2%4.3%13.2%14.8%31.9%
Products that met the thresholds established by the nutrient profile models analyzed. Source: Elaborated by the authors.
Table 6. Summary of the proportion of food products by category that meet nutritional criteria, according to the PAHO-NPM, Chilean-NPM and the CATRP-FLNW.
Critical NutrientCategoryNon-Dairy Beverages
(n = 208)
Dairy Beverages
(n = 71)
Salty Snacks
(n = 99)
Sweet Snacks
(n = 235)
Cereal
Products
(n = 182)
Bread and Bakery
(n = 48)
Various Products
(n = 166)
Total
(1009)
NPM% (95% CI)% (95% CI)% (95% CI)% (95% CI)% (95% CI)% (95% CI)% (95% CI)% (95% CI)
SodiumPAHO25.4 (51.1, 164.9)25.3 (118.0, 196.9)62.6 (179.6, 247.0)21.7 (70.7, 127.1)56 (161.6, 182.6)20.8 (114.7, 180.3)90.3 (380.9, 561.1)44.2 (226.4, 294.4)
Chilean90 (13.6, 17.2)87.3 (47.3, 56.2)25 (160.4, 280.7)67.2 (102.2, 129.5)50 (235.9, 284.1)45.8 (209.8, 299.4)27.7 (135.3, 221.4)60.3 (101.6, 121.3)
CATRP-FLNW22.5 (51.1, 164.9)18.3 (99.7, 219.0)61.6 (183.1, 250.2)20.8 (65.8, 124.8)52.7 (162.7, 183.7)62.5 (135.3, 241.2)84.9 (404.6, 592.6)43.3 (233.9, 303.4)
Mean48.643.649.836.652.943.067.649.3
Free Sugars *PAHO2.8 (1.8, 7.0)11.2 (0.0, 2.3)86.8 (0.4, 0.8)14.8 (0.6, 1.4)12 (1.0, 2.2)0 (-)57.8 (0.3, 0.6)25.0 (5.6, 9.0)
Chilean22.5 (1.8, 2.7)16.9 (0.8, 3.3)84.4 (1.4, 2.6)12.7 (1.5, 4.3)14.2 (3.4, 7.0)41.6 (5.0, 6.3)66.2 (1.1, 2.0)32.6 (2.1, 2.7)
CATRP-FLNW6.7 (1.8, 7.0)11.2 (0.0, 4.6)91.9 (0.5, 1.1)24.6 (2.1, 3.6)25.8 (2.7, 4.2)14.5 (0.8, 1.2)72.2 (0.9, 2.2)34.2 (1.6, 2.3)
Mean10.113.187.817.417.328.065.430.6
Saturated FatPAHO94.2 (0.0, 0.0)42.2 (0.4, 0.9)33.3 (0.6, 1.1)36.5 (0.5, 0.8)89.5 (0.3, 0.4)2.0 (-)60.8 (0.2, 0.4)60.5 (0.3, 0.4)
Chilean99.5 (0.0, 0.0)98.5 (1.0, 1.4)21.2 (0.7, 2.6)28.1 (0.8, 1.6)85.7 (0.7, 1.1)47.9 (1.0, 2.0)68.6 (0.6, 1.0)65.1 (0.6, 0.8)
CATRP-FLNW98.5 (0.0, 0.0)35.2 (0.0, 19.2)32.3 (0.5, 1.0)38.7 (6.0, 22.5)89.5 (0.3, 0.4)52.0 (0.4, 0.9)60.8 (0.2, 0.4)63.6 (0.3, 0.3)
Mean97.458.628.934.488.234.063.463.1
Trans FatsPAHO94.7 (0.0, 0.0)100 (-)100 (0.0, 0.0)98 (0.0, 5.7)100 (0.0, 0.0)18.7 (140.2, 207.8)98.7 (0.0, 0.0)94.9 (0.0, 0.0)
ChileanNA
CATRP-FLNW99.1 (0.0, 0.0)100 (-)99.0 (0.0, 0.0)93.2 (0.0, 0.1)99.5 (0.0, 0.0)95.8 (0.0, 11.8)96.4 (0.0, 0.1)97.2 (0.0, 0.0)
Mean 96.910099.595.699.757.297.596.0
* Free Sugars for the PAHO-NPM, Total Sugars for Chilean-NPM and CATRP-FLNW. Percent of products that comply with the thresholds for critical nutrients, from the lowest to the highest confidence intervals (CI). NA: Not Applicable. Source: Elaborated by the authors.

