The Association between Longest-Held Lifetime Occupation and Late-Life Cognitive Impairment: Korean Longitudinal Study of Aging (2006–2016)


Abstract
1. Introduction
2. Methods
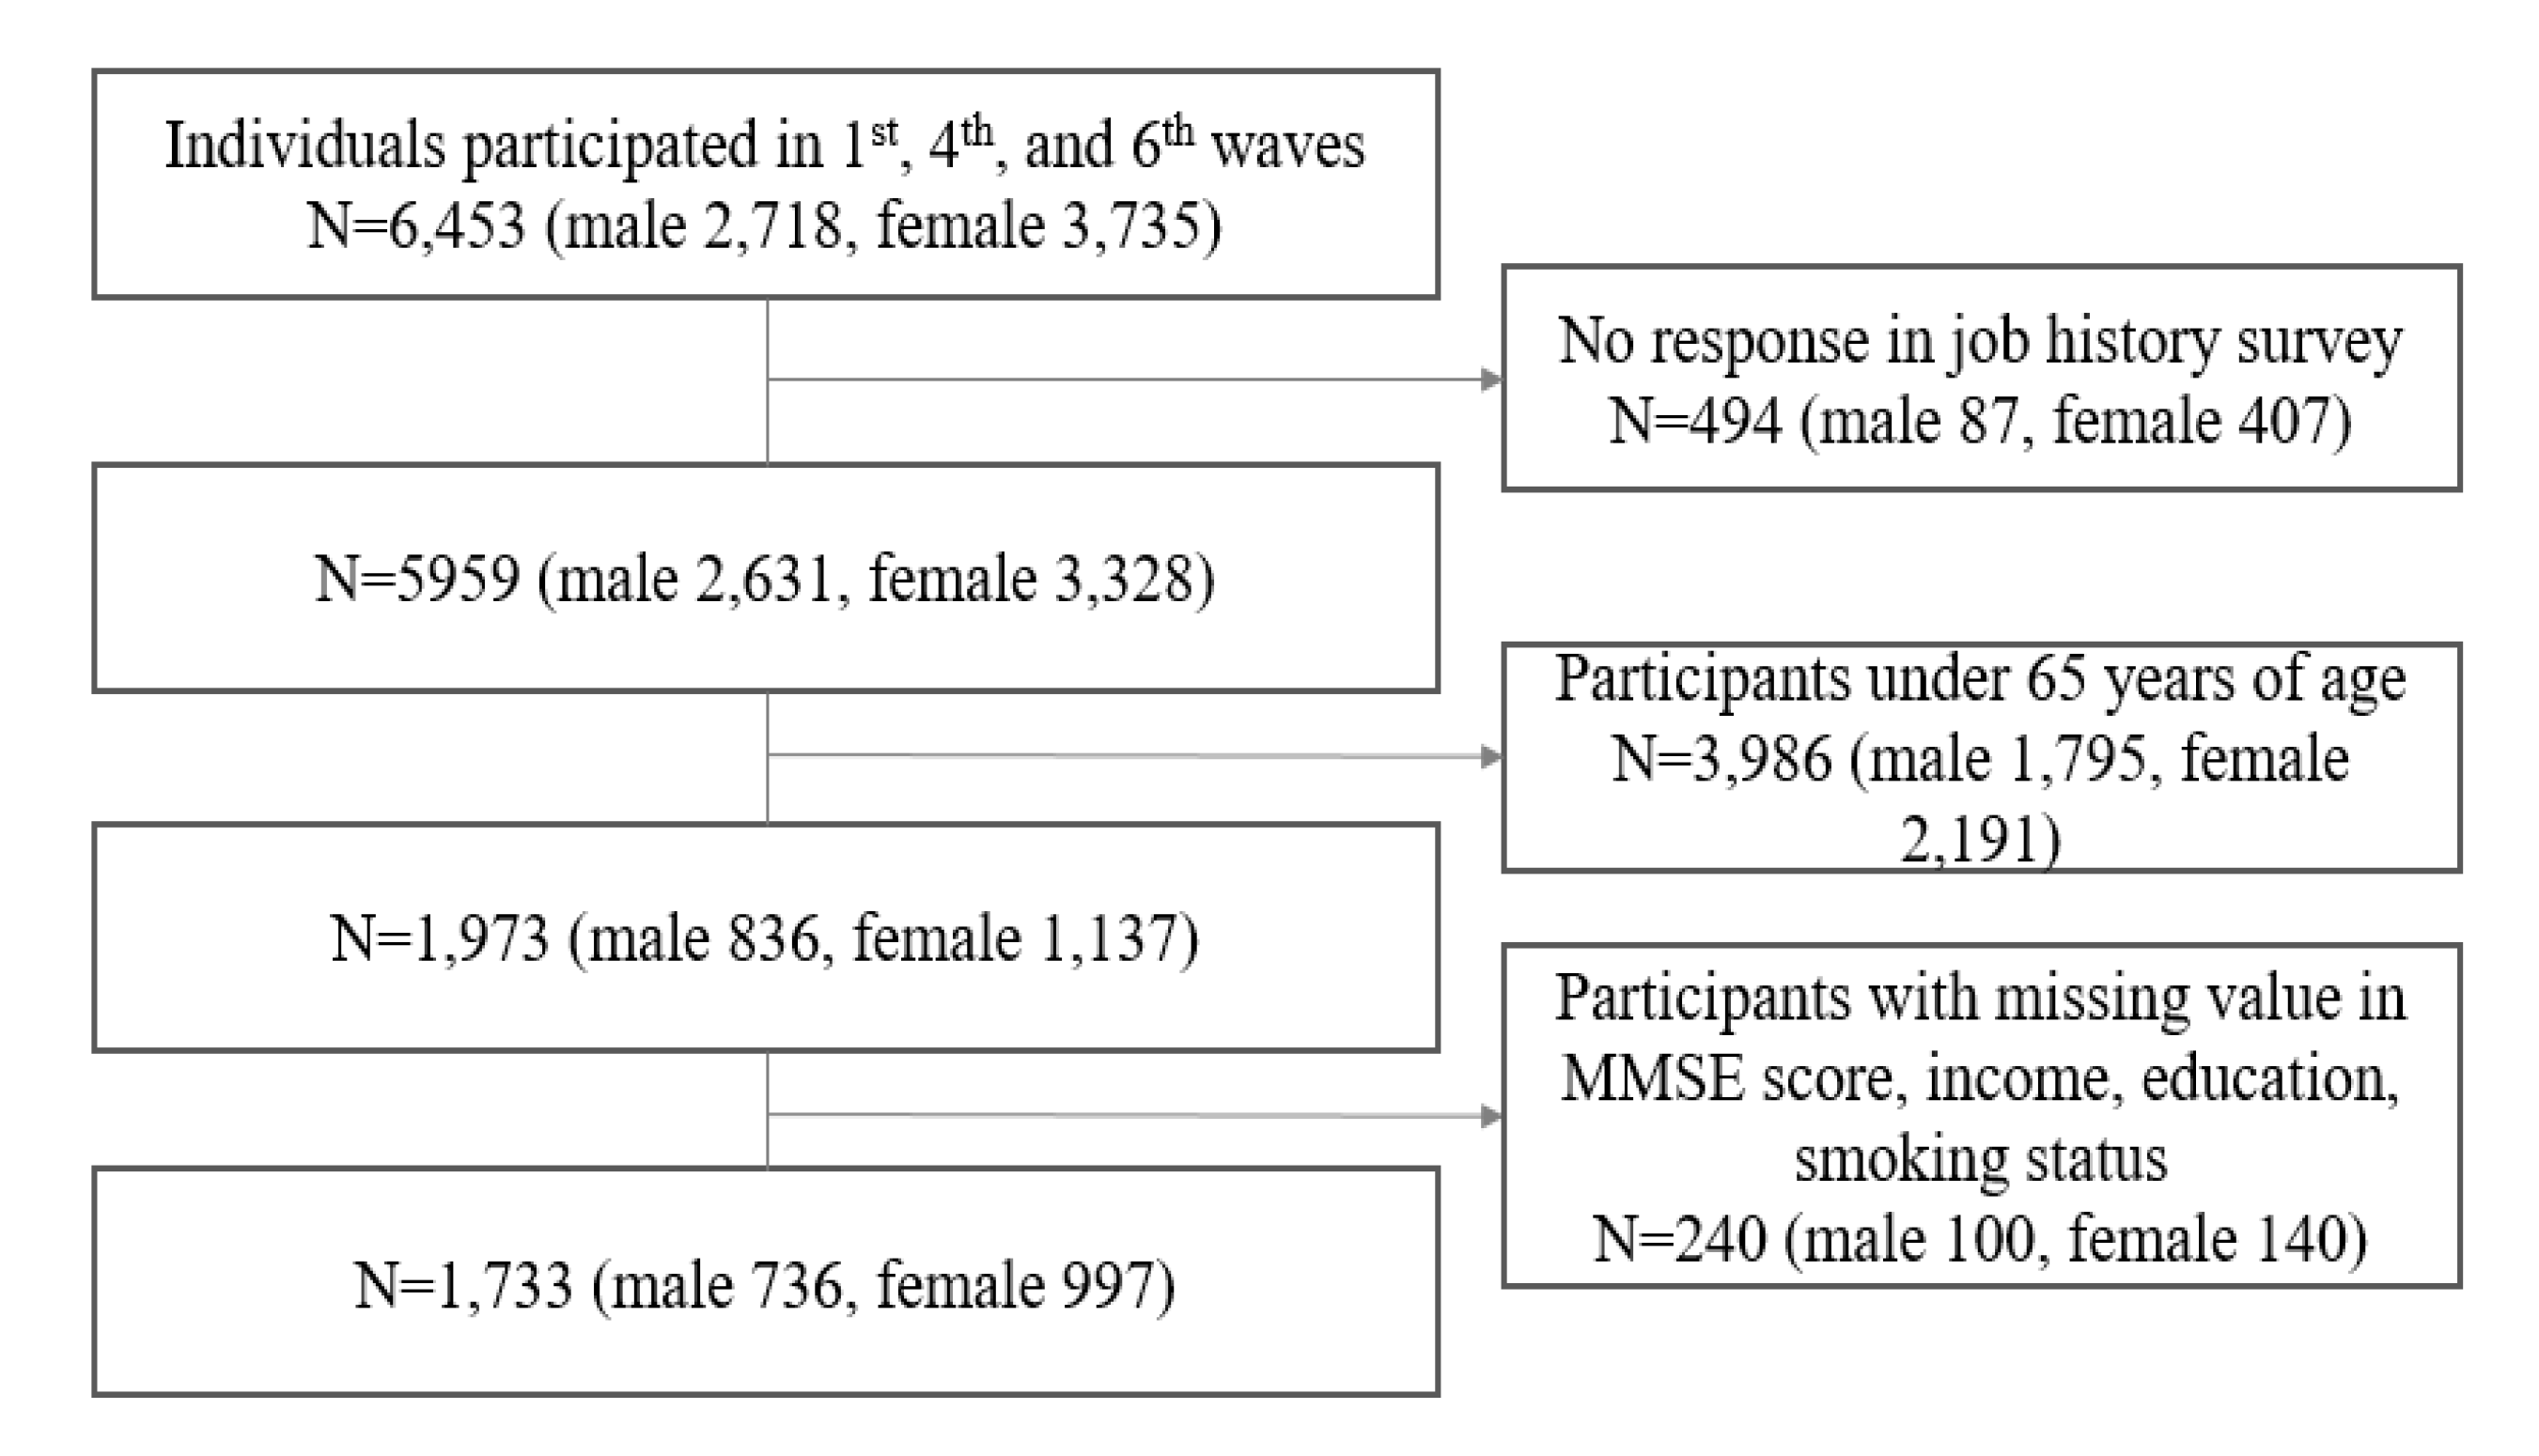
2.1. Data Source and Study Population
2.2. Longest-Held Job in a Lifetime
2.3. Cognitive Impairment
2.4. Other Variables of Interests
2.5. Statistical Analysis
2.6. Ethical Approval
3. Results
4. Discussion
5. Conclusions
Author Contributions
Funding
Acknowledgments
Conflicts of Interest
References
- Reas, E.T.; Laughlin, G.A.; Bergstrom, J.; Kritz-Silverstein, D.; Richard, E.L.; Barrett-Connor, E.; McEvoy, L.K. Lifetime physical activity and late-life cognitive function: The Rancho Bernardo study. Age Ageing 2019, 48, 241–246. [Google Scholar] [CrossRef] [PubMed]
- Caskie, G.I.; Schaie, K.W.; Willis, S.L. Individual differences in the rate of change in cognitive abilities during adulthood. In Proceedings of the Gerontological Society of America Conference, San Francisco, CA, USA, 19–23 November 1999. [Google Scholar]
- Singh-Manoux, A.; Kivimaki, M.; Glymour, M.M.; Elbaz, A.; Berr, C.; Ebmeier, K.P.; Ferrie, J.E.; Dugravot, A. Timing of onset of cognitive decline: Results from Whitehall II prospective cohort study. BMJ 2012, 344, d7622. [Google Scholar] [CrossRef] [PubMed]
- Zhang, M.; Gale, S.D.; Erickson, L.D.; Brown, B.L.; Woody, P.; Hedges, D.W. Cognitive function in older adults according to current socioeconomic status. Aging Neuropsychol. Cognit. 2015, 22, 534–543. [Google Scholar] [CrossRef] [PubMed]
- Yaffe, K.; Peltz, C.B.; Ewing, S.K.; McCulloch, C.E.; Cummings, S.R.; Cauley, J.A.; Hillier, T.A.; Ensrud, K.E. Long-term cognitive trajectories and mortality in older women. J. Gerontol. Ser. A Biomed. Sci. Med Sci. 2016, 71, 1074–1080. [Google Scholar] [CrossRef] [PubMed]
- Na, K.-S. Prediction of future cognitive impairment among the community elderly: A machine-learning based approach. Sci. Rep. 2019, 9, 3335. [Google Scholar] [CrossRef]
- Baldivia, B.; Andrade, V.M.; Bueno, O.F.A. Contribution of education, occupation and cognitively stimulating activities to the formation of cognitive reserve. Dement. Neuropsychol. 2008, 2, 173. [Google Scholar] [CrossRef]
- Killin, L.O.; Starr, J.M.; Shiue, I.J.; Russ, T.C. Environmental risk factors for dementia: A systematic review. BMC Geriatr. 2016, 16, 175. [Google Scholar] [CrossRef]
- Jang, A.R.; Yoon, J.Y. Factors affecting reversion from mild cognitive impairment to normal cognition in midlife to later life in Korea: A national population study. Geriatr. Gerontol. Int. 2019, 19, 1129–1135. [Google Scholar] [CrossRef]
- Plassman, B.L.; Williams, J.W.; Burke, J.R.; Holsinger, T.; Benjamin, S. Systematic review: Factors associated with risk for and possible prevention of cognitive decline in later life. Annu. Intern. Med. 2010, 153, 182–193. [Google Scholar] [CrossRef]
- Corna, L.M. A life course perspective on socioeconomic inequalities in health: A critical review of conceptual frameworks. Adv. Life Course Res. 2013, 18, 150–159. [Google Scholar] [CrossRef]
- Nguyen, C.T.; Couture, M.-C.; Alvarado, B.E.; Zunzunegui, M.-V. Life course socioeconomic disadvantage and cognitive function among the elderly population of seven capitals in Latin America and the Caribbean. J. Aging Health 2008, 20, 347–362. [Google Scholar] [CrossRef] [PubMed]
- Lee, H.; Jung, E. Socioeconomic status and elderly health in life course perspective: Testing of multi-mediational effects of socioeconomic status in early adult and middle aged. Health Soc. Welf. Rev. 2016, 36, 53–84. [Google Scholar]
- Helmer, C.; Letenneur, L.; Rouch, I.; Richard-Harston, S.; Barberger-Gateau, P.; Fabrigoule, C.; Orgogozo, J.; Dartigues, J. Occupation during life and risk of dementia in French elderly community residents. J. Neurol. Neurosurg. Psychiatry 2001, 71, 303–309. [Google Scholar] [CrossRef] [PubMed]
- Lips-Wiersma, M.; Wright, S.; Dik, B. Meaningful work: Differences among blue-, pink-, and white-collar occupations. Career Dev. Int. 2016, 21, 534–551. [Google Scholar] [CrossRef]
- Melchior, M.; Krieger, N.; Kawachi, I.; Berkman, L.F.; Niedhammer, I.; Goldberg, M. Work factors and occupational class disparities in sickness absence: Findings from the GAZEL cohort study. Am. J. Public Health 2005, 95, 1206–1212. [Google Scholar] [CrossRef]
- Hemström, Ö. Health inequalities by wage income in Sweden: The role of work environment. Soc. Sci. Med. 2005, 61, 637–647. [Google Scholar] [CrossRef]
- Schrijvers, C.T.; van de Mheen, H.D.; Stronks, K.; Mackenbach, J.P. Socioeconomic inequalities in health in the working population: The contribution of working conditions. Int. J. Epidemiol. 1998, 27, 1011–1018. [Google Scholar] [CrossRef]
- Ahn, J.; Kim, N.-S.; Lee, B.-K.; Park, J.; Kim, Y. Relationship of occupational category with risk of physical and mental health problems. Saf. Health Work 2019, 10, 504–511. [Google Scholar] [CrossRef]
- Min, J.Y.; Park, J.B.; Lee, K.J.; Min, K.B. The impact of occupational experience on cognitive and physical functional status among older adults in a representative sample of Korean subjects. Annu. Occup. Environ. Med. 2015, 27, 11. [Google Scholar] [CrossRef]
- Li, C.-Y.; Wu, S.C.; Sung, F.-C. Lifetime principal occupation and risk of cognitive impairment among the elderly. Ind. Health 2002, 40, 7–13. [Google Scholar] [CrossRef]
- Finkel, D.; Andel, R.; Gatz, M.; Pedersen, N.L. The role of occupational complexity in trajectories of cognitive aging before and after retirement. Psychol. Aging 2009, 24, 563. [Google Scholar] [CrossRef] [PubMed]
- Fisher, G.G.; Stachowski, A.; Infurna, F.J.; Faul, J.D.; Grosch, J.; Tetrick, L.E. Mental work demands, retirement, and longitudinal trajectories of cognitive functioning. J. Occup. Health Psychol. 2014, 19, 231. [Google Scholar] [CrossRef] [PubMed]
- Andel, R.; Crowe, M.; Pedersen, N.L.; Mortimer, J.; Crimmins, E.; Johansson, B.; Gatz, M. Complexity of work and risk of Alzheimer’s disease: A population-based study of Swedish twins. J. Gerontol. Ser. B Psychol. Sci. Soc. Sci. 2005, 60, P251–P258. [Google Scholar] [CrossRef] [PubMed]
- Then, F.S.; Luck, T.; Luppa, M.; Thinschmidt, M.; Deckert, S.; Nieuwenhuijsen, K.; Seidler, A.; Riedel-Heller, S.G. Systematic review of the effect of the psychosocial working environment on cognition and dementia. Occup. Environ. Med. 2014, 71, 358–365. [Google Scholar] [CrossRef]
- Qiu, C.; Karp, A.; von Strauss, E.; Winblad, B.; Fratiglioni, L.; Bellander, T. Lifetime principal occupation and risk of Alzheimer’s disease in the Kungsholmen project. Am. J. Ind. Med. 2003, 43, 204–211. [Google Scholar] [CrossRef]
- Andel, R.; Kåreholt, I.; Parker, M.G.; Thorslund, M.; Gatz, M. Complexity of primary lifetime occupation and cognition in advanced old age. J. Aging Health 2007, 19, 397–415. [Google Scholar] [CrossRef]
- Smyth, K.; Fritsch, T.; Cook, T.; McClendon, M.; Santillan, C.; Friedland, R. Worker functions and traits associated with occupations and the development of AD. Neurology 2004, 63, 498–503. [Google Scholar] [CrossRef]
- Russo, A.; Onder, G.; Cesari, M.; Zamboni, V.; Barillaro, C.; Capoluongo, E.; Pahor, M.; Bernabei, R.; Landi, F. Lifetime occupation and physical function: A prospective cohort study on persons aged 80 years and older living in a community. Occup. Environ. Med. 2006, 63, 438–442. [Google Scholar] [CrossRef]
- Ross, C.E.; Wu, C.-L. Education, age, and the cumulative advantage in health. J. Health Soc. Behav. 1996, 37, 104–120. [Google Scholar] [CrossRef]
- Oaxaca, R. Male-female wage differentials in urban labor markets. Int. Econ. Rev. 1973, 14, 693–709. [Google Scholar] [CrossRef]
- England, P. Households, Employment, and Gender: A Social, Economic, and Demographic View; Routledge: New York, NY, USA, 2017. [Google Scholar]
- England, P. Comparable Worth: Theories and Evidence; Aldine De Gruyter: New York, NY, USA, 1992. [Google Scholar]
- Kilbourne, B.; England, P.; Beron, K. Effects of individual, occupational, and industrial characteristics on earnings: Intersections of race and gender. Soc. Forces 1994, 72, 1149–1176. [Google Scholar] [CrossRef]
- Jang, S.-N. Korean Longitudinal Study of Ageing (KLoSA): Overview of research design and contents. Encycl. Geropsychol. 2015, 1–9. [Google Scholar] [CrossRef]
- Lee, Y.; Back, J.H.; Kim, J.; Byeon, H. Multiple socioeconomic risks and cognitive impairment in older adults. Dement. Geriatr. Cognit. Disord. 2010, 29, 523–529. [Google Scholar] [CrossRef] [PubMed]
- Jaishankar, M.; Tseten, T.; Anbalagan, N.; Mathew, B.B.; Beeregowda, K.N. Toxicity, mechanism and health effects of some heavy metals. Interdiscip. Toxicol. 2014, 7, 60–72. [Google Scholar] [CrossRef] [PubMed]
- Chun, H.R.; Cho, I.; Choi, Y.; Cho, S.I. Effects of emotional labor factors and working environment on the risk of depression in pink-collar workers. Int. J. Environ. Res. Public Health 2020, 17, 5208. [Google Scholar] [CrossRef] [PubMed]
- Edwards, A.M. The" White-Collar Workers". Mon. Labor Rev. 1934, 38, 501–505. [Google Scholar]
- Marandi, E.H.; Moghaddas, E.J. Motivation factors of Blue collar workers verses White collar workers in Herzberg’s Two Factors theory. 2013; (unpublished). [Google Scholar]
- Yang, S.; Kim, W.; Choi, K.H.; Yi, Y.G. Influence of occupation on lumbar spine degeneration in men: The Korean national health and nutrition examination survey 2010–2013. Int. Arch. Occup. Environ. Health 2016, 89, 1321–1328. [Google Scholar] [CrossRef] [PubMed]
- Kim, H.-J.; Min, J.-Y.; Min, K.-B. Successful aging and mortality risk: The Korean longitudinal study of aging (2006–2014). J. Am. Med. Dir. Assoc. 2019, 20, 1013–1020. [Google Scholar] [CrossRef]
- Dartigues, J.-F.; Gagnon, M.; Letenneur, L.; Barberger-Gateau, P.; Commenges, D.; Evaldre, M.; Salamon, R. Principal lifetime occupation and cognitive impairment in a French elderly cohort (Paquid). Am. J. Epidemiol. 1992, 135, 981–988. [Google Scholar] [CrossRef]
- Alvarado, B.E.; Zunzunegui, M.-V.; del Ser, T.; Béland, F. Cognitive decline is related to education and occupation in a Spanish elderly cohort. Aging Clin. Exp. Res. 2002, 14, 132–142. [Google Scholar] [CrossRef]
- James, R.N., III; Sweaney, A.L. Housing dissatisfaction and cognitive decline in older adults. J. Hous. Elder. 2010, 24, 93–106. [Google Scholar] [CrossRef]
- Shankar, A.; McMunn, A.; Steptoe, A. Health-related behaviors in older adults: Relationships with socioeconomic status. Am. J. Prev. Med. 2010, 38, 39–46. [Google Scholar] [CrossRef] [PubMed]
- Martikainen, P.; Valkonen, T.; Martelin, T. Change in male and female life expectancy by social class: Decomposition by age and cause of death in Finland 1971-95. J. Epidemiol. Commun. Health 2001, 55, 494–499. [Google Scholar] [CrossRef] [PubMed]
- Park, H. Inequality of educational opportunity in Korea by gender, socio-economic background, and family structure. In Equality in Asia-Pacific; Routledge: Abingdon, UK, 2014; pp. 182–200. [Google Scholar]
- Zhang, Z. Gender differentials in cognitive impairment and decline of the oldest old in China. J. Gerontol. Ser. B Psychol. Sci. Soc. Sci. 2006, 61, S107–S115. [Google Scholar] [CrossRef]
- Nieuwenhuis-Mark, R.E. The death knoll for the MMSE: Has it outlived its purpose? J. Geriatr. Psychiatry Neurol. 2010, 23, 151–157. [Google Scholar] [CrossRef]
- Pezzotti, P.; Scalmana, S.; Mastromattei, A.; di Lallo, D. The accuracy of the MMSE in detecting cognitive impairment when administered by general practitioners: A prospective observational study. BMC Fam. Pract. 2008, 9, 29. [Google Scholar] [CrossRef]
- Seo, E.H. Neuropsychological assessment of dementia and cognitive disorders. J. Korean Neuropsychiatr. Assoc. 2018, 57, 2–11. [Google Scholar] [CrossRef]
- Kueper, J.K.; Speechley, M.; Montero-Odasso, M. The Alzheimer’s disease assessment scale–cognitive subscale (ADAS-Cog): Modifications and responsiveness in pre-dementia populations. Narrat. Rev. J. Alzheimer’s Dis. 2018, 63, 423–444. [Google Scholar] [CrossRef]
- Wouters, H.; van Gool, W.A.; Schmand, B.; Zwinderman, A.H.; Lindeboom, R. Three sides of the same coin: Measuring global cognitive impairment with the MMSE, ADAS-cog and CAMCOG. Int. J. Geriatr. Psychiatry 2010, 25, 770–779. [Google Scholar] [CrossRef]
- Arevalo-Rodriguez, I.; Smailagic, N.; i Figuls, M.R.; Ciapponi, A.; Sanchez-Perez, E.; Giannakou, A.; Pedraza, O.L.; Cosp, X.B.; Cullum, S. Mini-Mental State Examination (MMSE) for the detection of Alzheimer’s disease and other dementias in people with mild cognitive impairment (MCI). Cochrane Database Syst. Rev. 2015, 2015, 2015. [Google Scholar] [CrossRef]
- Wang, H.-X.; MacDonald, S.W.; Dekhtyar, S.; Fratiglioni, L. Association of lifelong exposure to cognitive reserve-enhancing factors with dementia risk: A community-based cohort study. PLoS Med. 2017, 14, e1002251. [Google Scholar] [CrossRef] [PubMed]
- Lyu, J.; Burr, J.A. Socioeconomic status across the life course and cognitive function among older adults: An examination of the latency, pathways, and accumulation hypotheses. J. Aging Health 2016, 28, 40–67. [Google Scholar] [CrossRef]
- Le Carret, N.; Lafont, S.; Letenneur, L.; Dartigues, J.-F.; Mayo, W.; Fabrigoule, C. The effect of education on cognitive performances and its implication for the constitution of the cognitive reserve. Dev. Neuropsychol. 2003, 23, 317–337. [Google Scholar] [CrossRef] [PubMed]
- Heckman, J.J. Selection Bias and Self-Selection; Springer: Berlin, Germany, 1990; pp. 201–224. [Google Scholar]
- Kang, Y.; Na, D.L.; Hahn, S. A validity study on the Korean Mini-Mental State Examination (K-MMSE) in dementia patients. J. Korean Neurol. Assoc. 1997, 15, 300–308. [Google Scholar]
- Oh, E.; Kang, Y.; Shin, J.; Yeon, B. A validity study of K-MMSE as a screening test for dementia: Comparison against a comprehensive neuropsychological evaluation. Dement Neurocognitive Disord 2010, 9, 8–12. [Google Scholar]


| Male | Female | |||||||
|---|---|---|---|---|---|---|---|---|
| Blue-Collar | Pink-Collar | White-Collar | p-Value | Blue-Collar | Pink-Collar | White-Collar | p-Value | |
| n = 473 (64.27%) | n = 75 (10.19%) | n = 188 (25.54%) | n = 743 (74.52%) | n = 200 (20.06%) | n = 54 (5.42%) | |||
| Age | ||||||||
| Mean (SD) | 70.23 (4.33) | 69.41 (4.56) | 70.92 (4.51) | 0.0325 | 71.16 (4.98) | 70.64 (5.09) | 69.04 (3.37) | 0.0059 |
| Marital Status | ||||||||
| Married | 442 (93.45) | 66 (88) | 178 (94.68) | 0.2898 | 376 (50.61) | 98 (49) | 34 (62.96) | 0.3743 |
| Divorced/Widowed | 30 (6.34) | 9 (12) | 10 (5.32) | 364 (48.99) | 102 (51) | 20 (37.04) | ||
| Never Married | 1 (0.21) | 0 (0) | 0 (0) | 3 (0.4) | 0 (0) | 0 (0) | ||
| Education | ||||||||
| Elementary or Less | 306 (64.69) | 28 (37.33) | 23 (12.23) | <0.0001 | 703 (94.62) | 166 (83) | 12 (22.22) | <0.0001 |
| Middle/High School | 160 (33.83) | 42 (56) | 95 (50.53) | 40 (5.38) | 32 (16) | 36 (66.67) | ||
| College or Higher | 7 (1.48) | 5 (6.67) | 70 (37.23) | 0 (0) | 2 (1) | 6 (11.11) | ||
| Income (Yearly, 10,000 KRW) * | ||||||||
| <1000 | 304 (64.27) | 43 (57.33) | 103 (54.79) | 0.051 | 519 (69.85) | 138 (69) | 34 (62.96) | 0.7943 |
| 1000–2500 | 117 (24.74) | 26 (34.67) | 54 (28.72) | 159 (21.4) | 41 (20.5) | 14 (25.93) | ||
| >2500 | 52 (10.99) | 6 (8) | 31 (16.49) | 65 (8.75) | 21 (10.5) | 6 (11.11) | ||
| Cigarette Smoking | ||||||||
| Never Smoker | 206 (43.55) | 33 (44) | 87 (46.28) | 0.0003 | 716 (96.37) | 190 (95) | 53 (98.15) | 0.8463 |
| Former Smoker | 108 (22.83) | 19 (25.33) | 68 (36.17) | 6 (0.81) | 2 (1) | 0 (0) | ||
| Current Smoker | 159 (33.62) | 23 (30.67) | 33 (17.55) | 21 (2.83) | 8 (4) | 1 (1.85) | ||
| Alcohol Drinking | ||||||||
| Current Drinker | 275 (58.14) | 42 (56) | 105 (55.85) | 0.8625 | 91 (12.25) | 27 (13.5) | 5 (9.26) | 0.0371 |
| Former Drinker | 70 (14.8) | 9 (12) | 30 (15.96) | 20 (2.69) | 0 (0) | 3 (5.56) | ||
| Nondrinker | 128 (27.06) | 24 (32) | 53 (28.19) | 632 (85.06) | 173 (86.5) | 46 (85.19) | ||
| Physical Activity | ||||||||
| Yes | 152 (32.14) | 33 (44) | 138 (73.4) | <0.0001 | 158 (21.27) | 74 (37) | 29 (53.7) | <0.0001 |
| No | 321 (67.86) | 42 (56) | 50 (26.6) | 585 (78.73) | 126 (63) | 25 (46.3) | ||
| Muscle Strength ** | ||||||||
| Low | 226 (47.78) | 29 (38.67) | 68 (36.17) | 0.0159 | 363 (48.86) | 80 (40) | 18 (33.33) | 0.0123 |
| High | 247 (52.22) | 46 (61.33) | 120 (63.83) | 380 (51.14) | 120 (60) | 36 (66.67) | ||
| Chronic Disease | ||||||||
| Yes | 105 (22.2) | 13 (17.33) | 40 (21.28) | 0.633 | 169 (22.75) | 54 (27) | 9 (16.67) | 0.2241 |
| No | 368 (77.8) | 62 (82.67) | 148 (78.72) | 574 (77.25) | 146 (73) | 45 (83.33) | ||
| Living Alone | ||||||||
| Yes | 311 (65.75) | 50 (66.67) | 118 (62.77) | 0.7336 | 453 (60.97) | 105 (52.5) | 38 (70.37) | 0.0252 |
| No | 162 (34.25) | 25 (33.33) | 70 (37.23) | 290 (39.03) | 95 (47.5) | 16 (29.63) | ||
| Well-Being | ||||||||
| Yes | 382 (80.76) | 63 (84) | 174 (92.55) | 0.0009 | 564 (75.91) | 152 (76) | 45 (83.33) | 0.4605 |
| No | 91 (19.24) | 12 (16) | 14 (7.45) | 179 (24.09) | 48 (24) | 9 (16.67) | ||
| Work Duration † | ||||||||
| Low | 168 (35.52) | 66 (88) | 146 (77.66) | <0.0001 | 305 (41.05) | 160 (80) | 40 (74.07) | <0.0001 |
| High | 305 (64.48) | 9 (12) | 42 (22.34) | 438 (58.95) | 40 (20) | 14 (25.93) | ||
| Time Spent after Retirement ‡ | ||||||||
| Low | 286 (60.47) | 47 (62.67) | 48 (25.53) | <0.0001 | 399 (53.7) | 93 (46.5) | 24 (44.44) | 0.1057 |
| High | 187 (39.53) | 28 (37.33) | 140 (74.47) | 344 (46.3) | 107 (53.5) | 30 (55.56) | ||
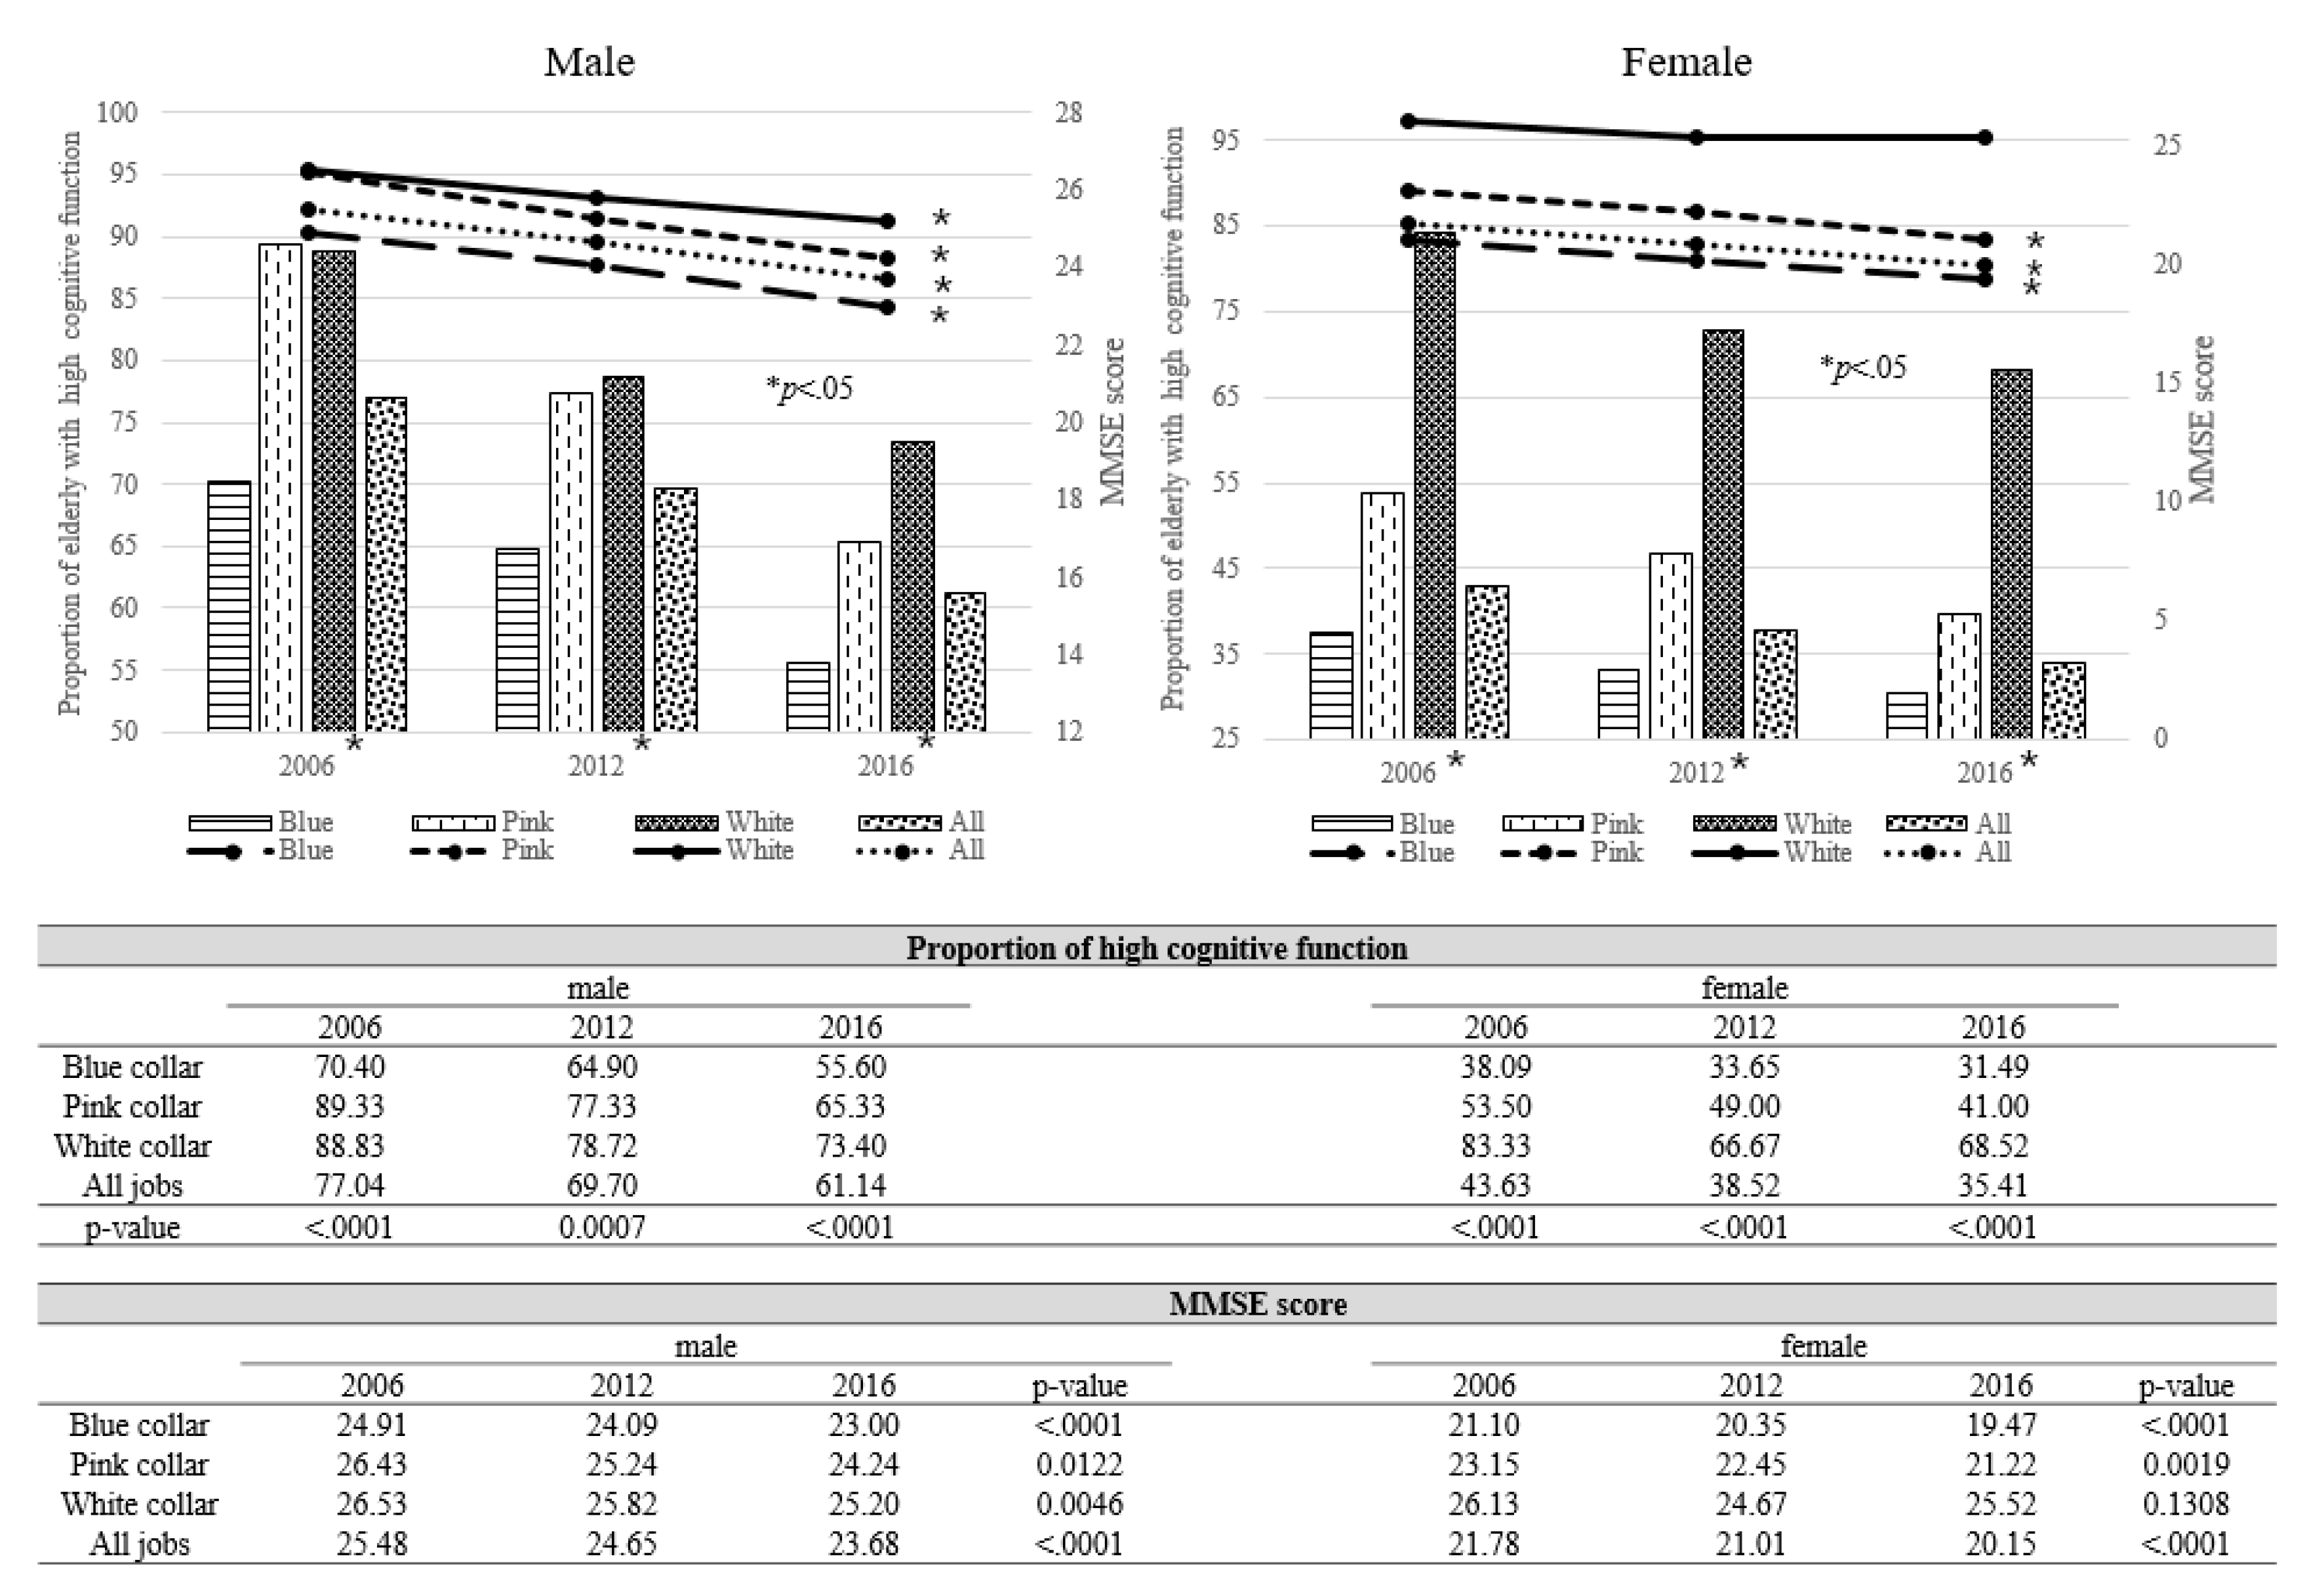
| K-MMSE Score | ||||||||
| Mean (SD) | 24.90 | 26.43 | 26.53 | <0.0001 | 21.10 | 23.15 | 26.13 | <0.0001 |
| 2006 | 2012 | 2016 | ||||
|---|---|---|---|---|---|---|
| Unadjusted Model | OR | 95% CI | OR | 95% CI | OR | 95% CI |
| White-Collar Job | Reference | Reference | Reference | |||
| Blue-Collar Job | 3.34 | (2.04–5.48) | 2.02 | (1.36–3.00) | 2.16 | (1.49–3.12) |
| Pink-Collar Job | 0.95 | (0.40–2.25) | 1.1 | (0.58–2.09) | 1.46 | (0.82–2.60) |
| Adjusted Model † | OR | 95% CI | OR | 95% CI | OR | 95% CI |
| White-Collar Job | Reference | Reference | Reference | |||
| Blue-Collar Job | 1.69 | (0.88–3.24) | 1.13 | (0.65–1.95) | 1.34 | (0.80–2.26) |
| Pink-Collar Job | 0.68 | (0.26–1.80) | 0.94 | (0.44–2.00) | 1.24 | (0.62–2.48) |
| 2006 | 2012 | 2016 | ||||
|---|---|---|---|---|---|---|
| Unadjusted Model | OR | 95% CI | OR | 95% CI | OR | 95% CI |
| White-Collar Job | Reference | Reference | Reference | |||
| Blue-Collar Job | 8.13 | (3.91–16.88) | 3.56 | (1.99–6.38) | 4.82 | (2.66–8.73) |
| Pink-Collar Job | 4.35 | (2.02–9.36) | 1.86 | (1.00–3.48) | 3.11 | (1.64–5.89) |
| Adjusted model † | OR | 95% CI | OR | 95% CI | OR | 95% CI |
| White-Collar Job | Reference | Reference | Reference | |||
| Blue-Collar Job | 2.49 | (1.05–5.88) | 1.57 | (0.74–3.31) | 2.17 | (1.02–4.65) |
| Pink-Collar Job | 1.96 | (0.81–4.78) | 0.93 | (0.43–2.02) | 1.89 | (0.86–4.16) |
© 2020 by the authors. Licensee MDPI, Basel, Switzerland. This article is an open access article distributed under the terms and conditions of the Creative Commons Attribution (CC BY) license (http://creativecommons.org/licenses/by/4.0/).
Share and Cite
Kim, H.-J.; Min, J.-Y.; Min, K.-B. The Association between Longest-Held Lifetime Occupation and Late-Life Cognitive Impairment: Korean Longitudinal Study of Aging (2006–2016). Int. J. Environ. Res. Public Health 2020, 17, 6270. https://doi.org/10.3390/ijerph17176270
Kim H-J, Min J-Y, Min K-B. The Association between Longest-Held Lifetime Occupation and Late-Life Cognitive Impairment: Korean Longitudinal Study of Aging (2006–2016). International Journal of Environmental Research and Public Health. 2020; 17(17):6270. https://doi.org/10.3390/ijerph17176270
Chicago/Turabian StyleKim, Hye-Jin, Jin-Young Min, and Kyoung-Bok Min. 2020. "The Association between Longest-Held Lifetime Occupation and Late-Life Cognitive Impairment: Korean Longitudinal Study of Aging (2006–2016)" International Journal of Environmental Research and Public Health 17, no. 17: 6270. https://doi.org/10.3390/ijerph17176270
APA StyleKim, H.-J., Min, J.-Y., & Min, K.-B. (2020). The Association between Longest-Held Lifetime Occupation and Late-Life Cognitive Impairment: Korean Longitudinal Study of Aging (2006–2016). International Journal of Environmental Research and Public Health, 17(17), 6270. https://doi.org/10.3390/ijerph17176270