Demolition Activity and Elevated Blood Lead Levels among Children in Detroit, Michigan, 2014–2018

 ,
, 
Abstract
:1. Introduction
2. Materials and Methods
2.1. Source Population and Data Sources
2.1.1. Definitions of Incident and Prevalent Elevated Blood Lead Levels (EBLLs)
2.1.2. Descriptive Analysis
2.2. Case-Control Analysis
Exposure—Proximate Demolition Activity
2.3. Statistical Analysis
2.4. Sensitivity Analysis
3. Results
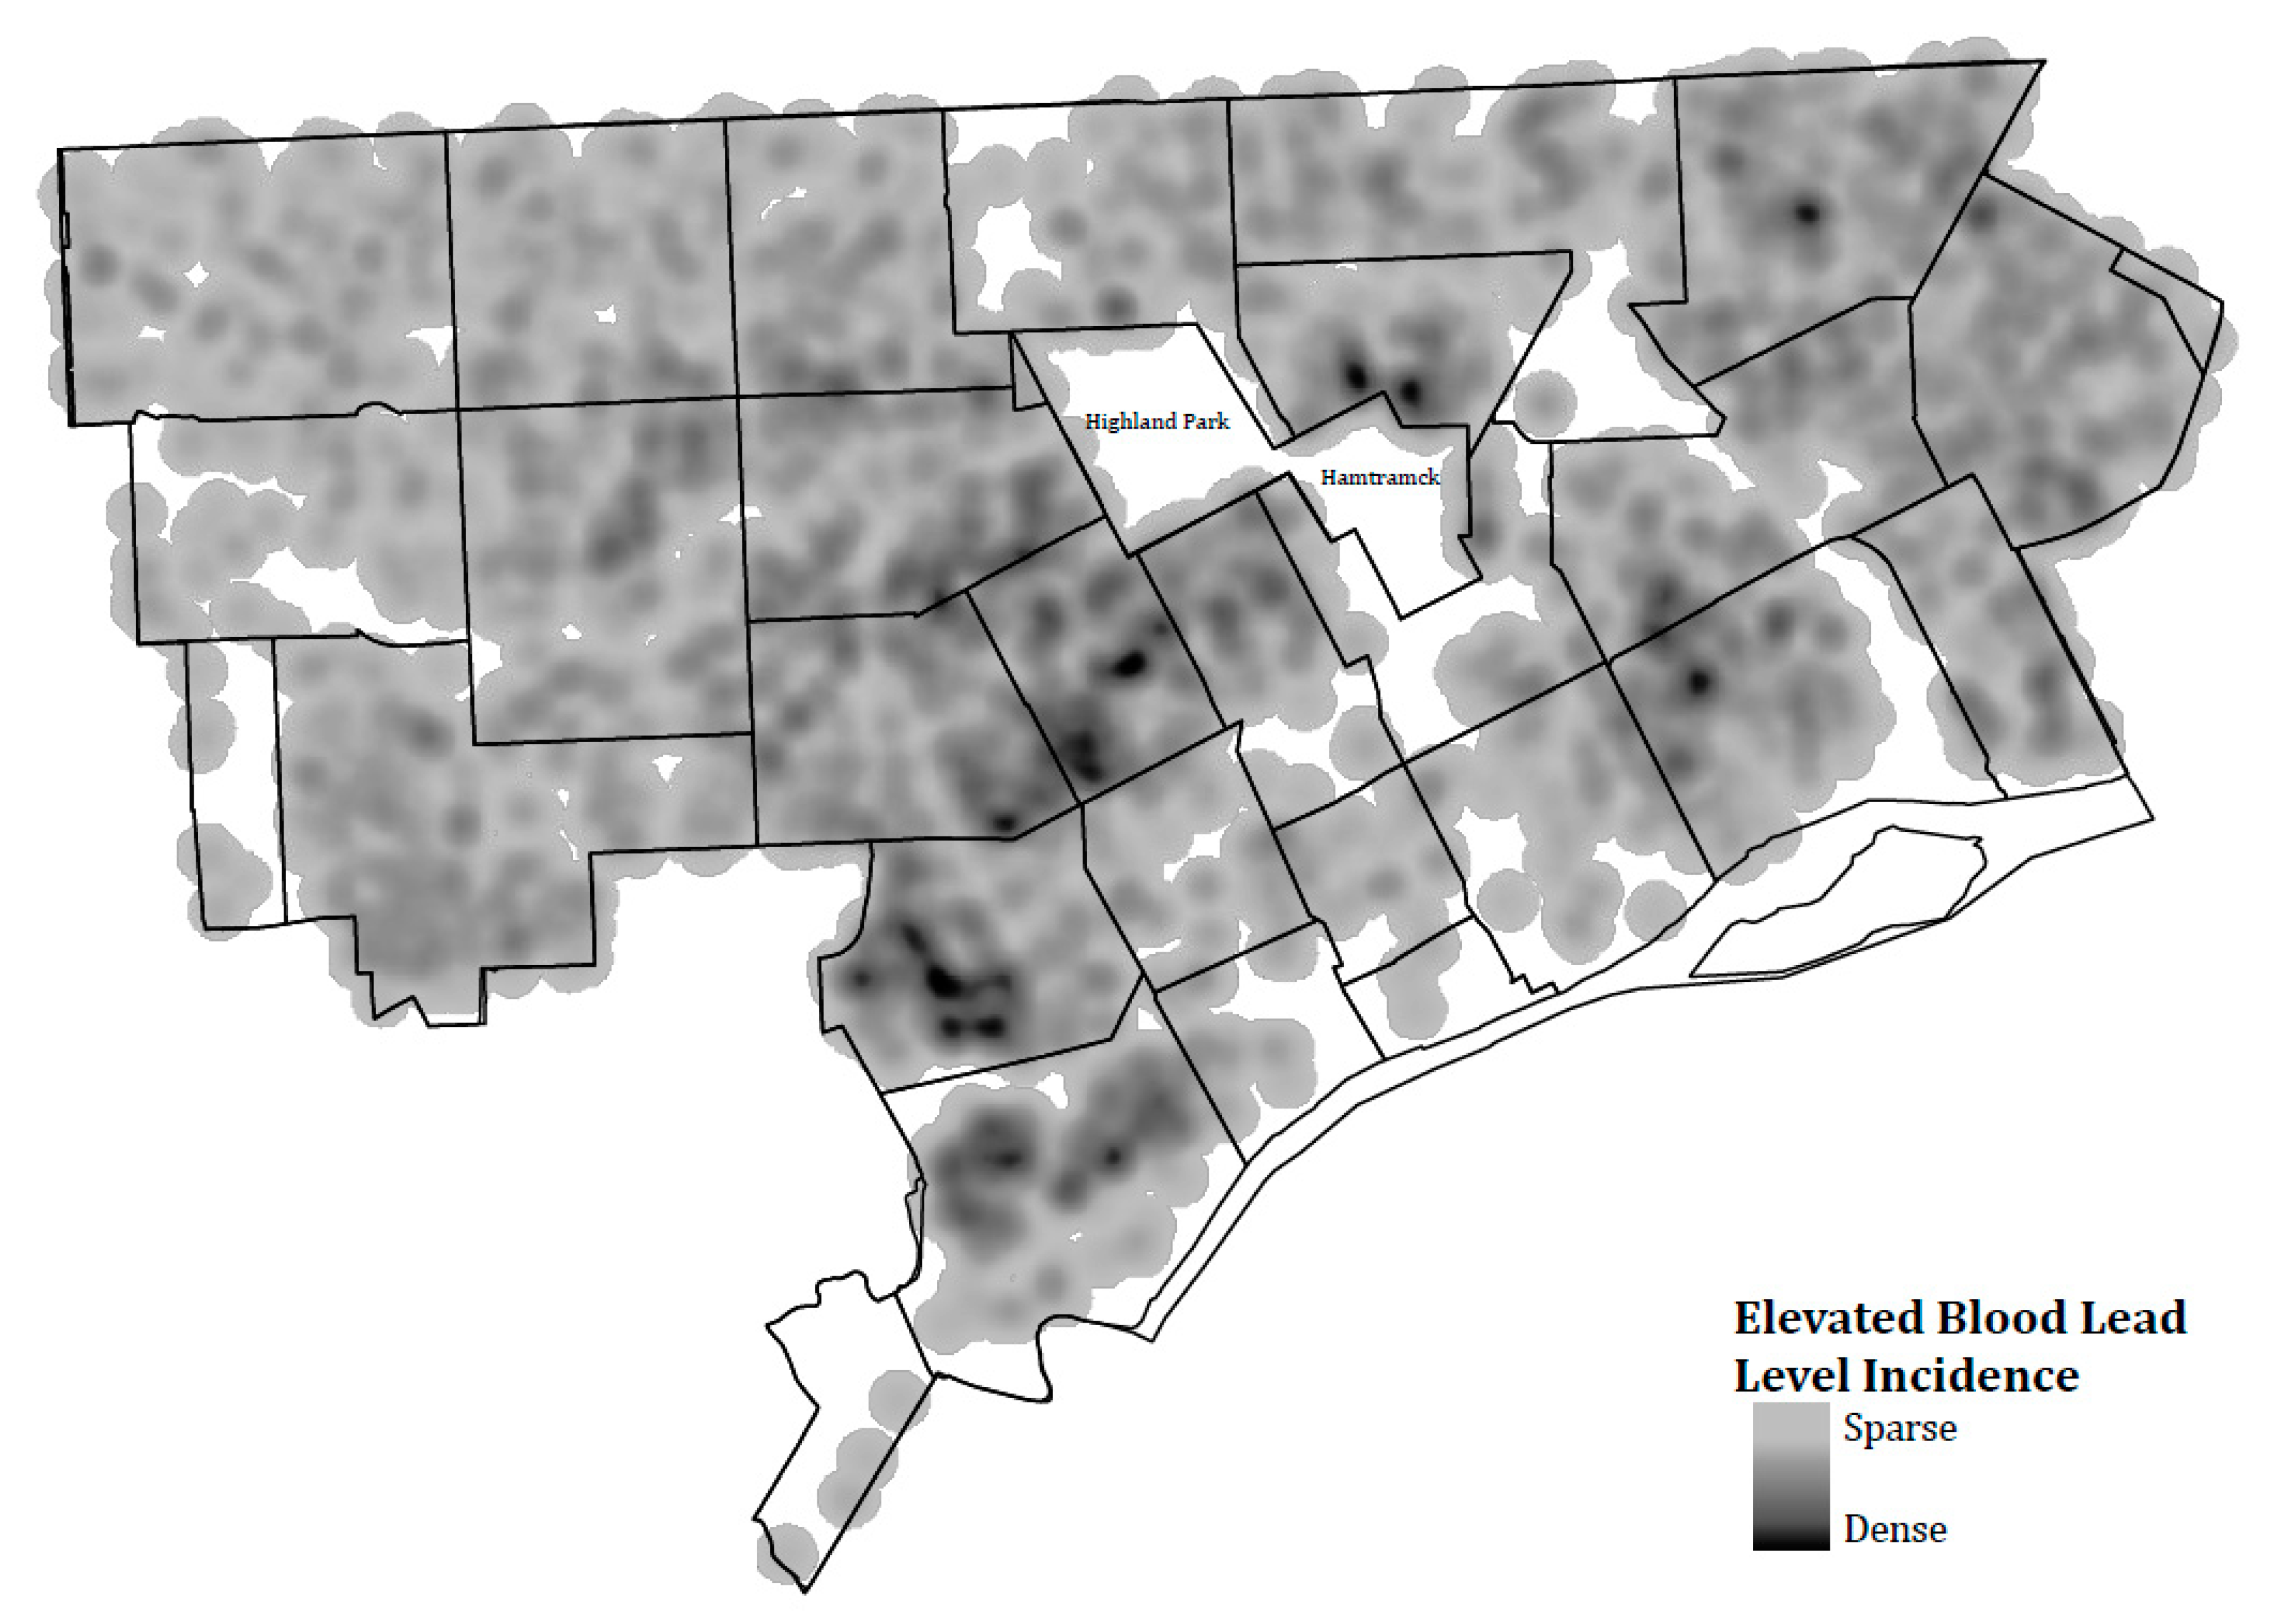
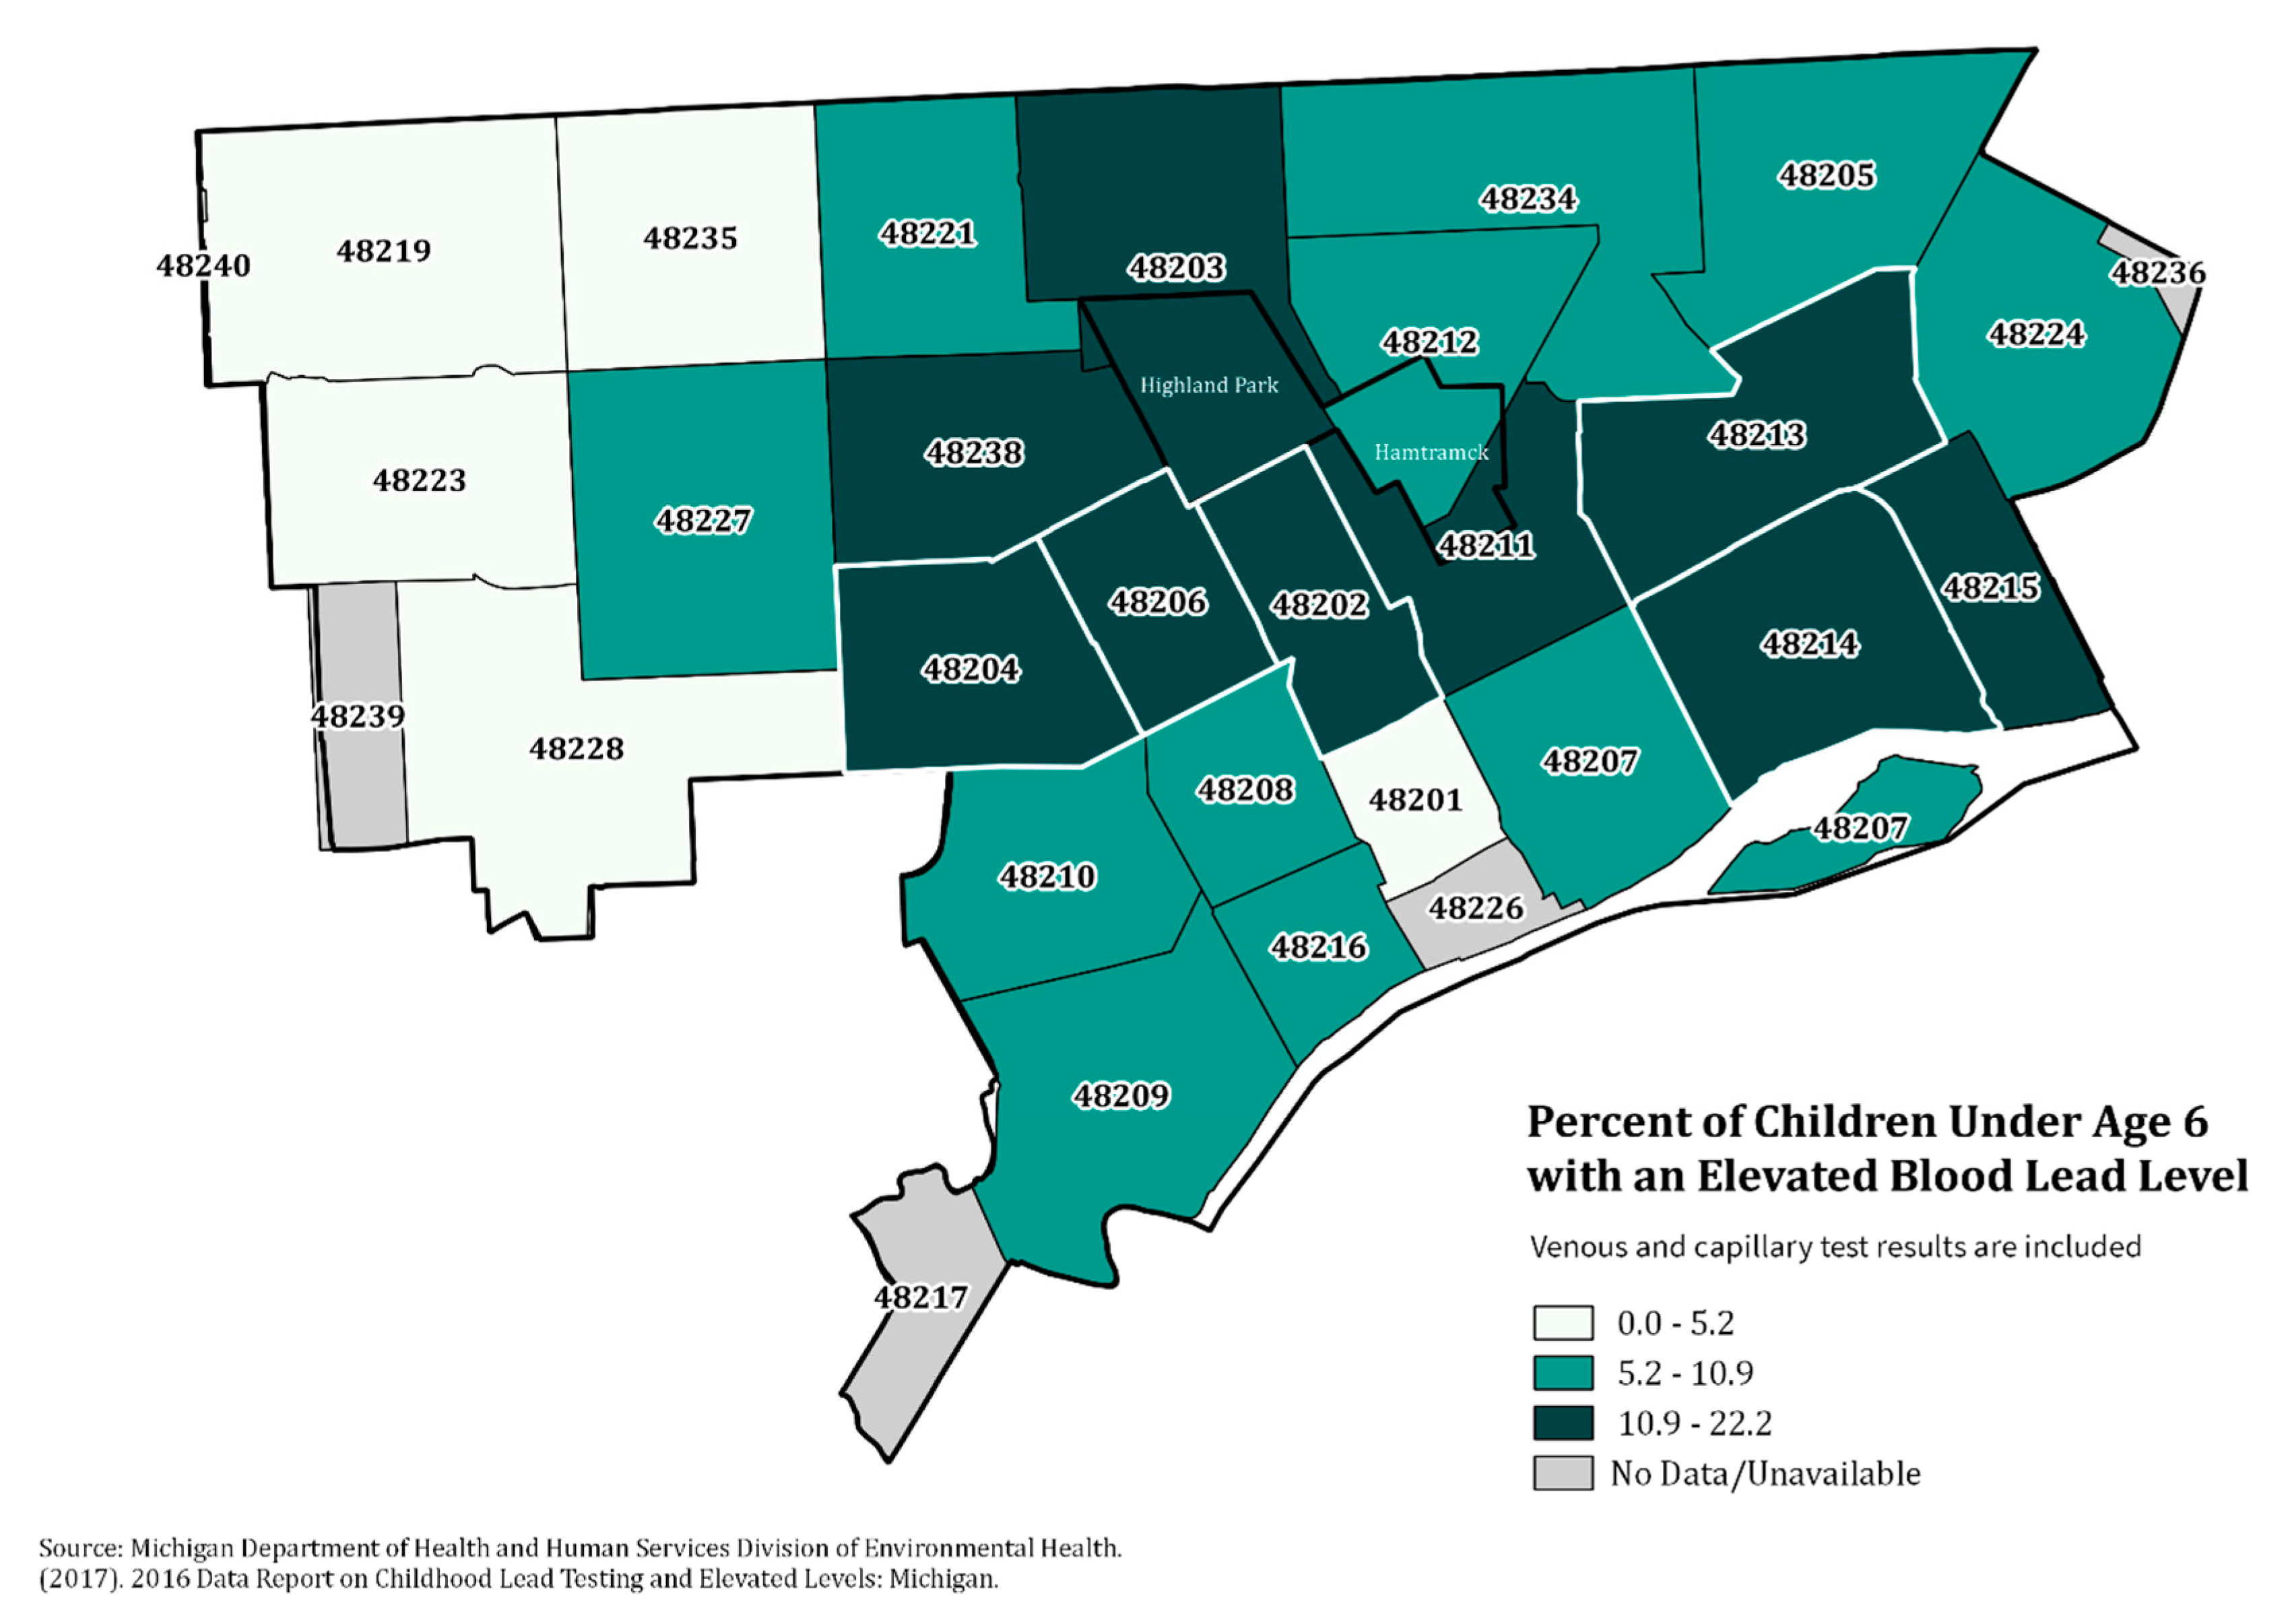
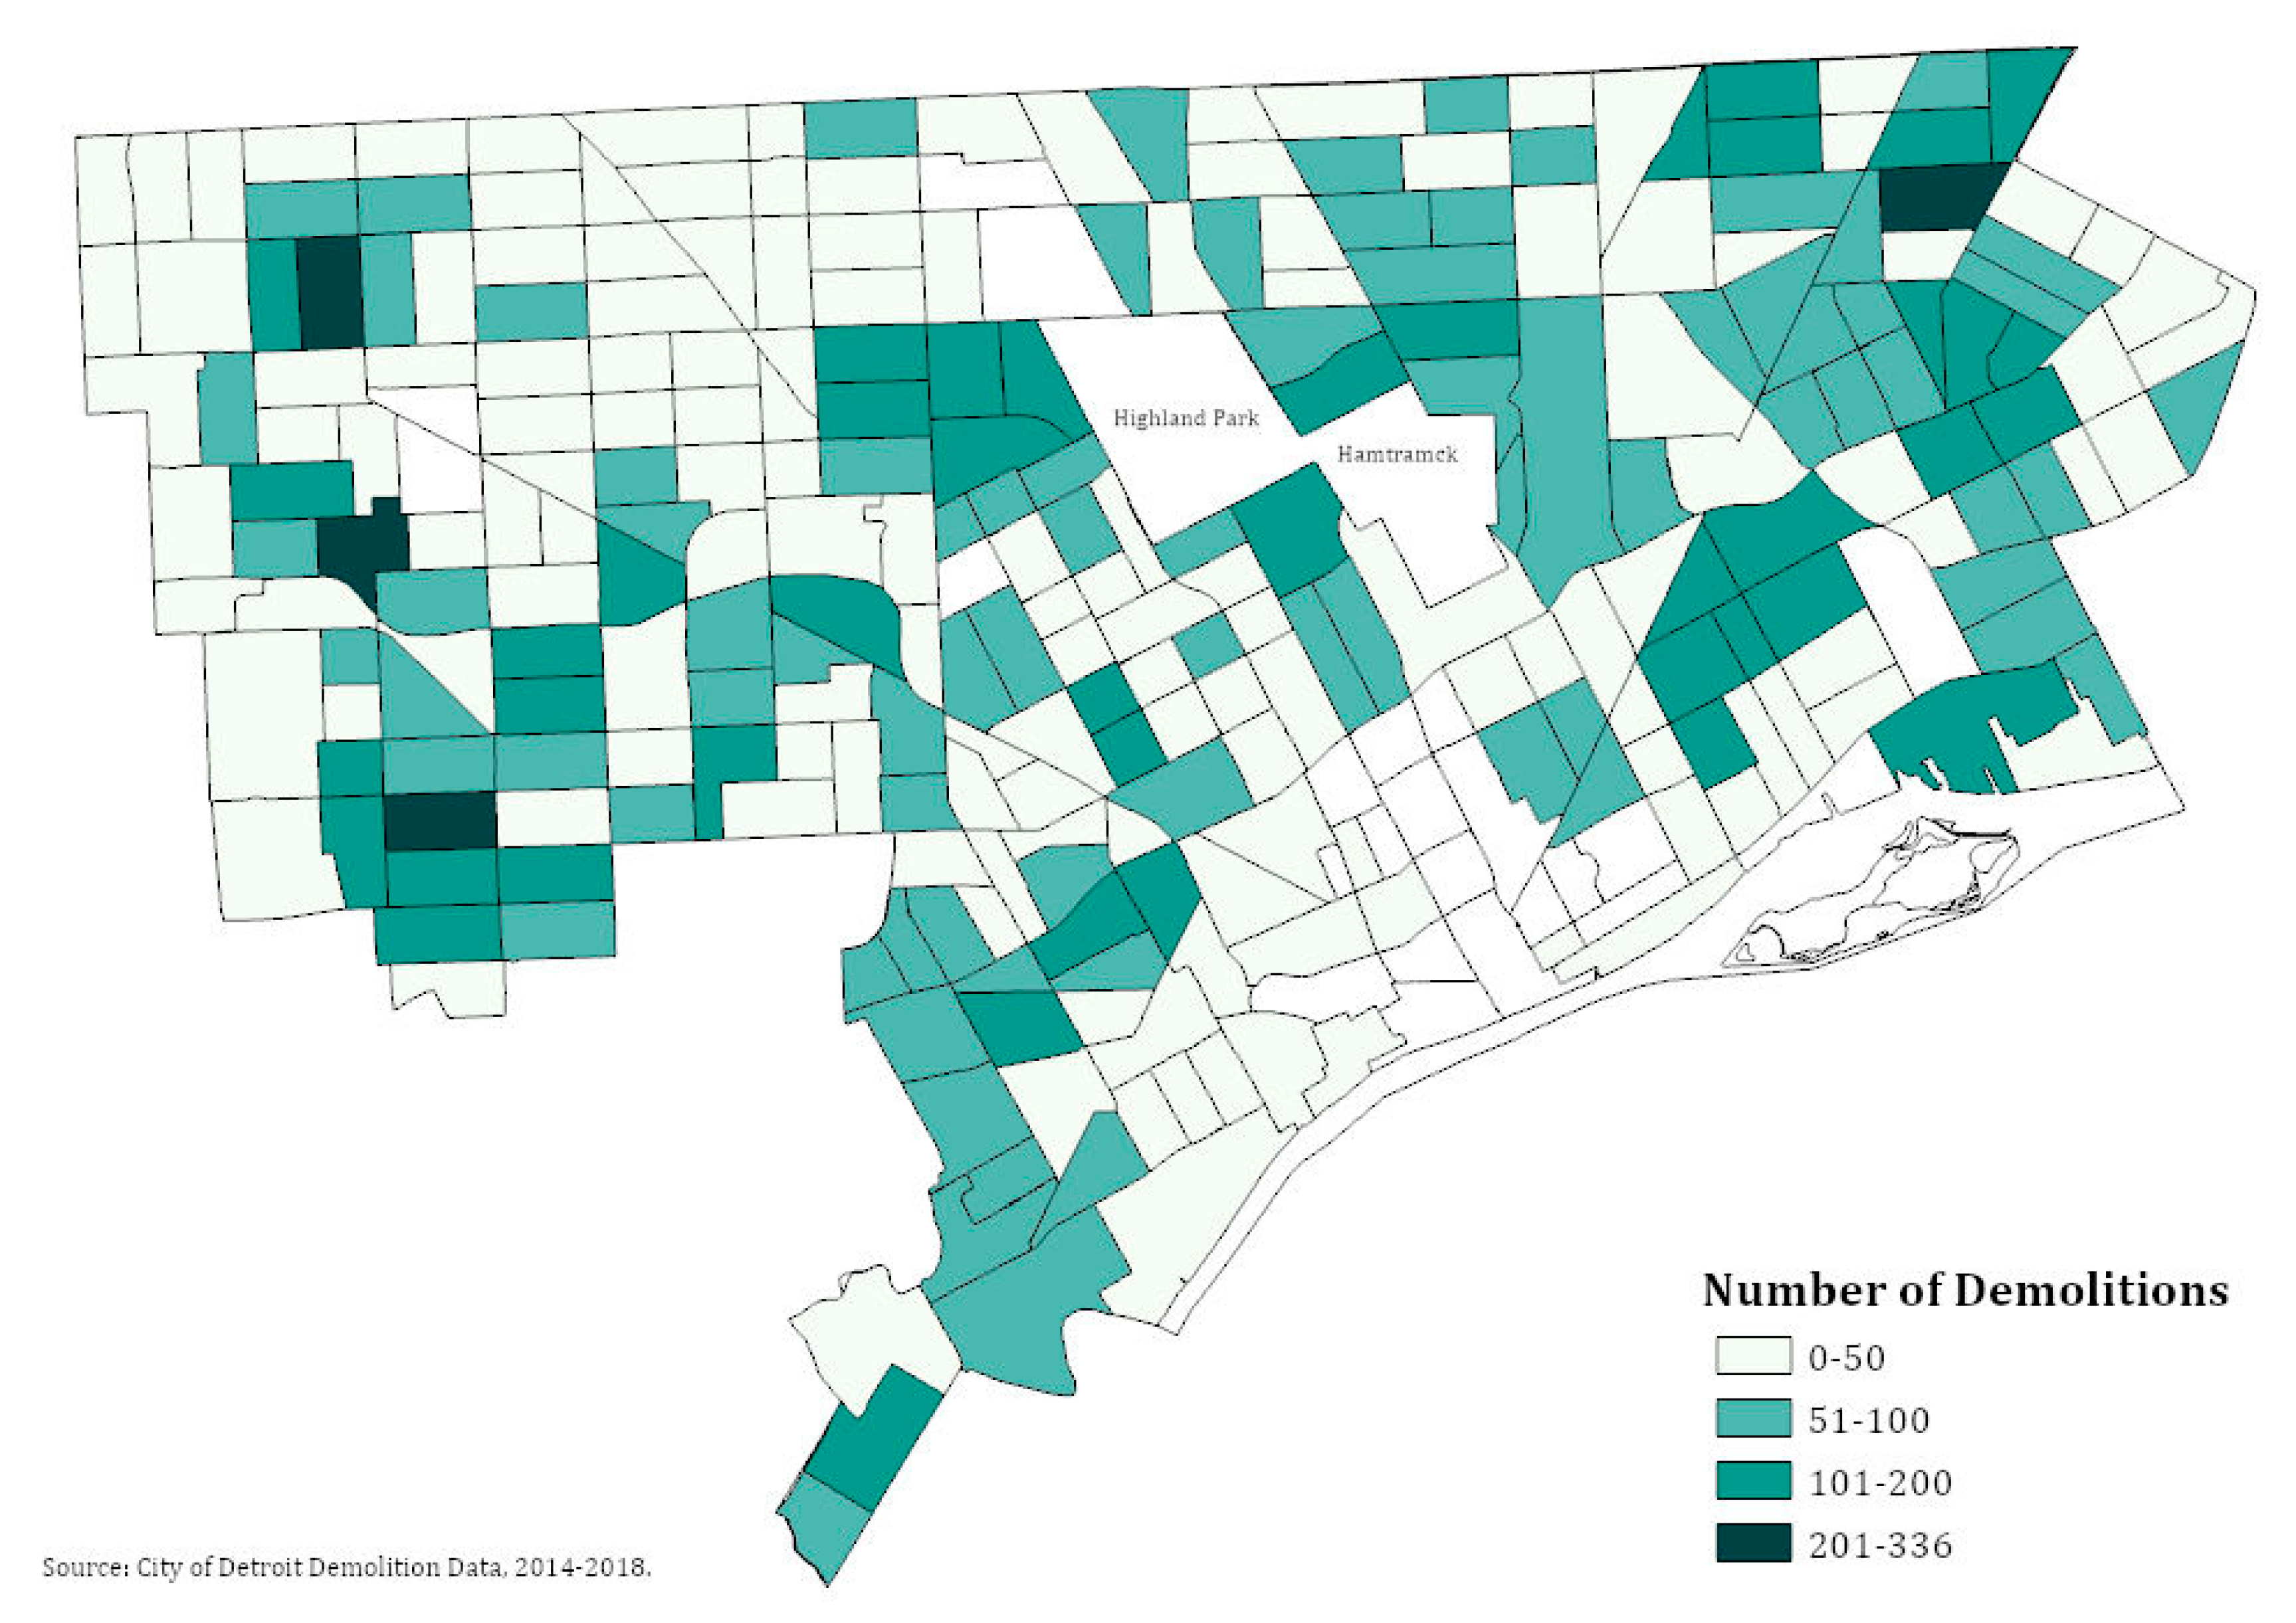
3.1. Descriptive Analysis
3.2. Case-Control Analysis
3.3. Sensitivity Analyses
4. Discussion
Limitations and Strengths
5. Conclusions
Supplementary Materials
Author Contributions
Funding
Conflicts of Interest
Disclaimer
Appendix A. Partial List and Approximate Timeline of Health and Safety Changes to Detroit Demolition Protocol
References
- South, E.C.; Kondo, M.C.; Cheney, R.A.; Branas, C.C. Neighborhood blight, stress, and health: A walking trial of urban greening and ambulatory heart rate. Am. J. Public Health 2015, 105, 909–913. [Google Scholar] [CrossRef] [PubMed]
- Healthy Neighborhoods for a Healthy Detroit Health Impact Assessment of the Strategic Framework to Regenerate Detroit. 2015. Available online: https://www.detroiturc.org/research-partnerships/detroit-health-impact-assessment (accessed on 14 August 2020).
- Garvin, E.; Branas, C.; Keddem, S.; Sellman, J.; Cannuscio, C. More than just an eyesore: Local insights and solutions on vacant land and urban health. J. Hered. 2012, 90, 412–426. [Google Scholar] [CrossRef] [PubMed] [Green Version]
- Raleigh, E.; Galster, G. Neighborhood disinvestment, abandonment, and crime dynamics. J. Urban Aff. 2015, 37, 367–396. [Google Scholar] [CrossRef]
- Stacy, C. The effect of vacant building demolitions on crime under depopulation. J. Reg. Sci. 2017, 58, 100–115. [Google Scholar] [CrossRef]
- Farfel, M.R.; Orlova, O.A.; Lees, P.S.J.; Rohde, C.; Ashley, P.J.; Chisolm, J.J. A study of urban housing demolitions as sources of lead in ambient dust: Demolition practices and exterior dust fall. Environ. Health Perspect. 2003, 111, 1228–1234. [Google Scholar] [CrossRef] [PubMed] [Green Version]
- Jacobs, D.E.; Cali, S.; Welch, A.; Catalin, B.; Dixon, S.L.; Evens, A.; Mucha, A.P.; Vahl, N.; Erdal, S.; Bartlett, J. Lead and other heavy metals in dust fall from single-family housing demolition. Public Health Rep. 2013, 128, 454–462. [Google Scholar] [CrossRef] [PubMed] [Green Version]
- Rabito, F.; Iqbal, S.; Shorter, C.; Osman, P.; Philips, P.; Langlois, E.; White, L. The association between demolition activity and children’s blood lead levels. Environ. Res. 2007, 103, 345–351. [Google Scholar] [CrossRef] [PubMed]
- Detroit Demolition Department. Detroit Demolition Funding and Upcoming Project Status. Available online: https://detroitmi.gov/departments/detroit-demolition (accessed on 1 November 2019).
- Jay, J.; Miratrix, L.W.; Branas, C.C.; Zimmerman, M.A.; Hemenway, D. Urban building demolitions, firearm violence and drug crime. J. Behav. Med. 2019, 42, 626–634. [Google Scholar] [CrossRef] [PubMed]
- Estimating Home Equity Impacts from Rapid, Targeted Residential Demolition in Detroit, MI: Application of A Spatially-Dynamic Data System for Decision Support. Available online: https://static1.squarespace.com/static/55e8c061e4b018cc4b5864bc/t/55f78eeee4b07bf949e5de03/1442287342508/Detroit_DemoStudy_FinalEditedVersion.pdf (accessed on 14 August 2020).
- 2016 Data Report on Childhood Lead Testing and Elevated Levels: Michigan. Available online: https://www.michigan.gov/documents/lead/2016_CLPPP_Annual_Report_5-1-18_621989_7.pdf (accessed on 14 August 2020).
- City of Detroit Taskforce on Demolitions and Health. City of Detroit Taskforce on Demolitions and Health Task Force Recommendations for Improving Demolition Safety and Health Standards, 2017; City of Detroit. Detroit, Michigan, United States. 2017. Available online: https://detroitmi.gov/sites/detroitmi.localhost/files/2018-05/Task%20Force%20Recommendations.pdf (accessed on 14 August 2020).
- Diorio, J. Fugitive lead dust from the demolition of residential housing. J. Environ. Health 1999, 61, 36–37. [Google Scholar]
- Detroit Building Authority Daily Checklist for Demolition Contractors. Available online: https://detroitmi.gov/departments/detroit-demolition-department (accessed on 14 August 2020).
- A Creticos, P. Michigan’s Public Health Code; Colorado State Government: Denver, CO, USA, 1979.
- Michigan Department of Health and Human Services Medicaid Blood Lead Testing. Available online: https://www.michigan.gov/mdhhs/0,5885,7-339-73970_2944_5327-102097--,00.html (accessed on 14 August 2020).
- Rabinowitz, M.B.; Wetherill, G.W.; Kopple, J.D. Kinetic analysis of lead metabolism in healthy humans. J. Clin. Investig. 1976, 58, 260–270. [Google Scholar] [CrossRef] [PubMed] [Green Version]
- Liew, Z.; Kioumourtzoglou, M.-A.; Roberts, A.L.; O’Reilly, É.J.; Ascherio, A.; Weisskopf, M.G. Use of negative control exposure analysis to evaluate confounding: An example of acetaminophen exposure and attention-deficit/hyperactivity disorder in nurses’ health study II. Am. J. Epidemiol. 2019, 188, 768–775. [Google Scholar] [CrossRef] [PubMed]
- Weisskopf, M.G.; Tchetgen-Tchetgen, E.J.; Raz, R. On the use of imperfect negative control exposures in epidemiologic studies. Epidemiology 2016, 27, 365–367. [Google Scholar] [CrossRef] [PubMed]
- Lipsitch, M.; Tchetgen, E.T.; Cohen, T. Negative controls. Epidemiology 2010, 21, 383–388. [Google Scholar] [CrossRef]
- Wang, A.; Rezania, Z.; Haugen, K.M.B.; Baertlein, L.; Yendell, S.J. Screening for elevated blood lead levels. J. Public Health Manag. Pr. 2019, 25, S44–S50. [Google Scholar] [CrossRef] [PubMed]
- Levin, R.; Brown, M.J.; Kashtock, M.E.; Jacobs, D.E.; Whelan, E.A.; Rodman, J.; Schock, M.R.; Padilla, A.; Sinks, T. Lead exposures in U.S. children, 2008: Implications for prevention. Environ. Health Perspect. 2008, 116, 1285–1293. [Google Scholar] [CrossRef] [Green Version]


| 2018 | 2017 | 2016 | 2015 | 2014 | |
|---|---|---|---|---|---|
| Number of children <6 years old with a reported blood lead test (one observation per child per year) | 19,820 | 22,216 | 23,408 | 21,404 | 23,134 |
| EBLL (≥5 µg/dL) | 1406 | 1658 | 2055 | 1624 | 1915 |
| Percent EBLL (%) | 7.1 | 7.5 | 8.8 | 7.6 | 8.3 |
| Number of Demolitions within 400 Feet of Residence in 45 Days Prior to Blood Lead Test | |||||||||||||
|---|---|---|---|---|---|---|---|---|---|---|---|---|---|
| Year | Total | 0 | 1 | 2 | 3 | 4 | 5 | 6 | 7 | 8 | 9 | ≥10 | |
| 2014 | BLL < 5 µg/dL | 21,219 | 20,075 | 787 | 193 | 73 | 32 | 26 | 11 | 5 | 5 | 5 | 7 |
| BLL ≥5 µg/dL | 1915 | 1768 | 90 | 27 | 14 | 8 | * | * | 0 | * | 0 | * | |
| 2015 | BLL < 5 µg/dL | 19,780 | 18,561 | 867 | 200 | 80 | 36 | 22 | * | 7 | * | 0 | * |
| BLL ≥ 5 µg/dL | 1624 | 1505 | 93 | 14 | * | 9 | 0 | 0 | 0 | 0 | 0 | 0 | |
| 2016 | BLL < 5 µg/dL | 21,353 | 20,217 | 906 | 168 | 32 | 17 | * | * | * | * | * | * |
| BLL ≥ 5 µg/dL | 2055 | 1901 | 106 | 29 | 7 | 5 | * | * | 0 | 0 | 0 | * | |
| 2017 | BLL < 5 µg/dL | 20,558 | 19,851 | 580 | 78 | 21 | 14 | * | 6 | * | * | 0 | * |
| BLL ≥ 5 µg/dL | 1658 | 1558 | 72 | 13 | 8 | * | 0 | * | 0 | 0 | 0 | * | |
| 2018 | BLL < 5 µg/dL | 18,414 | 17,516 | 717 | 116 | 40 | 18 | * | * | 0 | 0 | 0 | * |
| BLL ≥ 5 µg/dL | 1406 | 1342 | 48 | 13 | * | 0 | 0 | * | 0 | 0 | 0 | 0 | |
| 2014–2018 | BLL < 5 µg/dL | 101,324 | 96,220 | 3857 | 755 | 246 | 117 | 59 | 24 | 16 | 9 | 8 | 13 |
| BLL ≥ 5 µg/dL | 8658 | 8074 | 409 | 96 | 34 | 24 | * | 10 | 0 | * | 0 | 6 | |
| Cases N = 5430 | Controls N = 48,720 | ||
|---|---|---|---|
| n (%) | n (%) | ||
| Age | <1 year | 279(5) | 7613(16) |
| 1–2 years | 3335(61) | 26,862(55) | |
| 3–5 years | 1816(33) | 14,245(29) | |
| Gender | F | 2416(44) | 23,967(49) |
| M | 2956(54) | 24,276(50) | |
| Unknown | 58(1) | 477(1) | |
| Month | January | 307(6) | 3836(8) |
| February | 250(5) | 3579(7) | |
| March | 296(5) | 4239(9) | |
| April | 323(6) | 3977(8) | |
| May | 398(7) | 4108(8) | |
| June | 568(10) | 3875(8) | |
| July | 578(11) | 3826(8) | |
| August | 730(13) | 4973(10) | |
| September | 813(15) | 5464(11) | |
| October | 537(10) | 4381(9) | |
| November | 370(7) | 3495(7) | |
| December | 260(5) | 2967(6) | |
| Year | 2014 | 1206(22) | 9972(20) |
| 2015 | 995(18) | 8835(18) | |
| 2016 | 1269(23) | 10,169(21) | |
| 2017 | 1013(19) | 10,101(21) | |
| 2018 | 947(17) | 9643(20) | |
| Specimen Type | Capillary | 1129(21) | 10,389(21) |
| Venous | 4300(79) | 38,011(78) | |
| Unknown | 1(0) | 320(1) | |
| Demolitions within 400 feet, 45 days before test | 0 | 5054(93) | 46,419(95) |
| 1 | 255(5) | 1755(4) | |
| 2 | 121(2) | 546(1) |
| 2018 | 2017 | 2016 | 2015 | 2014 | Overall | |
|---|---|---|---|---|---|---|
| Incident EBLL cases | 947 | 1013 | 1269 | 995 | 1206 | 5430 |
| 0 Demolitions before test | 900 | 950 | 1171 | 918 | 1115 | 5054 |
| 1 Demolition before test | 39 | 43 | 63 | 59 | 51 | 255 |
| 2 Demolitions before test | 8 | 20 | 35 | 18 | 40 | 121 |
| Controls | 9643 | 10,101 | 10,169 | 8835 | 9972 | 48,720 |
| 0 Demolitions before test | 9197 | 9762 | 9662 | 8312 | 9486 | 46,419 |
| 1 Demolition before test | 356 | 270 | 414 | 373 | 342 | 1755 |
| 2 Demolitions before test | 90 | 69 | 93 | 150 | 144 | 546 |
| Main analysis (includes demolitions 45 days before and after test) | OR 95% CI | OR 95% CI | OR 95% CI | OR 95% CI | OR 95% CI | OR 95% CI |
| 1 Demolition before test (main exposure) | 0.96 | 1.51 | 1.24 | 1.32 | 1.03 | 1.19 |
| (0.67, 1.33) | (1.06, 2.10) | (0.92, 1.63) | (0.98, 1.76) | (0.74, 1.39) | (1.03, 1.36) | |
| 2 or More Demolitions before test (main exposure) | 0.94 | 2.16 | 2.36 | 1.03 | 1.75 | 1.63 |
| (0.41, 1.86) | (1.24, 3.60) | (1.53, 3.55) | (0.60, 1.68) | (1.17, 2.55) | (1.32, 2.00) | |
| 1 Demolition after test (negative control exposure) | 0.96 | 1.36 | 1.17 | 1.01 | 1.28 | 1.14 |
| (0.67, 1.34) | (0.96, 1.87) | (0.84, 1.61) | (0.72, 1.37) | (0.96, 1.69) | (0.99, 1.31) | |
| 2 or More Demolitions after test (negative control exposure) | 1.00 | 1.46 | 0.86 | 0.89 | 1.39 | 1.11 |
| (0.53, 1.73) | (0.81, 2.49) | (0.46, 1.49) | (0.47, 1.55) | (0.89, 2.11) | (0.88, 1.40) | |
| Demolitions before test only | OR 95% CI | OR 95% CI | OR 95% CI | OR 95% CI | OR 95% CI | OR 95% CI |
| 1 Demolition | 0.95 | 1.52 | 1.24 | 1.32 | 1.05 | 1.19 |
| (0.67, 1.33) | (1.07, 2.11) | (0.92, 1.63) | (0.98, 1.76) | (0.76, 1.42) | (1.04, 1.37) | |
| 2 or More Demolitions | 0.94 | 2.30 | 2.35 | 1.03 | 1.89 | 1.66 |
| (0.41, 1.86) | (1.33, 3.82) | (1.53, 3.55) | (0.60, 1.67) | (1.28, 2.73) | (1.35, 2.04) |
© 2020 by the authors. Licensee MDPI, Basel, Switzerland. This article is an open access article distributed under the terms and conditions of the Creative Commons Attribution (CC BY) license (http://creativecommons.org/licenses/by/4.0/).
Share and Cite
Bezold, C.; Bauer, S.J.; Buckley, J.P.; Batterman, S.; Haroon, H.; Fink, L. Demolition Activity and Elevated Blood Lead Levels among Children in Detroit, Michigan, 2014–2018. Int. J. Environ. Res. Public Health 2020, 17, 6018. https://doi.org/10.3390/ijerph17176018
Bezold C, Bauer SJ, Buckley JP, Batterman S, Haroon H, Fink L. Demolition Activity and Elevated Blood Lead Levels among Children in Detroit, Michigan, 2014–2018. International Journal of Environmental Research and Public Health. 2020; 17(17):6018. https://doi.org/10.3390/ijerph17176018
Chicago/Turabian StyleBezold, Carla, Samantha J. Bauer, Jessie P. Buckley, Stuart Batterman, Haifa Haroon, and Lauren Fink. 2020. "Demolition Activity and Elevated Blood Lead Levels among Children in Detroit, Michigan, 2014–2018" International Journal of Environmental Research and Public Health 17, no. 17: 6018. https://doi.org/10.3390/ijerph17176018