Relationships among Leisure Physical Activity, Sedentary Lifestyle, Physical Fitness, and Happiness in Adults 65 Years or Older in Taiwan


Abstract
1. Introduction
2. Materials and Methods
- Demographic information: age, sex, living status (living together with others or living alone), education level, and income.
- Physical fitness testing: Testing was conducted in accordance with The Fitness Guide for Older Adults published by the Sports Administration of the Ministry of Education. The testing involved cardiorespiratory endurance, muscle strength, muscle endurance, flexibility, balance, and body composition. The method and procedure for each test item are described as follows [35]:
- I.
- Aerobic endurance (2-min step tests): Colored tape was used to mark the height of the middle point between the patella and iliac spine on a wall. This indicated the height to which the participant was asked to raise their knees as they walked in place. The number of steps within 2 min was recorded.
- II.
- Muscle strength and endurance in the upper extremities (30-s arm curl): Each participant was asked to sit on the edge of a chair on the side of their dominant hand with their back straight and both feet fully touching the floor. They were then asked to hold a dumbbell with their dominant hand and bend their elbow toward their shoulder. The number of curls (bending the elbow toward the shoulder and returning to the original position) within 30 s was recorded.
- III.
- Muscle strength and endurance in the lower extremities (30-s chair stand tests): Each participant was asked to sit in the center of a chair with both feet touching the floor and arms crossed in front of their chest. The number of times each participant stood up from a seated position within 30 s was recorded.
- IV.
- Flexibility in the upper extremities (back stretch tests): Each participant was asked to place their dominant hand behind their shoulder on the same side with their palm facing their back; they were then asked to reach their other hand (with the palm facing away from their back) from the lower back upward toward their dominant hand until the two hands overlapped or until they could not reach any further. The test result was determined based on the distance between the two middle fingers. Participants received negative points for the distance between the fingers if the hands did not touch and received positive points for any overlapping.
- V.
- Flexibility in the lower extremities (chair sit-and-reach tests): Each participant was asked to bend one leg, straighten the other leg with the heel touching the floor, place their hands on top of each other, reach the hands toward the toes of their strengthened leg, and hold the position for 2 s. This was repeated twice per leg. Participants received negative points for the distance between their fingertips and the tips of their toes, and they received positive points for the distance of their fingertips beyond their toes. The highest score for each participant was recorded as the test result.
- VI.
- Dynamic balance ability (8-foot up-and-go tests): Each participant was seated on a chair with a 2.44 m traffic cone in front of them. When the tester said “start,” they were asked to walk as fast as possible around the traffic cone (running was not allowed), walk back, and sit back on the chair.
- VII.
- Static balance ability (one-leg stance with eyes open tests): Each participant was asked to stand with their hands on their waist, raise one leg, and then place it on the inner side of the ankle of the other leg. Each participant was alternately tested with both legs; full marks were given for a 120 s stance.
- VIII.
- Body composition: body mass index (BMI) and waist-to-hip ratio (WHR):
- (a)
- BMI is used to measure obesity and is calculated by dividing body weight (kg) by the square of height (m).
- (b)
- To measure WHR, each participant was asked to take a regular breath, after which their waist circumference was measured at the level of the middle point between the lower edge of the ribs and the ilium; hip circumference was measured around the widest part of the hips under the pelvic bone. Both the waist and hip circumferences were measured twice. WHR was calculated by dividing the waist circumference by the hip circumference; the mean of the two WHR measurements was recorded for each participant.
- Physical activity investigation: The participants were asked whether they had participated in physical activities for at least 10 min during the preceding 7 days, primarily to determine whether they have a sedentary lifestyle. Indicators of a lifestyle considered sedentary or not include walking status, how laborious one’s physical activity is, and the extent to which one sits on a daily basis.
- Happiness index: The happiness of elderly adults was assessed using data collected from the Project on the Establishment of Physical Fitness Testing Stations. In this study, a structured questionnaire (with face-to-face administration) was designed based on the Cantril ladder scale (from 0 to 10) in the 2012 Gallup World Poll. The items included “On a scale from 0 to 10, how happy were you yesterday?”
Statistical Analysis
3. Results
4. Discussion
5. Conclusions
Author Contributions
Funding
Acknowledgments
Conflicts of Interest
Appendix A

| Variables | Not Living Alone | Living Alone | p-Value |
|---|---|---|---|
| Population | 11280 (82%) | 2423 (18%) | |
| Age | 73.358 | 74.689 | <0.001 |
| Education | 1.7389 | 1.5819 | <0.001 |
| Income | 1.1932 | 1.1478 | 0.002 |
| BMI | 24.886 | 24.879 | 0.930 |
| WHR | 0.89634 | 0.89615 | 0.910 |
| Step test | 12.391 | 10.775 | <0.001 |
| Chair stand tests | 14.813 | 14.147 | <0.001 |
| Arm curl | 17.640 | 16.775 | <0.001 |
| One-leg stance | 83.54 | 81.26 | 0.0004 |
| Chair sit-and-reach | 4.1156 | 3.8172 | 0.240 |
| Back stretch | −7.6539 | −8.2723 | 0.061 |
| Up-and-go tests | 7.6214 | 8.0769 | <0.001 |
| Laborious | 115.855 | 98.695 | 0.004 |
| M_laborious | 243.79 | 222.49 | 0.001 |
| Walk | 330.47 | 333.57 | 0.72 |
| Sedentary | 1089.5 | 1115.8 | 0.10 |
| Happiness | 39.674 | 38.360 | <0.001 |
| Variables | Rural | Urban | p-Value |
|---|---|---|---|
| Population | 5699 (42%) | 8004 (58%) | |
| Age | 74.275 | 73.107 | <0.001 |
| Education | 1.5113 | 1.8534 | <0.001 |
| Income | 1.1481 | 1.2115 | <0.001 |
| BMI | 25.054 | 24.765 | <0.001 |
| WHR | 0.90328 | 0.89134 | <0.001 |
| Step test | 10.570 | 13.199 | <0.001 |
| Chair stand tests | 13.766 | 15.357 | <0.001 |
| Arm curl | 16.693 | 18.052 | <0.001 |
| One-leg stance | 78.211 | 86.645 | <0.001 |
| Chair sit-and-each | 3.1120 | 4.7398 | <0.001 |
| Back stretch | −8.6306 | −7.1457 | <0.001 |
| Up-and-go tests | 8.2306 | 7.3255 | <0.001 |
| Laborious | 114.29 | 111.77 | 0.610 |
| M_laborious | 233.34 | 244.78 | 0.084 |
| Walk | 315.94 | 341.75 | <0.001 |
| Sedentary | 1067.5 | 1113.1 | 0.0002 |
| Happiness | 39.332 | 39.520 | 0.077 |
References
- Lin, Y.Y.; Huang, C.S. Aging in Taiwan: Building a society for active aging and aging in place. Gerontologist 2016, 56, 176–183. [Google Scholar] [CrossRef] [PubMed]
- National Development Council. Taiwan Economic Forum November 2013; National Development Council: Taipei, Taiwan, 2013.
- Meyer, K.; Stolz, C.; Rott, C.; Laederach-Hofmann, K. Physical activity assessment and health outcomes in old age: How valid are dose–response relationships in epidemiologic studies? Eur. Rev. Aging Phys. Act. 2009, 6, 7. [Google Scholar] [CrossRef][Green Version]
- Ministry of Interior, R.O.C. Estimated Future Population. Available online: https://www.ris.gov.tw/app/portal/673 (accessed on 21 May 2020).
- National Development Council. Estimated Future Population. Available online: https://www.ndc.gov.tw/Content_List.aspx?n=84223C65B6F94D72 (accessed on 21 May 2020).
- National Development Council. Estimated Future Population: Aging. Available online: https://www.ndc.gov.tw/Content_List.aspx?n=695E69E28C6AC7F3 (accessed on 21 May 2020).
- Rowe, J.W.; Kahn, R.L. Successful aging. Gerontologist 1997, 37, 433–440. [Google Scholar] [CrossRef] [PubMed]
- Ralston, M. The role of older persons’ environment in aging well: Quality of life, illness, and community context in South Africa. Gerontologist 2018, 58, 111–120. [Google Scholar] [CrossRef] [PubMed]
- Tkatch, R.; Musich, S.; Macleod, S.; Kraemer, S.; Hawkins, K.; Wicker, E.R.; Armstrong, D.G. A qualitative study to examine older adults’ perceptions of health: Keys to aging successfully. Geriatr. Nurs. 2017, 38, 485–490. [Google Scholar] [CrossRef] [PubMed]
- Vaughan, L.; Leng, X.; La Monte, M.J.; Tindle, H.A.; Cochrane, B.B.; Shumaker, S.A. Functional independence in late-life: Maintaining physical functioning in older adulthood predicts daily life function after age 80. J. Gerontol. A Biol. Sci. Med. Sci. 2016, 71, S79–S86. [Google Scholar] [CrossRef]
- Douglas, H.; Georgiou, A.; Westbrook, J. Social participation as an indicator of successful aging: An overview of concepts and their associations with health. Aust. Health Rev. 2017, 41, 455–462. [Google Scholar] [CrossRef]
- Bum, C.H.; Johnson, J.A.; Choi, C. Healthy aging and happiness in the Korean elderly based upon leisure activity type. Iran. J. Public Health 2020, 49, 454–462. [Google Scholar] [CrossRef]
- Asztalos, M.; Wijndaele, K.; De Bourdeaudhuij, I.; Philippaerts, R.; Matton, L.; Duvigneaud, N.; Thomis, M.; Lefevra, J.; Cardon, G. Sport participation and stress among women and men. Psychol. Sport Exerc. 2012, 13, 466–483. [Google Scholar] [CrossRef]
- Huppert, F.A. Psychological well-being: Evidence regarding its causes and consequences. Appl. Psychol. Health Well-Being 2009, 1, 137–164. [Google Scholar] [CrossRef]
- de Souto Barreto, P. Direct and indirect relationships between physical activity and happiness levels among older adults: A cross-sectional study. Aging Ment. Health 2014, 18, 861–868. [Google Scholar] [CrossRef] [PubMed]
- Richards, J.; Jiang, X.; Kelly, P.; Chau, J.; Bauman, A.; Ding, D. Don’t worry, be happy: Cross-sectional associations between physical activity and happiness in 15 European countries. BMC Public Health 2015, 15, 1–8. [Google Scholar] [CrossRef] [PubMed]
- Ministry of Health and Welfare. White Paper on Health 2020. Available online: https://www.mohw.gov.tw/cp-26-36493-1.html (accessed on 21 May 2020).
- Ainsworth, B.E.; Haskell, W.L.; Leon, A.S.; Jacobs, D.R., Jr.; Montoye, H.J.; Sallis, J.F.; Paffenbarger, R.S., Jr. Compendium of physical activities: Classification of energy costs of human physical activities. Med. Sci. Sports Exerc. 1993, 25, 71–80. [Google Scholar] [CrossRef] [PubMed]
- Blair, S.N.; Kohl, H.W.; Paffenbarger, R.S.; Clark, D.G.; Cooper, K.H.; Gibbons, L.W. Physical fitness and all-cause mortality: A prospective study of healthy men and women. JAMA 1989, 262, 2395–2401. [Google Scholar] [CrossRef] [PubMed]
- Helmrich, S.P.; Ragland, D.R.; Leung, R.W.; Paffenbarger, R.S., Jr. Physical activity and reduced occurrence of non-insulin-dependent diabetes mellitus. N. Engl. J. Med. 1991, 325, 147–152. [Google Scholar] [CrossRef] [PubMed]
- Lynch, J.; Helmrich, S.P.; Lakka, T.A.; Kaplan, G.A.; Cohen, R.D.; Salonen, R.; Salonen, J.T. Moderately intense physical activities and high level of cardiorespiratory fitness reduce the risk of non-insulin dependent diabetes mellitus in middle-aged men. Arch. Intern. Med. 1996, 156, 1307–1314. [Google Scholar] [CrossRef]
- Ogden, J. Health Psychology: A Textbook, 5th ed.; Open University Press: Maidenhead, UK, 2012. [Google Scholar]
- McAuley, E.; Rudolph, D. Physical activity, aging, and psychological well-being. J. Aging Phys. Act. 1995, 3, 67–96. [Google Scholar] [CrossRef]
- Millward, D.J.; Truby, H.; Fox, K.R.; Livingstone, M.B.E.; Macdonald, I.A.; Tothill, P. Sex differences in the composition of weight gain and loss in overweight and obese adults. Br. J. Nutr. 2014, 111, 933–943. [Google Scholar] [CrossRef]
- Fox, K.R. The influence of physical activity on mental well-being. Public Health Nutr. 1999, 2, 411–418. [Google Scholar] [CrossRef]
- Krzepota, J.; Biernat, E.; Florkiewicz, B. The relationship between levels of physical activity and quality of life among students of the University of the third age. Cent. Eur. J. Public Health 2015, 23, 335–339. [Google Scholar]
- Bloodworth, A.; McNamee, M. Conceptions of well-being in psychology and exercise psychology research: A philosophical critique. Health Care Anal. 2007, 15, 107–121. [Google Scholar] [CrossRef] [PubMed]
- Hyde, A.L.; Maher, J.P.; Elavsky, S. Enhancing our understanding of physical activity and wellbeing with a lifespan perspective. Int. J. Wellbeing 2013, 3, 98–115. [Google Scholar] [CrossRef]
- Ku, P.W.; Fox, K.R.; Chen, L.J.; Chou, P. Physical activity and depressive symptoms in older adults: 11-year follow-up. Am. J. Prev. Med. 2012, 42, 355–362. [Google Scholar] [CrossRef]
- Elavsky, S.; McAuley, E. Physical activity, symptoms, esteem, and life satisfaction during menopause. Maturitas 2005, 52, 374–385. [Google Scholar] [CrossRef] [PubMed]
- Elavsky, S.; McAuley, E.; Motl, R.W.; Konopack, J.F.; Marquez, D.X.; Hu, L.; Jerome, G.J.; Diener, E. Physical activity enhances long-term quality of life in older adults: Efficacy, esteem, and affective influences. Ann. Behav. Med. 2005, 30, 138–145. [Google Scholar] [CrossRef] [PubMed]
- McAuley, E.; Konopack, J.F.; Motl, R.W.; Morris, K.S.; Doerksen, S.E.; Rosengren, K.R. Physical activity and quality of life in older adults: Influence of health status and self-efficacy. Ann. Behav. Med. 2006, 31, 99. [Google Scholar] [CrossRef]
- Diener, E. Subjective wellbeing: The science of happiness and a proposal for a national index. Am. Psychol. 2000, 55, 34–43. [Google Scholar] [CrossRef]
- Garatachea, N.; Molinero, O.; Martinez-Garcia, R.; Jimenez-Jimenez, R.; Gonzalez-Gallego, J.; Marquez, S. Feelings of well being in elderly people: Relationship to physical activity and physical function. Arch. Gerontol. Geriatr. 2009, 48, 306–312. [Google Scholar] [CrossRef]
- Sports Administration. Fitness Guide 2020. Available online: https://www.fitness.org.tw/direct01.php (accessed on 23 May 2020).
- Banks, M.H.; Clegg, C.W.; Jackson, I.R.; Kemp, N.J.; Stafford, E.M.; Walls, T.D. The use of the General Health Questionnaire as an indicator of mental health in occupational studies. J. Occup. Psychol. 1980, 53, 187–194. [Google Scholar] [CrossRef]
- Friedman, J.H.; Roosen, C.B. An introduction to multivariate adaptive regression splines. Stat. Methods Med. Res. 1995, 4, 197–217. [Google Scholar] [CrossRef]
- Tuffery, S. Data Mining and Statistics for Decision Making; Wiley Chichester: Chichester, UK, 2011. [Google Scholar]
- Hastie, T.; Tibshirani, R. Exploring the nature of covariate effects in the proportional hazards model. Biometrics 1990, 46, 1005–1016. [Google Scholar] [CrossRef] [PubMed]
- Lee, T.S.; Chiu, C.C.; Chou, Y.C.; Lu, C.J. Mining the customer credit using classification and regression tree and multivariate adaptive regression splines. Comput. Stat. Data Anal. 2006, 50, 1113–1130. [Google Scholar] [CrossRef]
- Hofer, S.M.; Sliwinski, M.J.; Flaherty, B.P. Understanding ageing: Further commentary on the limitations of cross-sectional designs for ageing research. Gerontology 2002, 48, 22–29. [Google Scholar] [CrossRef]
- Chacón-Araya, Y.; Moncada-Jiménez, J. The effect of different physical and sport activity courses on body image of Costa Rican students. J. Phys. Educ. Sport 2013, 13, 498. [Google Scholar]
- Choi, J.Y.; Chang, A.K.; Choi, E.J. Sex differences in social cognitive factors and physical activity in Korean college students. J. Phys. Ther. Sci. 2015, 27, 1659–1664. [Google Scholar] [CrossRef] [PubMed]
- Sjöberg, A.; Slinde, F.; Arvidsson, D.; Ellegård, L.; Gramatkovski, E.; Hallberg, L.; Hulthén, L. Energy intake in Swedish adolescents: Validation of diet history with doubly labelled water. Eur. J. Clin. Nutr. 2003, 57, 1643–1652. [Google Scholar] [CrossRef]
- Trent, L.K.; Hurtado, S.L. Longitudinal trends and gender differences in physical fitness and lifestyle factors in career US Navy personnel (1983–1994). Mil. Med. 1998, 163, 398–407. [Google Scholar] [CrossRef][Green Version]


| Variables | Male | Female | p-Value |
|---|---|---|---|
| Population | 4978 (36%) | 8725 (64%) | |
| Age | 74.233 | 73.228 | <0.001 |
| Education | 2.0474 | 1.5193 | <0.001 |
| Income | 1.2949 | 1.1225 | <0.001 |
| BMI | 24.835 | 24.913 | 0.20 |
| WHR | 0.92414 | 0.88042 | <0.001 |
| Stance with eyes open | 13.621 | 11.241 | <0.001 |
| Chair stand | 15.220 | 14.396 | <0.001 |
| Arm curl | 17.945 | 17.225 | <0.001 |
| 2-min step | 85.288 | 81.910 | <0.001 |
| Chair sit-and-reach | 0.92135 | 5.85516 | <0.001 |
| Back stretch | −12.1460 | −5.2627 | <0.001 |
| Up-and-go | 7.4862 | 7.8250 | <0.001 |
| Laborious | 142.554 | 95.856 | <0.001 |
| M_laborious | 258.07 | 229.73 | <0.001 |
| Walk | 347.48 | 321.62 | <0.001 |
| Sedentary | 1100.8 | 1090.3 | 0.40 |
| Happiness | 39.175 | 39.593 | <0.001 |
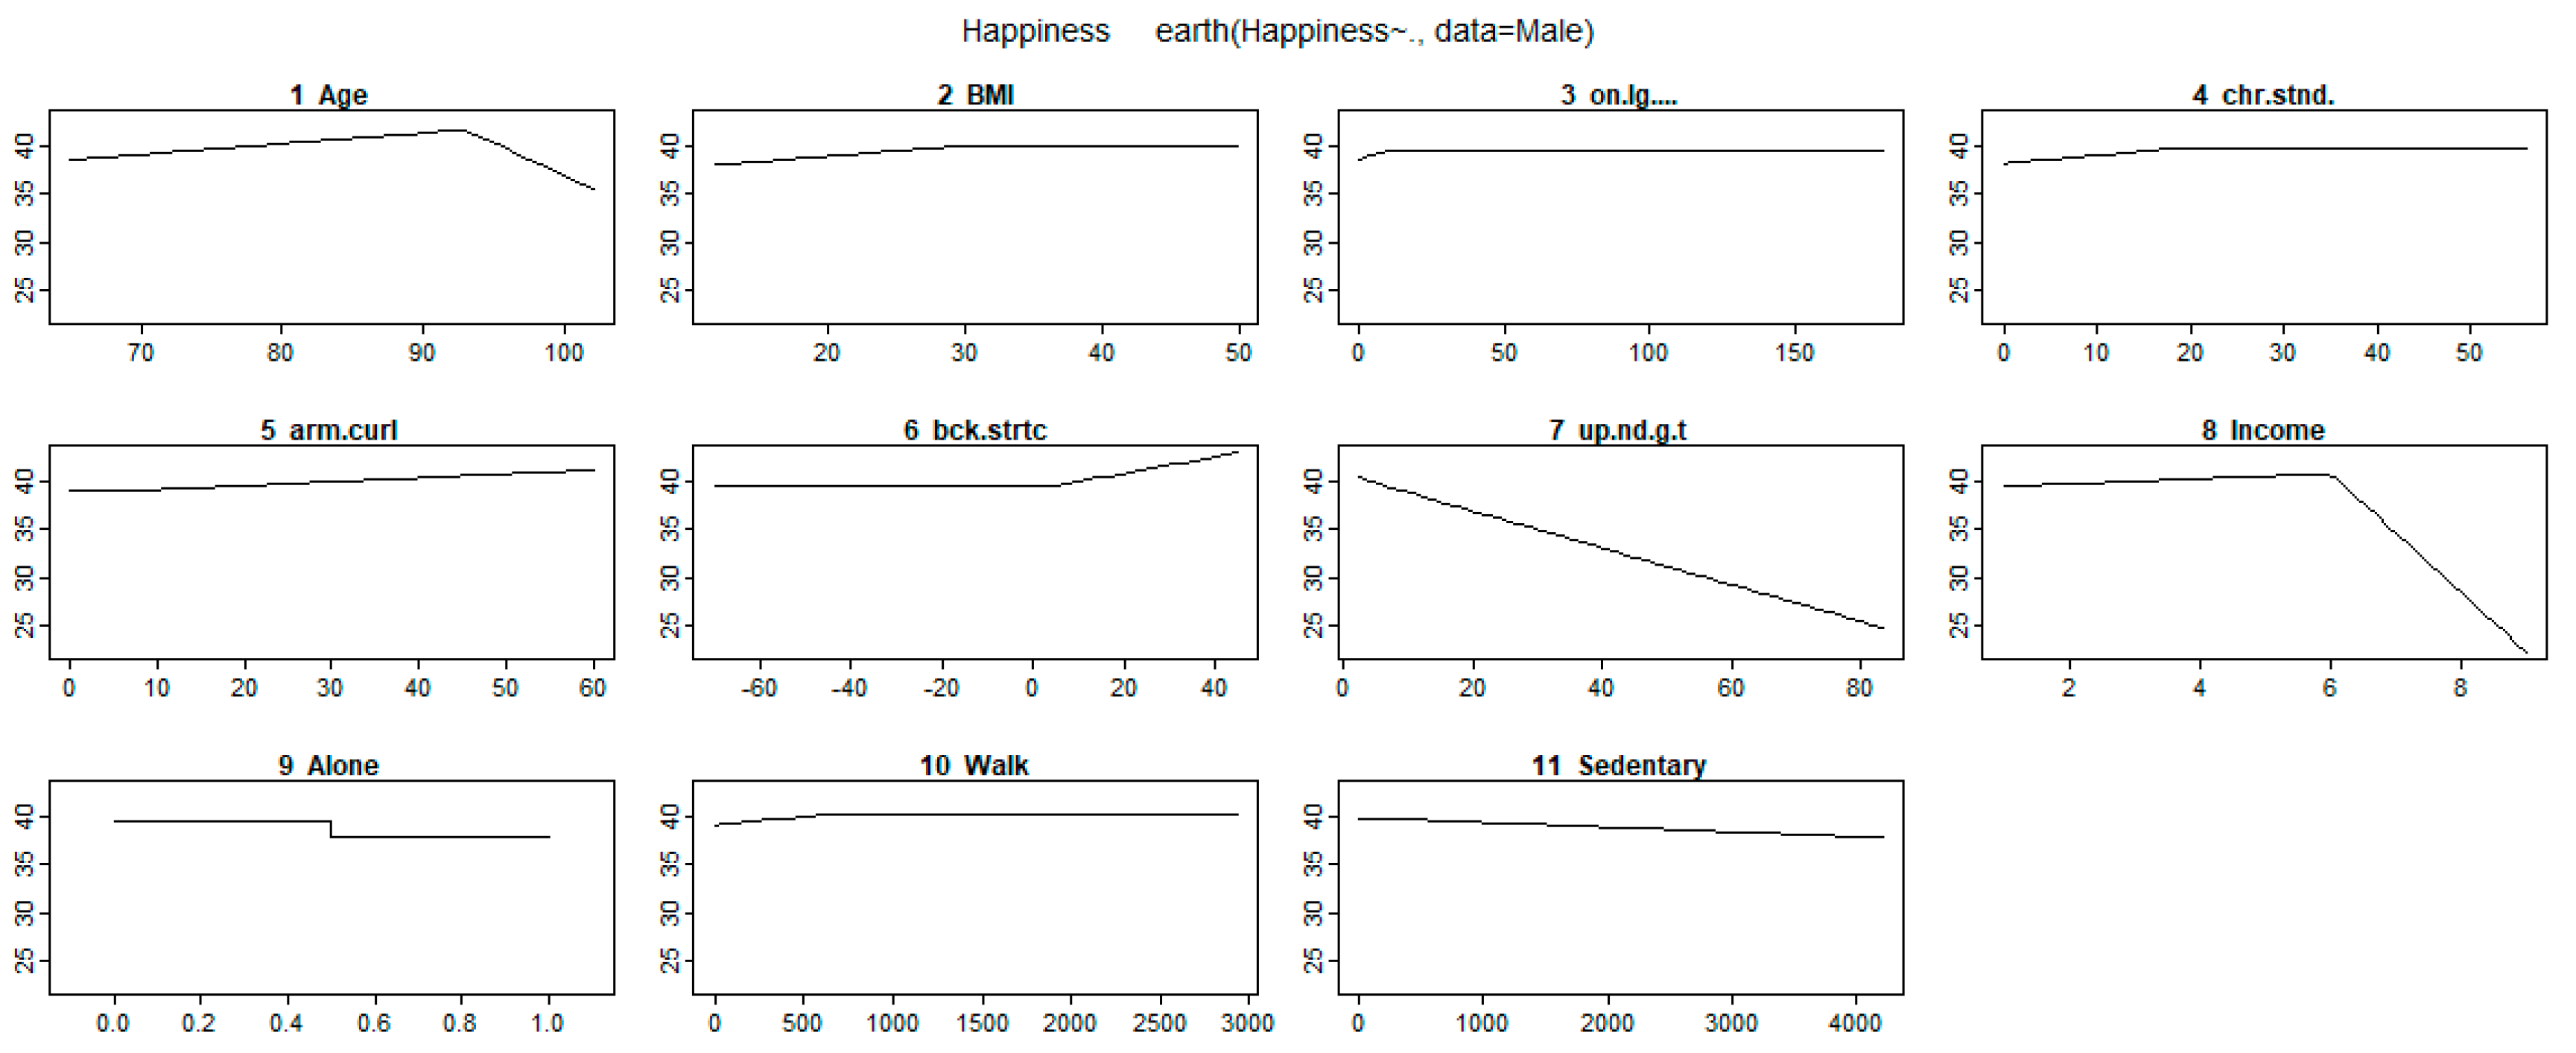
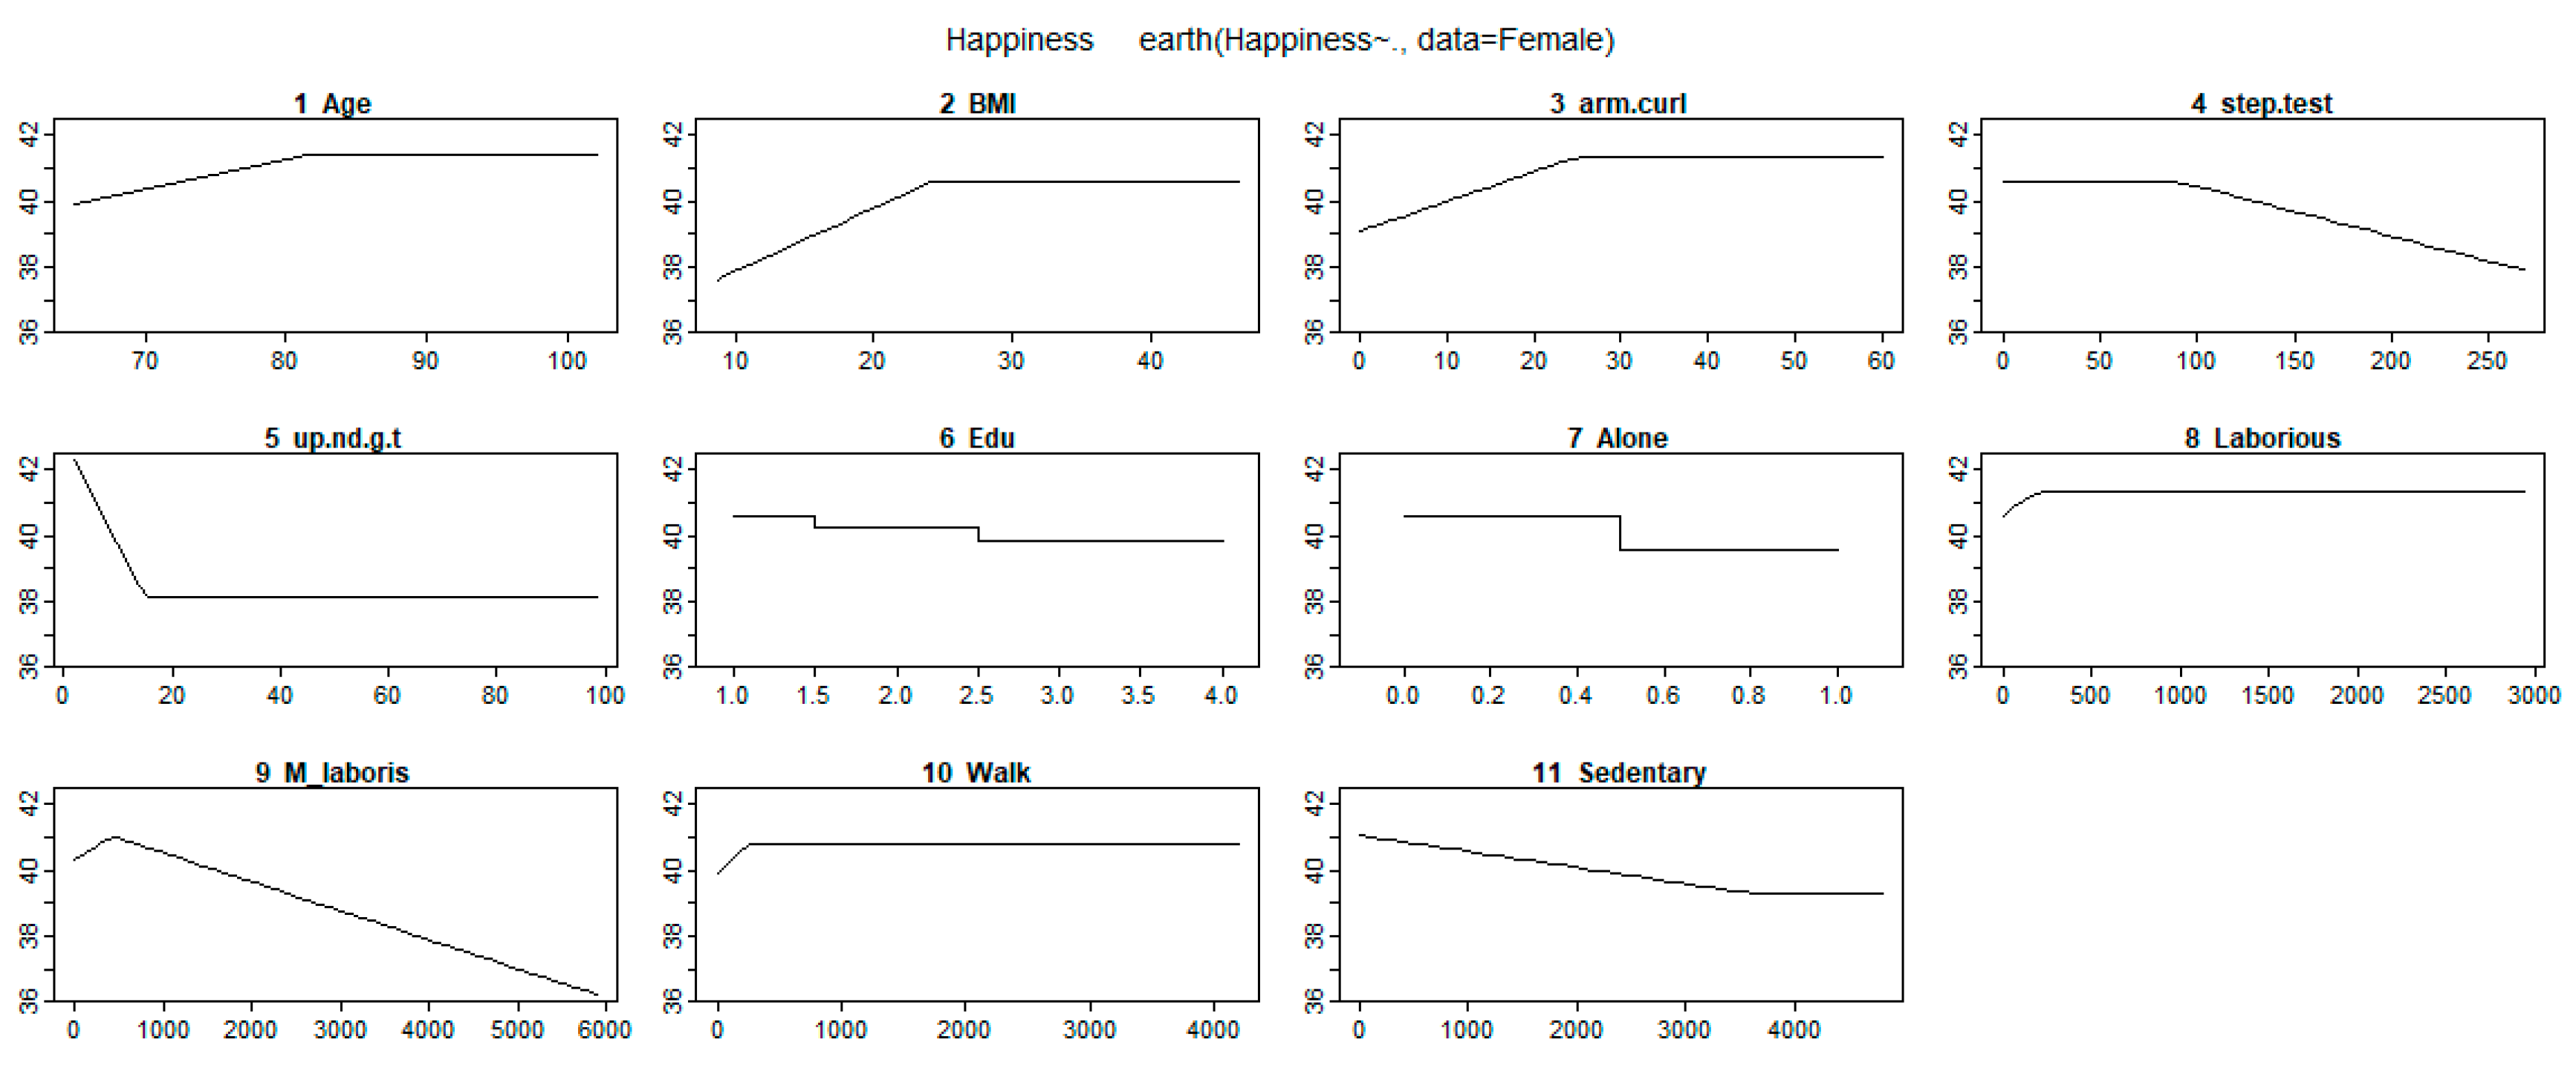
| Variables | Male | Female | ||
|---|---|---|---|---|
| Selected Variable | Coefficient Estimation | Selected Variable | Coefficient Estimation | |
| Intercept | 43.08 | - | 38.92 | |
| Age | Max (0, age-93) | −0.69 | - | - |
| Max (0, 93-age) | −0.11 | Max (0, 82-age) | −0.09 | |
| Living Alone | - | −1.70 | - | −1.04 |
| Education | - | - | - | - |
| - | - | Max (0, 3-Edu) | 0.39 | |
| Income | Max (0, Income-6) | −6.25 | - | - |
| Max (0, 6-Income) | −0.27 | - | - | |
| BMI | - | - | - | |
| Max (0, 28.9-BMI) | −0.11 | Max (0, 24.3-BMI) | −0.19 | |
| Stance with eyes open | - | - | - | |
| Max (0, 9-Single_Legged) | −0.10 | - | - | |
| Chair stand | - | - | - | - |
| Max (0, 18-Chair_Sitting) | −0.08 | - | - | |
| Arm curl | Max (0, Arm_Flexion-7) | 0.04 | - | - |
| - | - | Max (0, 25-Arm_Flexion) | −0.90 | |
| 2-min step | - | - | Max (0, Knees_Up-88) | −0.02 |
| - | - | - | - | |
| Back stretch | Max (0, Scratch-4) | 0.09 | - | - |
| - | - | - | - | |
| Up-and-go | Max (0, Around-13.8) | −0.19 | - | - |
| Max (0, 13.8-Around) | 0.20 | Max (0, 15-Around) | 0.32 | |
| Laborious | - | - | - | - |
| - | - | Max (0, 210-Laborious) | 0.003 | |
| M_laborious | - | - | Max (0, M_laborious-420) | −0.001 |
| - | - | Max (0, 420-M_laborious) | −0.002 | |
| Walk | - | - | - | |
| Max (0, 630-Walk) | −0.002 | Max (0, 270-Walk) | 0.003 | |
| Sedentary | Max (0, Sedentary-450) | −0.001 | - | - |
| - | - | Max (0, 3600-Sedentary) | 0.0005 | |
© 2020 by the authors. Licensee MDPI, Basel, Switzerland. This article is an open access article distributed under the terms and conditions of the Creative Commons Attribution (CC BY) license (http://creativecommons.org/licenses/by/4.0/).
Share and Cite
Lin, Y.-T.; Chen, M.; Ho, C.-C.; Lee, T.-S. Relationships among Leisure Physical Activity, Sedentary Lifestyle, Physical Fitness, and Happiness in Adults 65 Years or Older in Taiwan. Int. J. Environ. Res. Public Health 2020, 17, 5235. https://doi.org/10.3390/ijerph17145235
Lin Y-T, Chen M, Ho C-C, Lee T-S. Relationships among Leisure Physical Activity, Sedentary Lifestyle, Physical Fitness, and Happiness in Adults 65 Years or Older in Taiwan. International Journal of Environmental Research and Public Health. 2020; 17(14):5235. https://doi.org/10.3390/ijerph17145235
Chicago/Turabian StyleLin, Yi-Tien, Mingchih Chen, Chien-Chang Ho, and Tian-Shyug Lee. 2020. "Relationships among Leisure Physical Activity, Sedentary Lifestyle, Physical Fitness, and Happiness in Adults 65 Years or Older in Taiwan" International Journal of Environmental Research and Public Health 17, no. 14: 5235. https://doi.org/10.3390/ijerph17145235
APA StyleLin, Y.-T., Chen, M., Ho, C.-C., & Lee, T.-S. (2020). Relationships among Leisure Physical Activity, Sedentary Lifestyle, Physical Fitness, and Happiness in Adults 65 Years or Older in Taiwan. International Journal of Environmental Research and Public Health, 17(14), 5235. https://doi.org/10.3390/ijerph17145235