The UK Pregnancies Better Eating and Activity Trial (UPBEAT); Pregnancy Outcomes and Health Behaviours by Obesity Class

 , ,
, ,
Abstract
1. Introduction
2. Materials and Methods
2.1. Study Design
2.2. UPBEAT Intervention
2.3. Data Collection
2.4. Outcomes
2.5. Statistical Analysis
3. Results
3.1. Maternal Characteristics
3.2. Dietary and Physical Activity Outcomes
3.3. Maternal and Neonatal Outcomes
4. Discussion
5. Conclusions
Supplementary Materials
Author Contributions
Funding
Conflicts of Interest
References
- Poston, L.; Caleyachetty, R.; Cnattingius, S.; Corvalán, C.; Uauy, R.; Herring, S.; Gillman, M.W. Preconceptional and maternal obesity: Epidemiology and health consequences. Lancet Diabetes Endocrinol. 2016, 4, 1025–1036. [Google Scholar] [CrossRef]
- World Health Organisation. Body Mass Index-BMI. Available online: http://www.euro.who.int/en/health-topics/disease-prevention/nutrition/a-healthy-lifestyle/body-mass-index-bmi (accessed on 19 March 2020).
- National Maternity and Perinatal Audit (NMPA) Team. National Maternity and Perinatal Audit: Clinical Report 2017. Available online: https://www.hqip.org.uk/resource/national-maternity-and-perinatal-audit-clinical-report-2017-2/ (accessed on 19 March 2020).
- Ovesen, P.; Rasmussen, S.; Kesmodel, U. Effect of prepregnancy maternal overweight and obesity on pregnancy outcome. Obstet. Gynecol. 2011, 118, 305–312. [Google Scholar] [CrossRef]
- Fuchs, F.; Senat, M.-V.; Rey, E.; Balayla, J.; Chaillet, N.; Bouyer, J.; Audibert, F. Impact of maternal obesity on the incidence of pregnancy complications in France and Canada. Sci. Rep. 2017, 7. [Google Scholar] [CrossRef]
- Kim, S.Y.; Sharma, A.J.; Sappenfield, W.; Wilson, H.G.; Salihu, H.M. Association of maternal body mass index, excessive weight gain, and gestational diabetes mellitus with large-for-gestational-age births. Obstet. Gynecol. 2014, 123, 737–744. [Google Scholar] [CrossRef] [PubMed]
- Viswanathan, M.; Siega-Riz, A.M.; Moos, M.K.; Deierlein, A.; Mumford, S.; Knaack, J.; Thieda, P.; Lux, L.J.; Lohr, K.N. Outcomes of maternal weight gain. Evid. Rep. Technol. Assess. 2008, 168, 1–223. [Google Scholar]
- Institute of Medicine (US) and National Research Council (US) Committee to Reexamine IOM Pregnancy Weight Guidelines. Determining optimal weight gain. In Weight Gain During Pregnancy: Reexamining the Guidelines; Rasmussen, K.M., Yaktine, A.L., Eds.; National Academies Press: Washington, DC, USA, 2009; pp. 241–259. ISBN 978-0-309-13113-1. [Google Scholar]
- Faucher, M.A.; Barger, M.K. Gestational weight gain in obese women by class of obesity and select maternal/newborn outcomes: A systematic review. Women Birth J. Aust. Coll. Midwives 2015, 28, e70–e79. [Google Scholar] [CrossRef] [PubMed]
- Kiel, D.W.; Dodson, E.A.; Artal, R.; Boehmer, T.K.; Leet, T.L. Gestational weight gain and pregnancy outcomes in obese women: How much is enough? Obstet. Gynecol. 2007, 110, 752–758. [Google Scholar] [CrossRef] [PubMed]
- Thompson, A.M.; Thompson, J.A. An evaluation of whether a gestational weight gain of 5 to 9 kg for obese women optimizes maternal and neonatal health risks. BMC Pregnancy Childbirth 2019, 19, 126. [Google Scholar] [CrossRef] [PubMed]
- Chong, M.F.-F.; Godfrey, K.M.; Gluckman, P.; Tan, K.H.; Shek, L.P.-C.; Meaney, M.; Chan, J.K.Y.; Yap, F.; Lee, Y.S.; Chong, Y.-S. Influences of the perinatal diet on maternal and child health: Insights from the GUSTO study. Proc. Nutr. Soc. 2020, 1–6. [Google Scholar] [CrossRef]
- Moran, L.J.; Sui, Z.; Cramp, C.S.; Dodd, J.M. A decrease in diet quality occurs during pregnancy in overweight and obese women which is maintained post-partum. Int. J. Obes. 2013, 37, 704–711. [Google Scholar] [CrossRef]
- Lindsay, K.; Heneghan, C.; McNulty, B.; Brennan, L.; Mcauliffe, F. Lifestyle and dietary habits of an obese pregnant cohort. Matern. Child Health J. 2014, 19. [Google Scholar] [CrossRef]
- Mohd-Shukri, N.A.; Duncan, A.; Denison, F.C.; Forbes, S.; Walker, B.R.; Norman, J.E.; Reynolds, R.M. Health behaviours during pregnancy in women with very severe obesity. Nutrients 2015, 7, 8431–8443. [Google Scholar] [CrossRef] [PubMed]
- Most, J.; Amant, M.S.; Hsia, D.S.; Altazan, A.D.; Thomas, D.M.; Gilmore, L.A.; Vallo, P.M.; Beyl, R.A.; Ravussin, E.; Redman, L.M. Evidence-based recommendations for energy intake in pregnant women with obesity. J. Clin. Invest. 2019, 130, 4682–4690. [Google Scholar] [CrossRef]
- Flynn, A.C.; Dalrymple, K.; Barr, S.; Poston, L.; Goff, L.M.; Rogozińska, E.; van Poppel, M.N.M.; Rayanagoudar, G.; Yeo, S.; Barakat Carballo, R.; et al. Dietary interventions in overweight and obese pregnant women: A systematic review of the content, delivery, and outcomes of randomized controlled trials. Nutr. Rev. 2016, 74, 312–328. [Google Scholar] [CrossRef] [PubMed]
- Poston, L.; Bell, R.; Croker, H.; Flynn, A.C.; Godfrey, K.M.; Goff, L.; Hayes, L.; Khazaezadeh, N.; Nelson, S.M.; Oteng-Ntim, E.; et al. Effect of a behavioural intervention in obese pregnant women (the UPBEAT Study): A multicentre, randomised controlled trial. Lancet Diabetes Endocrinol. 2015, 3, 767–777. [Google Scholar] [CrossRef]
- Briley, A.L.; Barr, S.; Badger, S.; Bell, R.; Croker, H.; Godfrey, K.M.; Holmes, B.; Kinnunen, T.I.; Nelson, S.M.; Oteng-Ntim, E.; et al. A complex intervention to improve pregnancy outcome in obese women; the UPBEAT randomised controlled trial. BMC Pregnancy Childbirth 2014, 14, 74. [Google Scholar] [CrossRef]
- Bingham, S.A.; Welch, A.A.; McTaggart, A.; Mulligan, A.A.; Runswick, S.A.; Luben, R.; Oakes, S.; Khaw, K.T.; Wareham, N.; Day, N.E. Nutritional methods in the European prospective investigation of cancer in Norfolk. Public Health Nutr. 2001, 4, 847–858. [Google Scholar] [CrossRef]
- Meltzer, H.M.; Brantsaeter, A.L.; Ydersbond, T.A.; Alexander, J.; Haugen, M. Methodological challenges when monitoring the diet of pregnant women in a large study: Experiences from the Norwegian Mother and Child Cohort Study (MoBa). Matern. Child Nutr. 2008, 4, 14–27. [Google Scholar] [CrossRef]
- Ekelund, U.; Neovius, M.; Linné, Y.; Rössner, S. The criterion validity of a last 7-day physical activity questionnaire (SAPAQ) for use in adolescents with a wide variation in body fat: The Stockholm Weight Development Study. Int. J. Obes. 2006, 30, 1019–1021. [Google Scholar] [CrossRef]
- International Association of Diabetes and Pregnancy Study Groups Consensus Panel. International association of diabetes and pregnancy study groups recommendations on the diagnosis and classification of hyperglycemia in pregnancy. Diabetes Care 2010, 33, 676–682. [Google Scholar] [CrossRef]
- International Weight Management in Pregnancy Collaborative Group. Effect of diet and physical activity based interventions in pregnancy on gestational weight gain and pregnancy outcomes: Meta-analysis of individual participant data from randomised trials. BMJ 2017, 358. [Google Scholar] [CrossRef]
- Most, J.; Altazan, A.D.; Hsia, D.S.; Beyl, R.A.; Redman, L.M. Body composition during pregnancy differs by obesity class. Obesity 2020, 28, 268–276. [Google Scholar] [CrossRef]
- Endres, L.K.; Straub, H.; McKinney, C.; Plunkett, B.; Minkovitz, C.S.; Schetter, C.D.; Ramey, S.; Wang, C.; Hobel, C.; Raju, T.; et al. Postpartum weight retention risk factors and relationship to obesity at 1 year. Obstet. Gynecol. 2015, 125, 144–152. [Google Scholar] [CrossRef] [PubMed]
- Knight-Agarwal, C.R.; Williams, L.T.; Davis, D.; Davey, R.; Cochrane, T.; Zhang, H.; Rickwood, P. Association of BMI and interpregnancy BMI change with birth outcomes in an Australian obstetric population: A retrospective cohort study. BMJ Open 2016, 6, e010667. [Google Scholar] [CrossRef] [PubMed]
- Tielemans, M.J.; Garcia, A.H.; Peralta Santos, A.; Bramer, W.M.; Luksa, N.; Luvizotto, M.J.; Moreira, E.; Topi, G.; de Jonge, E.A.L.; Visser, T.L.; et al. Macronutrient composition and gestational weight gain: A systematic review. Am. J. Clin. Nutr. 2016, 103, 83–99. [Google Scholar] [CrossRef]
- Mullaney, L.; O’Higgins, A.C.; Cawley, S.; Doolan, A.; McCartney, D.; Turner, M.J. An estimation of periconceptional under-reporting of dietary energy intake. J. Public Health 2015, 37, 728–736. [Google Scholar] [CrossRef]
- Abbot, J.M.; Thomson, C.A.; Ranger-Moore, J.; Teixeira, P.J.; Lohman, T.G.; Taren, D.L.; Cussler, E.; Going, S.B.; Houtkooper, L.B. Psychosocial and behavioral profile and predictors of self-reported energy underreporting in obese middle-aged women. J. Am. Diet. Assoc. 2008, 108, 114–119. [Google Scholar] [CrossRef]
- National Institute for Health and Care Excellence. Weight Management Before, During and After Pregnancy. Public Health Guideline [PH27]. Available online: https://www.nice.org.uk/guidance/ph27/chapter/1-Recommendations#recommendation-2-pregnant-women (accessed on 19 March 2020).
- Njagu, R.; Adkins, L.; Tucker, A.; Gatta, L.; Brown, H.L.; Reiff, E.; Dotters-Katz, S. Maternal weight gain and neonatal outcomes in women with class III obesity. J. Matern. Fetal. Neonatal. Med. 2020, 1–5. [Google Scholar] [CrossRef]
- Ukah, U.V.; Bayrampour, H.; Sabr, Y.; Razaz, N.; Chan, W.-S.; Lim, K.I.; Lisonkova, S. Association between gestational weight gain and severe adverse birth outcomes in Washington State, US: A population-based retrospective cohort study, 2004–2013. PLoS Med. 2019, 16, e1003009. [Google Scholar] [CrossRef]


| Obesity Class | ||||
|---|---|---|---|---|
| Maternal Characteristics at Study Entry | Class I | Class II | Class III | pc |
| n = 765 (49.2%) | n = 508 (32.6%) | n = 281 (18.1%) | ||
| Age | 30.5 ± 5.5 | 30.6 ± 5.5 | 30.3 ± 5.4 | 0.700 |
| Ethnic origin | ||||
| White | 463 (60.5%) | 332 (65.4%) | 178 (63.4%) | 0.165 |
| Black | 200 (26.1%) | 121 (23.8%) | 80 (28.5%) | |
| Asian | 53 (6.9%) | 27 (5.3%) | 15 (5.3%) | |
| Other | 49 (6.4%) | 28 (5.5%) | 8 (2.9%) | |
| Parity | ||||
| Nulliparous | 343 (44.8%) | 219 (43.1%) | 112 (39.9%) | 0.351 |
| Multiparous | 422 (55.2%) | 289 (56.9%) | 169 (60.1%) | |
| Previous history of | ||||
| gestational diabetes | 14 (3.3%) | 10 (3.5%) | 8 (4.7%) | 0.582 |
| (multiparous only) | ||||
| Index of multiple | ||||
| Deprivation a | ||||
| 1 (least deprived) | 39 (5.1%) | 22 (4.3%) | 4 (1.4%) | 0.026 |
| 5 (most deprived) | 308 (40.4%) | 218 (43.0%) | 144 (51.6%) | |
| Living area | ||||
| Inner city | 470 (61.4%) | 315 (62.0%) | 162 (57.7%) | 0.273 |
| Suburban | 271 (35.4%) | 167 (32.9%) | 107 (38.1%) | |
| Rural | 24 (3.1%) | 26 (5.1%) | 12 (4.3%) | |
| Educational attainment b | ||||
| None/GCSE | 151(19.7%) | 93 (18.3%) | 73 (26.0%) | 0.006 |
| A level | 115 (15.0%) | 84 (16.5%) | 48 (17.1%) | |
| Degree | 333 (43.5%) | 195 (38.4%) | 88 (31.3%) | |
| Vocational qualification | 166 (21.7%) | 136 (26.8%) | 72 (25.6%) | |
| Nutrition | Time Points a | Standard Care | Intervention | Mean Difference (95% CI) | pb | pc | |
|---|---|---|---|---|---|---|---|
| Total energy | Class I | Study entry | 1909.59 ± 614.87 | 1800.08 ± 588.79 | |||
| (Kcal/day) | Post-intervention | 1826.53 ± 544.88 | 1609.32 ± 424.68 | −195.97 (−275.88 to −116.07) | <0.001 | ||
| Late pregnancy | 1822.18 ± 567.35 | 1625.15 ± 525.40 | −151.96 (−257.86 to −46.07) | 0.005 | |||
| Class II | Study entry | 1857.01 ± 588.92 | 1788.87 ± 595.84 | ||||
| Post-intervention | 1767.12 ± 559.40 | 1592.28 ± 435.05 | −221.87 (−334.92 to −108.81) | <0.001 | |||
| Late pregnancy | 1694.79 ± 483.48 | 1533.63 ± 408.87 | −150.41 (−250.38 to −50.44) | 0.003 | |||
| Class III | Study entry | 1741.14 ± 631.59 | 1923.02 ± 622.16 | ||||
| Post-intervention | 1749.47 ± 537.85 | 1801.79 ± 549.32 | 36.24 (−138.29 to 210.77) | 0.682 | |||
| Late pregnancy | 1687.30 ± 511.29 | 1699.41 ± 572.24 | −25.77 (−222.68 to 171.13) | 0.796 | |||
| Interaction (post-intervention) | 0.024 | ||||||
| Glycaemic index | Class I | Study entry | 57.08 ± 4.40 | 56.61 ± 3.90 | |||
| (0–100) | Post-intervention | 57.04 ± 4.11 | 54.07 ± 3.90 | −2.78 (−3.42 to −2.14) | <0.001 | ||
| Late pregnancy | 56.81 ± 4.18 | 54.73 ± 4.02 | −2.12 (−2.83 to −1.41) | <0.001 | |||
| Class II | Study entry | 56.58 ± 4.07 | 56.84 ± 4.08 | ||||
| Post-intervention | 56.91 ± 3.86 | 54.41 ± 3.98 | −2.43 (−3.21 to −1.66) | <0.001 | |||
| Late pregnancy | 56.53 ± 4.02 | 54.12 ± 4.02 | −2.46 (−3.41 to −1.50) | <0.001 | |||
| Class III | Study entry | 56.93 ± 3.35 | 57.13 ± 3.62 | ||||
| Post-intervention | 57.21 ± 3.50 | 54.73 ± 3.97 | −2.29 (−3.36 to −1.21) | <0.001 | |||
| Late pregnancy | 57.32 ± 3.92 | 54.89 ± 4.51 | −2.32 (−3.64 to −1.00) | 0.001 | |||
| Glycaemic load | Class I | Study entry | 146.75 ± 59.03 | 134.43 ± 51.17 | |||
| (per day) | Post-intervention | 135.44 ± 46.19 | 110.49 ± 36.87 | −22.58 (−29.60 to −15.57) | <0.001 | ||
| Late pregnancy | 133.86 ± 50.52 | 133.11 ± 41.92 | −17.06 (−25.96 to −8.16) | <0.001 | |||
| Class II | Study entry | 137.18 ± 50.96 | 133.36 ± 50.97 | ||||
| Post-intervention | 131.07 ± 49.17 | 109.66 ± 38.13 | −24.74 (−34.54 to −14.95) | <0.001 | |||
| Late pregnancy | 122.44 ± 41.64 | 103.38 ± 35.11 | −17.84 (−26.95 to −8.72) | <0.001 | |||
| Class III | Study entry | 130.84 ± 57.76 | 139.16 ± 48.19 | ||||
| Post-intervention | 128.99 ± 46.39 | 121.10 ± 42.80 | −8.96 (−22.96 to 5.05) | 0.208 | |||
| Late pregnancy | 121.16 ± 37.04 | 114.88 ± 46.73 | −9.45 (−24.26 to 5.36) | 0.209 | |||
| Carbohydrate | Class I | Study entry | 50.09 ± 7.61 | 49.26 ± 7.45 | |||
| (% energy) | Post-intervention | 48.63 ± 6.69 | 47.57 ± 7.17 | −0.91 (−2.08 to 0.26) | 0.129 | ||
| Late pregnancy | 48.08 ± 7.07 | 47.67 ± 7.92 | −0.61 (−2.08 to 0.85) | 0.412 | |||
| Class II | Study entry | 48.85 ± 7.55 | 49.17 ± 7.00 | ||||
| Post-intervention | 48.68 ± 6.60 | 47.21 ± 6.94 | −1.66 (−3.06 to −0.25) | 0.021 | |||
| Late pregnancy | 47.80 ± 6.75 | 46.52 ± 7.14 | −0.98 (−2.59 to 0. 62) | 0.230 | |||
| Class III | Study entry | 49.01 ± 6.34 | 47.93 ± 8.01 | ||||
| Post-intervention | 48.30 ± 6.60 | 46.02 ± 7.74 | −2.37 (−4.42 to −0.32) | 0.024 | |||
| Late pregnancy | 47.45 ± 6.66 | 46.00 ± 7.69 | −1.36 (−3.87 to 1.14) | 0.282 | |||
| Protein | Class I | Study entry | 19.36 ± 4.26 | 19.86 ± 4.43 | |||
| (% energy) | Post-intervention | 19.98 ± 4.16 | 21.97 ± 4.45 | 1.78 (1.08 to 2.47) | <0.001 | ||
| Late pregnancy | 20.12 ± 4.53 | 21.57 ± 4.80 | 1.35 (0.50 to 2.20) | 0.002 | |||
| Class II | Study entry | 19.95 ± 4.45 | 20.23 ± 4.44 | ||||
| Post-intervention | 19.96 ± 3.66 | 22.70 ± 4.76 | 2.53 (1.71 to 3.34) | <0.001 | |||
| Late pregnancy | 20.31 ± 3.93 | 23.03 ± 4.43 | 2.08 (1.15 to 3.02) | <0.001 | |||
| Class III | Study entry | 20.02 ± 4.41 | 20.69 ± 4.73 | ||||
| Post-intervention | 20.52 ± 4.30 | 22.85 ± 4.53 | 2.00 (0.74 to 3.25) | 0.002 | |||
| Late pregnancy | 20.60 ± 4.65 | 23.65 ± 4.50 | 2.97 (1.50 to 4.44) | <0.001 | |||
| Total fat | Class I | Study entry | 30.73 ± 5.57 | 30.98 ± 5.30 | |||
| (% energy) | Post-intervention | 31.62 ± 4.87 | 30.44 ± 5.27 | −1.10 (−1.94 to −0.26) | 0.010 | ||
| Late pregnancy | 31.98 ± 5.02 | 30.84 ± 5.65 | −0.96 (−1.98 to 0.05) | 0.061 | |||
| Class II | Study entry | 31.34 ± 5.67 | 30.77 ± 5.05 | ||||
| Post-intervention | 31.51 ± 5.32 | 30.14 ± 5.00 | −1.05 (−2.12 to 0.02) | 0.055 | |||
| Late pregnancy | 32.01 ± 5.07 | 30.47 ± 4.96 | −1.36 (−2.48 to −0.24) | 0.018 | |||
| Class III | Study entry | 31.16 ± 5.02 | 31.57 ± 5.84 | ||||
| Post-intervention | 31.42 ± 5.42 | 31.07 ± 5.60 | 0.01 (−1.57 to 1.59) | 0.992 | |||
| Late pregnancy | 32.09 ± 4.95 | 30.41 ± 5.94 | −1.81 (−3.68 to 0.05) | 0.057 | |||
| Saturated fat | Class I | Study entry | 12.62 ± 3.13 | 12.49 ± 2.93 | |||
| (% energy) | Post-intervention | 13.19 ± 2.85 | 12.12 ± 2.88 | −0.87 (−1.32 to −0.42) | <0.001 | ||
| Late pregnancy | 13.43 ± 2.91 | 12.31 ± 3.01 | −0.75 (−1.30 to −0.21) | 0.007 | |||
| Class II | Study entry | 12.92 ± 2.97 | 12.31 ± 2.69 | ||||
| Post-intervention | 13.19 ± 3.13 | 11.95 ± 2.76 | −1.03 (−1.65 to −0.41) | 0.001 | |||
| Late pregnancy | 13.64 ± 2.91 | 12.08 ± 2.51 | −1.22 (−1.86 to −0.59) | <0.001 | |||
| Class III | Study entry | 12.60 ± 2.95 | 12.69 ± 2.95 | ||||
| Post-intervention | 12.83 ± 2.97 | 12.13 ± 2.82 | −0.53 (−1.36 to 0.31) | 0.213 | |||
| Late pregnancy | 13.40 ± 2.76 | 12.36 ± 3.09 | −1.12 (−2.08 to −0.16) | 0.022 | |||
| Fibre | Class I | Study entry | 13.78 ± 6.27 | 13.30 ± 5.16 | |||
| (g/day) | Post-intervention | 12.64 ± 4.98 | 13.04 ± 4.88 | 0.63 (−0.20 to 1.47) | 0.138 | ||
| Late pregnancy | 12.31 ± 5.61 | 13.19 ± 5.69 | 1.21 (0.13 to 2.30) | 0.028 | |||
| Class II | Study entry | 13.80 ± 6.01 | 12.89 ± 5.50 | ||||
| Post-intervention | 12.63 ± 5.96 | 13.25 ± 5.10 | 0.36 (−0.90 to 1.63) | 0.570 | |||
| Late pregnancy | 12.15 ± 4.41 | 12.77 ± 5.45 | 0.70 (−0.34 to 1.74) | 0.185 | |||
| Class III | Study entry | 12.81 ± 5.22 | 12.94 ± 5.35 | ||||
| Post-intervention | 12.29 ± 4.53 | 14.81 ± 6.89 | 2.42 (0.69 to 4.16) | 0.007 | |||
| Late pregnancy | 11.98 ± 6.34 | 13.43 ± 5.28 | 1.68 (−0.41 to 3.76) | 0.115 | |||
| Physical Activity | Class I | Study entry | 1404 (660–3252) | 1386 (594–3492) | |||
| MET | Post-intervention | 1582.50 (693–4090) | 1989.75 (924–5265) | 0.27 (0.08 to 0.46) | 0.006 | ||
| (min/week) | Late pregnancy | 1386 (495–3413) | 1485 (692.50–3702) | 0.18 (−0.02 to 0.39) | 0.084 | ||
| Class II | Study entry | 1506 (693–5163) | 1386 (604.50–3478.50) | ||||
| Post-intervention | 1559 (685.50–3857.75) | 1788.50 (693–4758.75) | 0.08 (−0.14 to 0.30) | 0.490 | |||
| Late pregnancy | 1432 (660–3375) | 1539 (693–3150) | 0.14 (−0.10 to 0.39) | 0.250 | |||
| Class III | Study entry | 1233 (527.10–3865.50) | 1386 (594–4455) | ||||
| Post-intervention | 1824 (495–5351) | 2190 (986.50–5598) | 0.25 (−0.80 to 0.58) | 0.135 | |||
| Late pregnancy | 1485 (546–5119.50) | 1846.50 (696.50–6021) | 0.25 (−0.14 to 0.64) | 0.209 | |||
| Walking | Class I | Study entry | 280 (125–630) | 280 (140–630) | |||
| (min/week) | Post-intervention | 290 (140–720) | 420 (180–840) | 0.32 (0.14 to 0.51) | 0.001 | ||
| Late pregnancy | 300 (120–630) | 315 (140–750) | 0.22 (0.02 to 0.42) | 0.031 | |||
| Class II | Study entry | 300 (150–840) | 315 (140–630) | ||||
| Post-intervention | 360 (140–840) | 332.50 (150–840) | −0.02 (−0.25 to 0.20) | 0.843 | |||
| Late pregnancy | 300 (140–600) | 360 (140–840) | 0.15 (−0.10 to 0.40) | 0.239 | |||
| Class III | Study entry | 240 (120–840) | 300 (125–840) | ||||
| Post-intervention | 290 (100–1050) | 420 (210–1260) | 0.29 (−0.06 to 0.64) | 0.102 | |||
| Late pregnancy | 280 (100–840) | 420 (187.50–1050) | 0.28 (−0.11 to 0.66) | 0.160 | |||
| Obesity Class | Standard Care | Intervention | Effect of Intervention | pd | pe | ||
|---|---|---|---|---|---|---|---|
| Odds Ratio (95% CI) | Mean Difference (95% CI) | ||||||
| Fasting blood glucose | Class I | 4.64 ± 0.52 n = 320 | 4.59 ± 0.51 n = 330 | −0.05 (−0.13 to 0.03) | 0.260 | ||
| (mmol/L) | Class II | 4.71 ± 0.55 n = 224 | 4.75 ± 0.68 n = 194 | 0.02 (−0.10 to 0.14) | 0.715 | ||
| Class III | 4.87 ± 0.69 n = 121 | 4.84 ± 0.63 n = 116 | −0.03 (−0.20 to 0.15) | 0.760 | |||
| 1 h blood glucose | Class I | 7.84 ± 1.94 n = 301 | 7.69 ± 2.09 n = 306 | −0.14 (−0.45 to 0.18) | 0.391 | ||
| (mmol/L) | Class II | 8.12 ± 2.16 n = 201 | 8.23 ± 2.11 n = 183 | 0.09 (−0.34 to 0.52) | 0.680 | ||
| Class III | 8.37 ± 2.31 n = 108 | 7.93 ± 1.95 n = 104 | −0.44 (−1.03 to 0.15) | 0.145 | |||
| 2 h blood glucose | Class I | 5.83 ± 1.38 n = 320 | 5.86 ± 1.51 n = 330 | 0.06 (−0.16 to 0.28) | 0.590 | ||
| (mmol/L) | Class II | 6.00 ± 1.49 n = 223 | 6.17 ± 1.62 n = 194 | 0.16 (−0.15 to 0.46) | 0.315 | ||
| Class III | 6.15 ± 1.69 n = 121 | 5.92 ± 1.35 n = 115 | −0.20 (−0.59 to 0.20) | 0.332 | |||
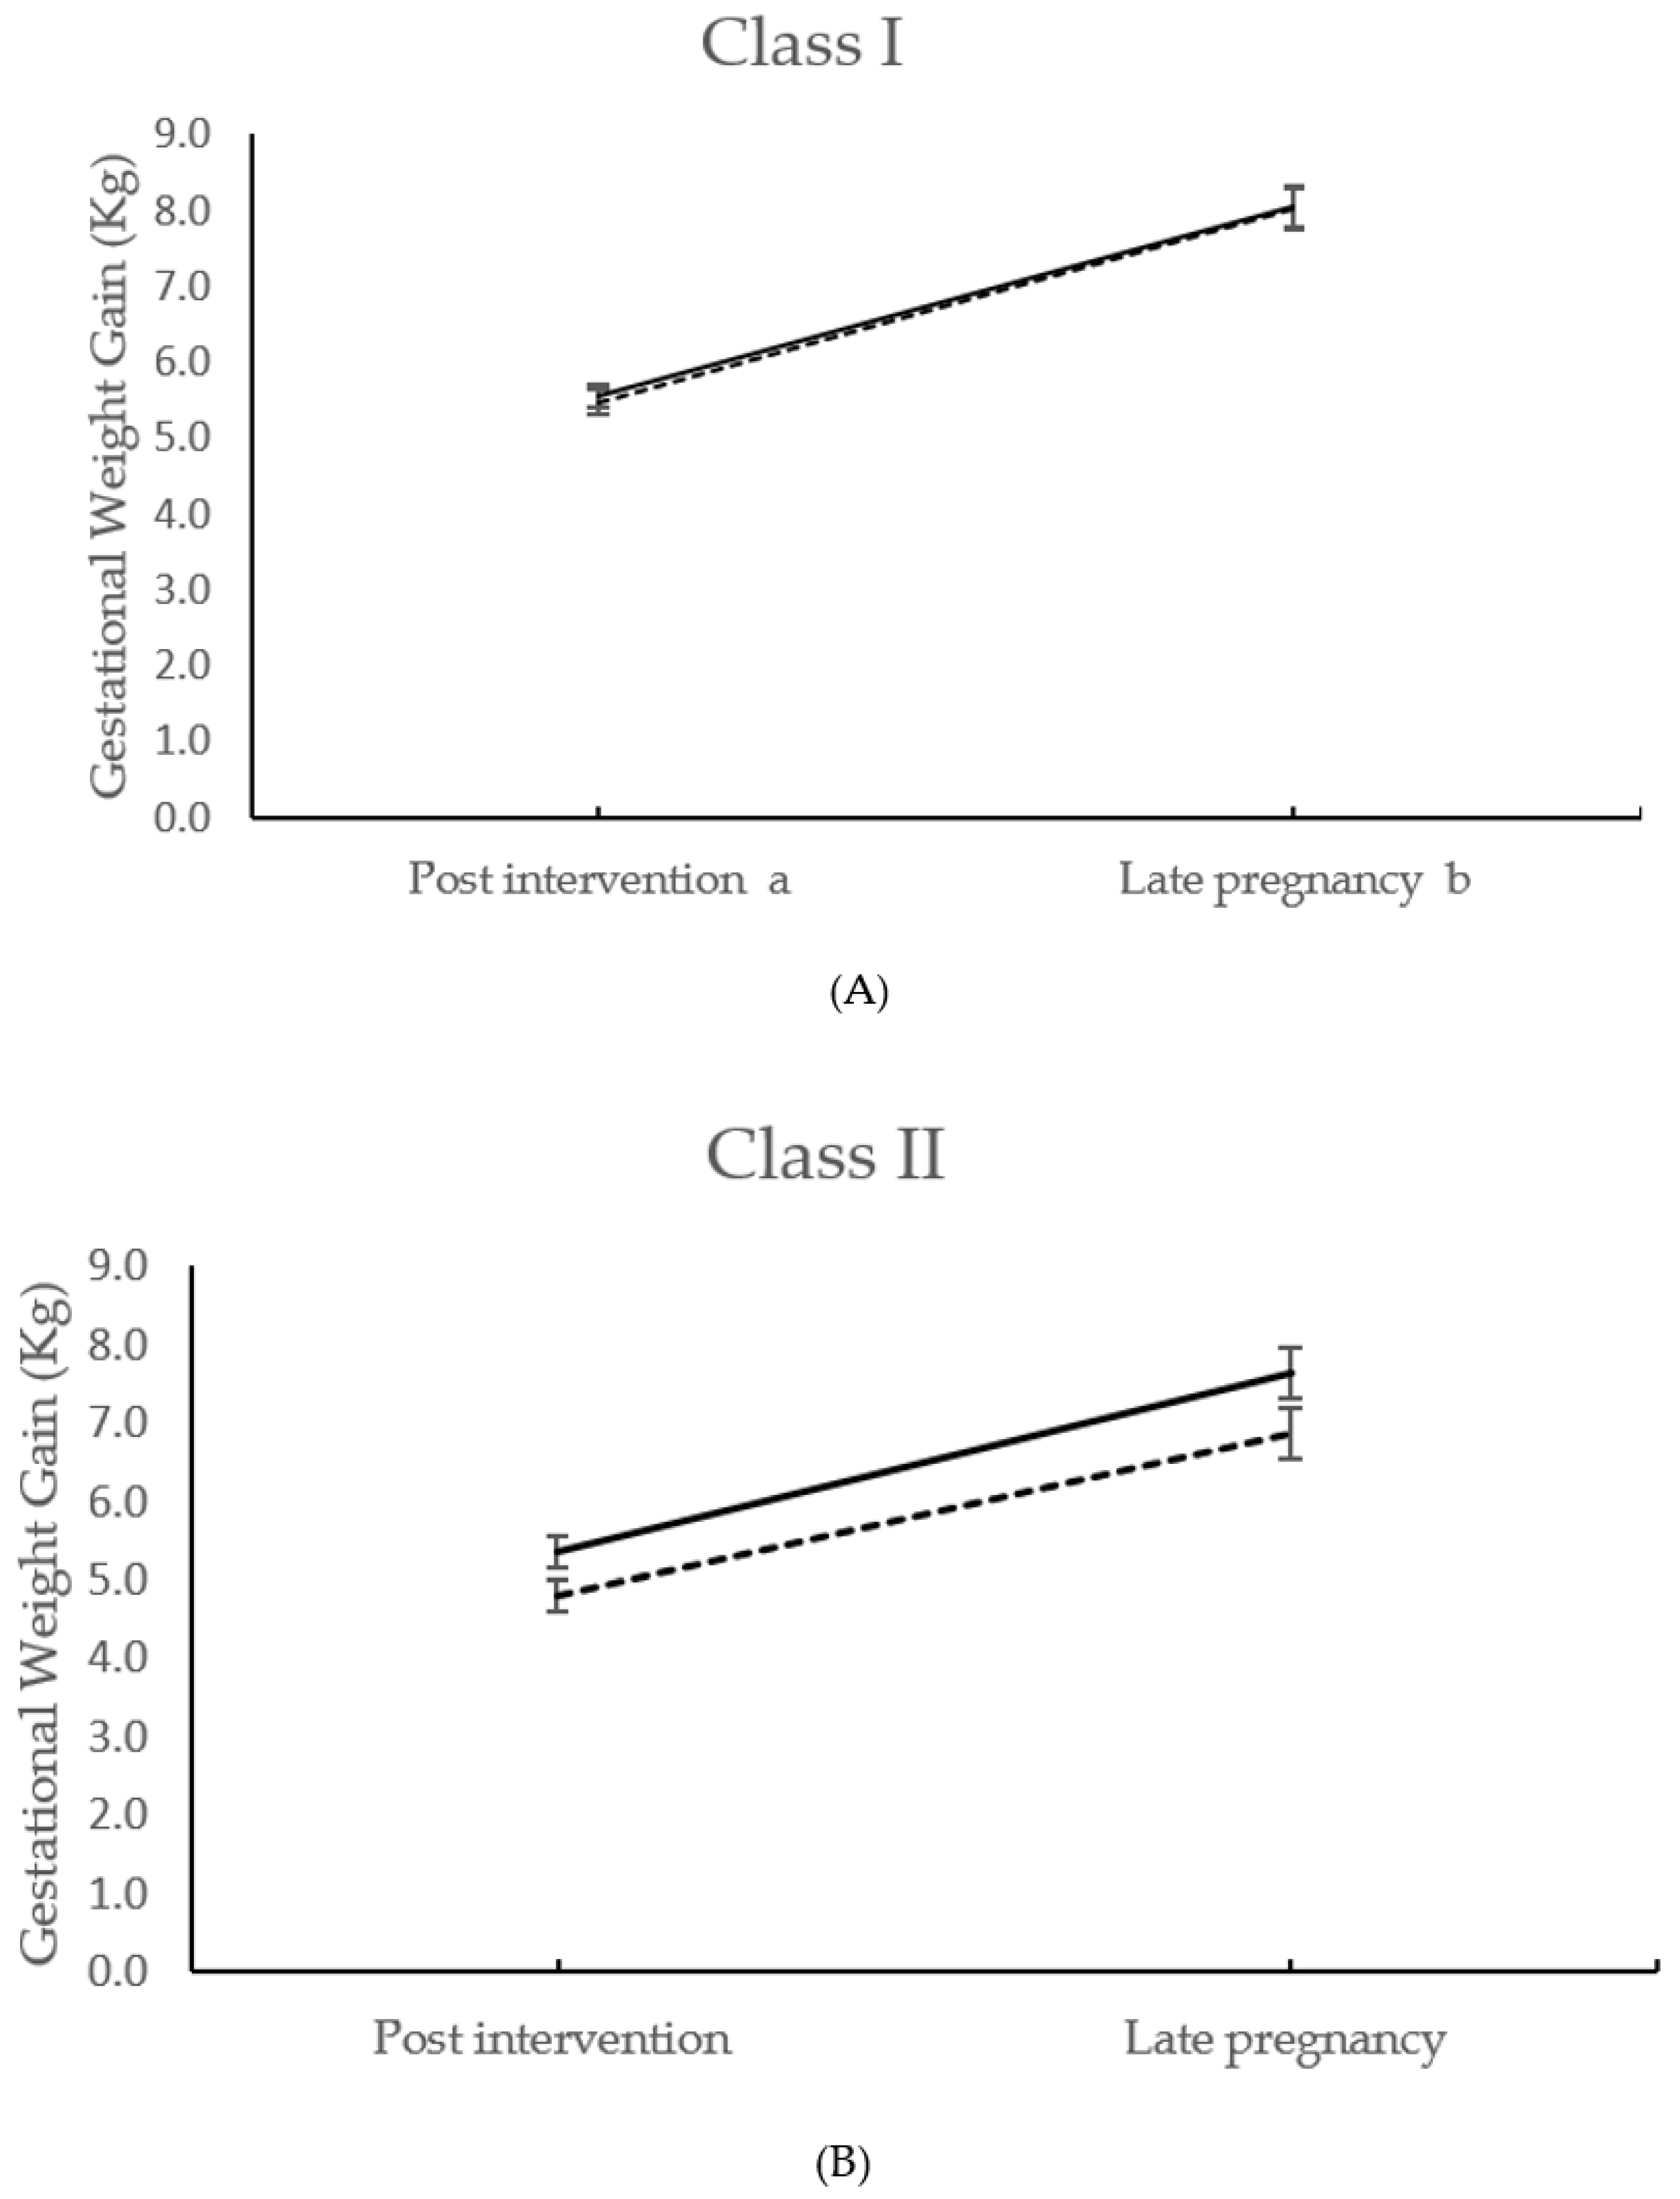
| Gestational weight gain | Class I | 5.55 ± 2.58 n = 318 | 5.47 ± 2.94 n = 328 | −0.07 (−0.49 to 0.36) | 0.757 | ||
| to 27+0–28+6 weeks days | Class II | 5.36 ± 2.93 n = 223 | 4.81 ± 2.80 n = 193 | −0.52 (−1.08 to 0.04) | 0.071 | ||
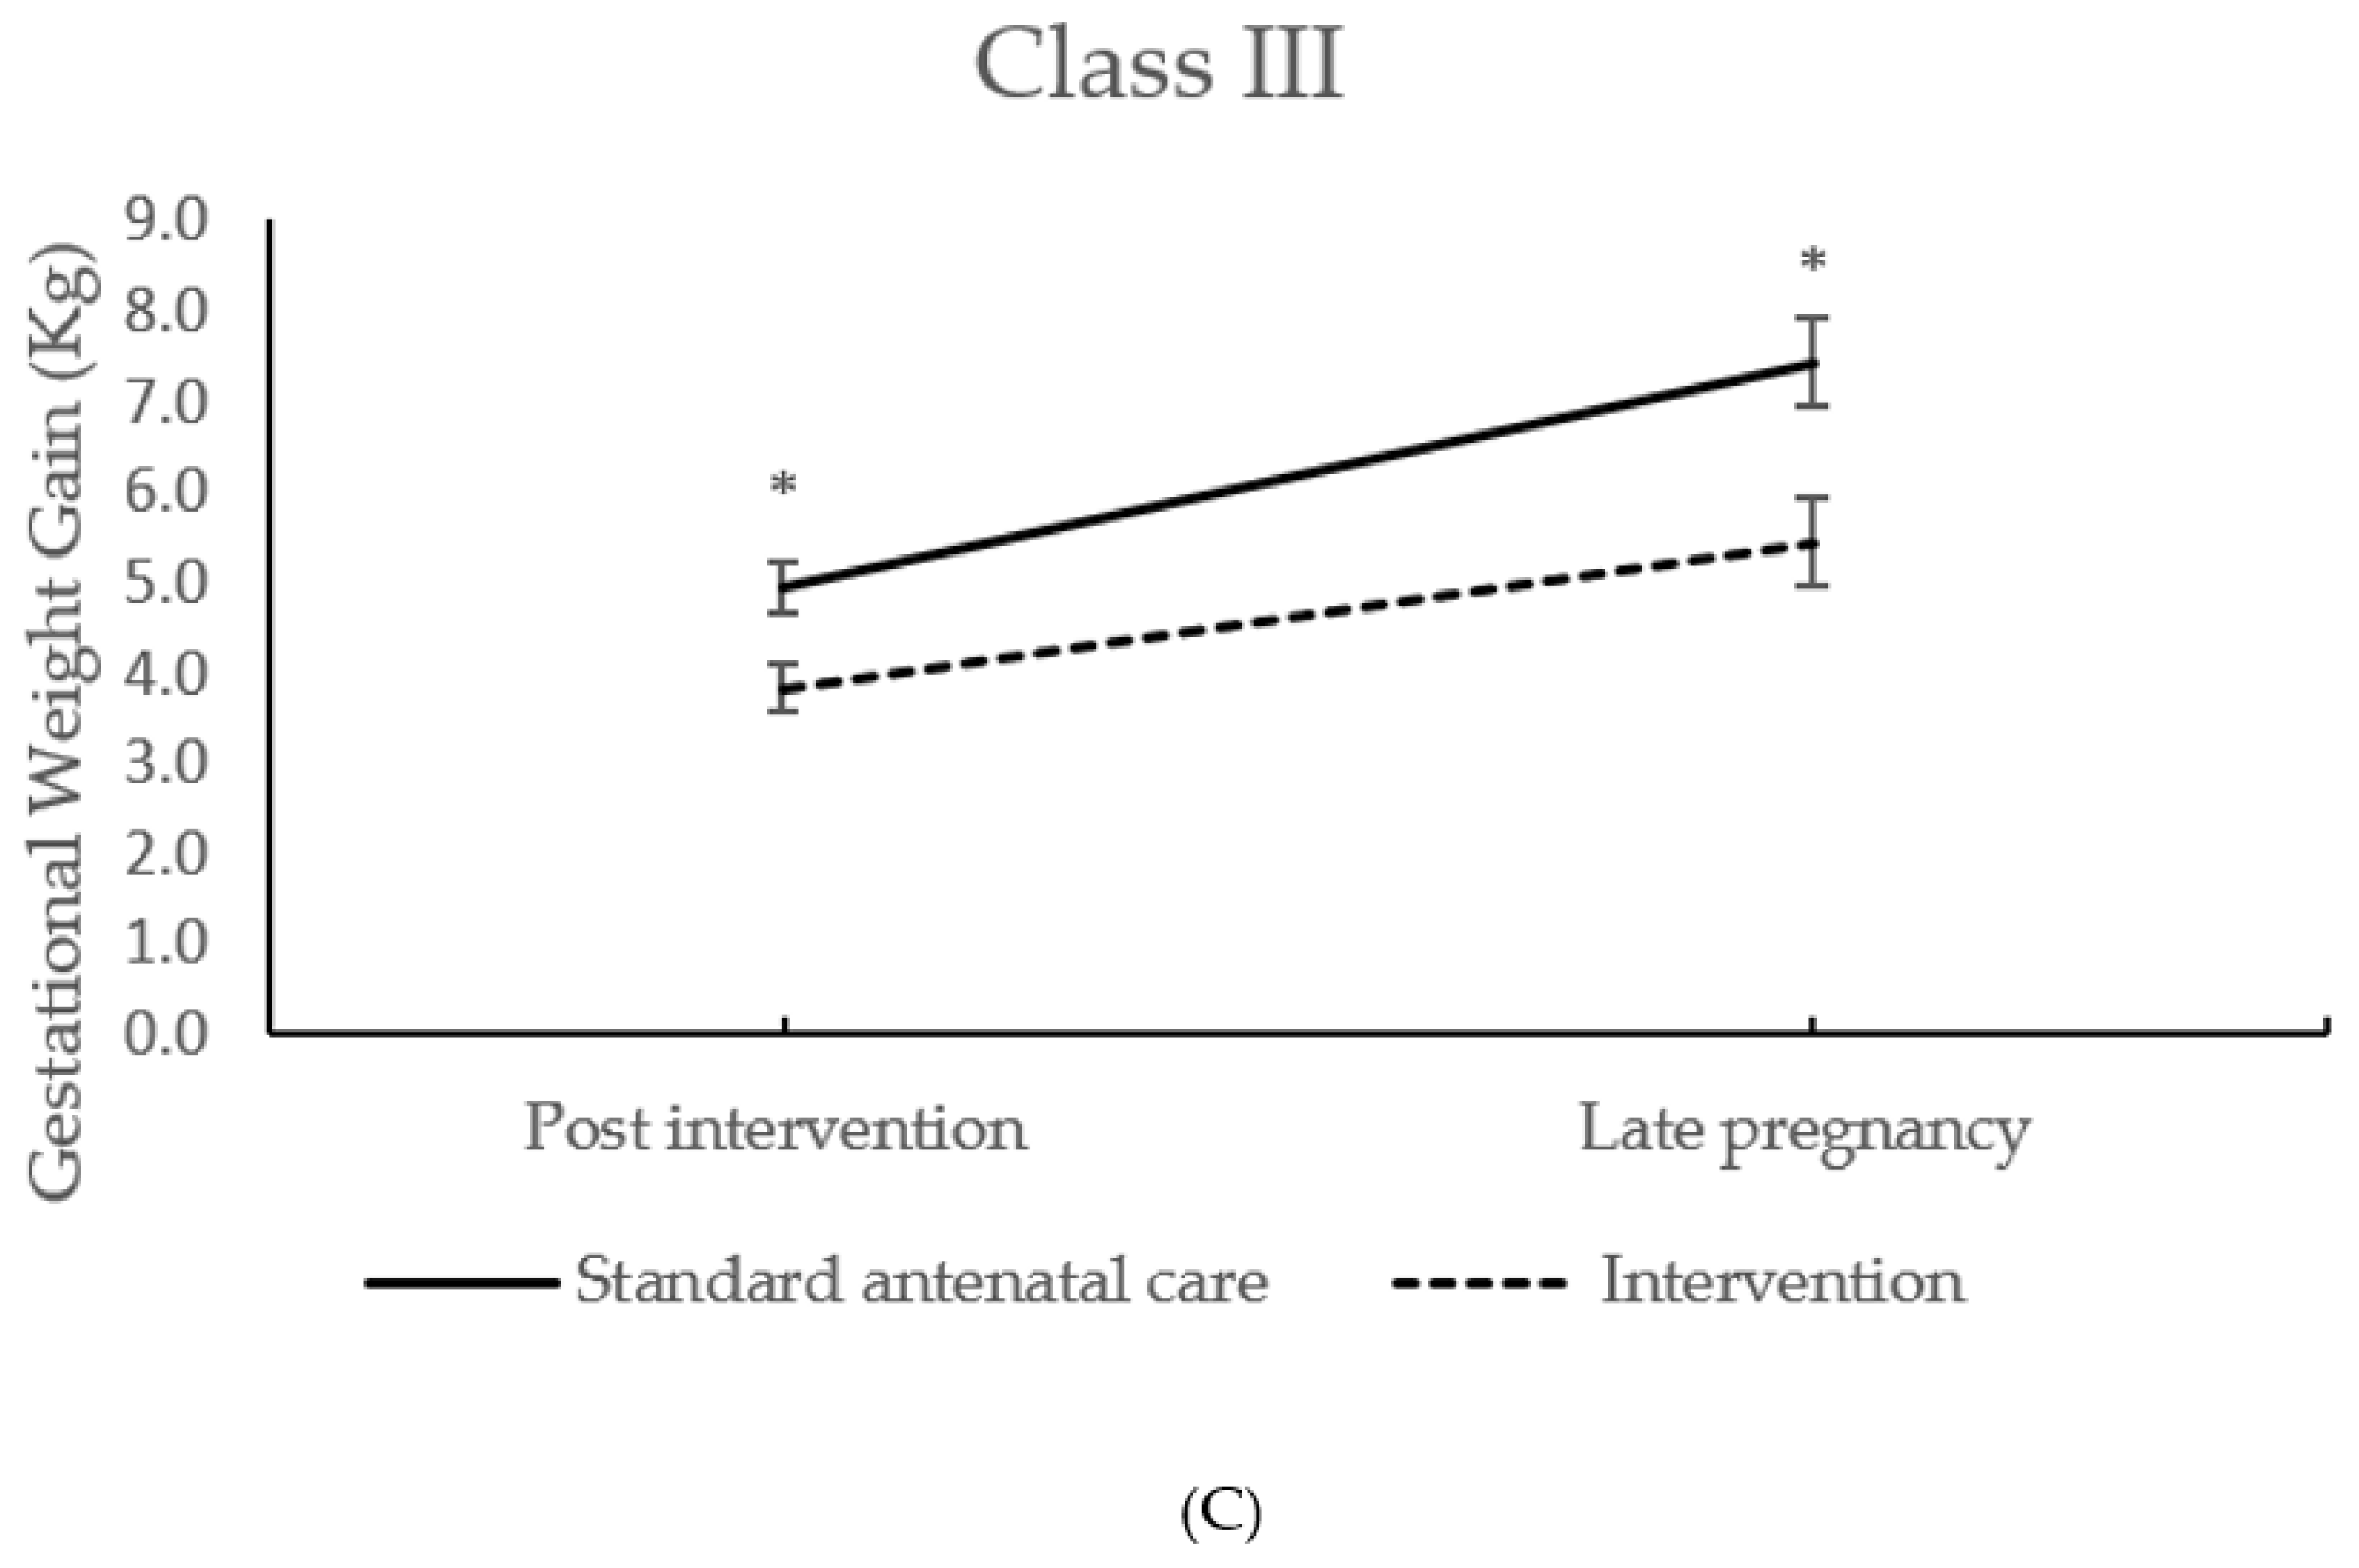
| (kg) | Class III | 4.94 ± 2.95 n = 123 | 3.83 ± 2.81 n = 116 | −1.12 (−1.88 to −0.37) | 0.004 | ||
| Interaction | 0.033 | ||||||
| Gestational weight gain total a (kg) | Class I | 8.04 ± 4.33 n = 277 | 8.03 ± 4.50 n = 265 | −0.11 (−0.84 to 0.61) | 0.762 | ||
| Class II | 7.63 ± 4.44 n = 190 | 6.86 ± 4.24 n = 164 | −0.75 (−1.67 to 0.17) | 0.111 | |||
| Class III | 7.43 ± 4.98 n = 100 | 5.44 ± 4.87 n = 97 | −1.87 (−3.29 to −0.47) | 0.009 | |||
| Interaction | 0.023 | ||||||
| Maternal sum of skinfold thicknesses | Class I | 115.22 ± 21.77 n = 316 | 110.98 ± 20.89 n = 328 | −3.90 (−7.19 to−0.60) | 0.021 | ||
| at 27–28 weeks + 6 days c | Class II | 129.26 ± 21.65 n = 223 | 130.96 ± 23.98 n = 191 | 2.10 (−2.35 to 6.56) | 0.354 | ||
| (mm) | Class III | 152.19 ± 25.92 n = 122 | 148.79 ± 27.75 n = 113 | −3.25 (−10.28 to 3.77) | 0.363 | ||
| Maternal sum of skinfold thicknesses | Class I | 113.85 ± 22.64 n = 274 | 110.04 ± 20.55 n = 263 | −3.10 (−6.77 to 0.57) | 0.098 | ||
| at 34–36 weeks + 0 days c | Class II | 128.05 ± 24.03 n = 188 | 127.57 ± 22.67 n = 162 | −0.52 (−5.45 to 4.42) | 0.837 | ||
| (mm) | Class III | 149.52 ± 25.63 n = 99 | 144.57 ± 25.42 n = 95 | −4.54 (−12.03 to 2.96) | 0.234 | ||
| Gestational diabetes b | Class I | 67/320 (21%) | 63/330 (19%) | 0.92 (0.62 to 1.38) | 0.699 | ||
| Class II | 60/224 (27%) | 65/194 (34%) | 1.32 (0.85 to 2.04) | 0.216 | |||
| Class III | 48/121 (40%) | 35/116 (30%) | 0.65 (0.37 to 1.15) | 0.141 | |||
| Pre-eclampsia | Class I | 10/362 (3%) | 14/375 (4%) | 1.46 (0.63 to 3.36) | 0.379 | ||
| Class II | 7/256 (3%) | 8/239 (3%) | 1.34 (0.46 to 3.92) | 0.592 | |||
| Class III | 10/134 (7%) | 5/141 (4%) | 0.39 (0.12 to 1.31) | 0.128 | |||
| Caesarean section | Class I | 123/370 (33%) | 134/380 (35%) | 1.07 (0.78 to 1.46) | 0.690 | ||
| Class II | 80/253 (32%) | 72/240 (30%) | 0.91 (0.61 to 1.35) | 0.623 | |||
| Class III | 71/134 (53%) | 64/143 (45%) | 0.70 (0.43 to 1.15) | 0.160 | |||
| Large for gestational age ≥ 90th | Class I | 25/370 (7%) | 38/380 (10%) | 1.50 (0.88 to 2.56) | 0.140 | ||
| (customised birthweight centiles) | Class II | 17/253 (7%) | 18/240 (8%) | 1.12 (0.55 to 2.28) | 0.746 | ||
| Class III | 20/134 (15%) | 15/143 (10%) | 0.69 (0.33 to 1.44) | 0.324 | |||
| Small for gestational age ≤ 10th | Class I | 33/370 (9%) | 53/380 (14%) | 1.70 (1.06 to 2.71) | 0.026 | ||
| (customised birthweight centiles) | Class II | 28/253 (11%) | 29/240 (12%) | 1.15 (0.65 to 2.03) | 0.627 | ||
| Class III | 18/134 (13%) | 15/143 (10%) | 0.79 (0.37 to 1.67) | 0.529 | |||
| Birthweight ≥ 4.0(kg) | Class I | 50/370 (14%) | 59/380 (16%) | 1.20 (0.79 to 1.82) | 0.396 | ||
| Class II | 32/253 (13%) | 27/240 (11%) | 0.88 (0.50 to 1.54) | 0.656 | |||
| Class III | 23/134 (17%) | 19/143 (13%) | 0.68 (0.34 to 1.36) | 0.282 | |||
© 2020 by the authors. Licensee MDPI, Basel, Switzerland. This article is an open access article distributed under the terms and conditions of the Creative Commons Attribution (CC BY) license (http://creativecommons.org/licenses/by/4.0/).
Share and Cite
Peacock, L.; Seed, P.T.; Dalrymple, K.V.; White, S.L.; Poston, L.; Flynn, A.C. The UK Pregnancies Better Eating and Activity Trial (UPBEAT); Pregnancy Outcomes and Health Behaviours by Obesity Class. Int. J. Environ. Res. Public Health 2020, 17, 4712. https://doi.org/10.3390/ijerph17134712
Peacock L, Seed PT, Dalrymple KV, White SL, Poston L, Flynn AC. The UK Pregnancies Better Eating and Activity Trial (UPBEAT); Pregnancy Outcomes and Health Behaviours by Obesity Class. International Journal of Environmental Research and Public Health. 2020; 17(13):4712. https://doi.org/10.3390/ijerph17134712
Chicago/Turabian StylePeacock, Lucy, Paul T. Seed, Kathryn V. Dalrymple, Sara L. White, Lucilla Poston, and Angela C. Flynn. 2020. "The UK Pregnancies Better Eating and Activity Trial (UPBEAT); Pregnancy Outcomes and Health Behaviours by Obesity Class" International Journal of Environmental Research and Public Health 17, no. 13: 4712. https://doi.org/10.3390/ijerph17134712
APA StylePeacock, L., Seed, P. T., Dalrymple, K. V., White, S. L., Poston, L., & Flynn, A. C. (2020). The UK Pregnancies Better Eating and Activity Trial (UPBEAT); Pregnancy Outcomes and Health Behaviours by Obesity Class. International Journal of Environmental Research and Public Health, 17(13), 4712. https://doi.org/10.3390/ijerph17134712