Statistical and Network-Based Analysis of Italian COVID-19 Data: Communities Detection and Temporal Evolution


Abstract
1. Introduction
2. Analysis Pipeline
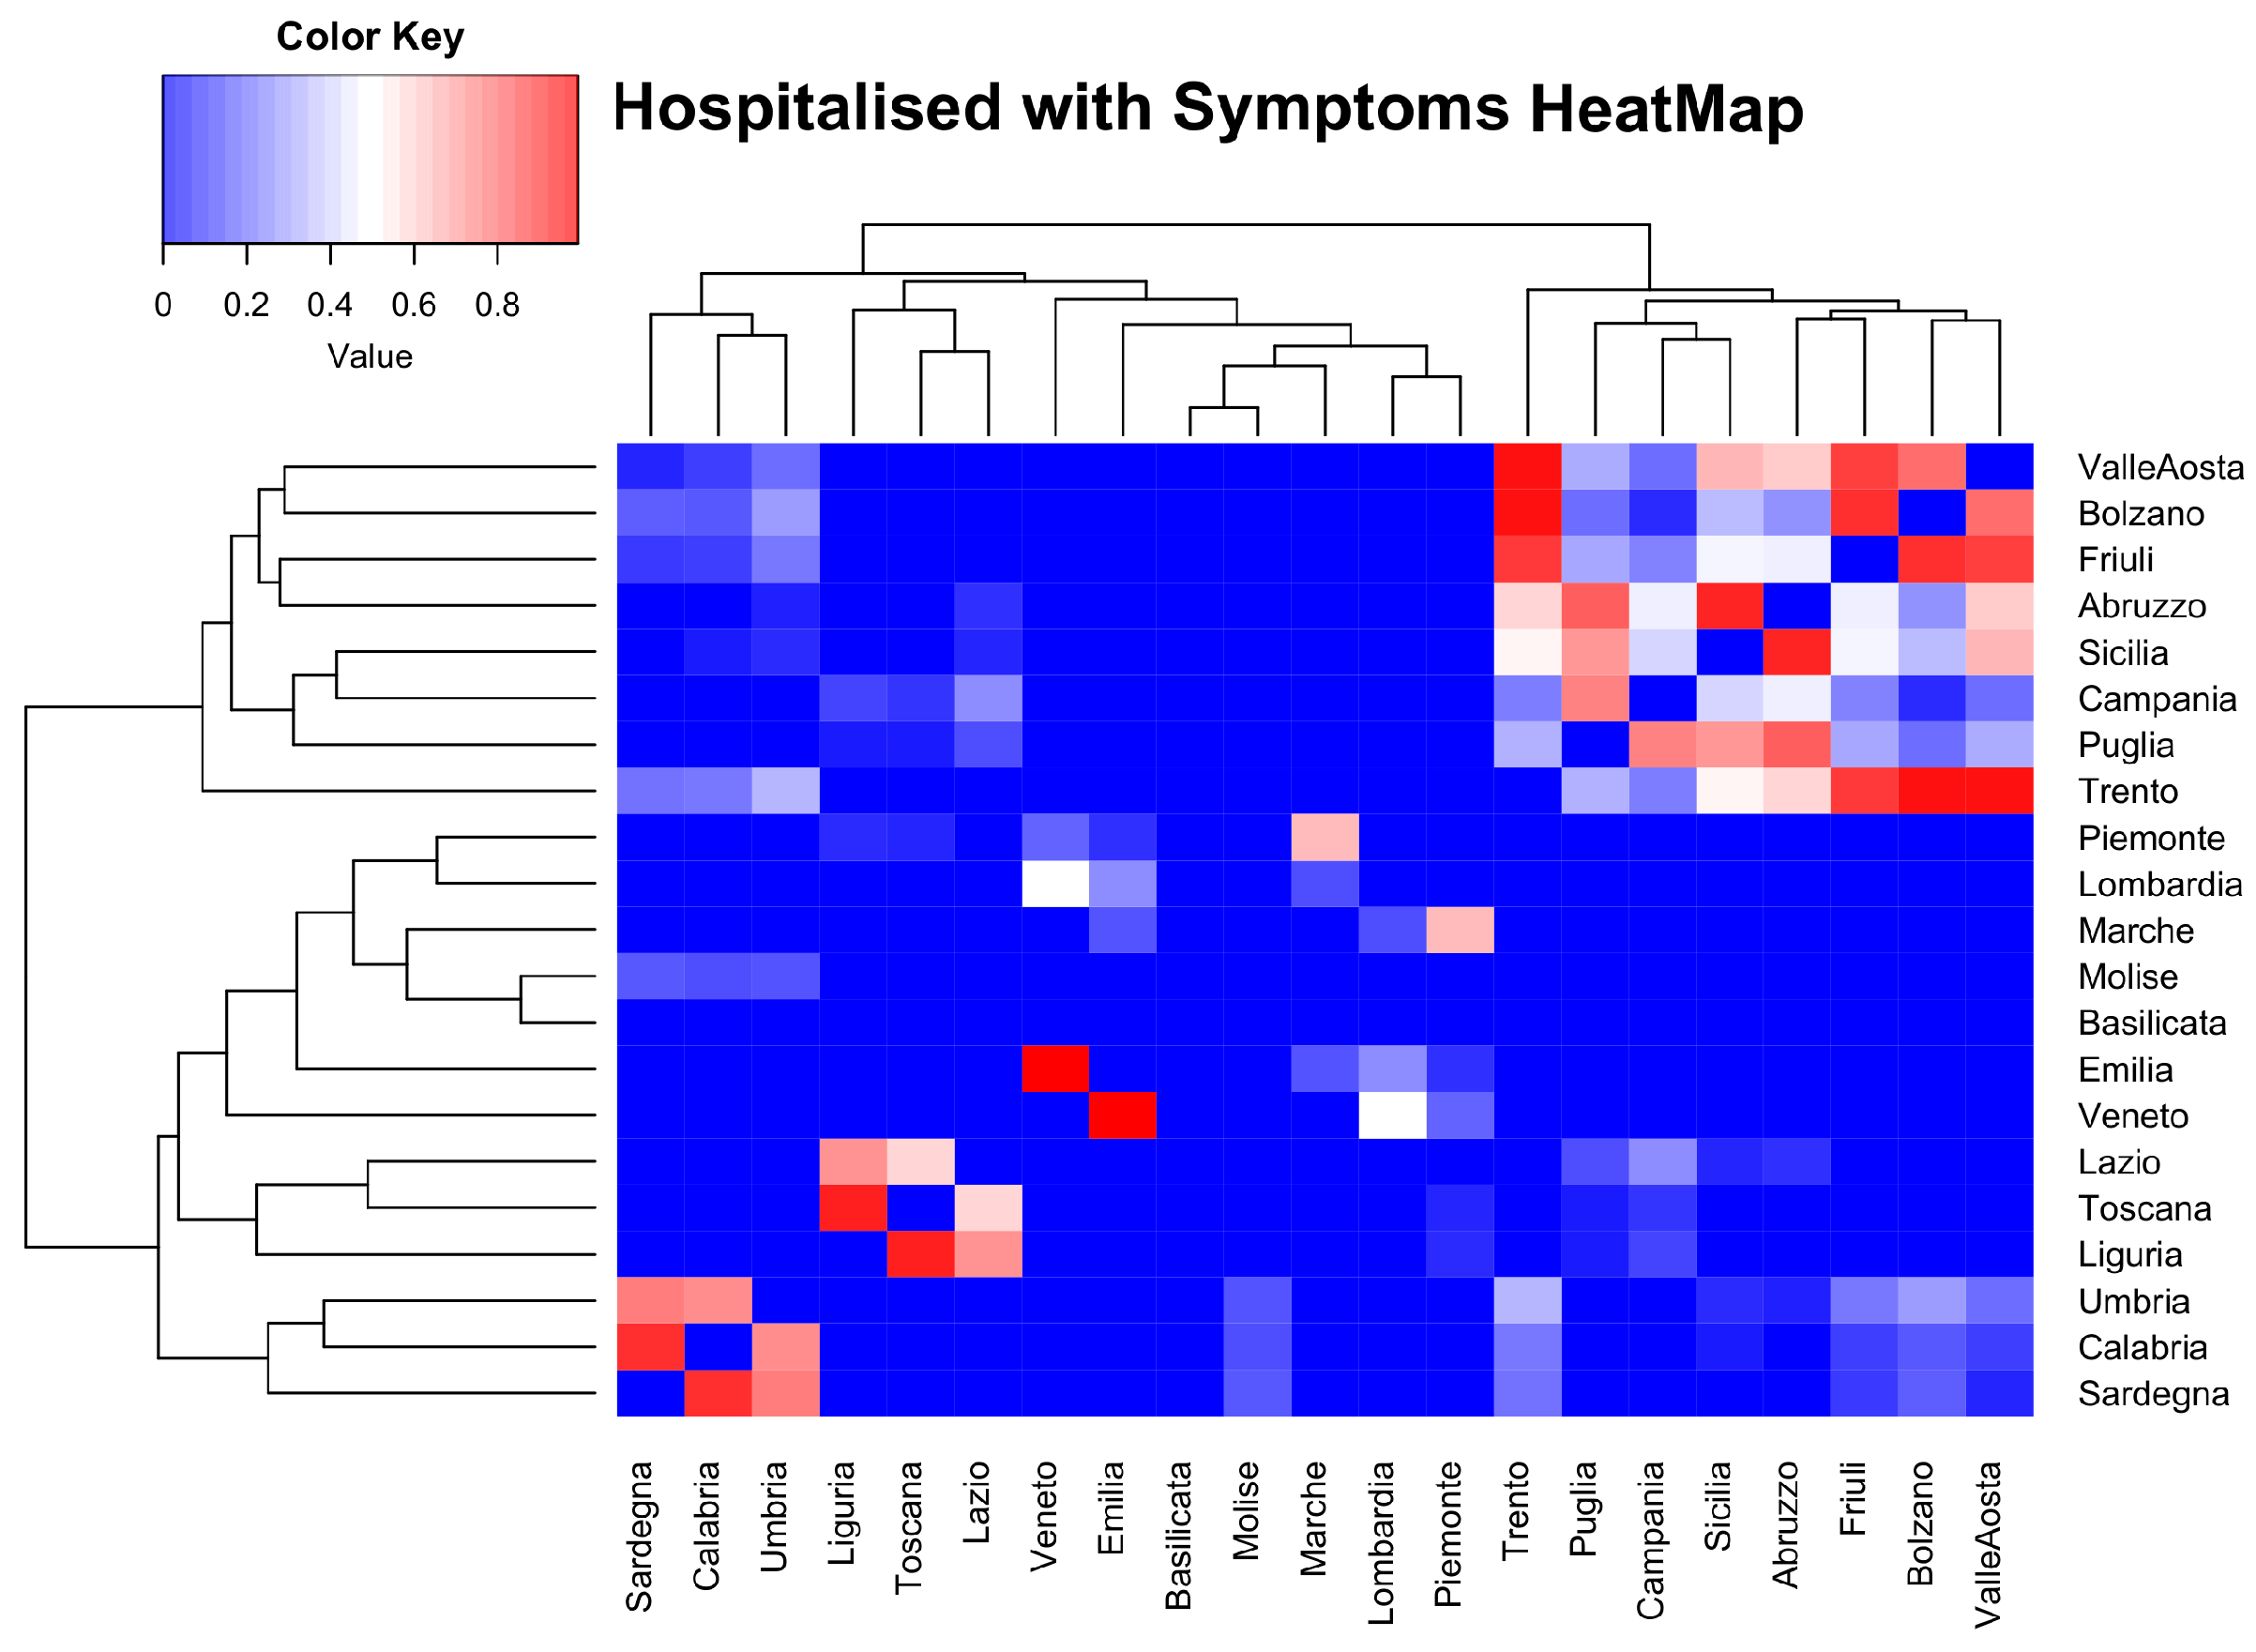
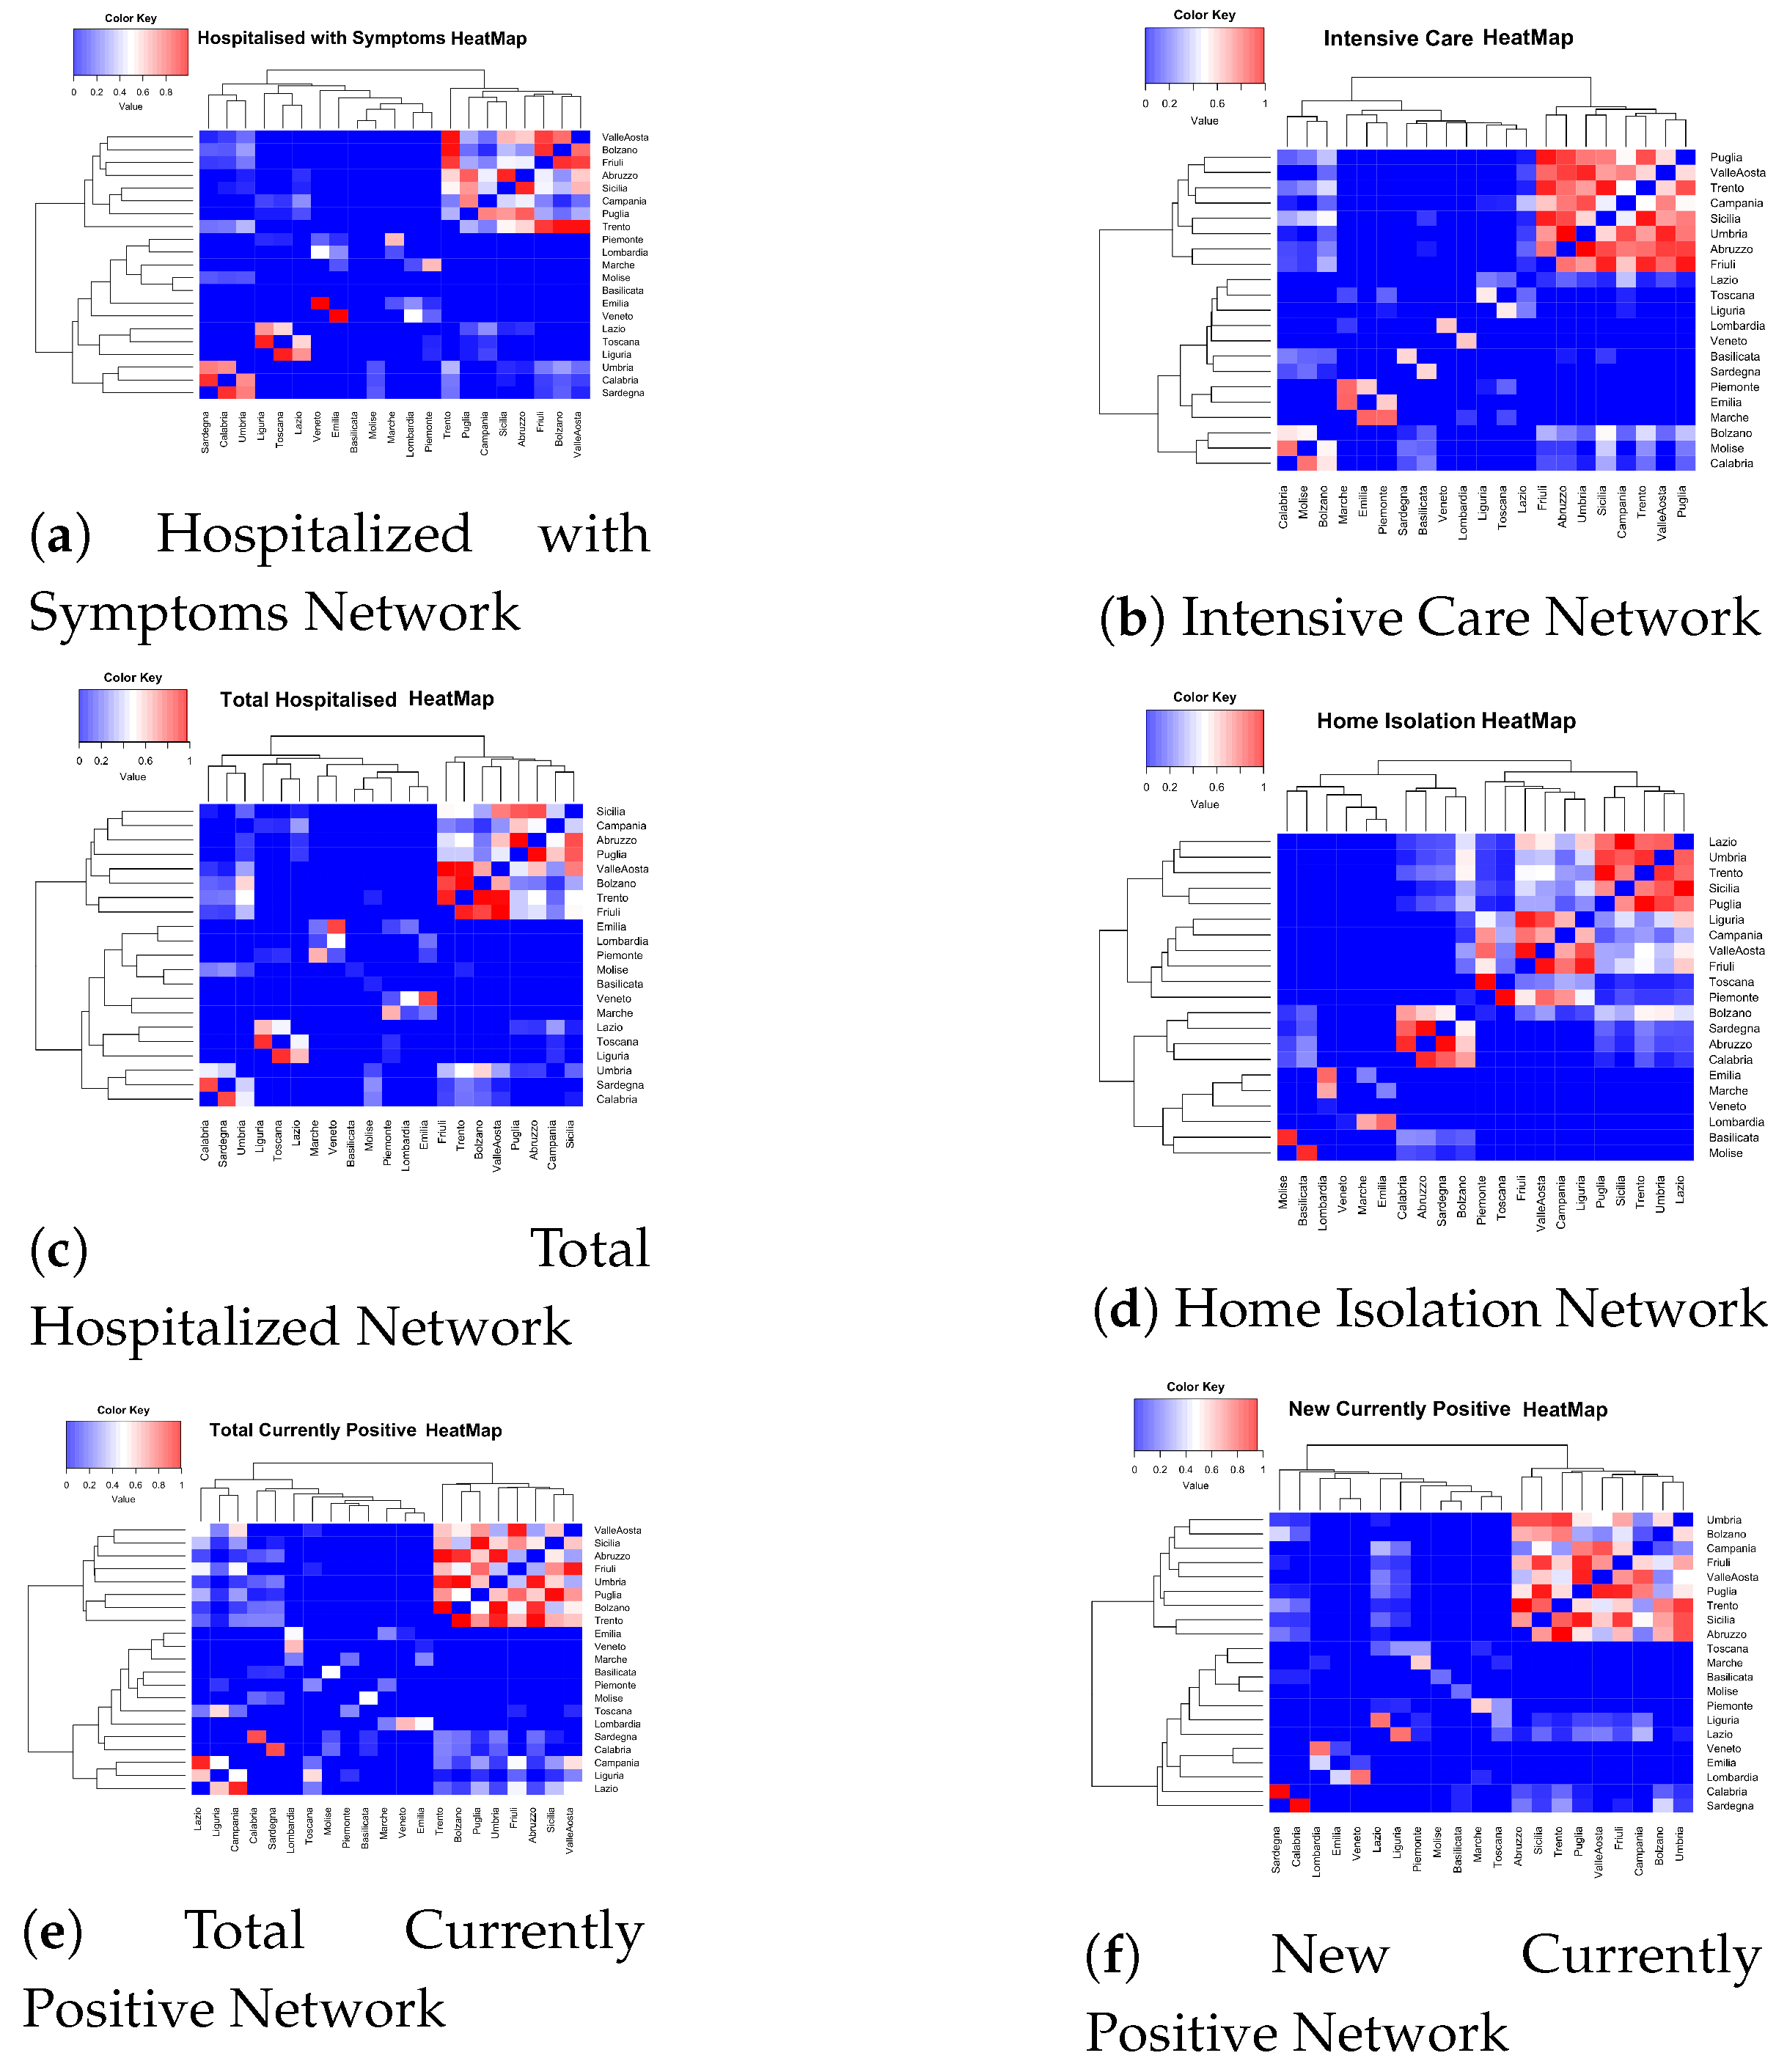
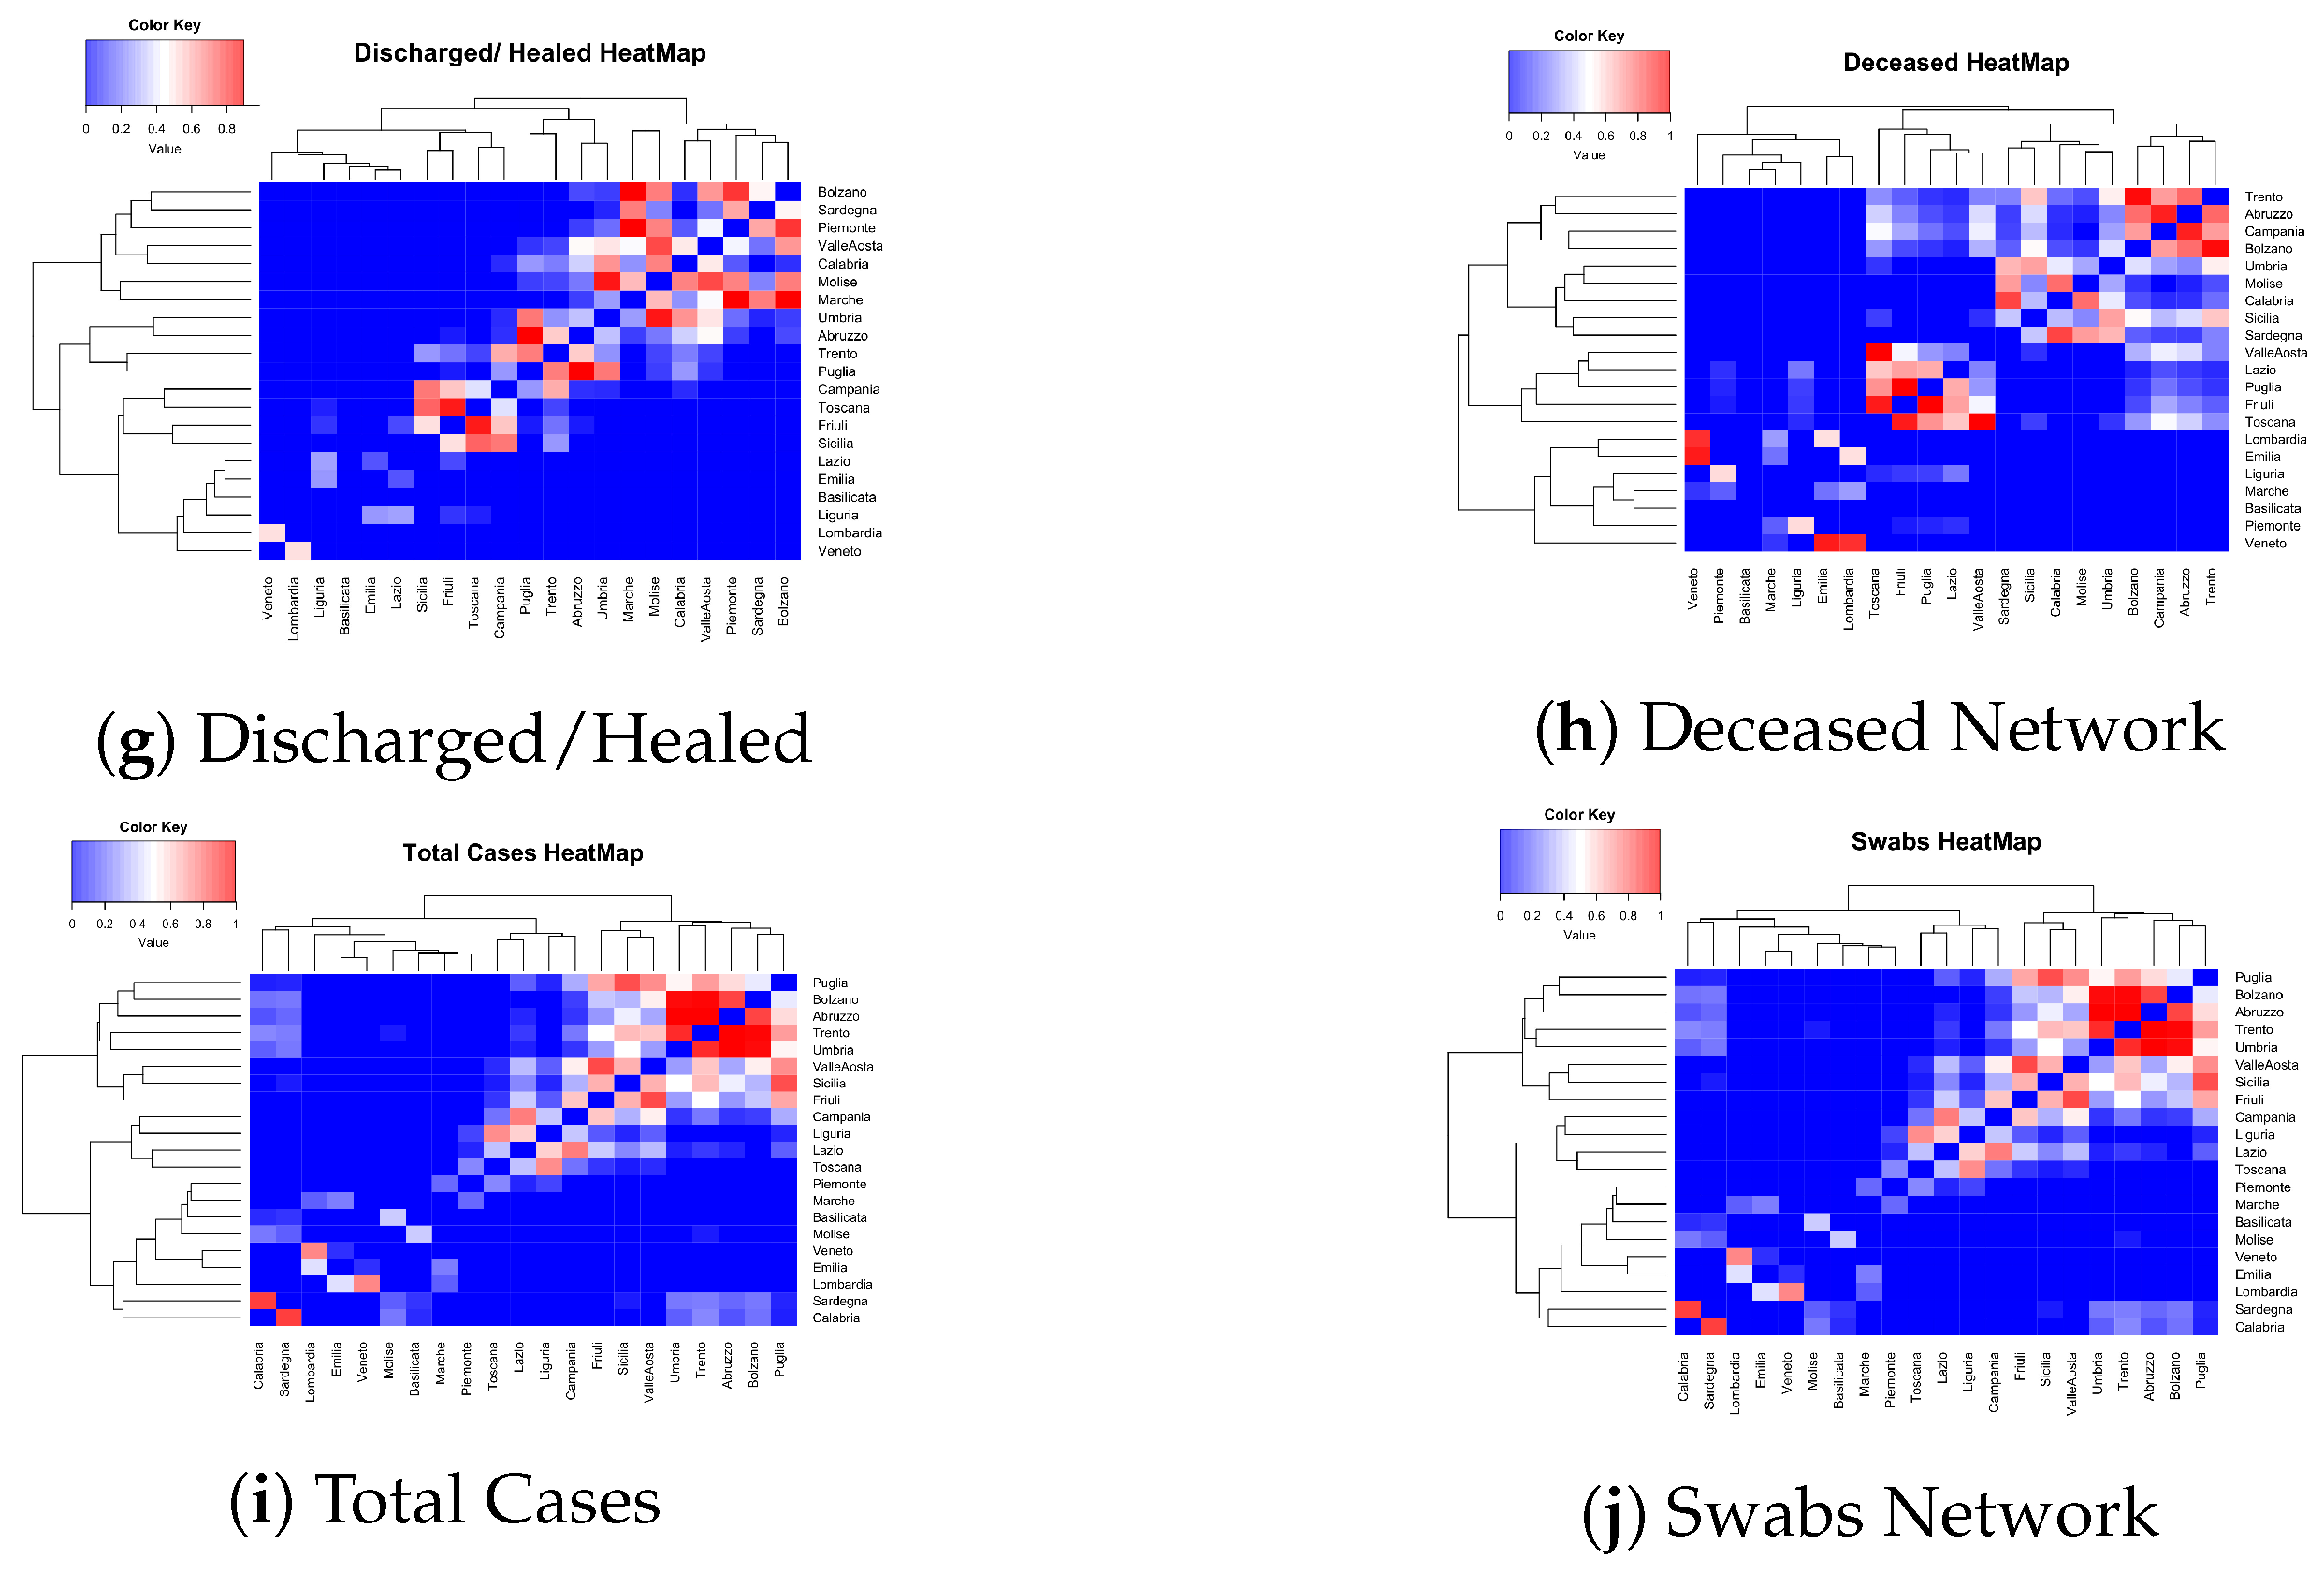
- Building of a similarity matrix. The first step consists of the building of a similarity matrix that records the similarity among a pair of regions with respect to an Italian COVID-19 data measure. The similarity is computed by applying a statistical test. We decided to use the Wilcoxon Sum Rank Test. Therefore, the (i, j) value of the matrix for data k (e.g., swab data) represents the p-value of the Wilcoxon statistical test obtained by performing the test on the swab measures of region i with respect to region j. Lower p-value means that regions are more dissimilar with respect to that measure. Higher p-value means that regions are more similar with respect to that measure. We used the usual significance threshold of 0.05, thus matrices report only p-vales ≥ 0.05, while p-values < 0.05 are mapped to zero.
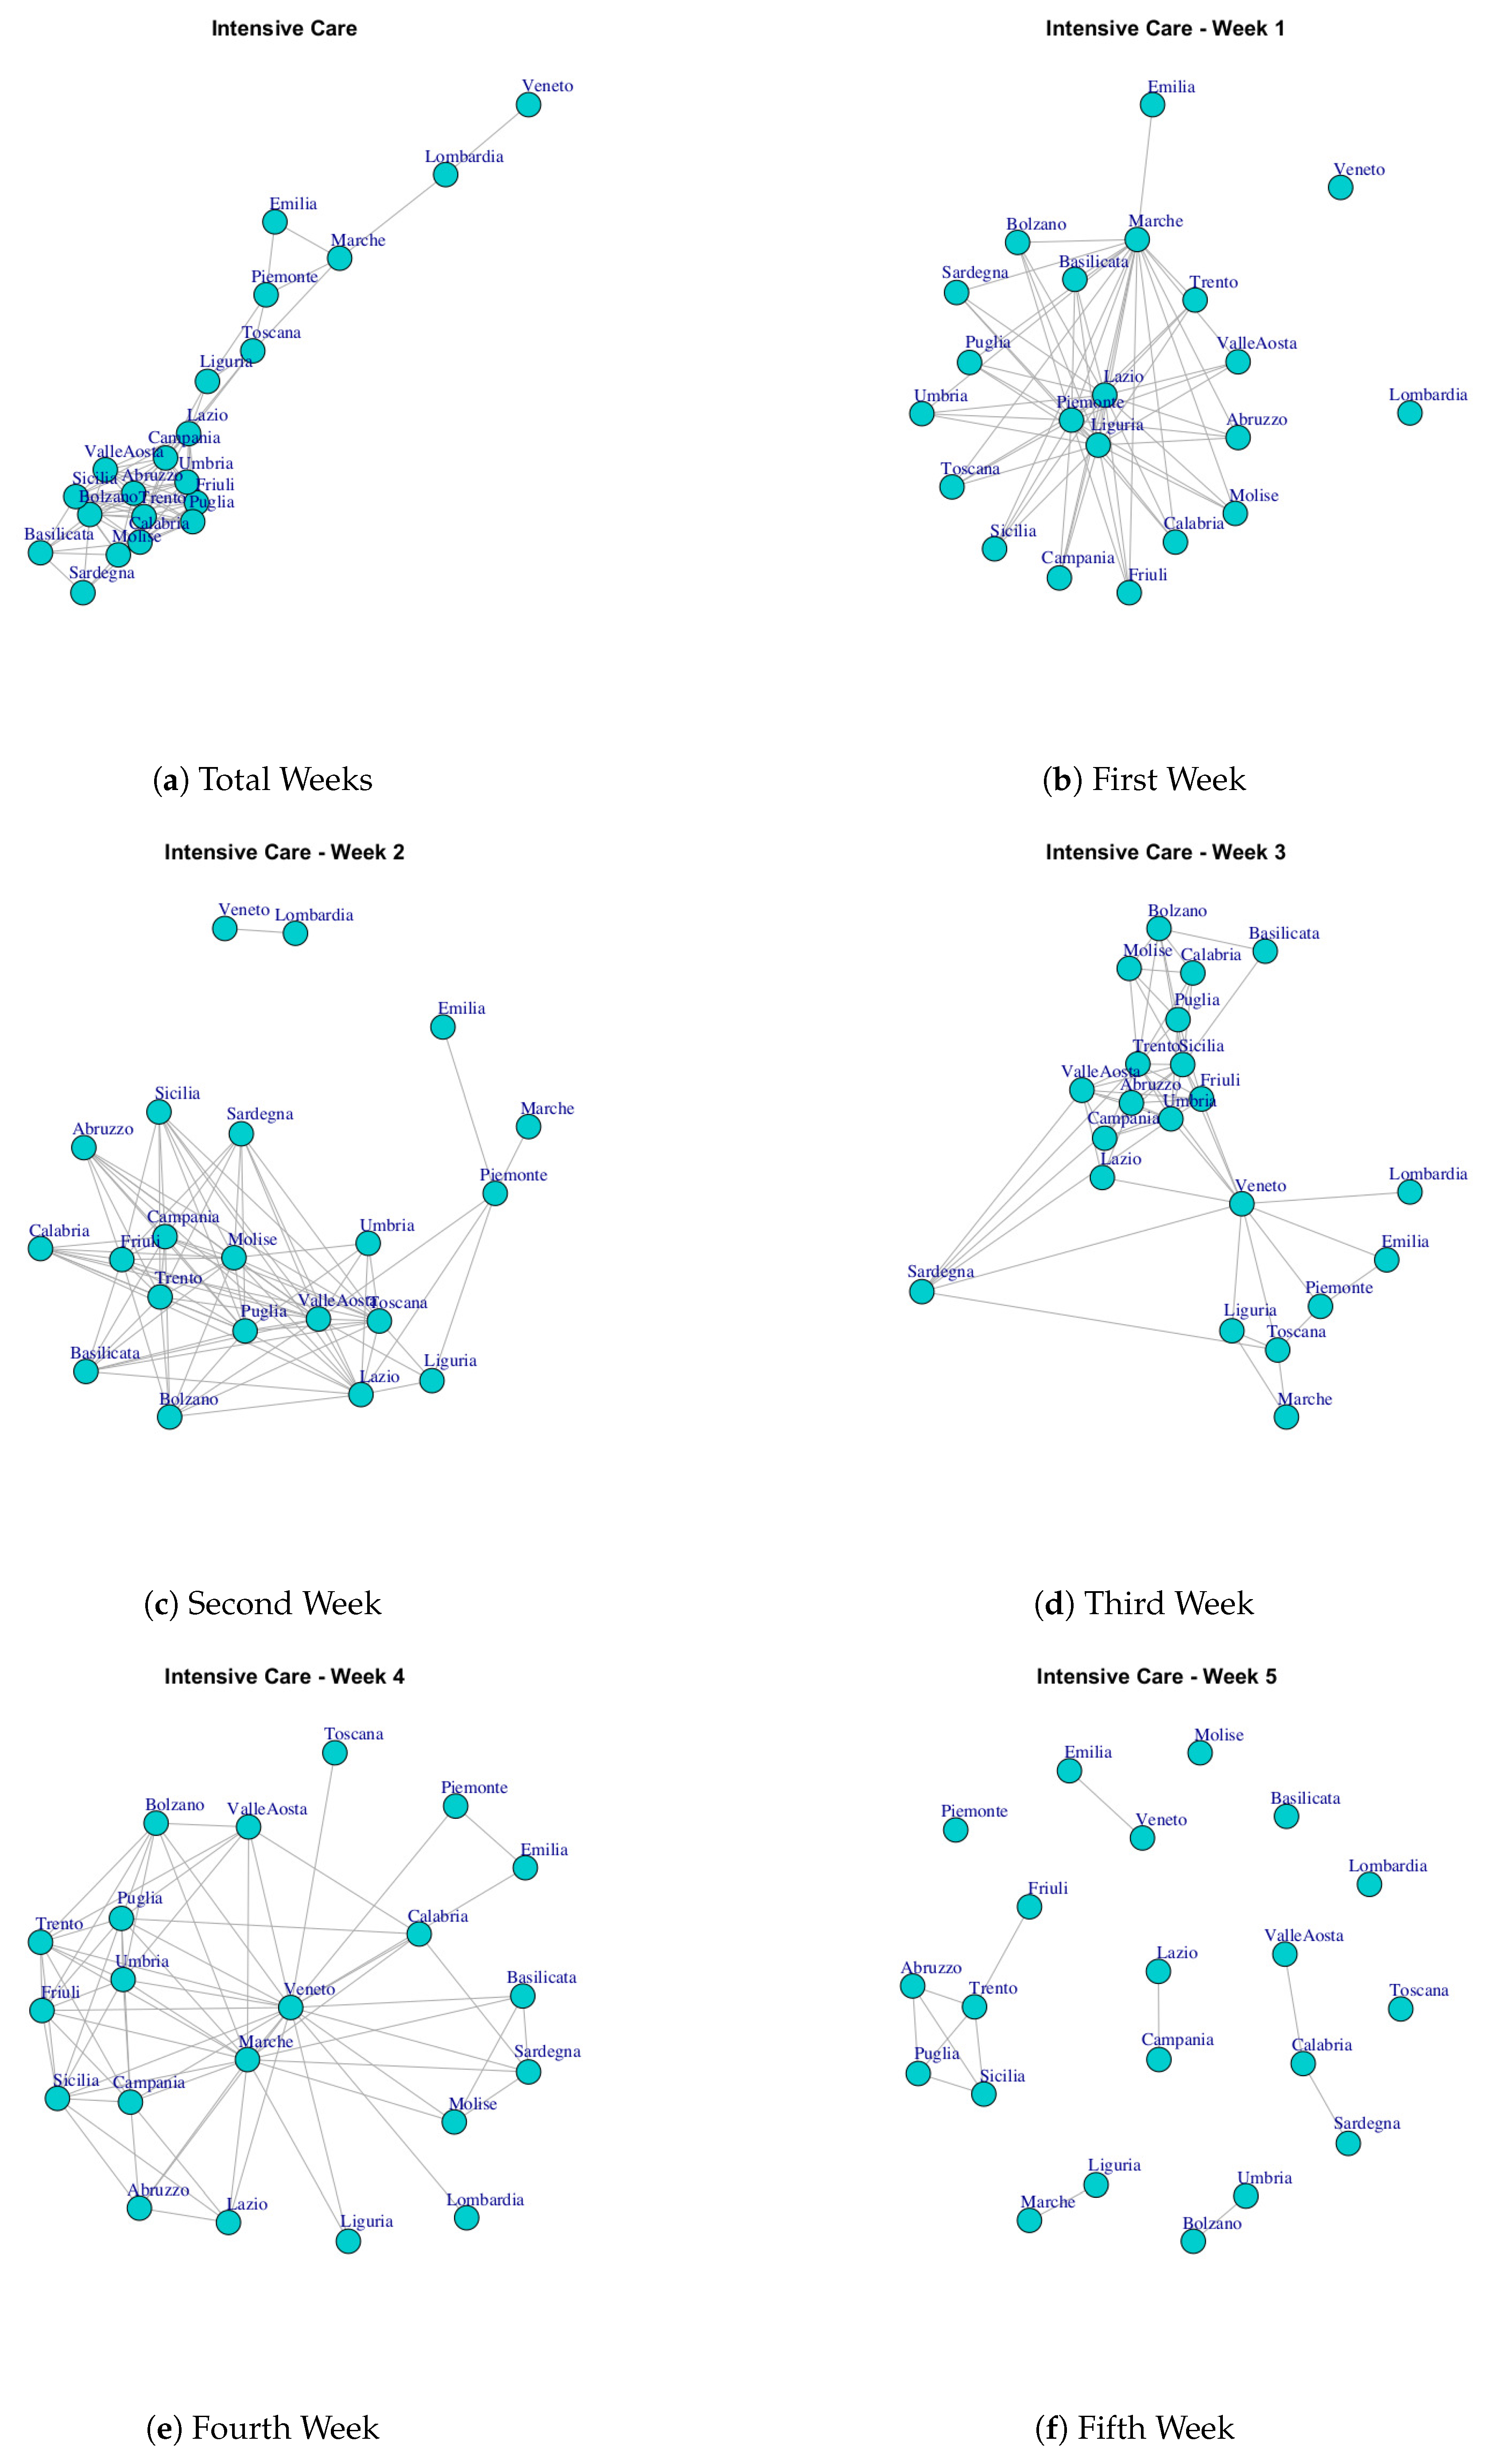
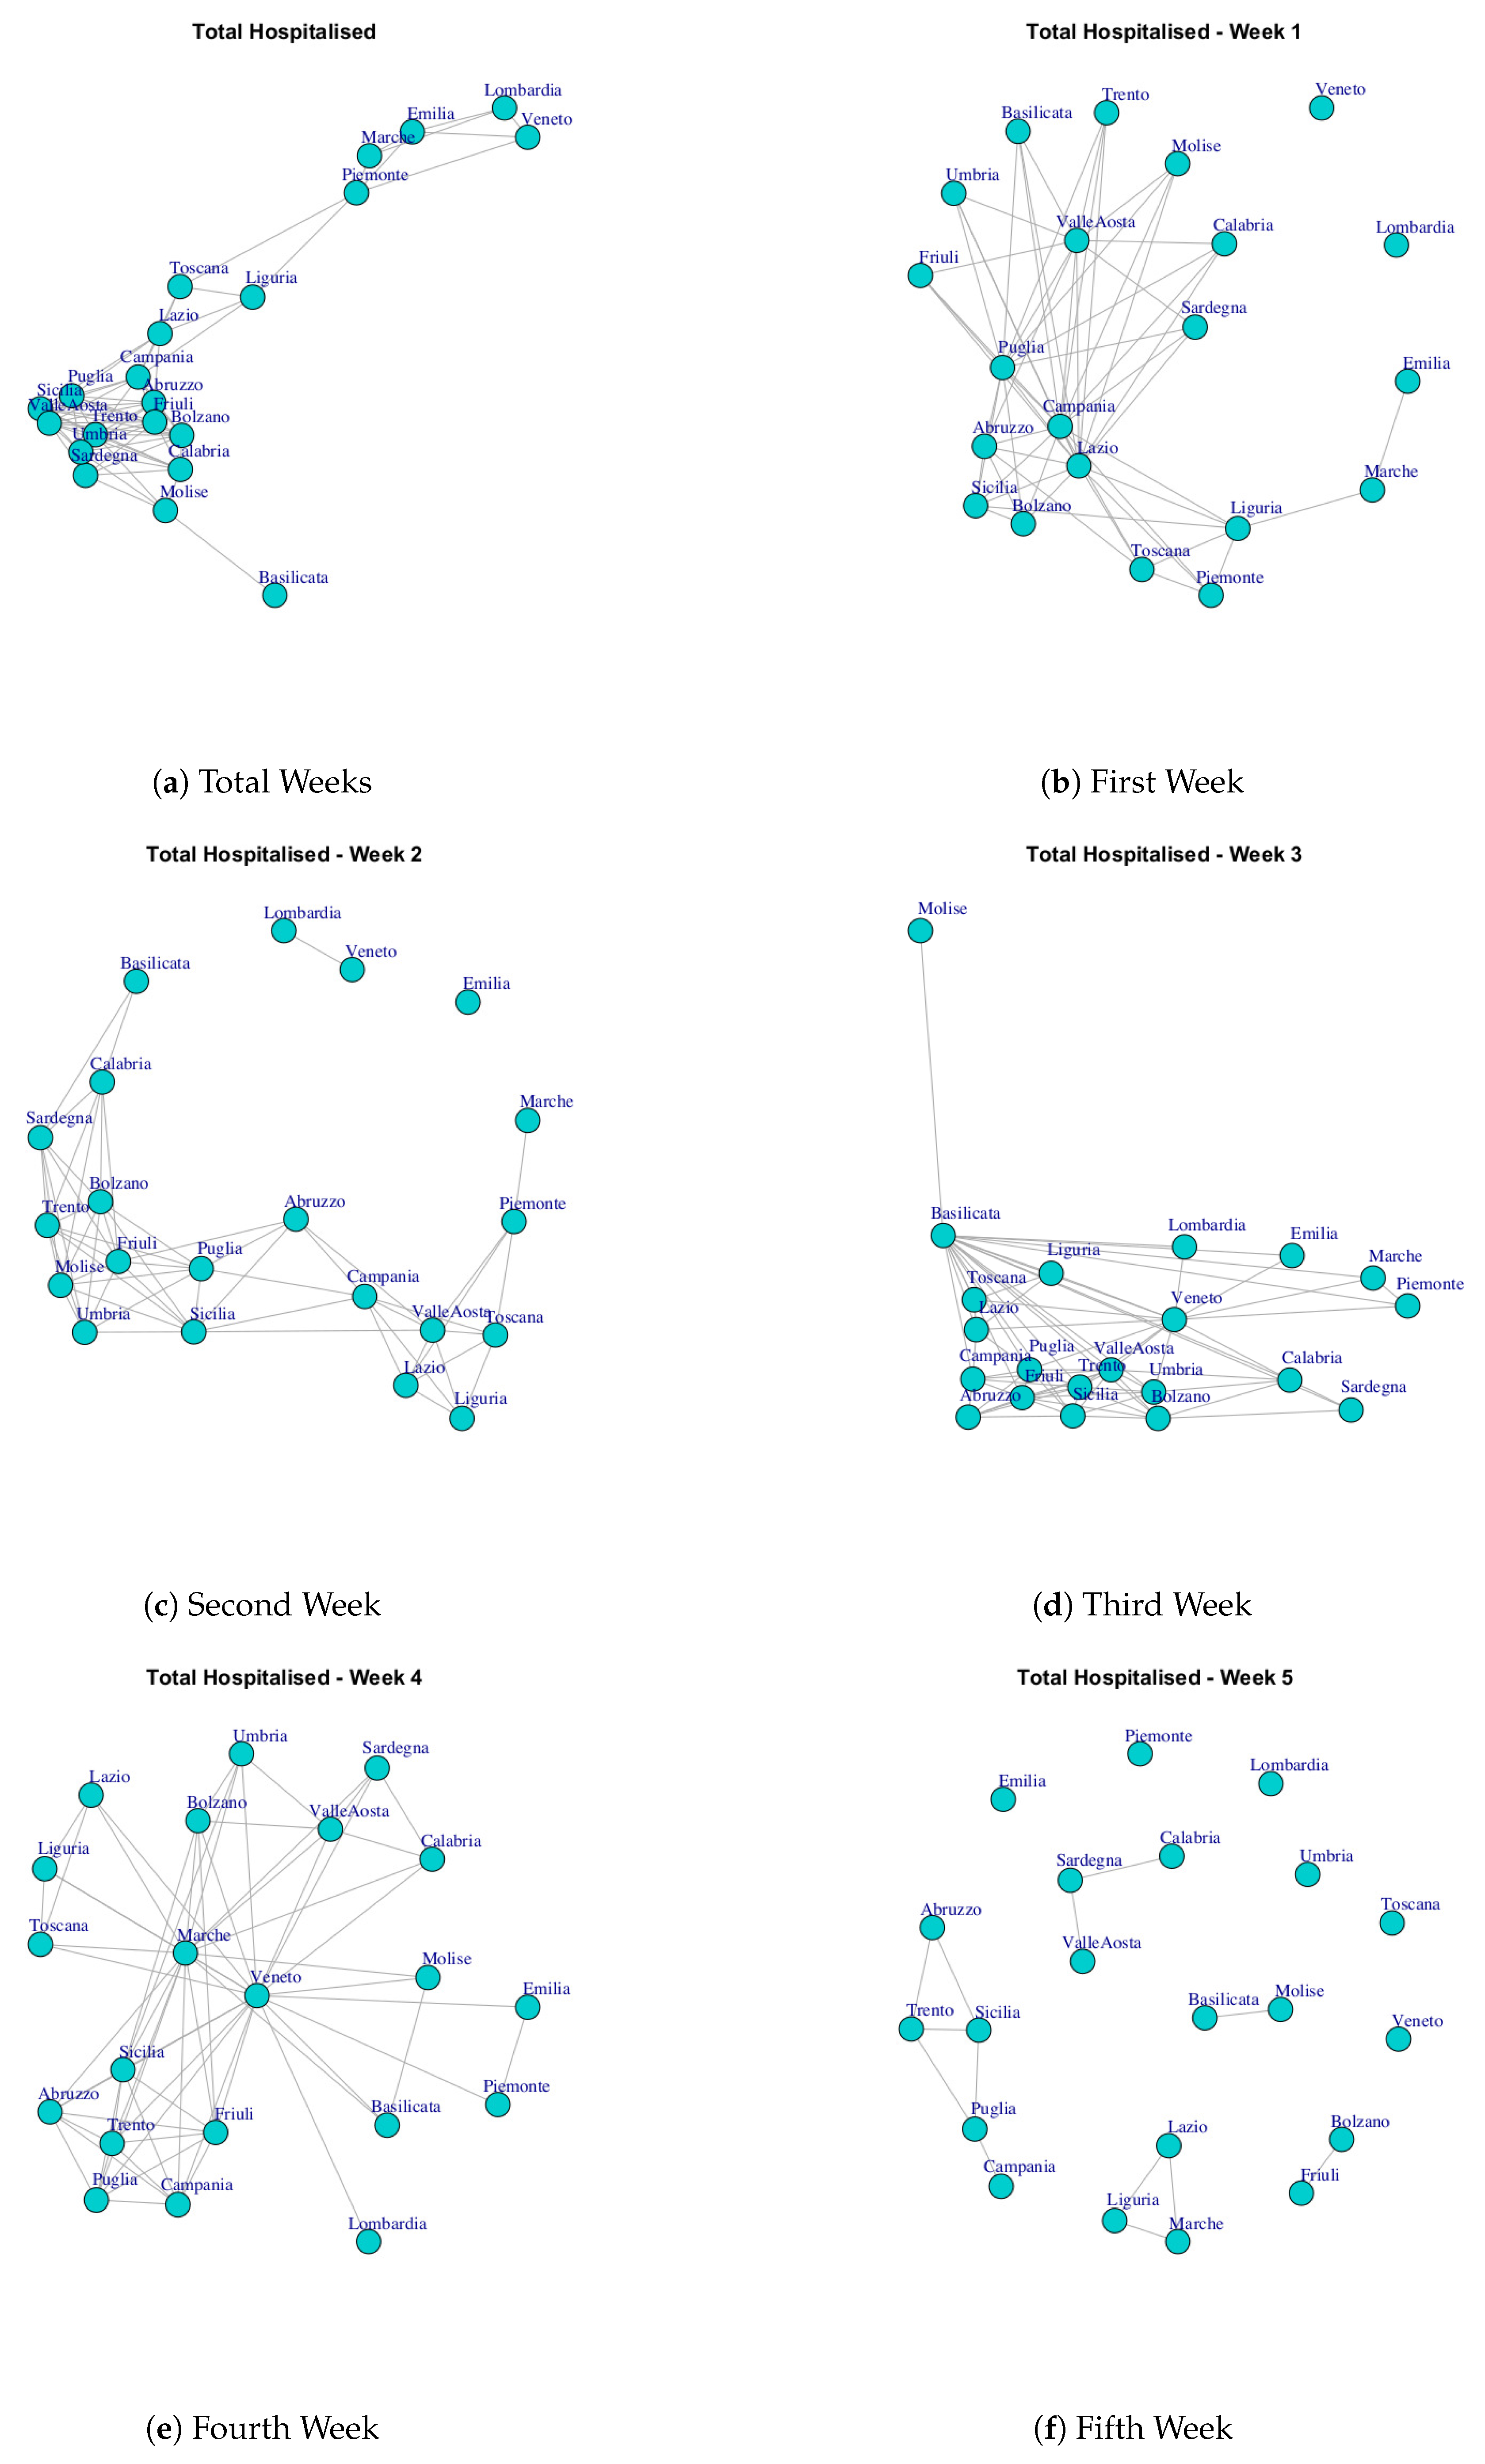
- Mapping similarity matrices to networks. The second step consists of the building networks starting from the similarity matrices. We map each matrix M(i, j) to a network N, where nodes represent the Italian regions and an edge connects two regions (i, j) if the p-value in the similarity matrix is greater than the significance threshold of 0.05. edges are weighted with the p-value.
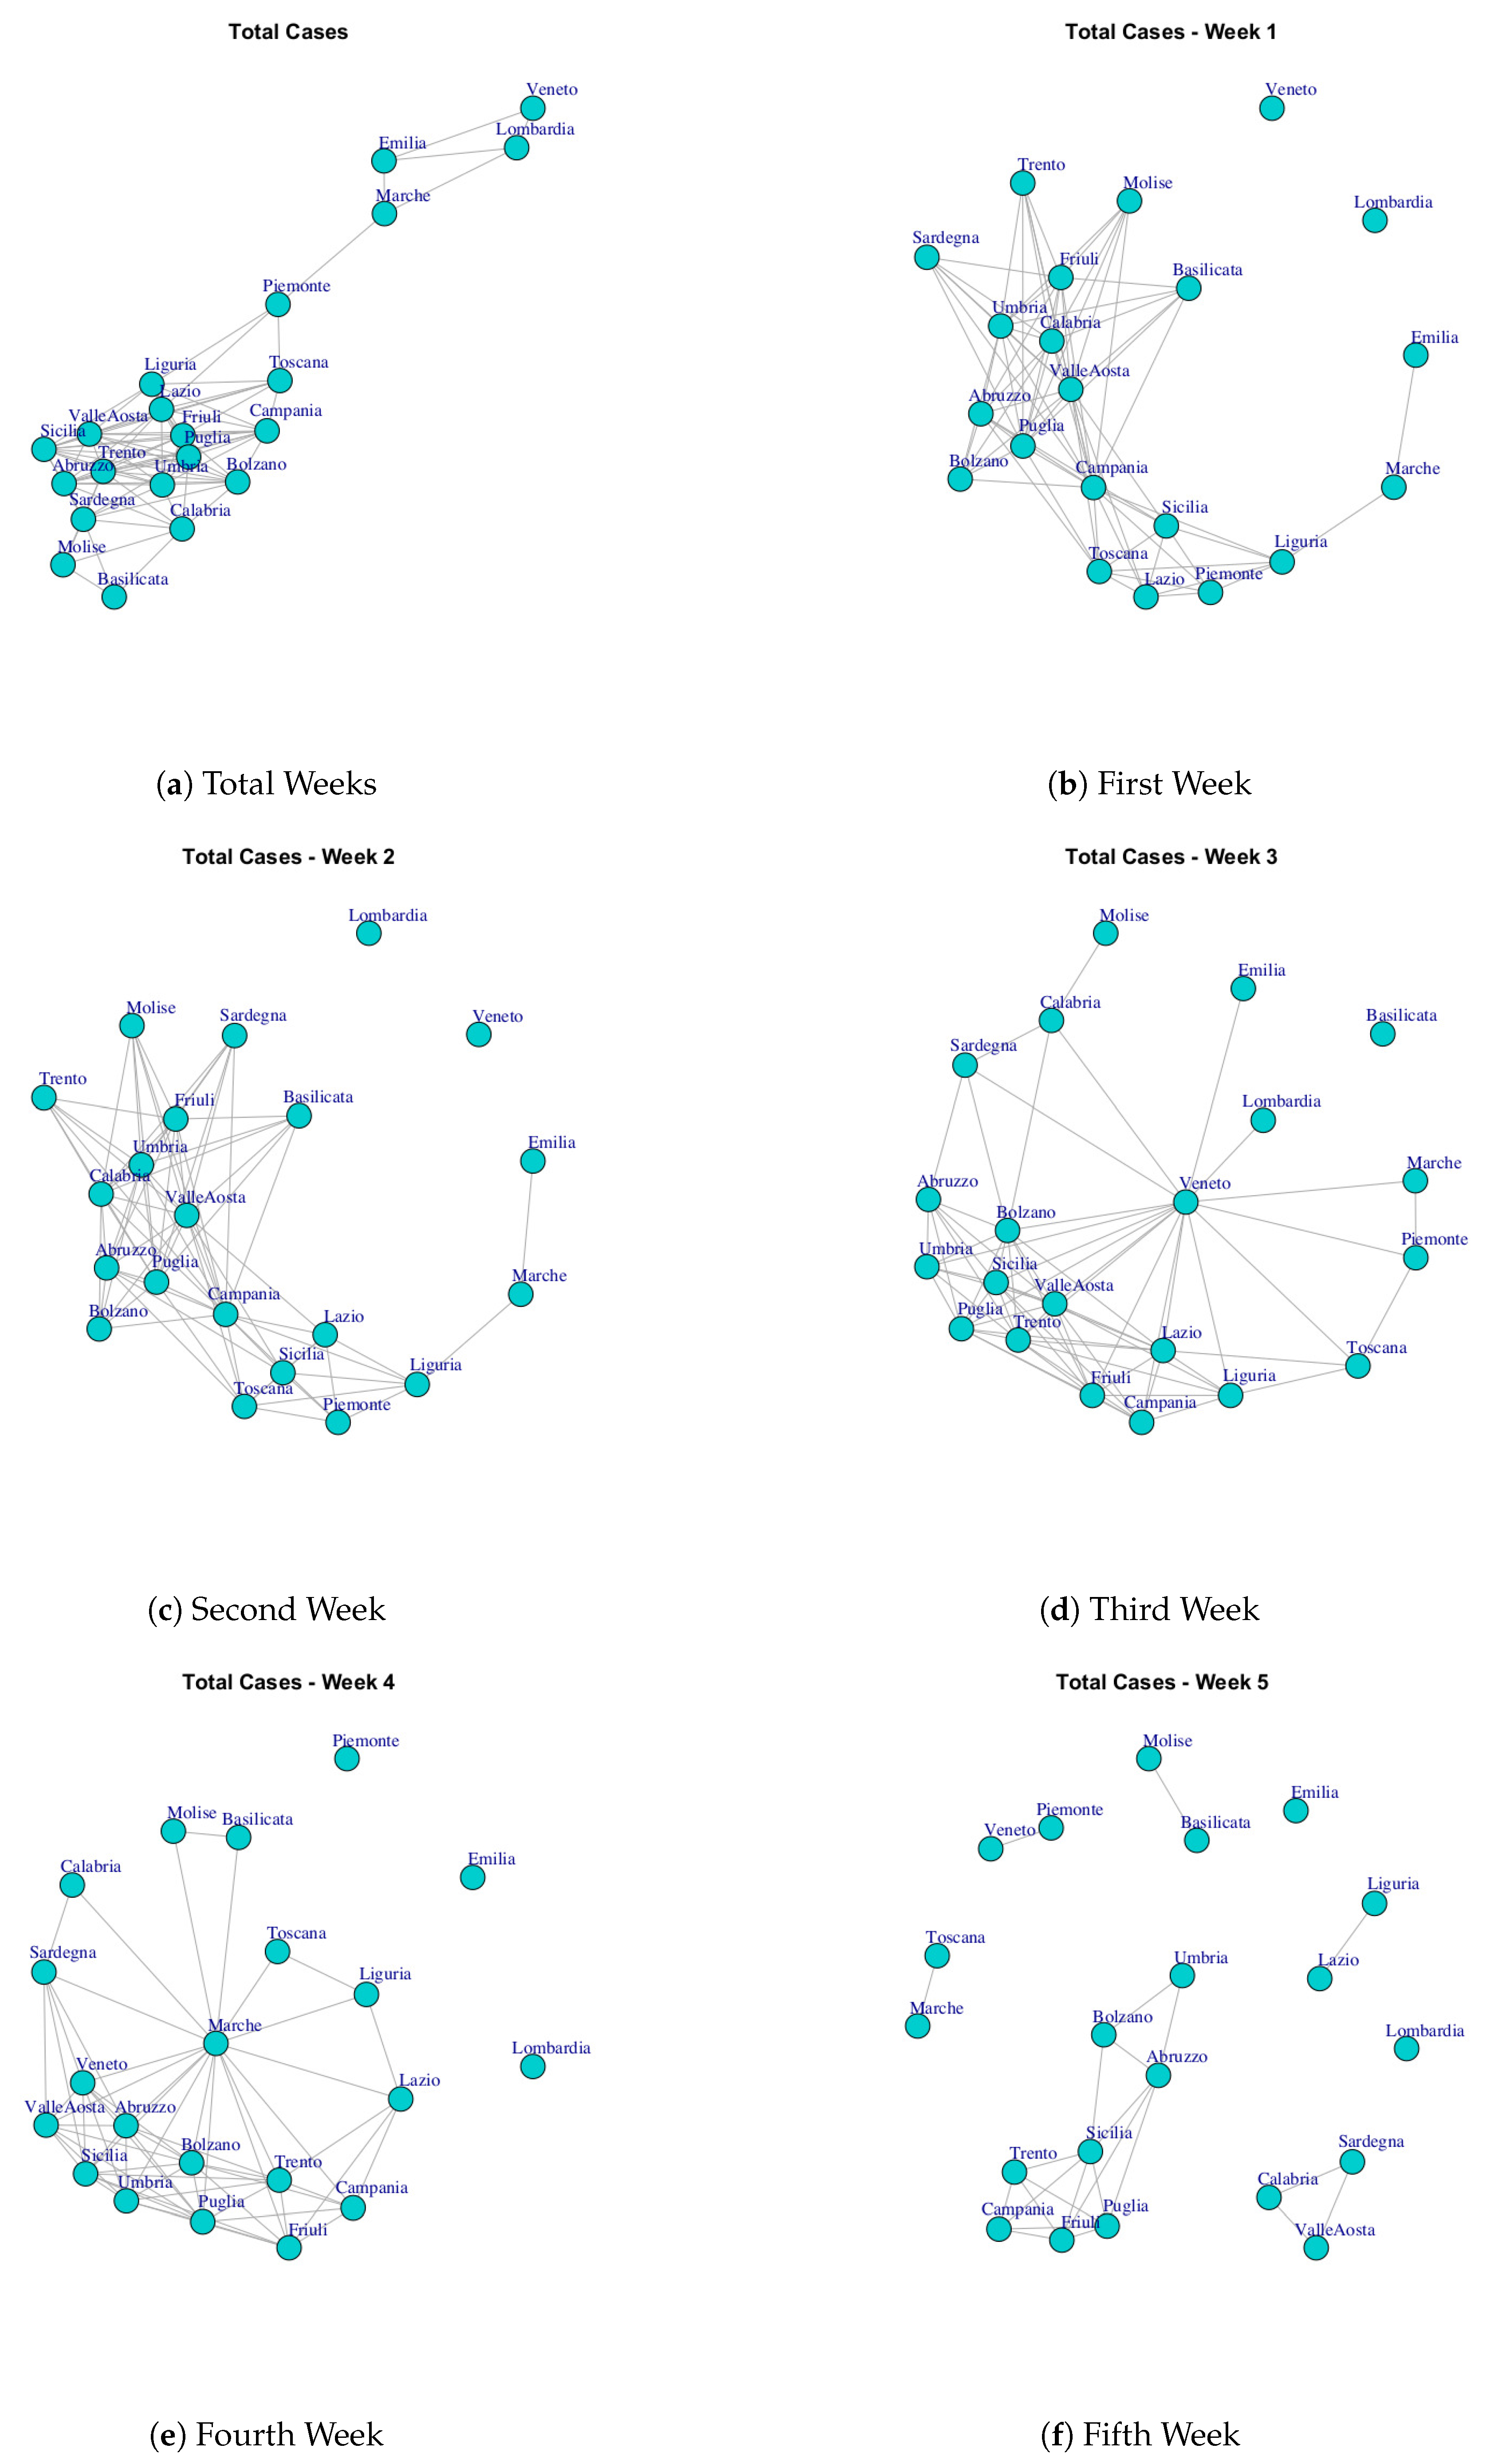
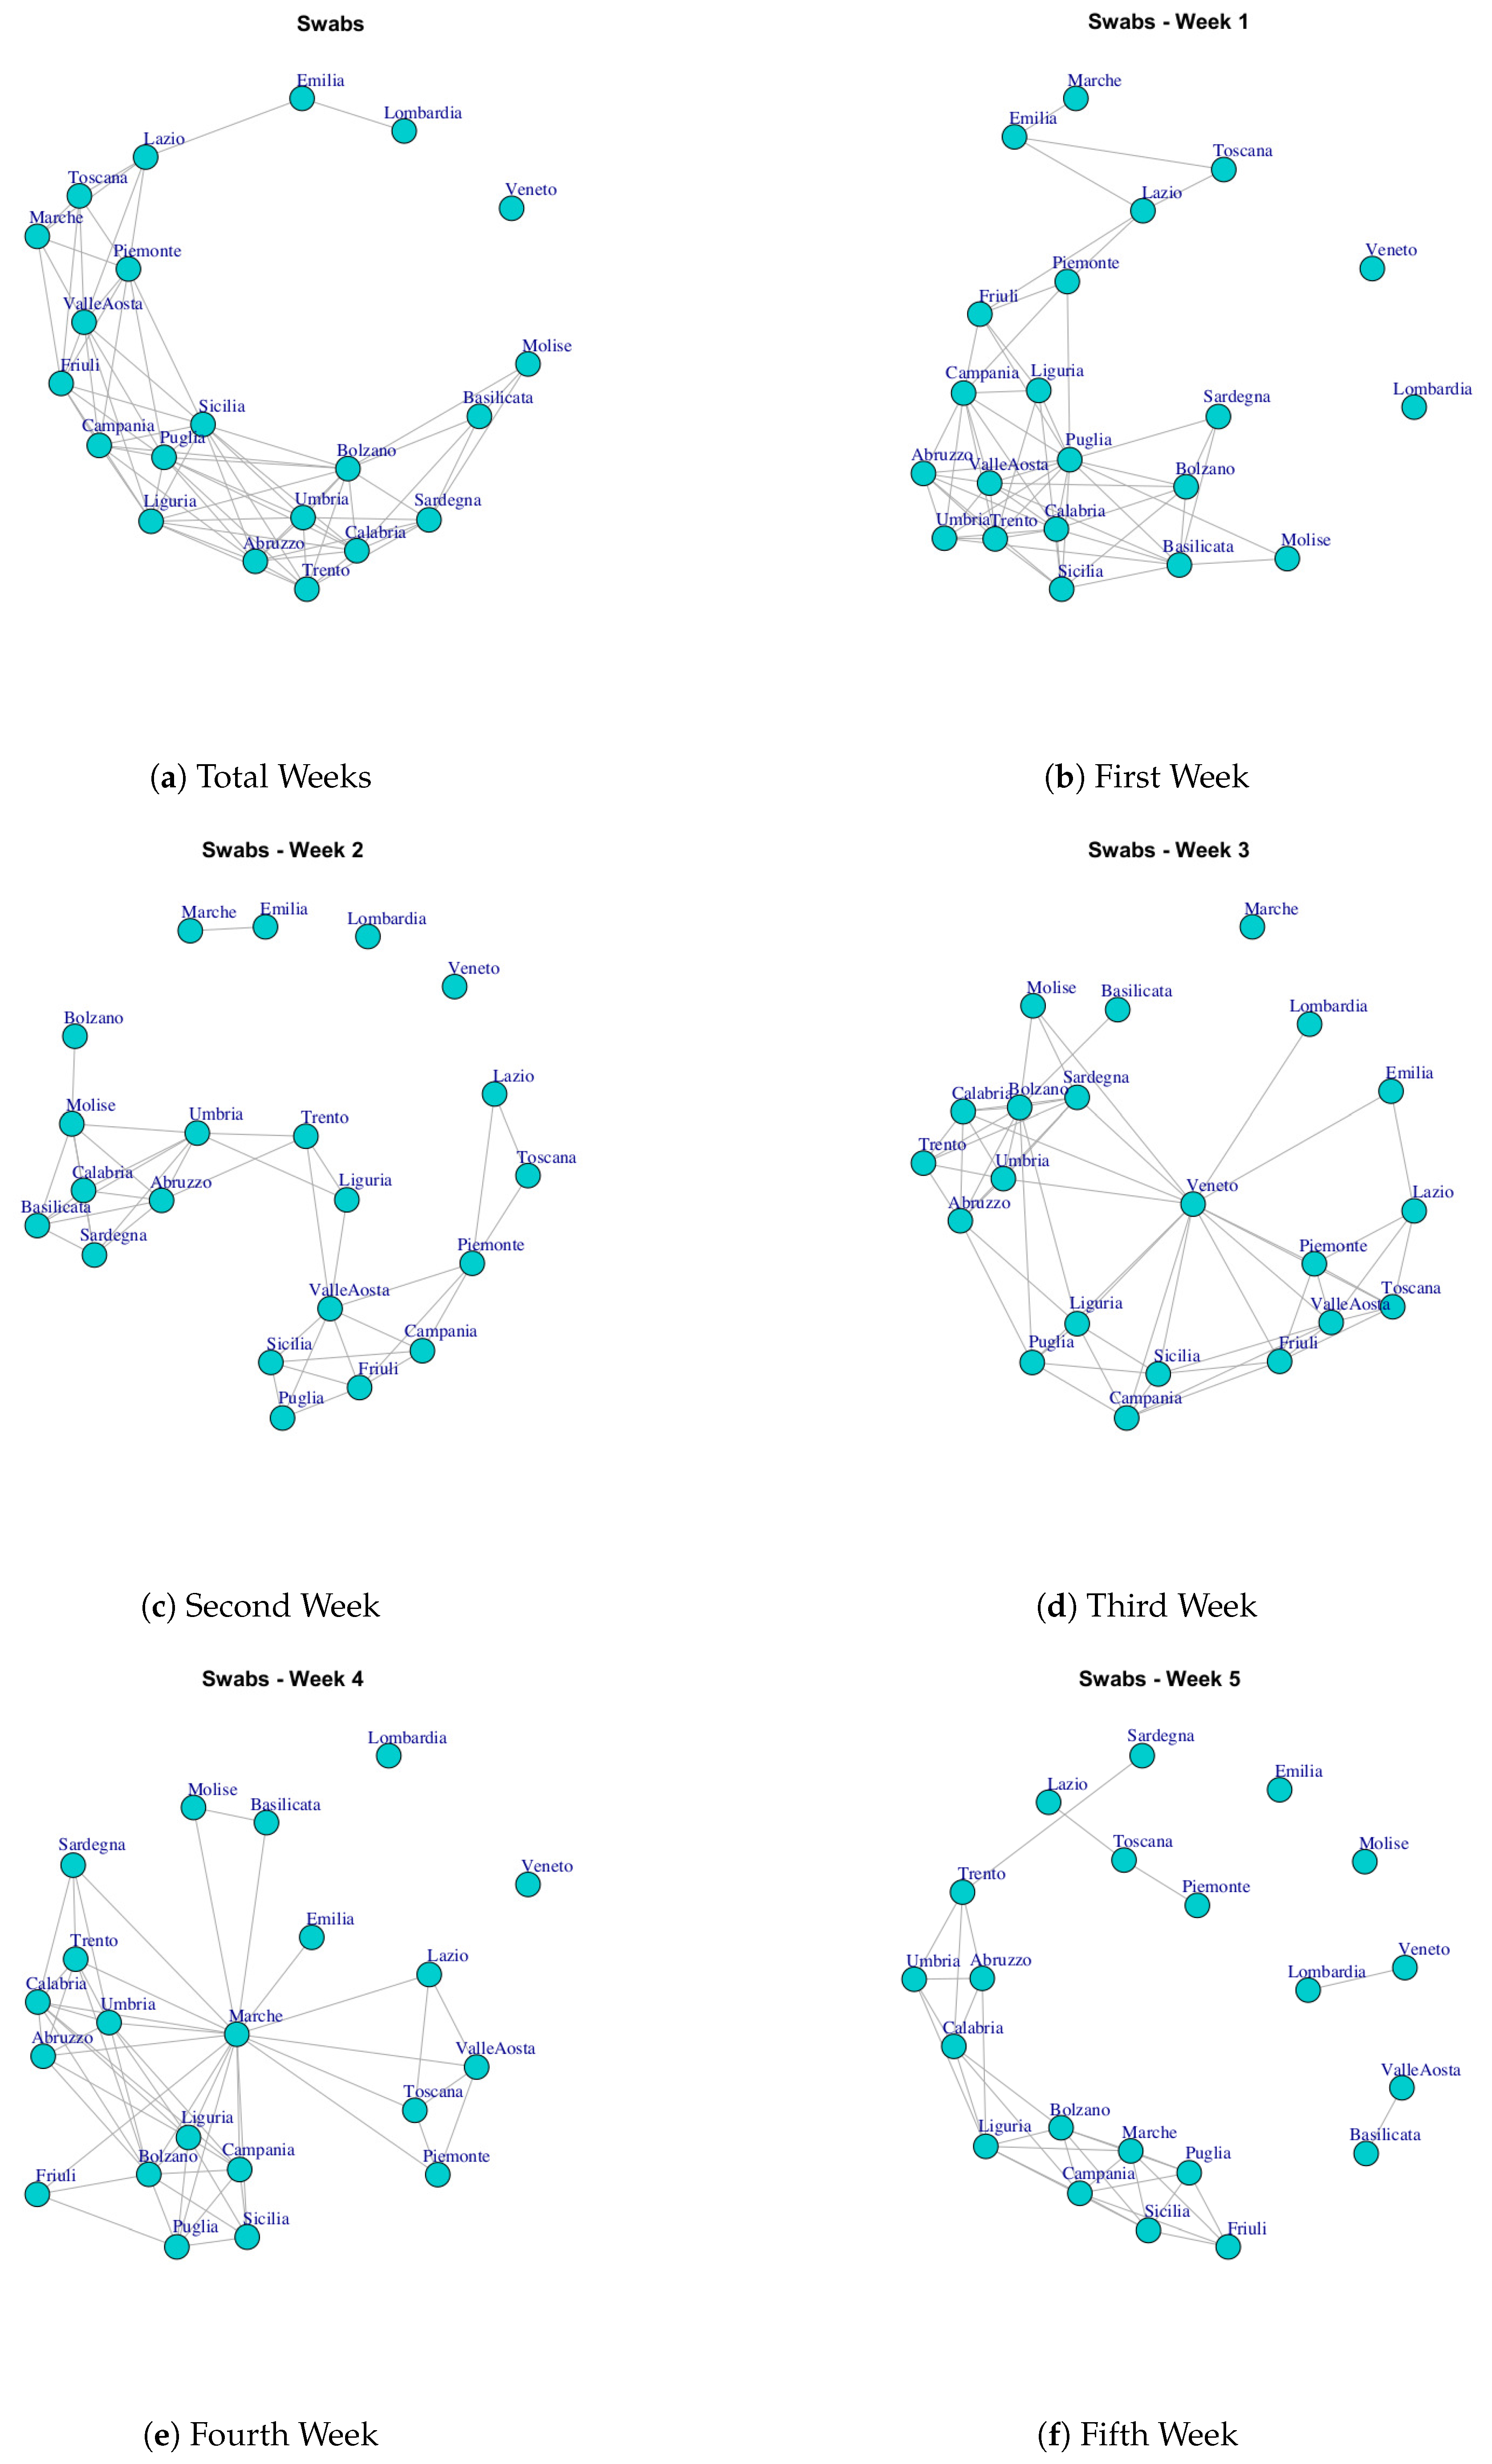
- Temporal analysis of networks. The third step consists of the building of the network at different time intervals. Assuming that the analyzed data presents a temporal evolution, for each one, the corresponding networks at different time points (i.e., at the end of week 1,2, …, 5) and for an study period are built.
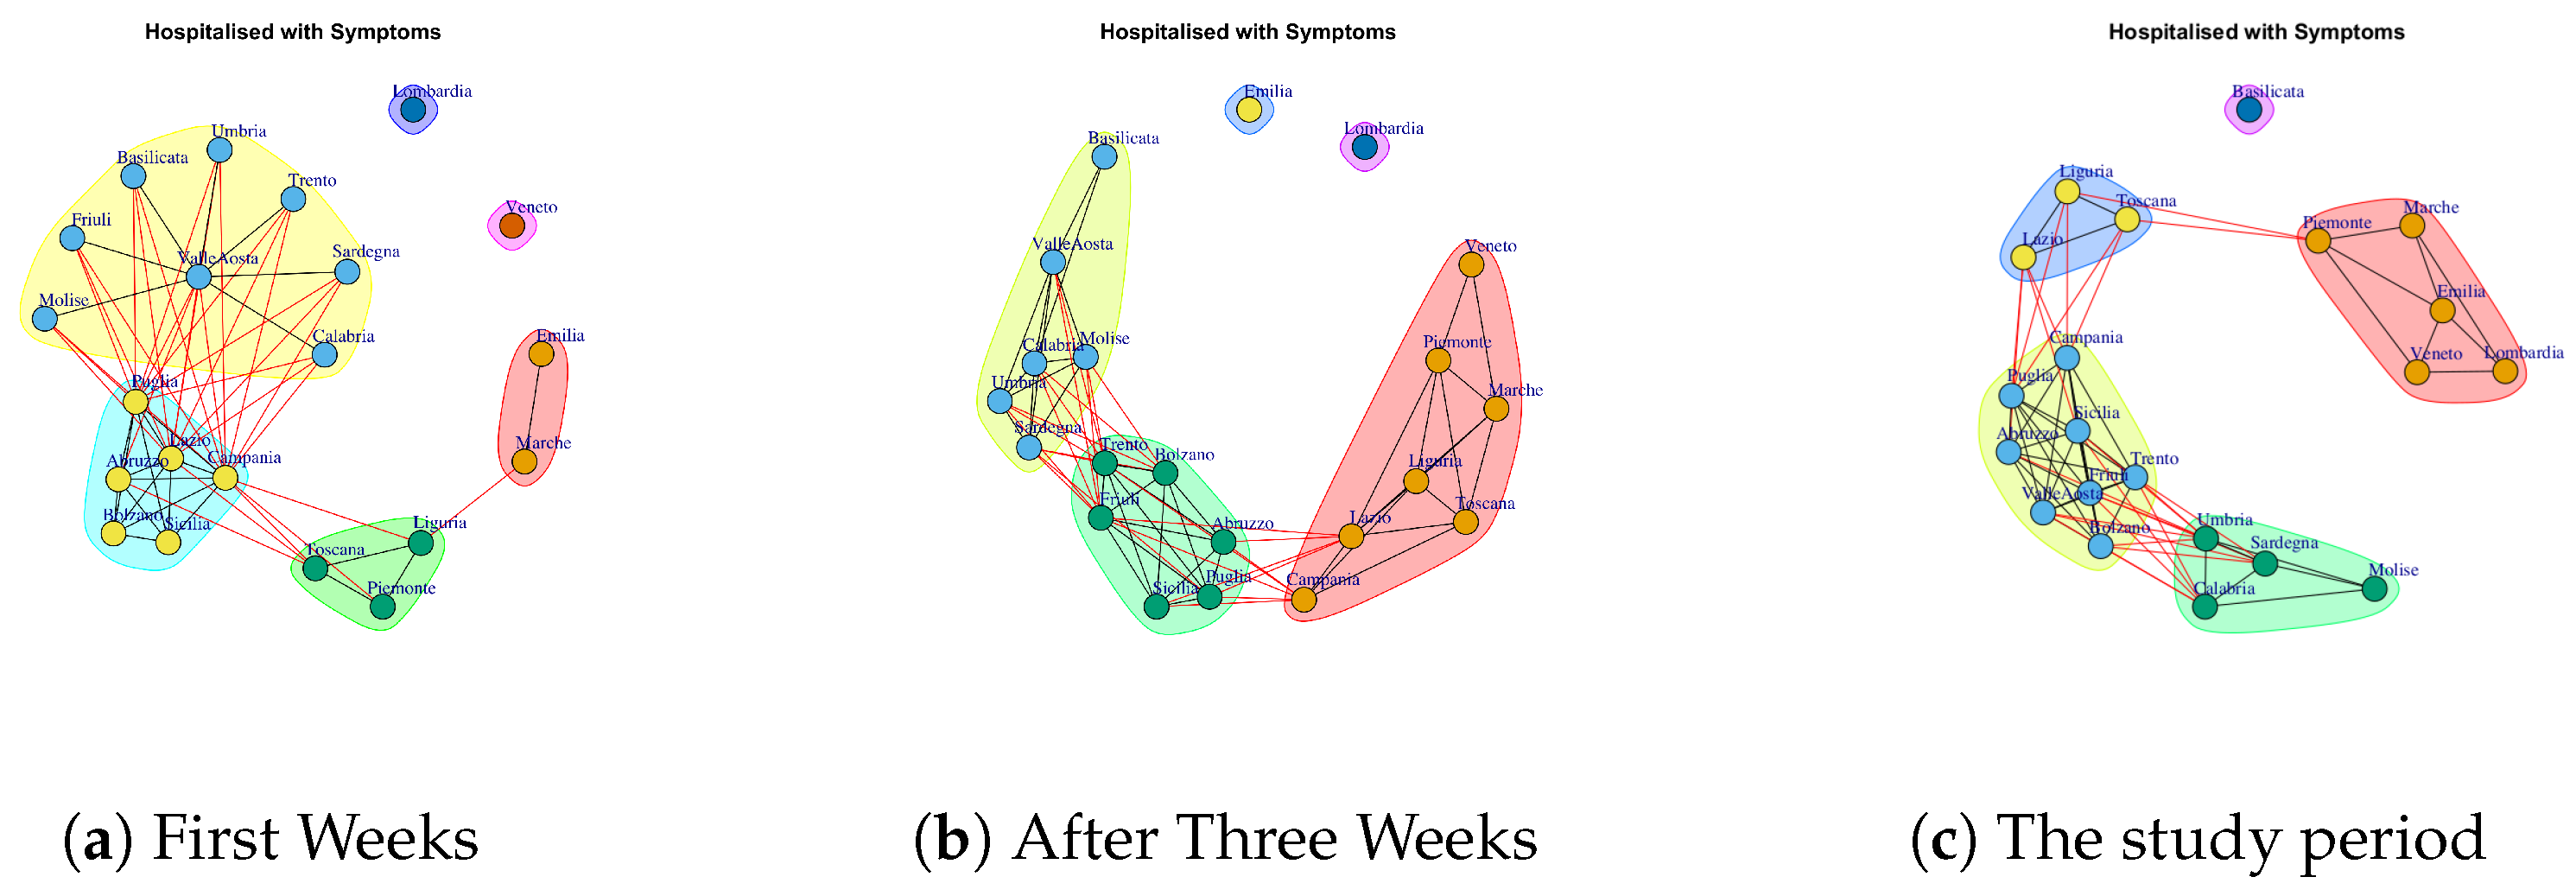
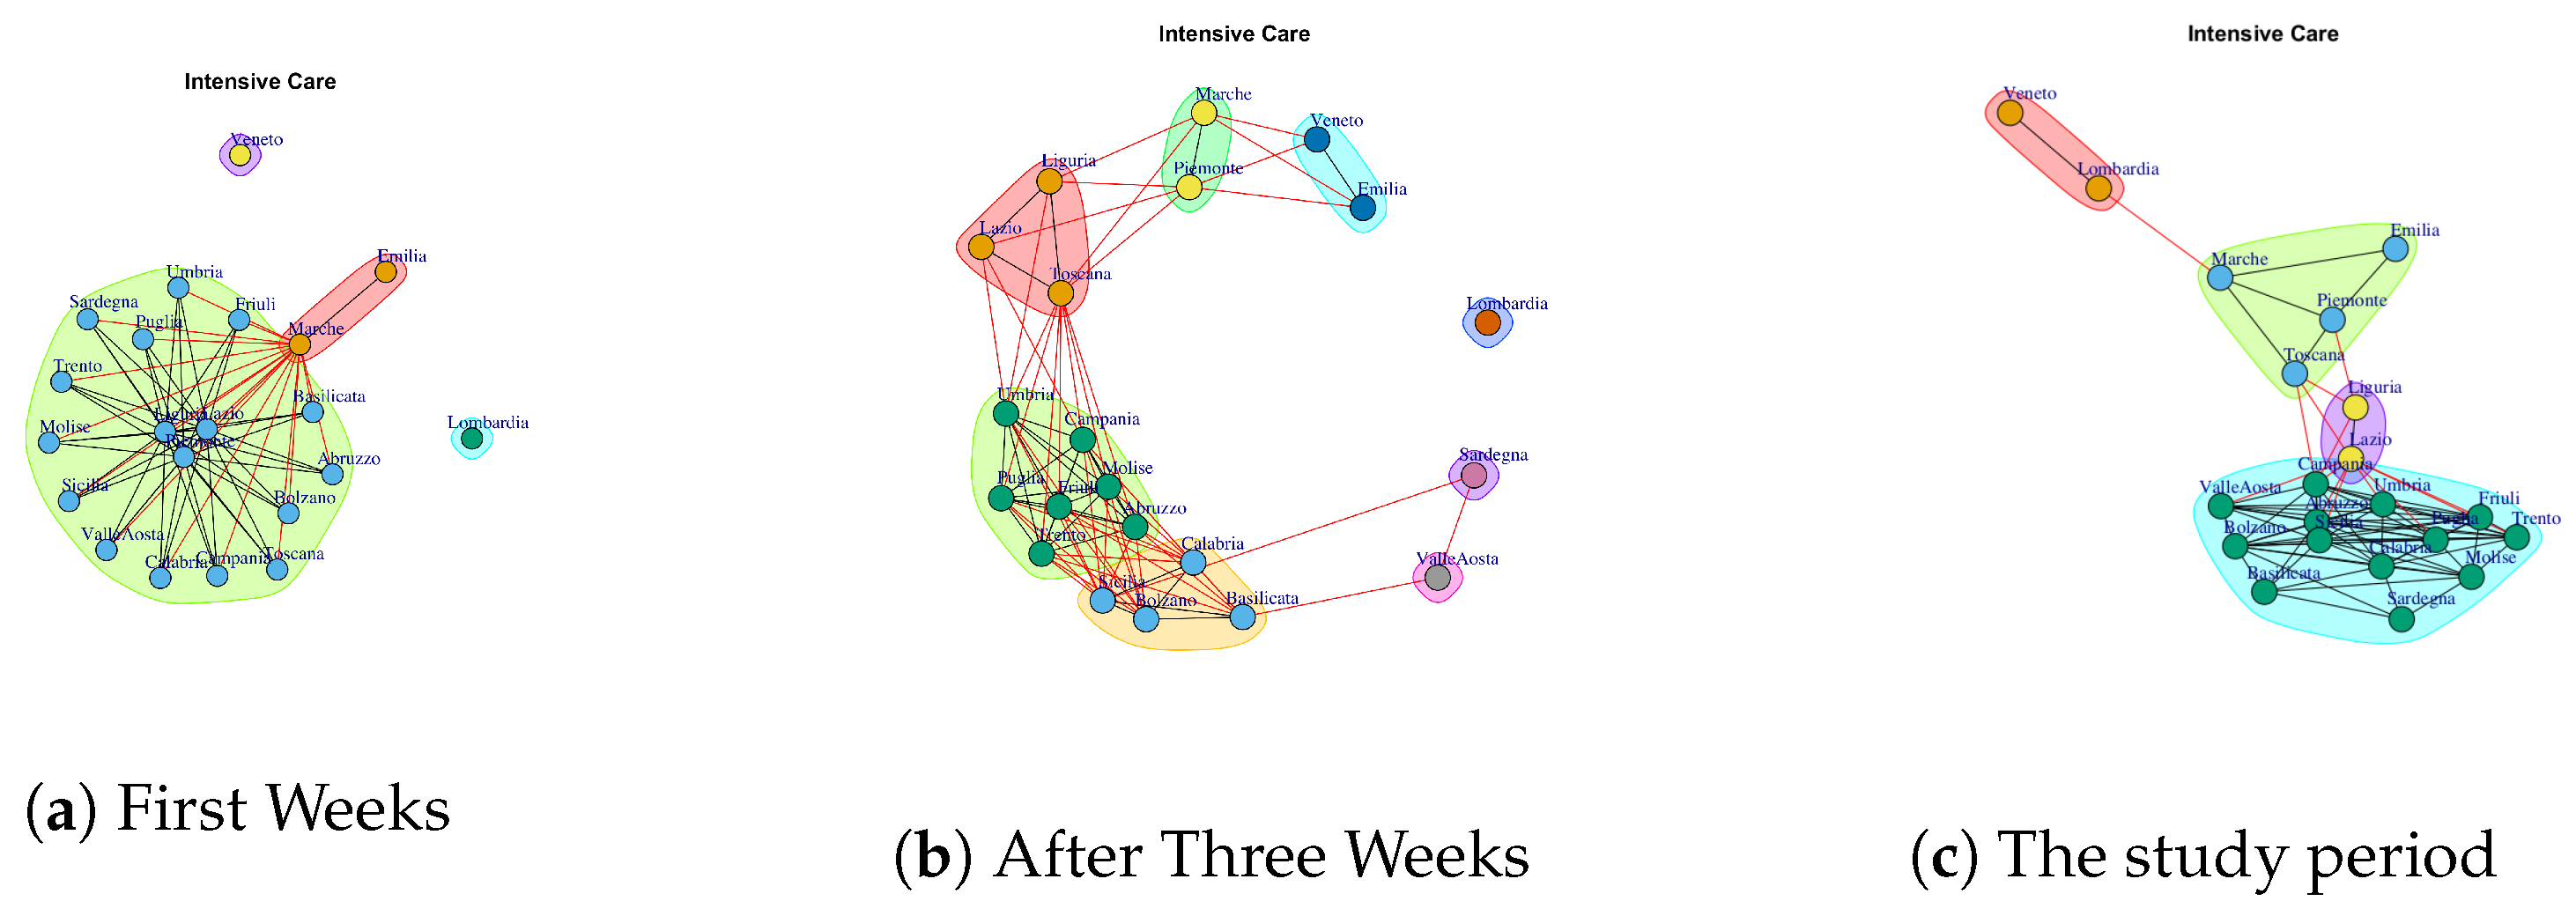
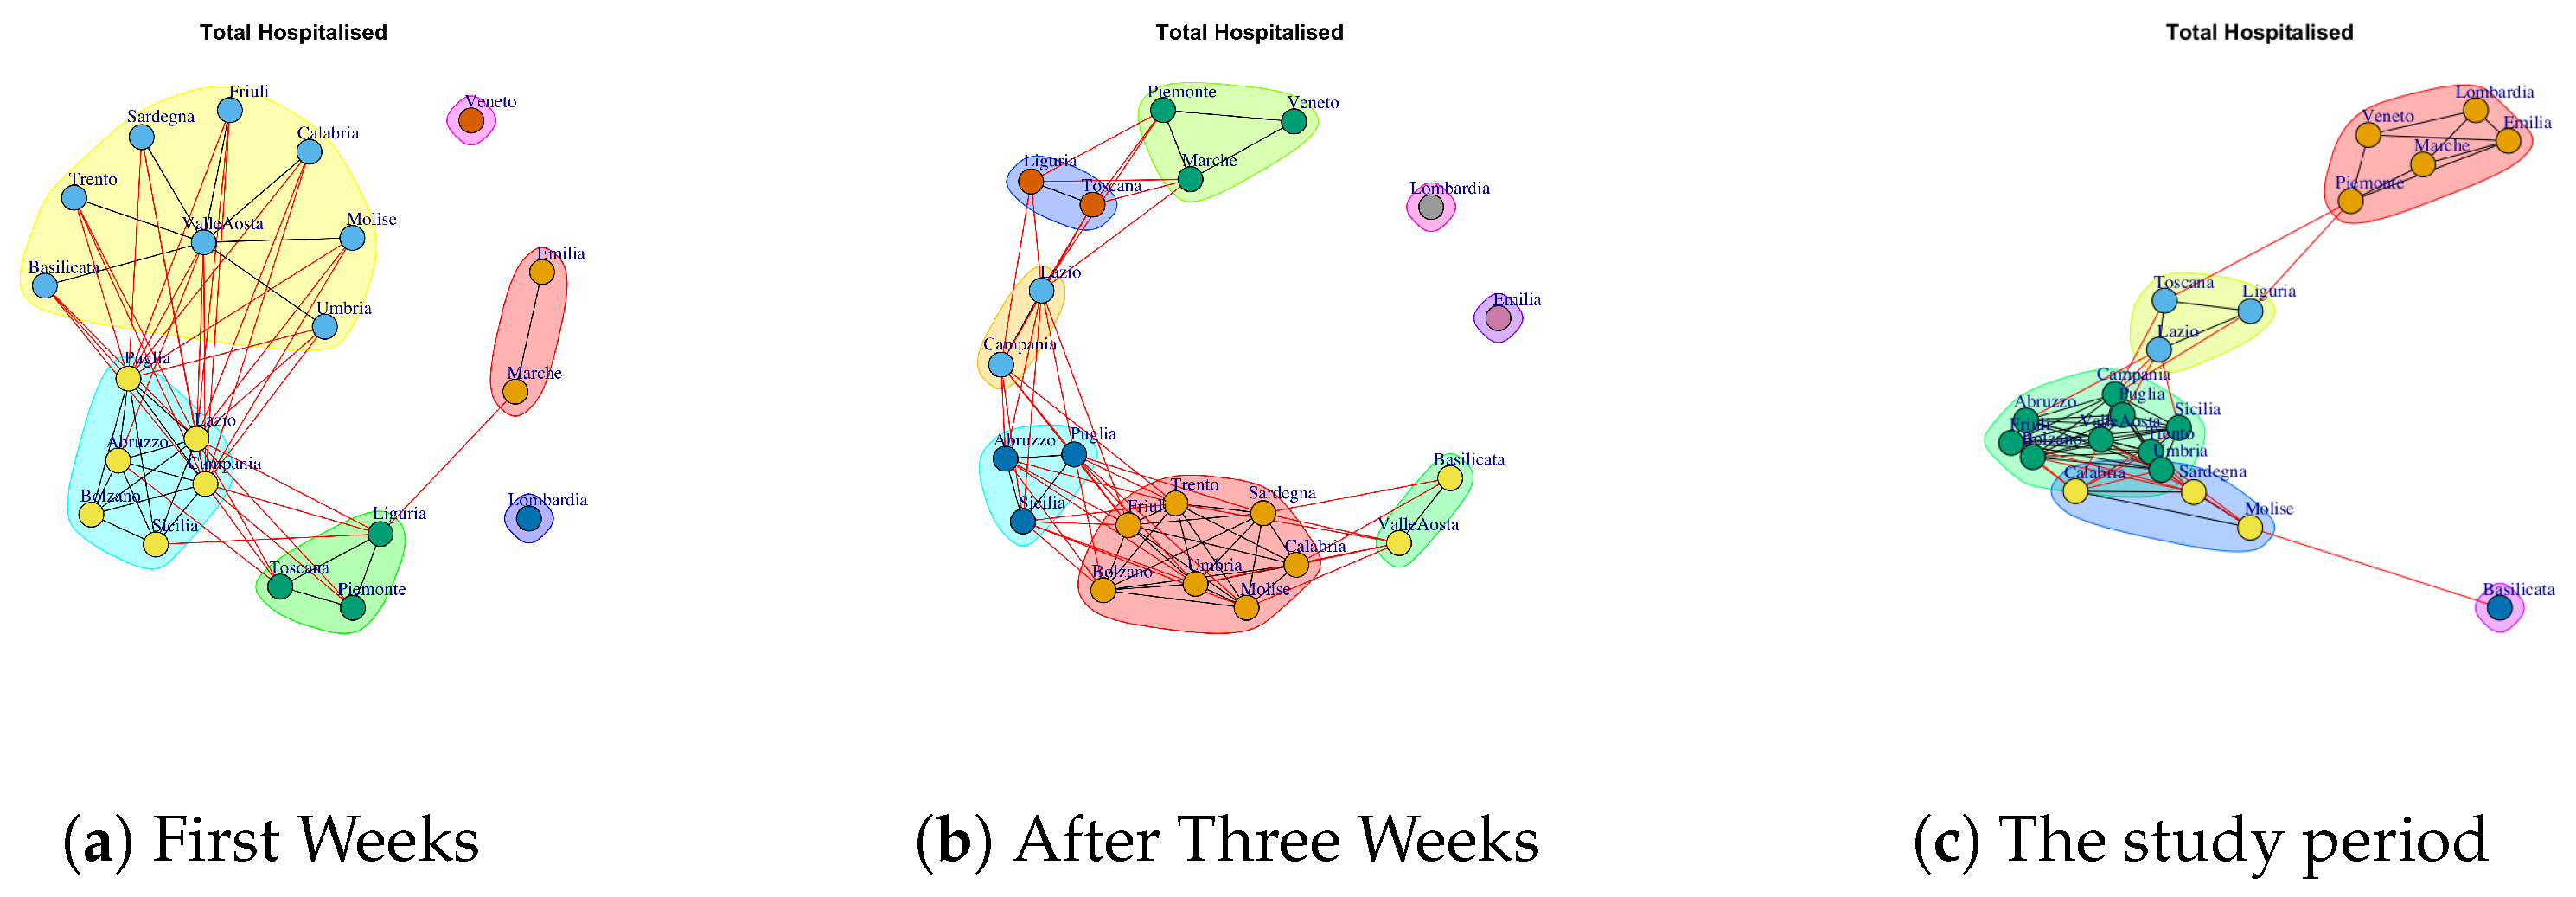
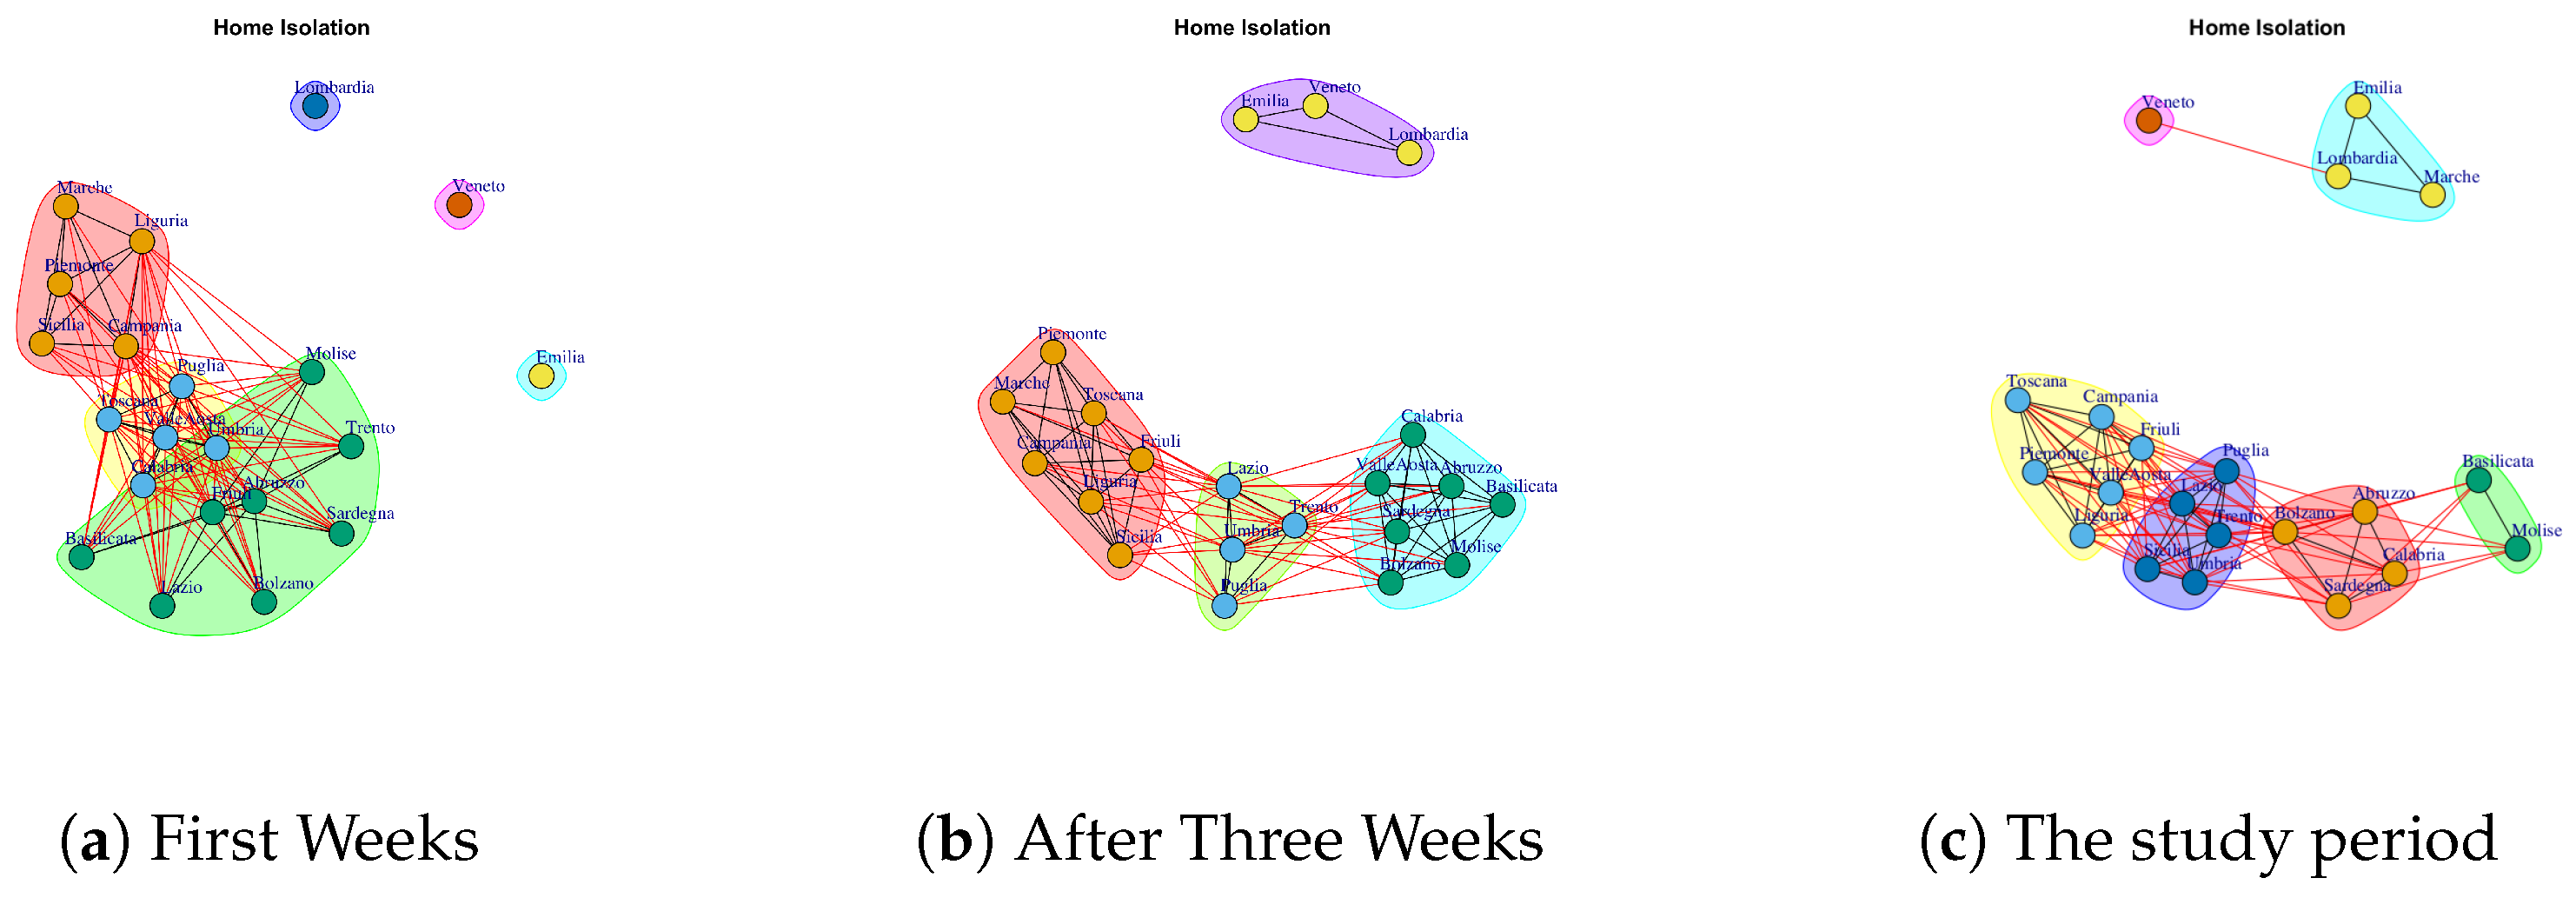
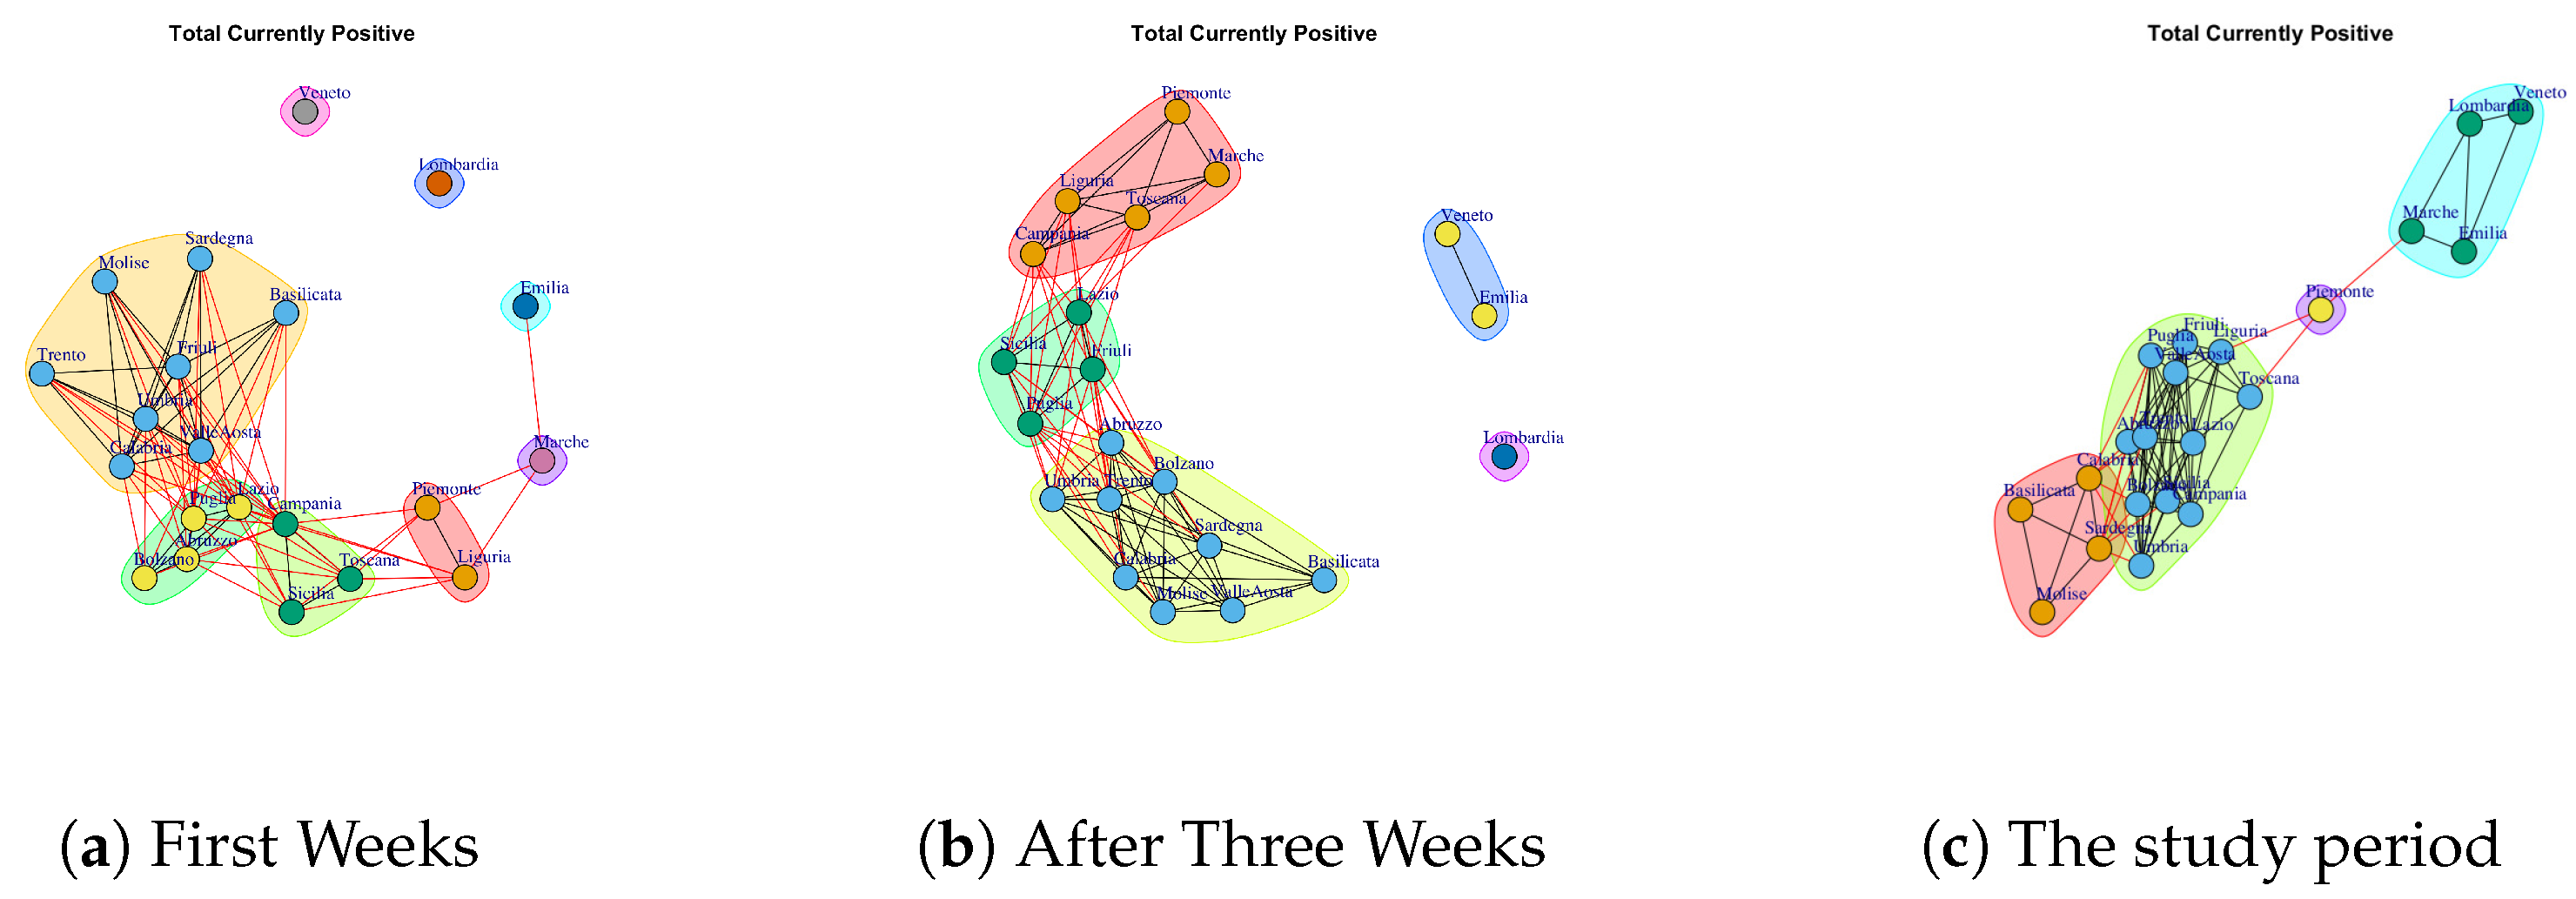
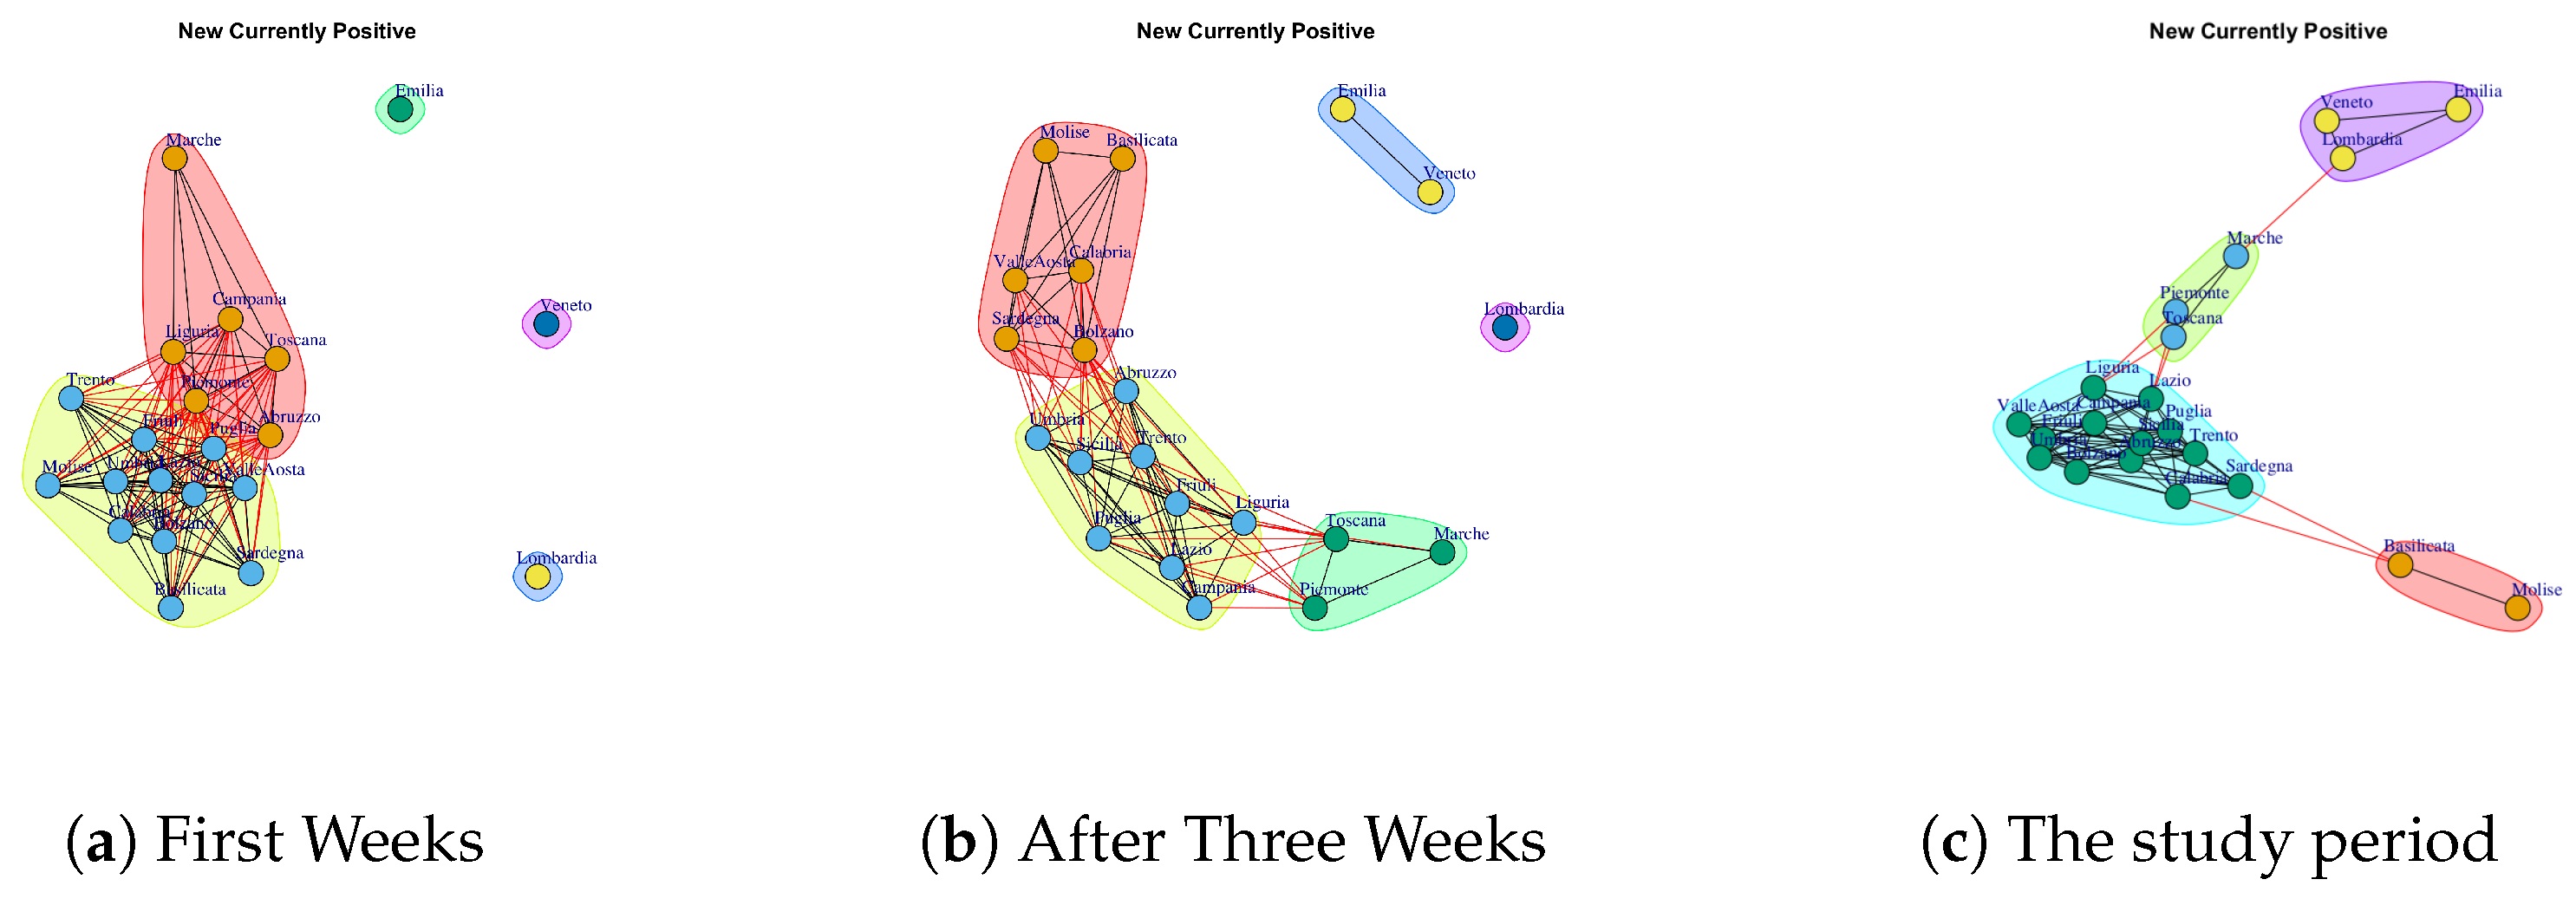
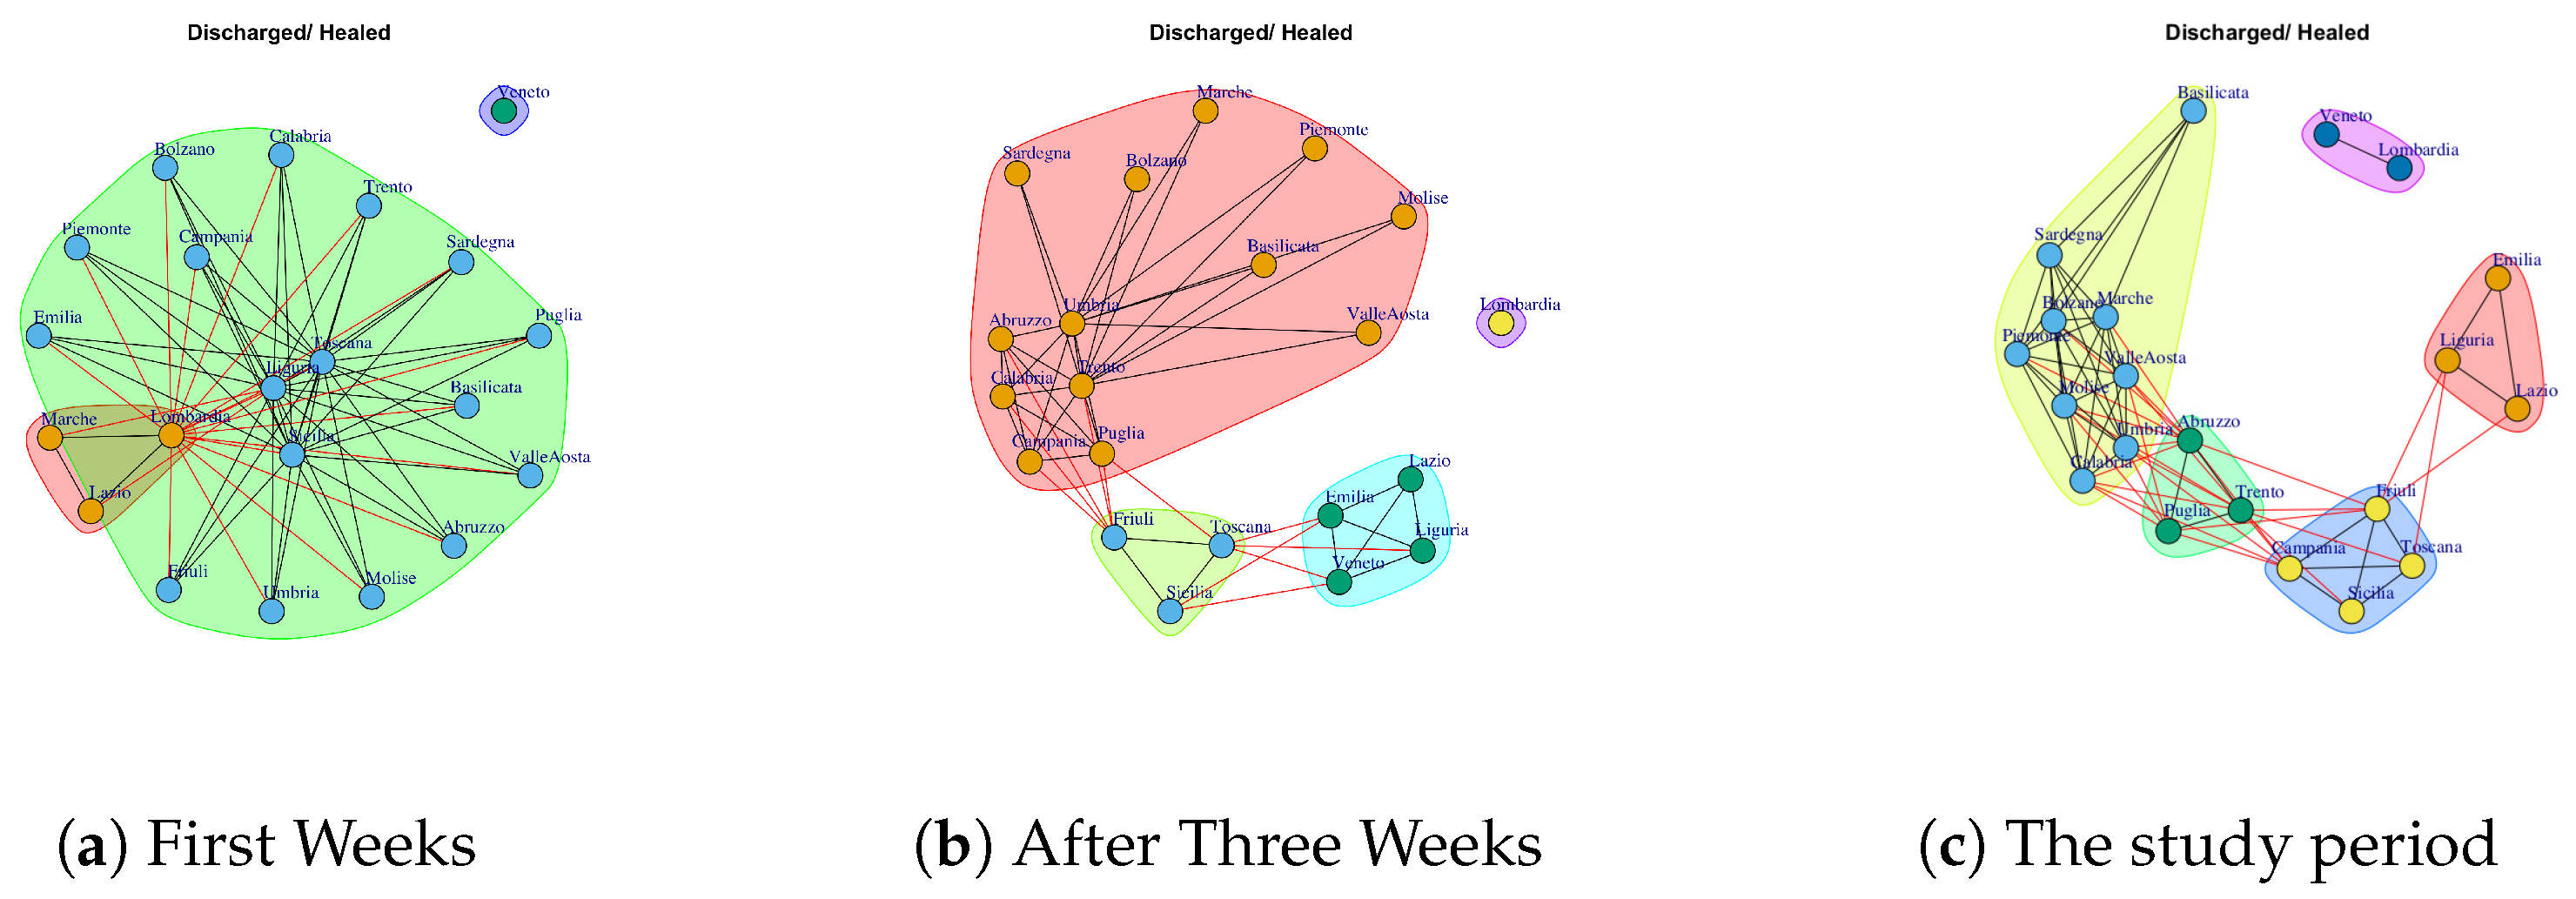
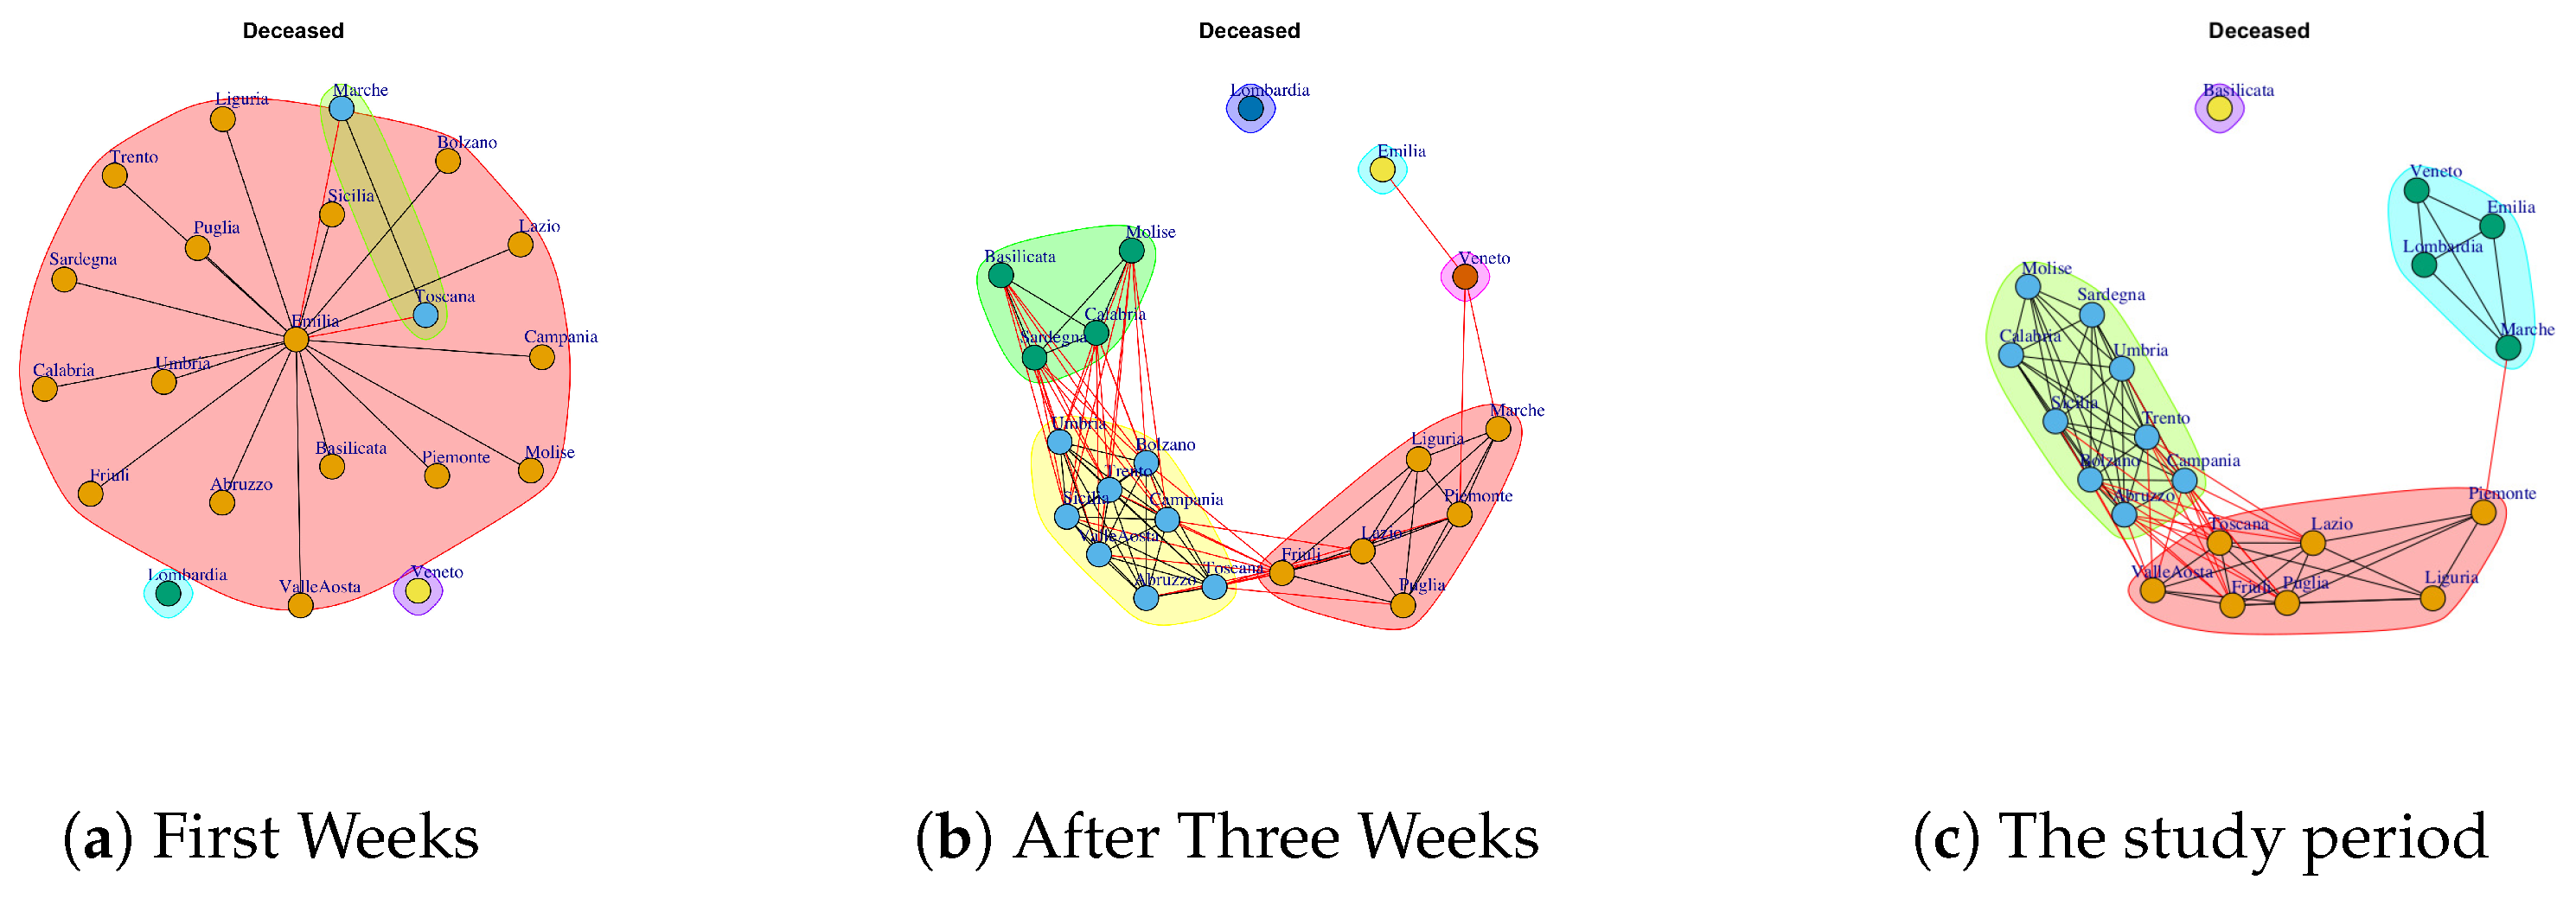
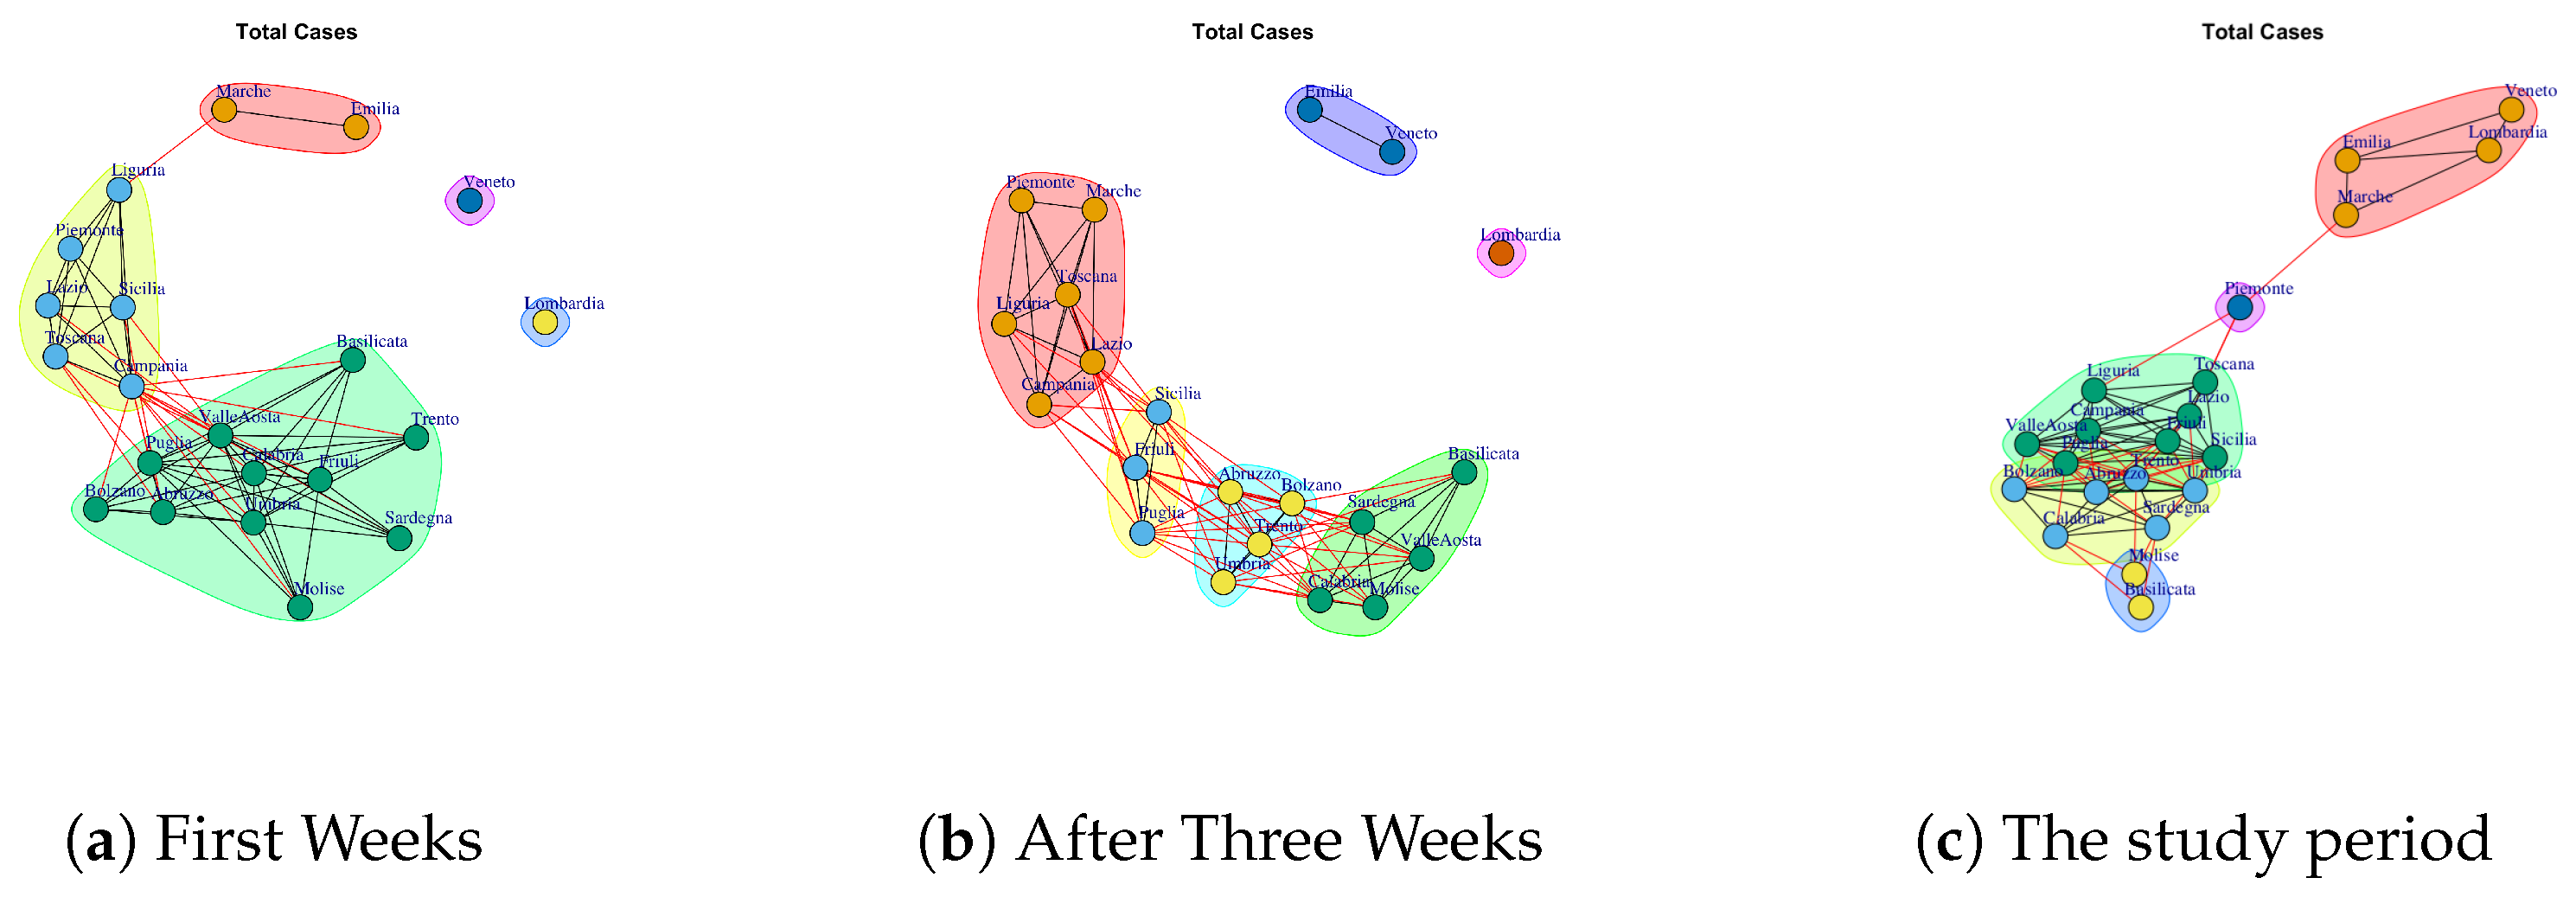
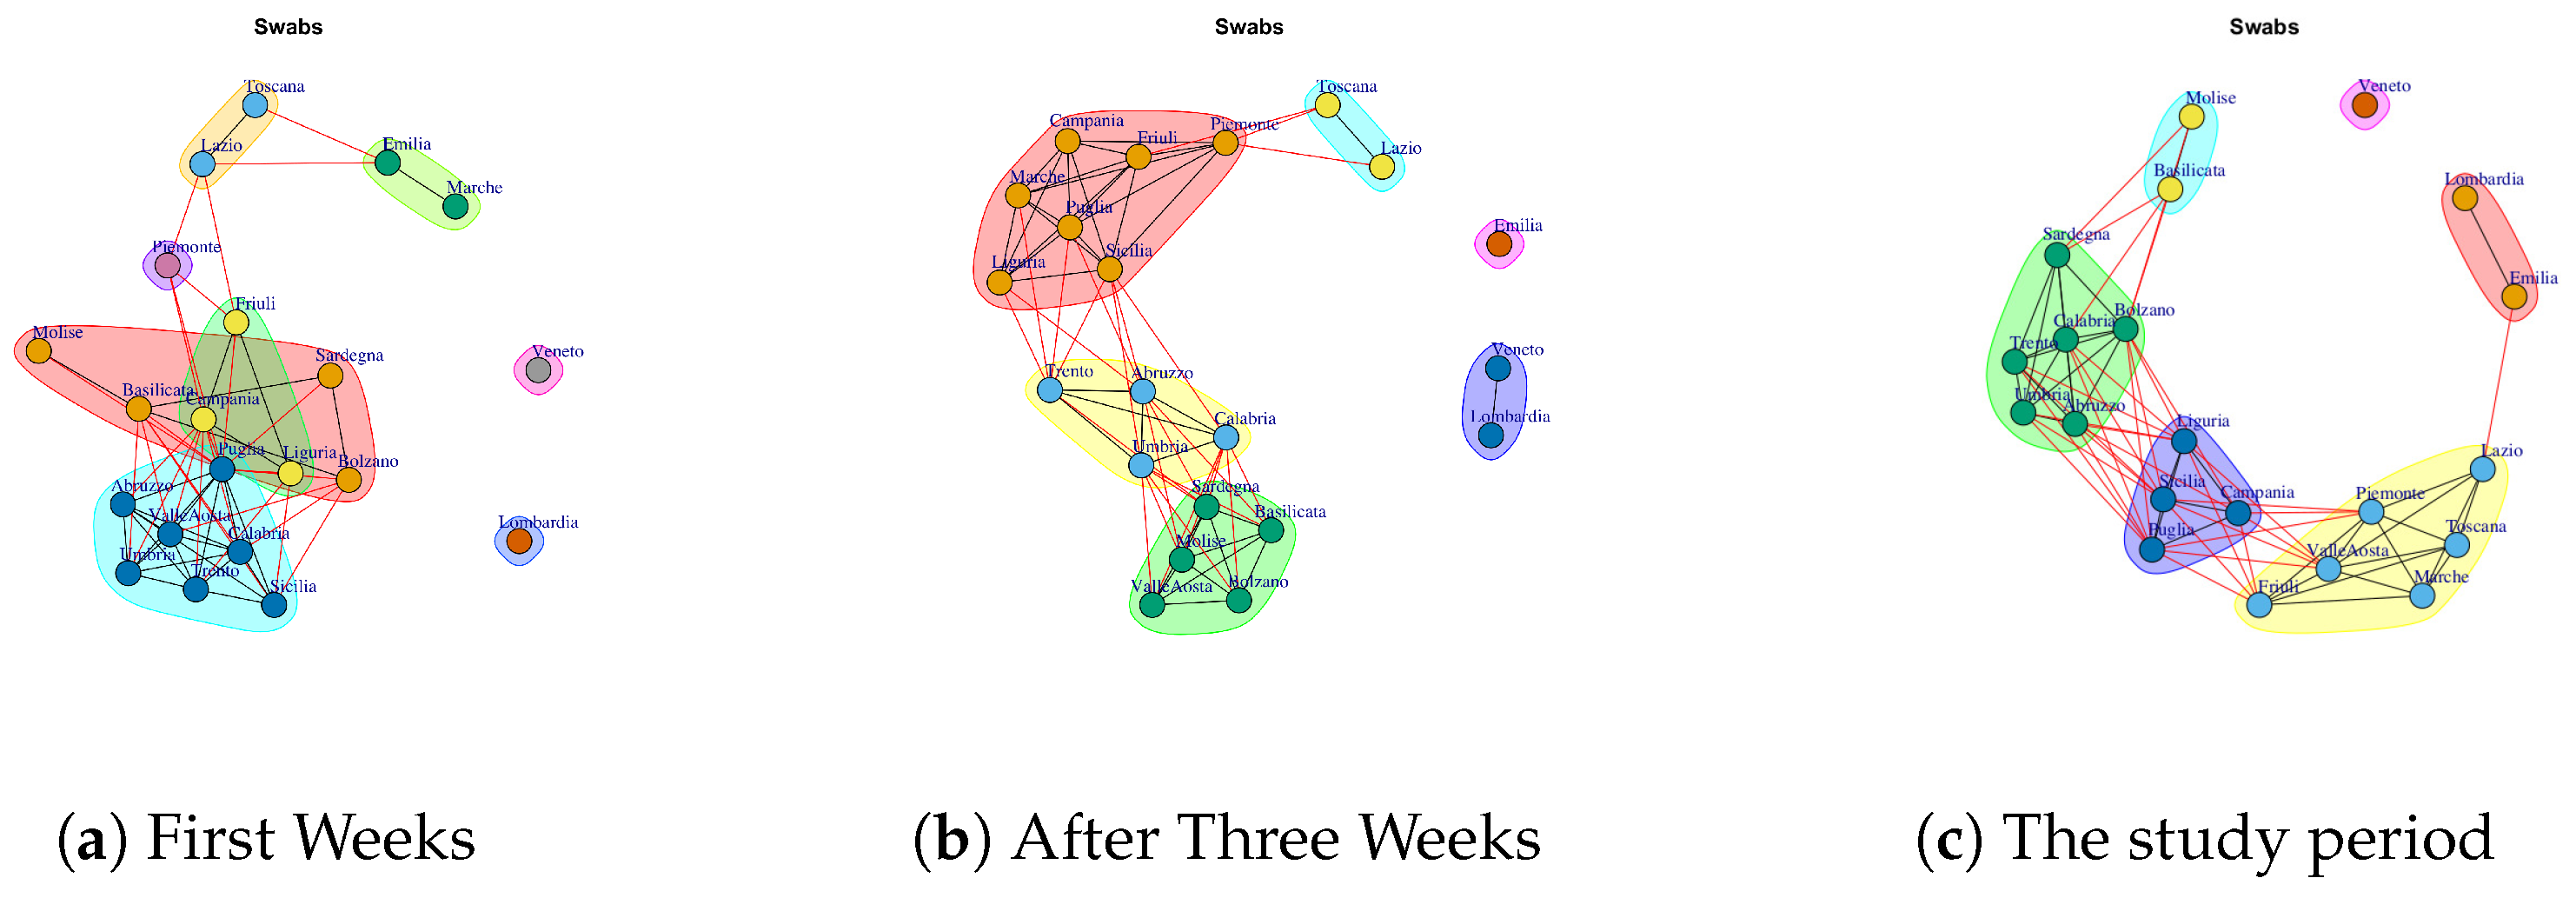
- Community detection. The fourth step consists of the extraction of community on the network by applying an appropriate community detection algorithm. For each network, we extracted subgroups of regions that form a community based on similarity of point of view. The identification of community is performed on the networks related to the study period and for all single week. Then, we extract the communities at different time points, i.e., at the end of the first week, after three weeks, and after five weeks (the study period).
3. Results
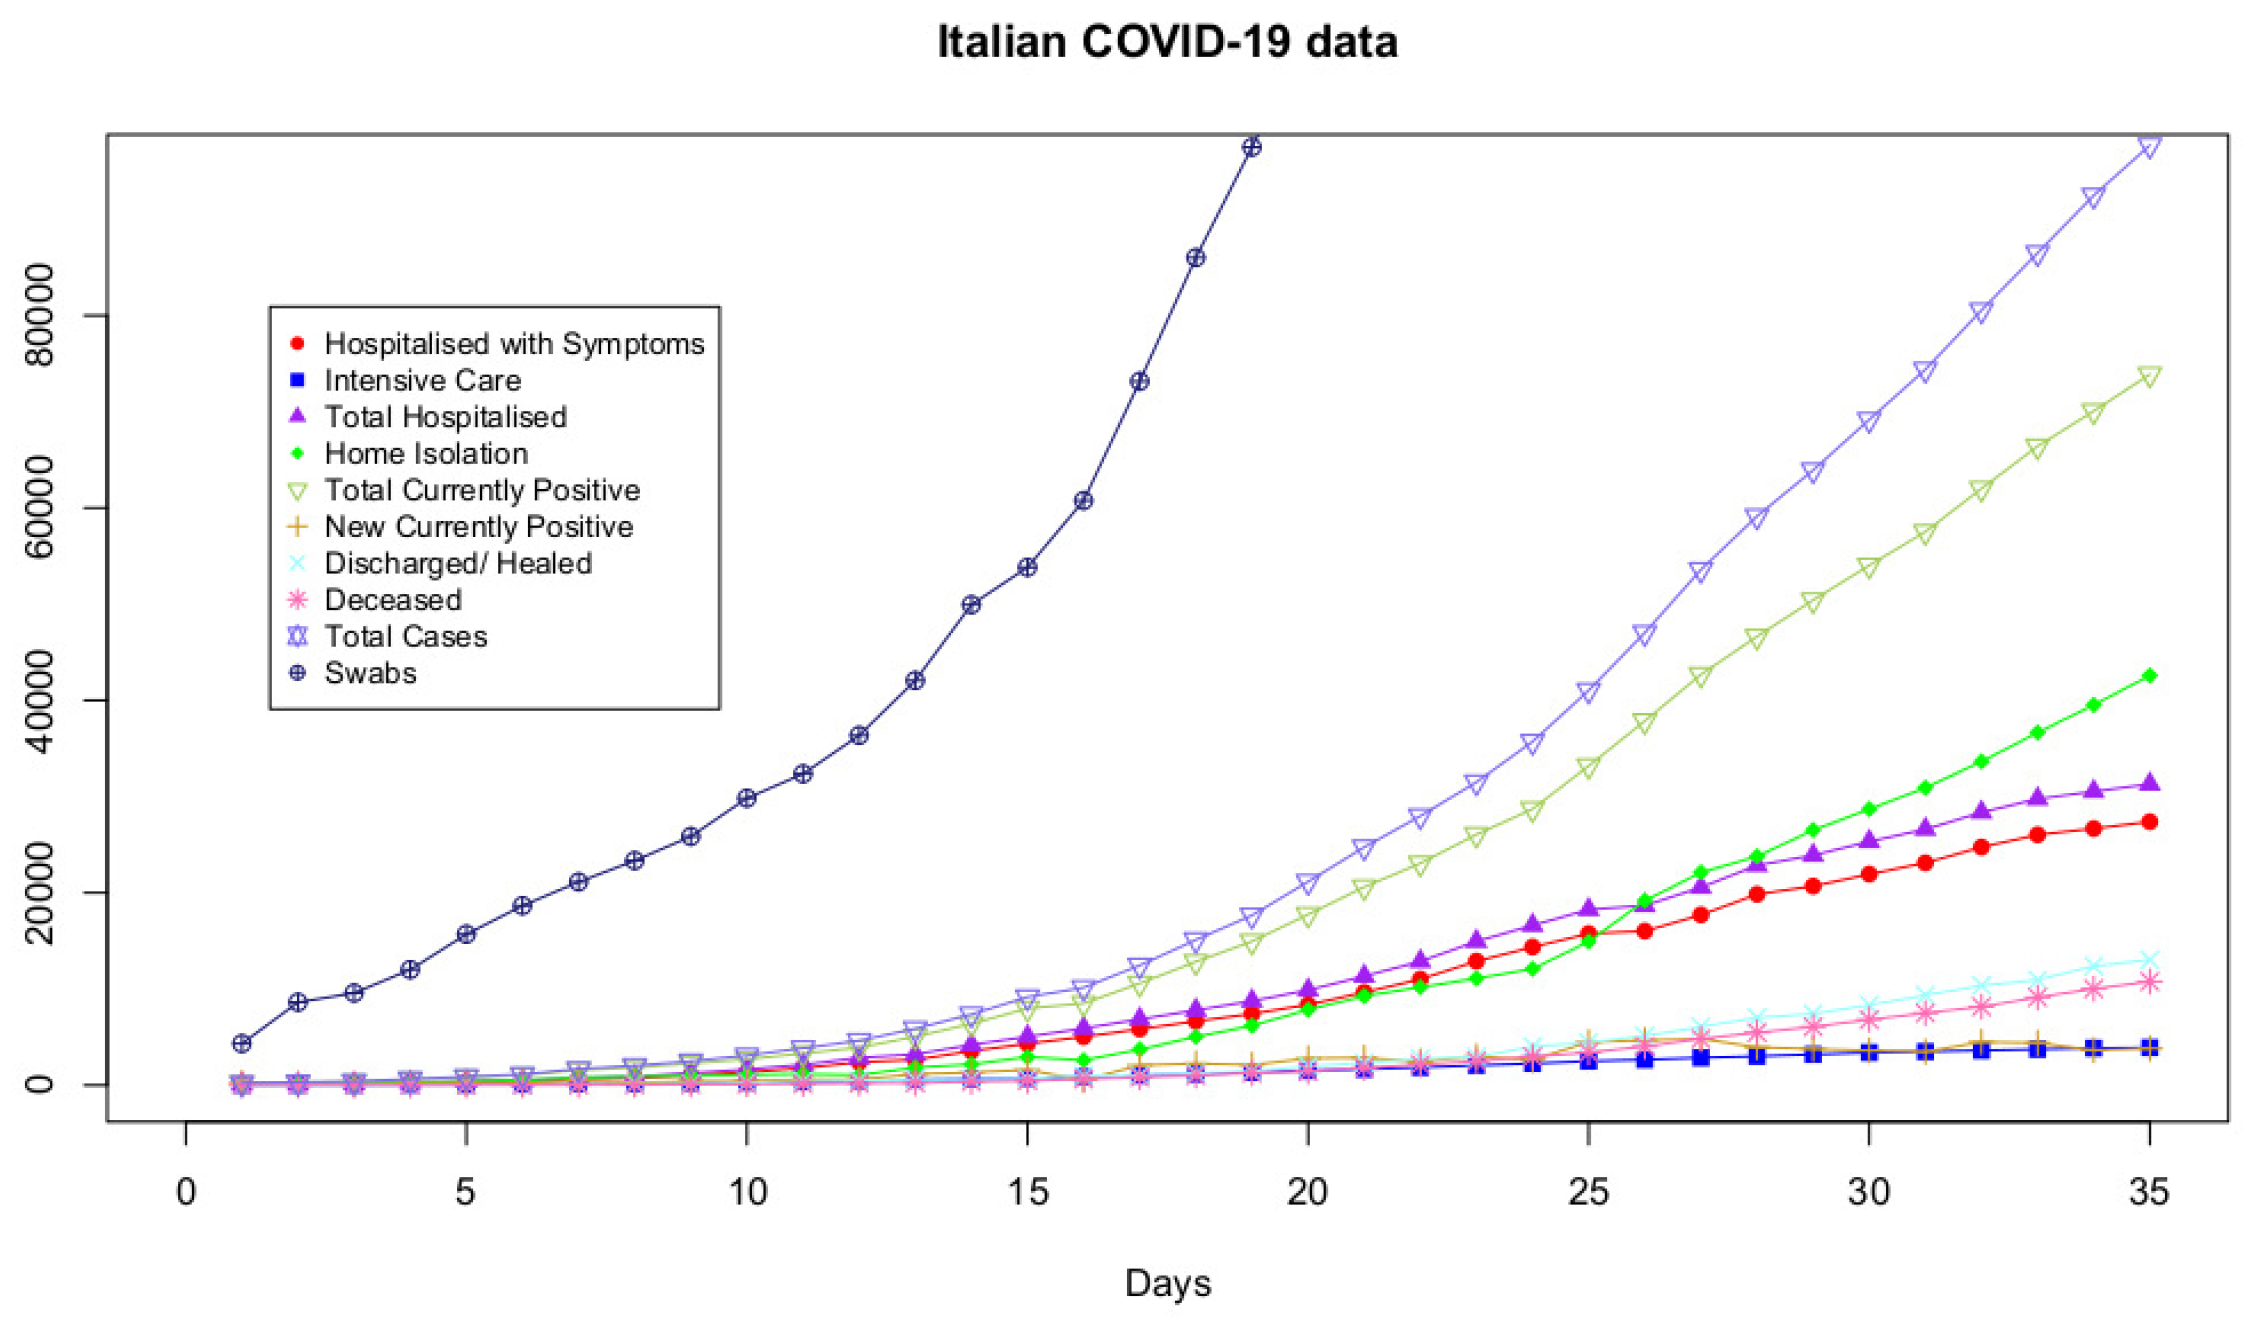
3.1. Input DataSet
- Hospitalized with Symptoms, the numbers of hospitalized patients that present COVID-19 symptoms;
- Intensive Care, the numbers of hospitalized patients in Intensive Care Units;
- Total Hospitalized, the total numbers of hospitalized patients;
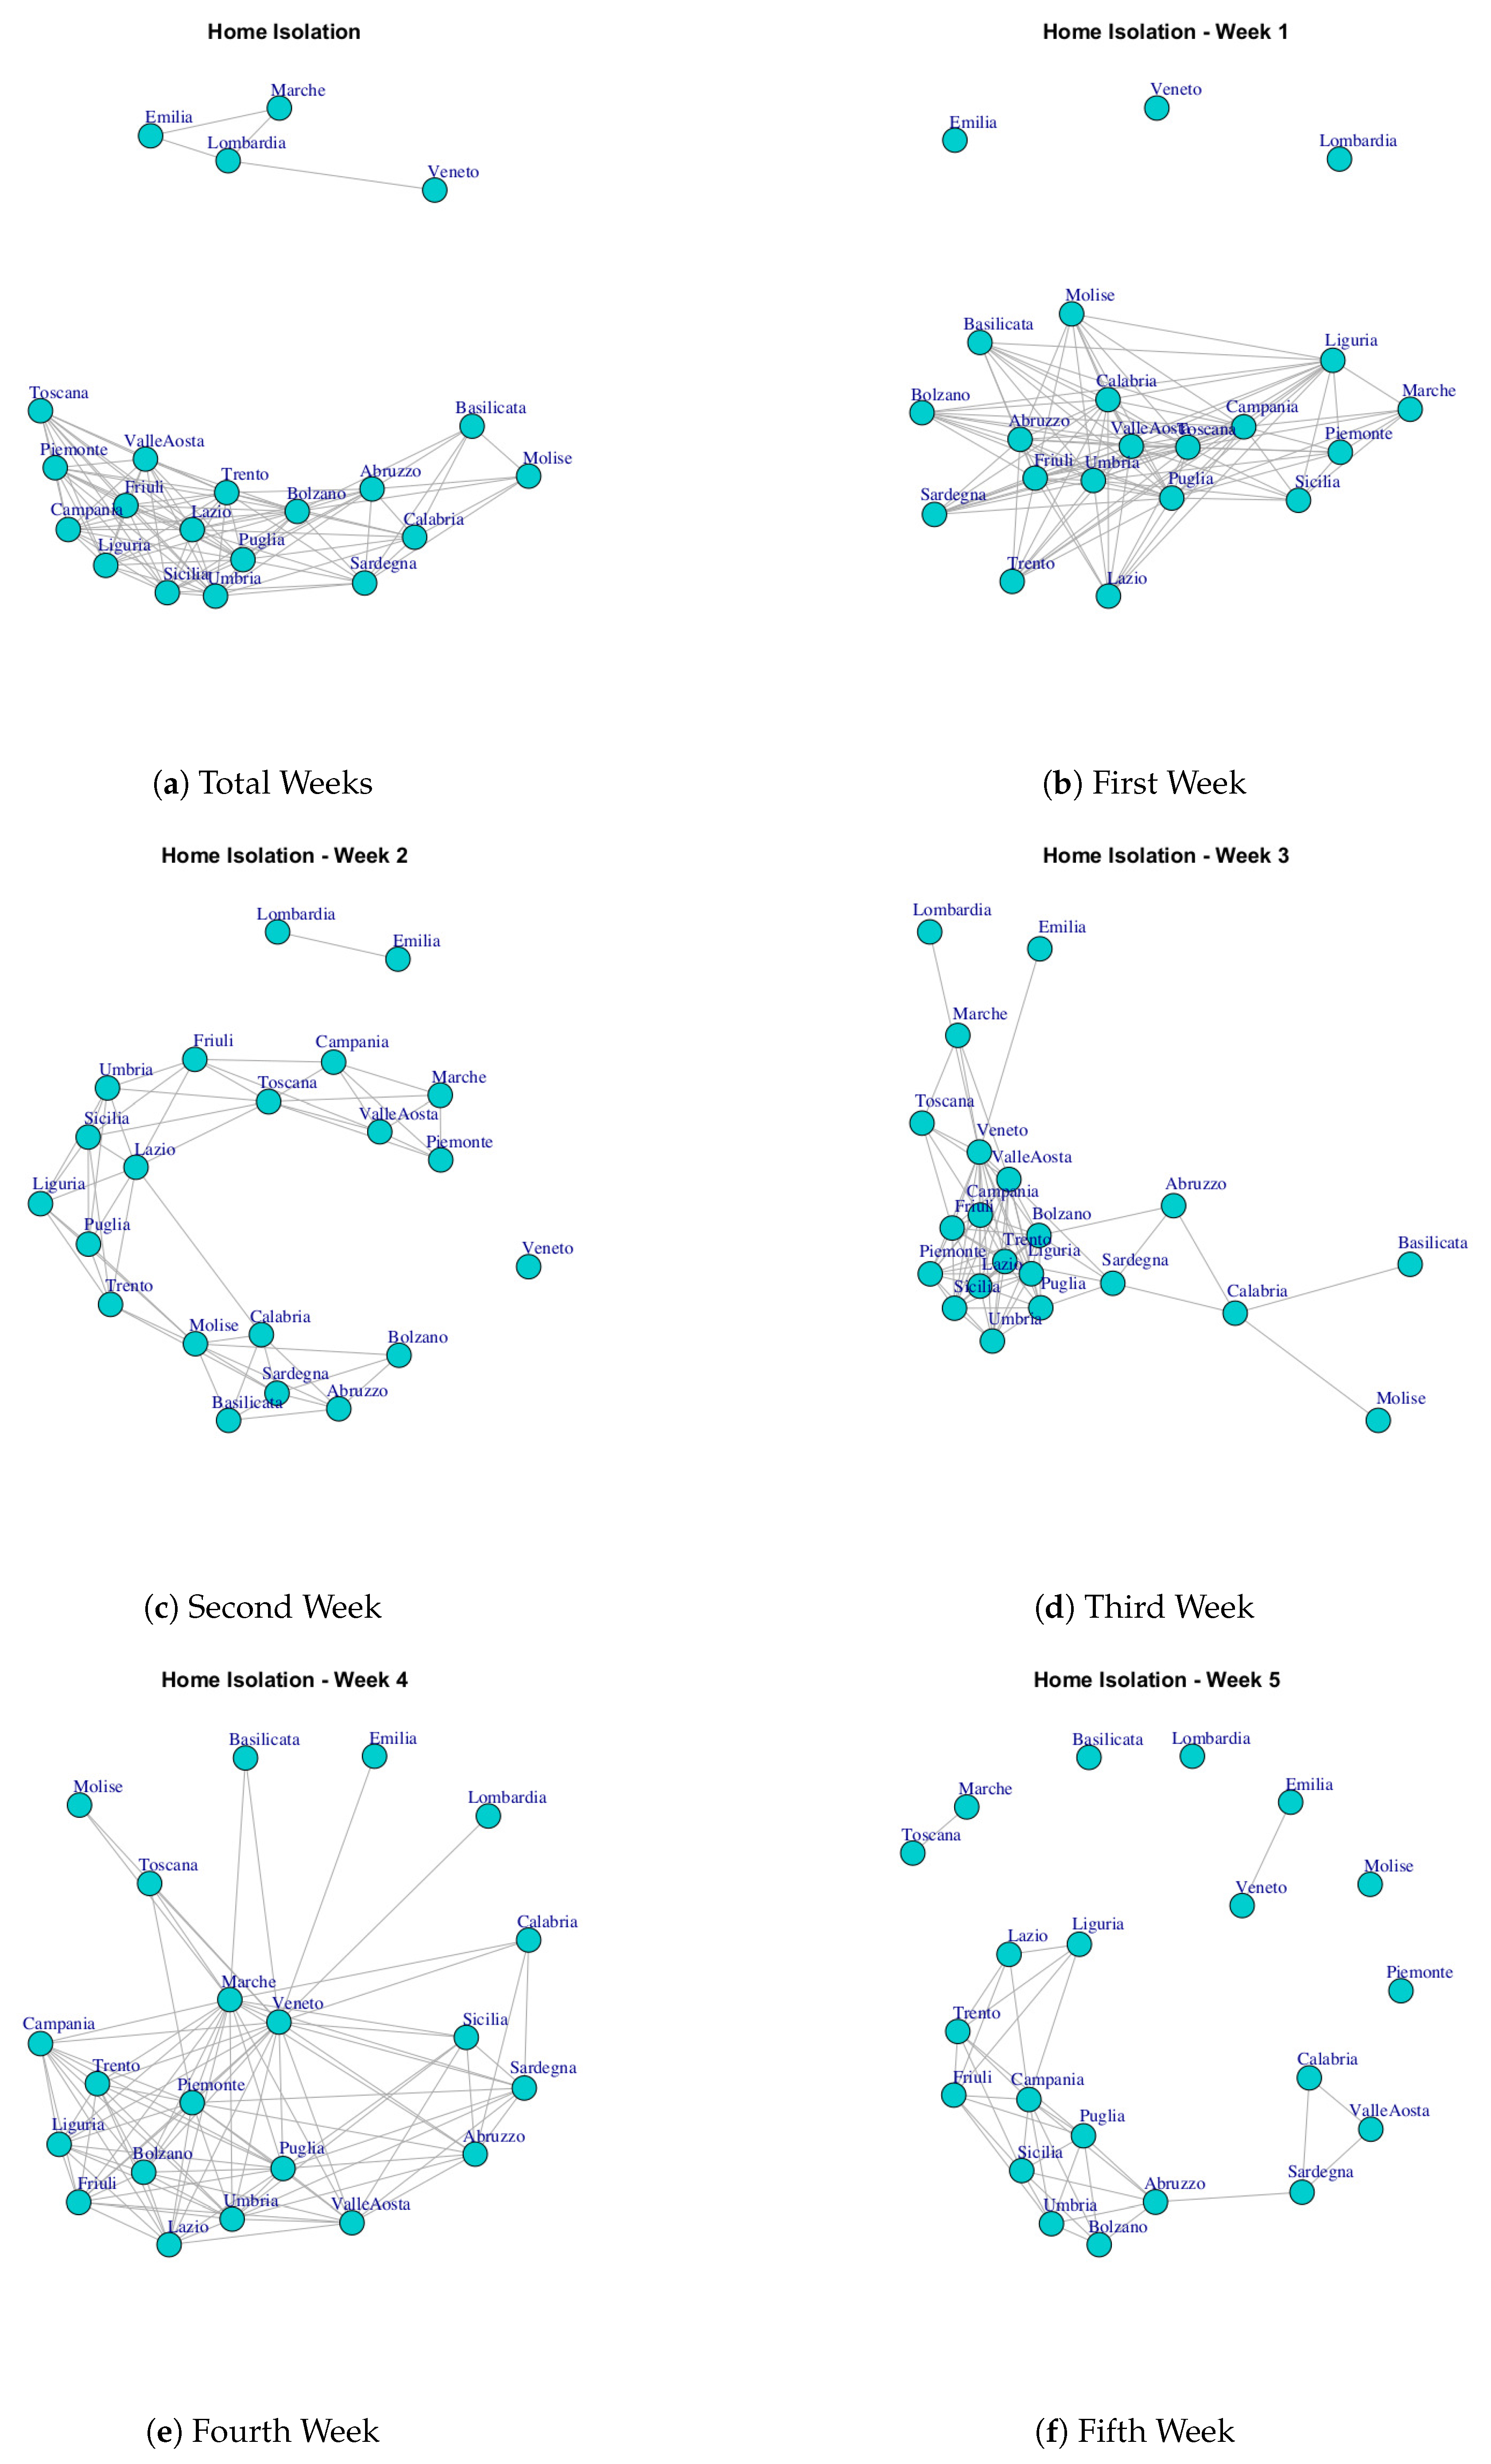
- Home Isolation, the numbers of subjects that are in isolation at home;
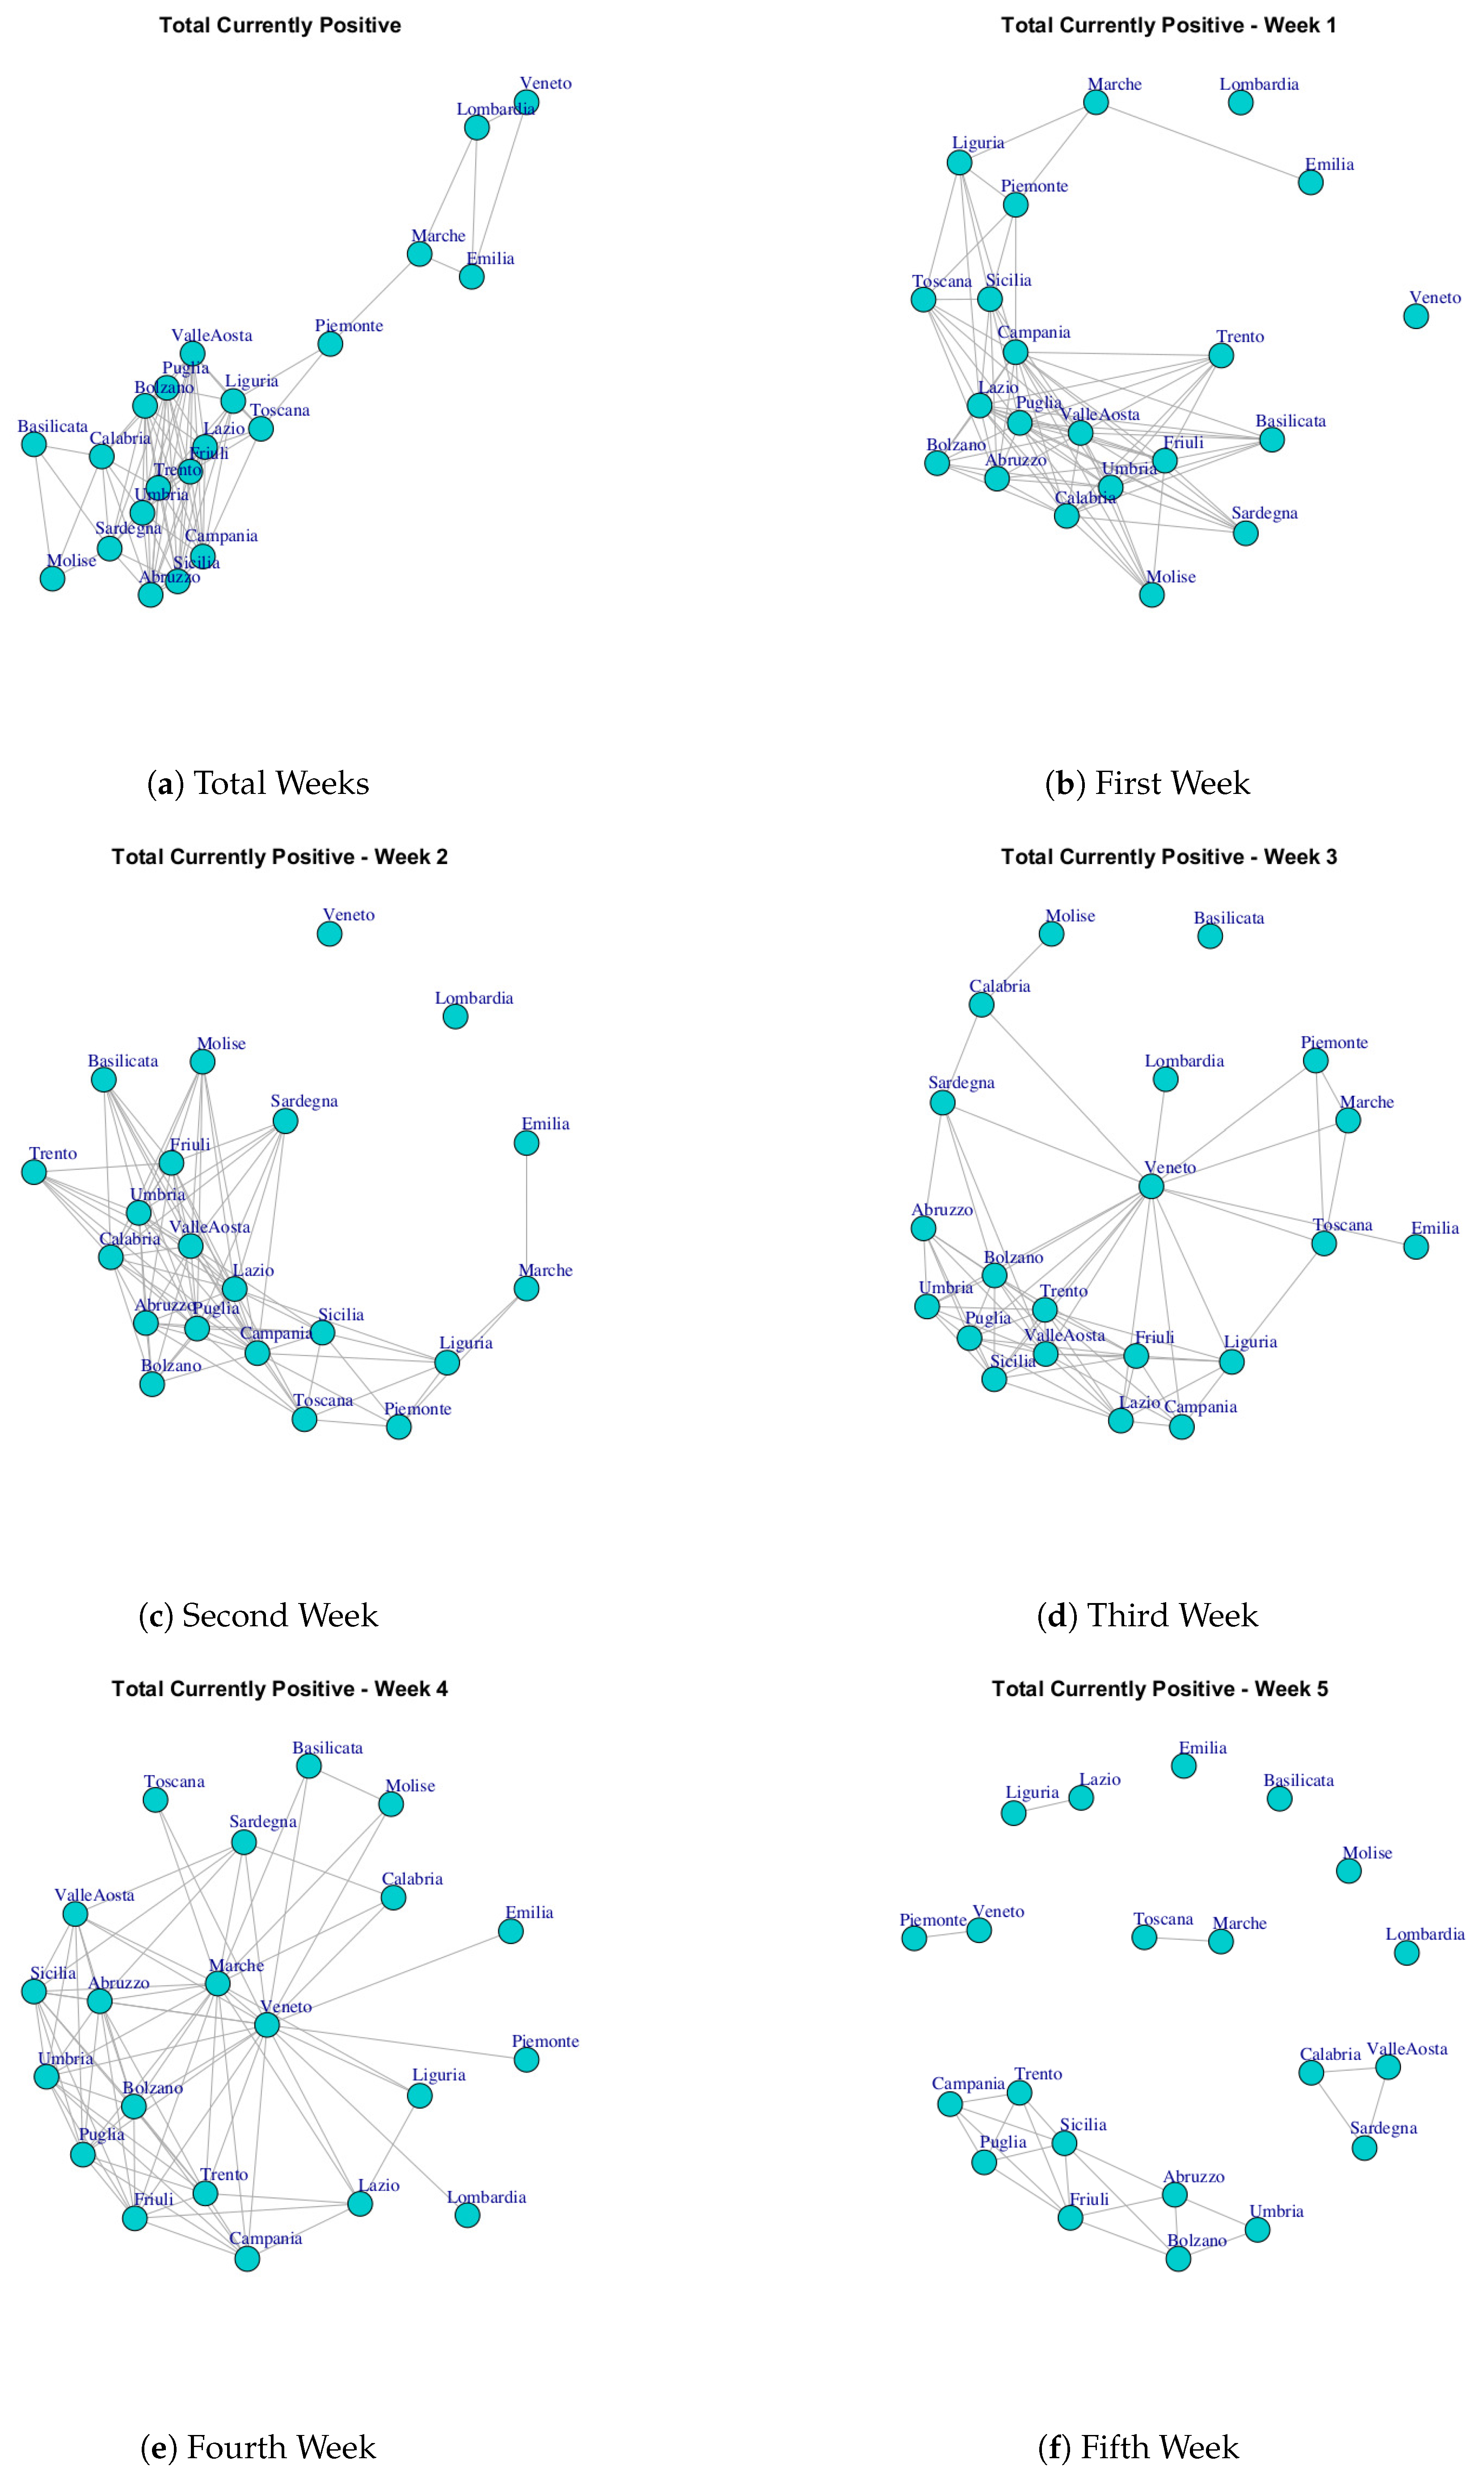
- Total Currently Positive, the numbers of subjects that are coronavirus positive;
- New Currently Positive, the numbers of subjects that are daily coronavirus positive;
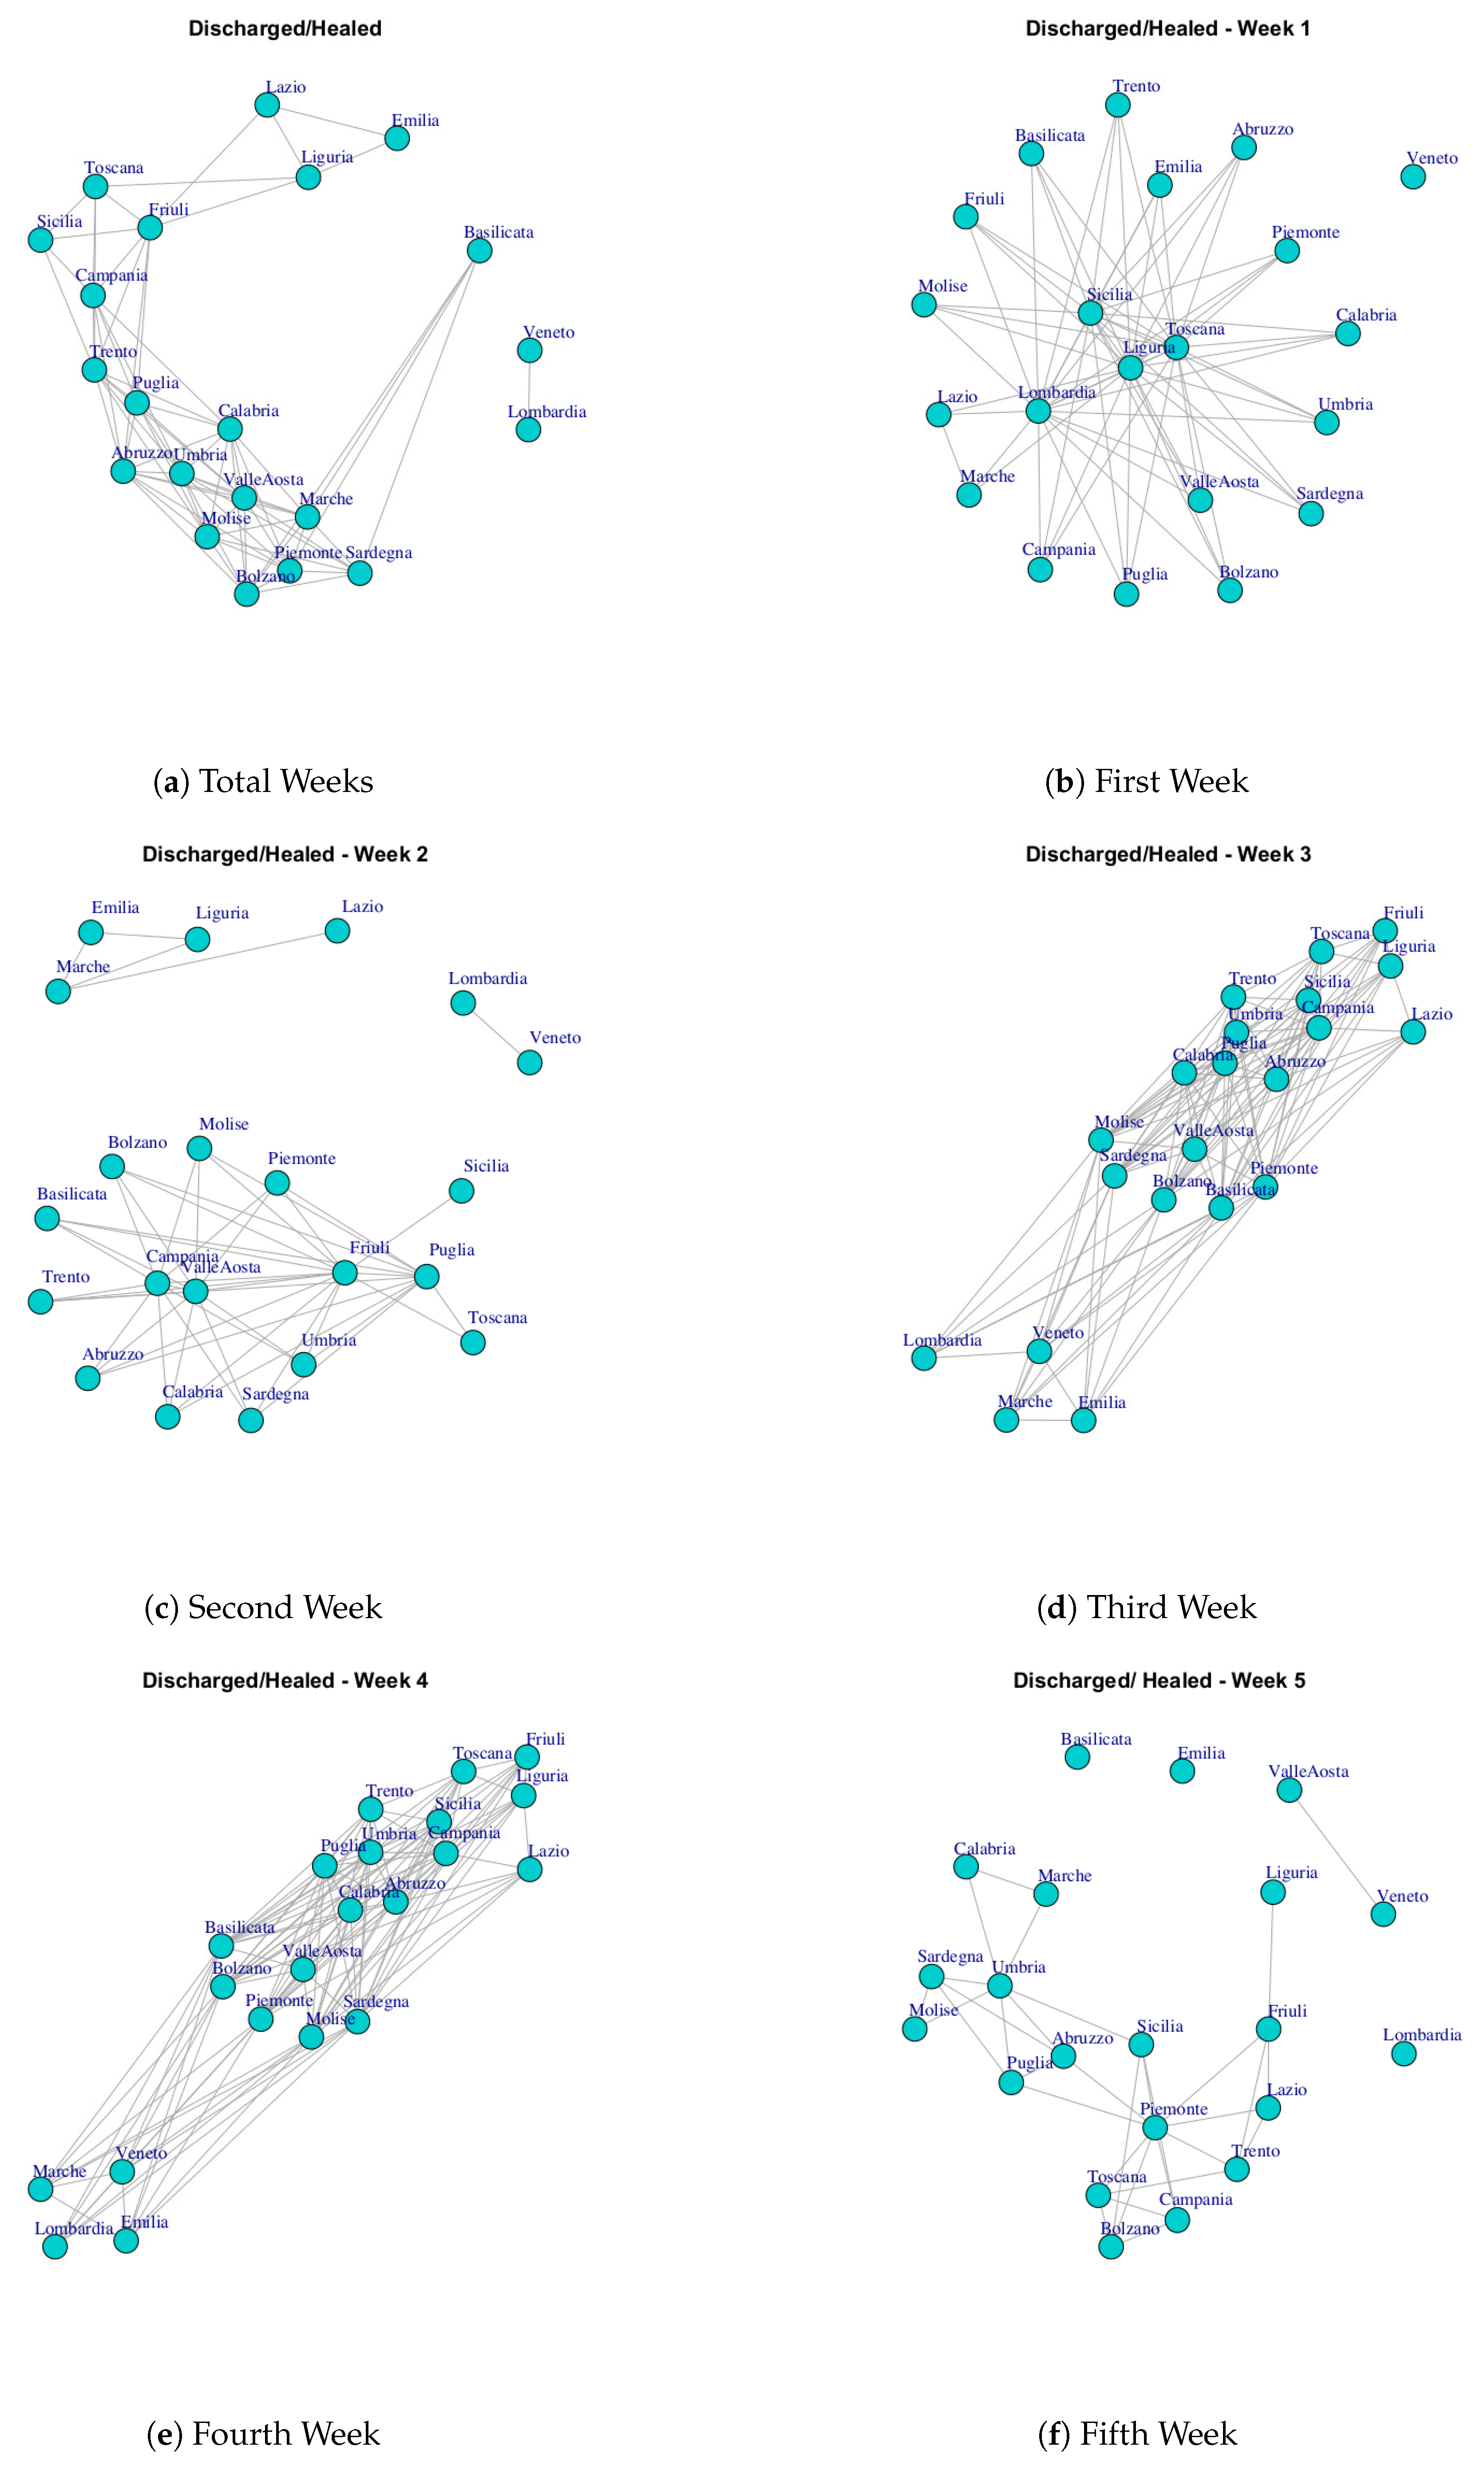
- Discharged/Healed the numbers of subjects that are healed from the disease;
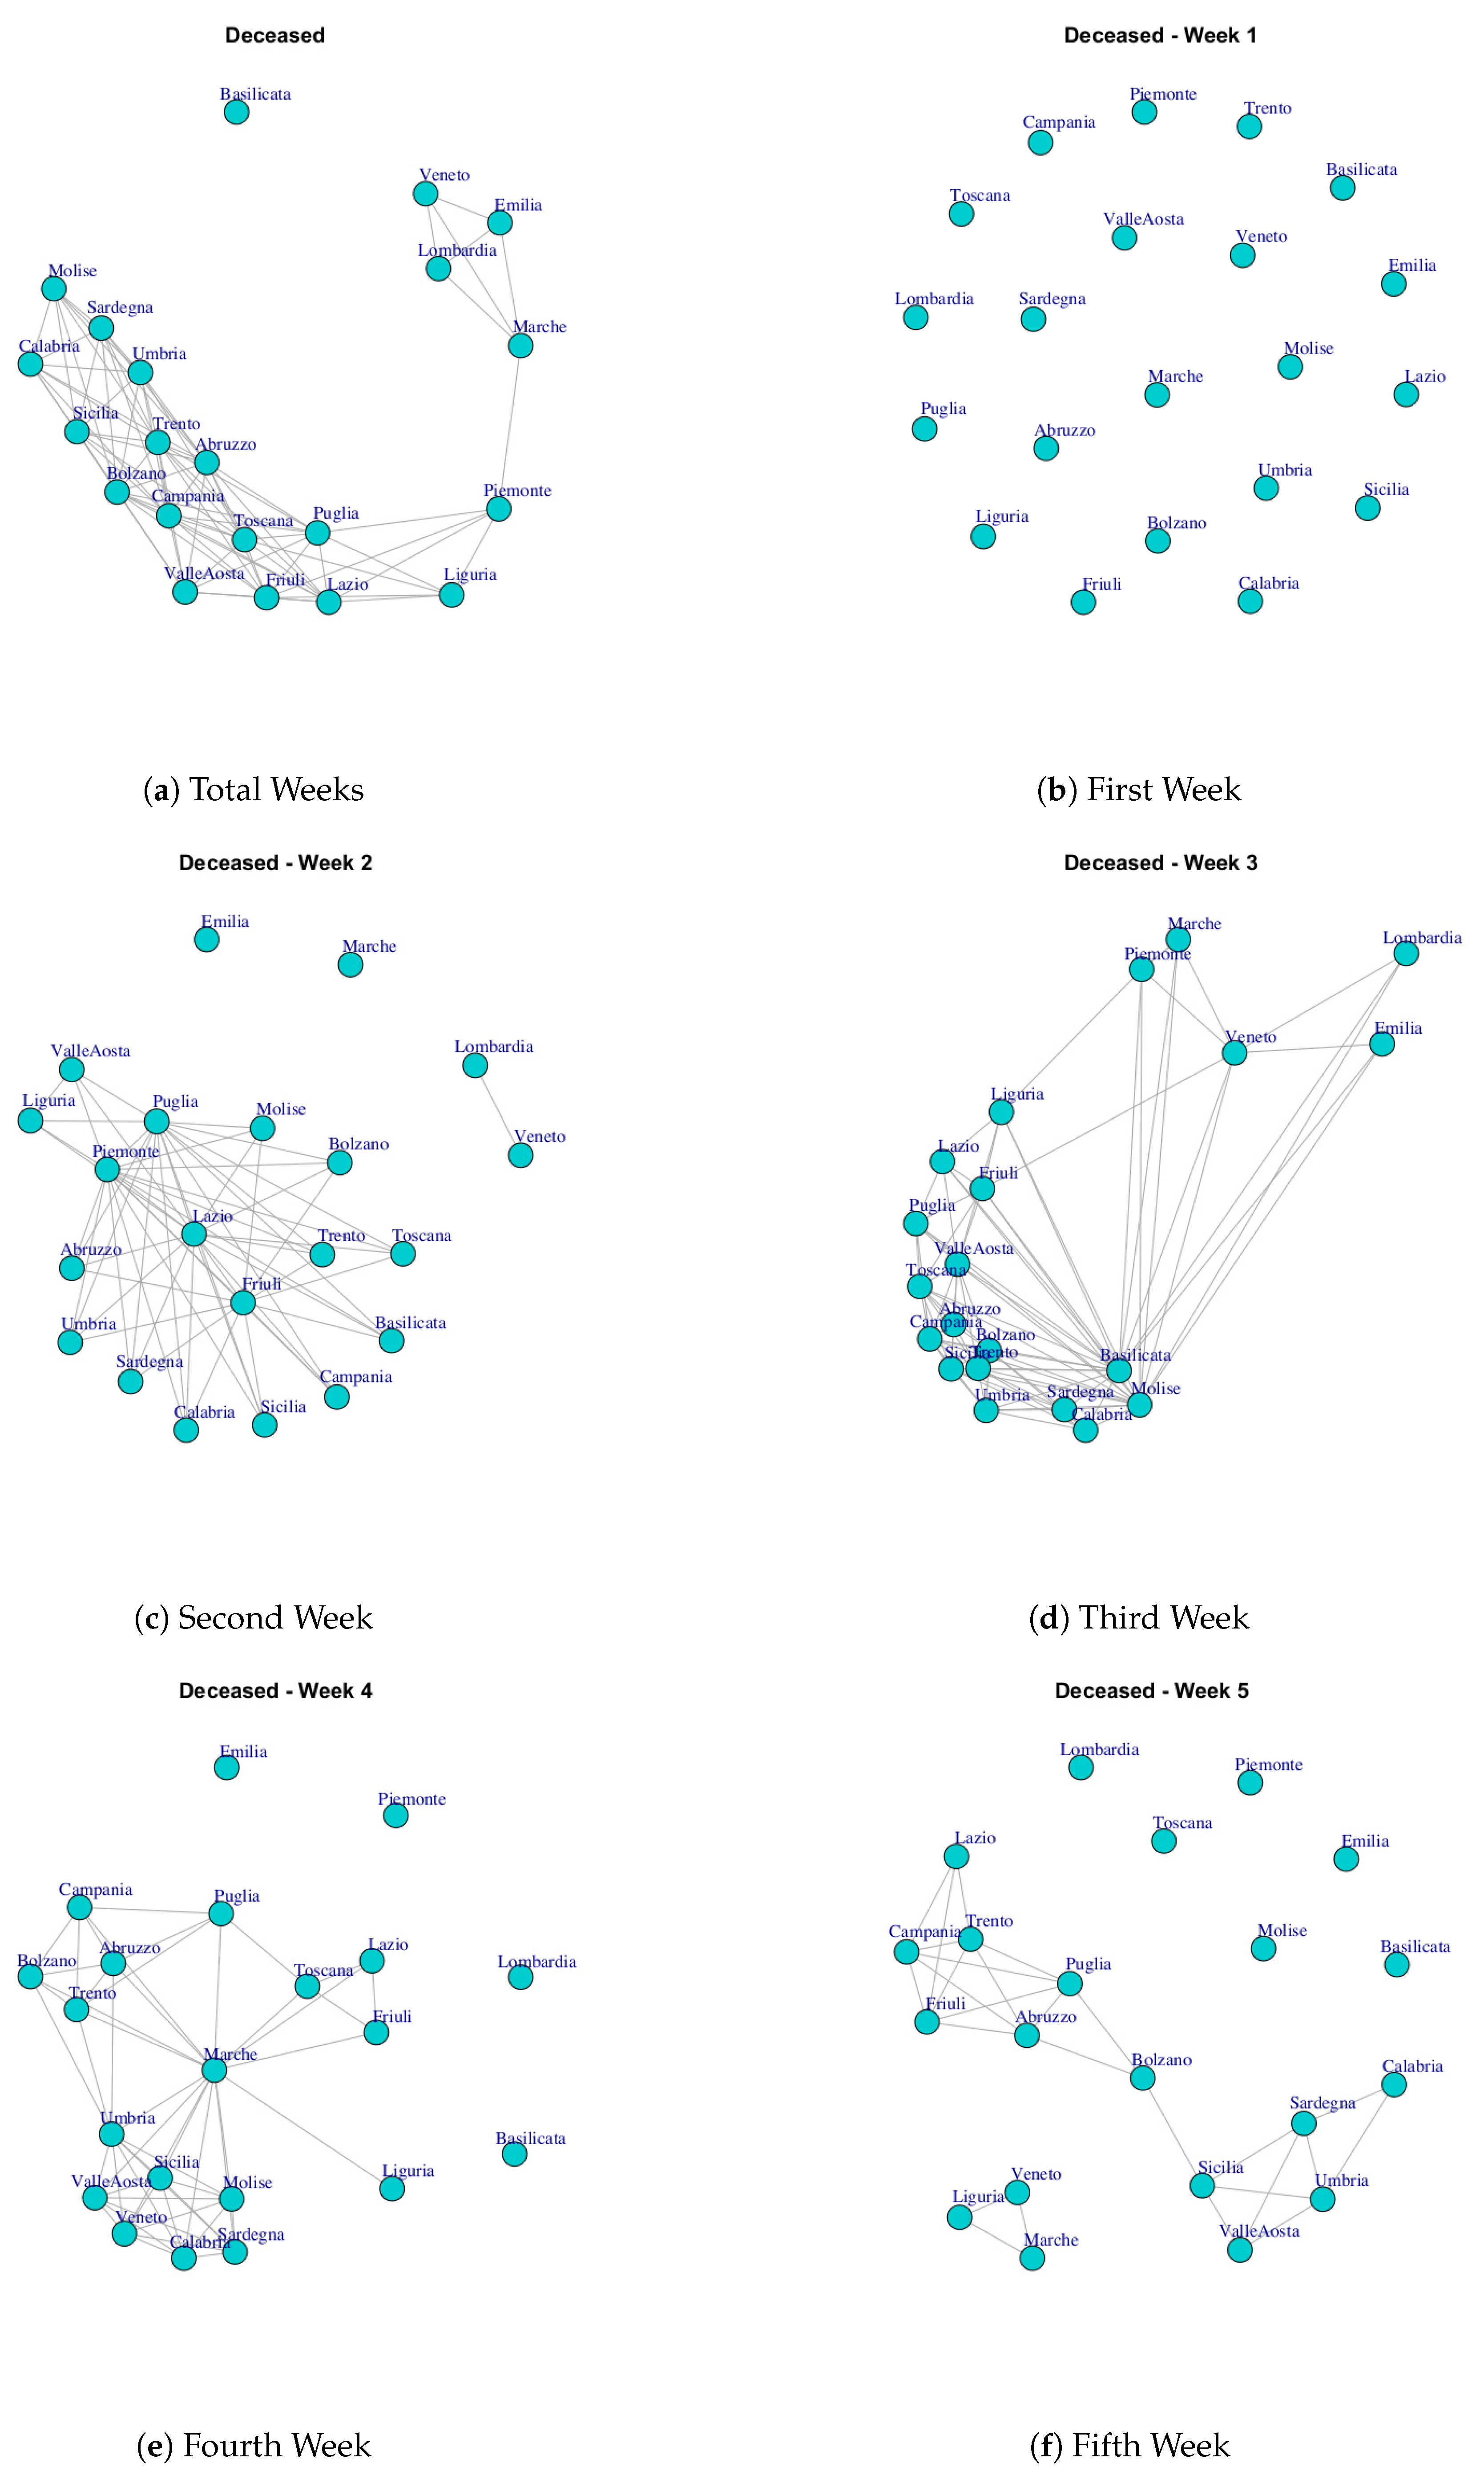
- Deceased, the numbers of dead patients;
- Total Cases, the numbers of subjects affected by COVID-19;
- Swabs, the numbers of test swab carried on positive subjects and on subjects with suspected positivity.
3.2. Building of Similarity Matrices
- The first week starts on 24 February and ends on 1 March;
- The second starts on 1 March and ends on 8 March;
- The third starts on 9 March and ends on 15 March;
- The fourth starts on 16 March and ends on 22 March;
- The fifth starts on 23 March and ends on 29 March.
3.2.1. Wilcoxon Sum Rank Test
3.2.2. Kruskal–Wallis Sum Rank Test
3.2.3. Multiple Linear Regression
3.3. Mapping Similarity Matrices to Networks
3.4. Community Detection
4. Discussion
5. Conclusions
Author Contributions
Funding
Acknowledgments
Conflicts of Interest
Appendix A. Statistical Analysis


| Abruzzo | Basilicata | Bolzano | Calabria | Campania | Emilia | Friuli | Lazio | Liguria | Lombardi | Marche | Molise | Piemonte | Puglia | Sardegna | Sicilia | Toscana | Trento | Umbria | ValleAosta | Veneto | |
|---|---|---|---|---|---|---|---|---|---|---|---|---|---|---|---|---|---|---|---|---|---|
| Abruzzo | 1 | 0 | 0.287 | 0 | 0.456 | 0 | 0.463 | 0.092 | 0 | 0 | 0 | 0 | 0 | 0.809 | 0 | 0.914 | 0 | 0.576 | 0.06 | 0.6 | 0 |
| Basilicata | 0 | 1 | 0 | 0 | 0 | 0 | 0 | 0 | 0 | 0 | 0 | 0 | 0 | 0 | 0 | 0 | 0 | 0 | 0 | 0 | 0 |
| Bolzano | 0.287 | 0 | 1 | 0.175 | 0.089 | 0 | 0.893 | 0 | 0 | 0 | 0 | 0 | 0 | 0.209 | 0.182 | 0.357 | 0 | 0.958 | 0.303 | 0.782 | 0 |
| Calabria | 0 | 0 | 0.175 | 1 | 0 | 0 | 0.125 | 0 | 0 | 0 | 0 | 0.157 | 0 | 0 | 0.897 | 0.055 | 0 | 0.229 | 0.718 | 0.121 | 0 |
| Campania | 0.456 | 0 | 0.089 | 0 | 1 | 0 | 0.252 | 0.271 | 0.131 | 0 | 0 | 0 | 0 | 0.742 | 0 | 0.412 | 0.106 | 0.247 | 0 | 0.216 | 0 |
| Emilia | 0 | 0 | 0 | 0 | 0 | 1 | 0 | 0 | 0 | 0.273 | 0.163 | 0 | 0.091 | 0 | 0 | 0 | 0 | 0 | 0 | 0 | 0.991 |
| Friuli | 0.463 | 0 | 0.893 | 0.125 | 0.252 | 0 | 1 | 0 | 0 | 0 | 0 | 0 | 0 | 0.319 | 0.113 | 0.472 | 0 | 0.874 | 0.231 | 0.871 | 0 |
| Lazio | 0.092 | 0 | 0 | 0 | 0.271 | 0 | 0 | 1 | 0.712 | 0 | 0 | 0 | 0 | 0.15 | 0 | 0.071 | 0.582 | 0 | 0 | 0 | 0 |
| Liguria | 0 | 0 | 0 | 0 | 0.131 | 0 | 0 | 0.712 | 1 | 0 | 0 | 0 | 0.08 | 0.051 | 0 | 0 | 0.925 | 0 | 0 | 0 | 0 |
| Lombardi | 0 | 0 | 0 | 0 | 0 | 0.273 | 0 | 0 | 0 | 1 | 0.149 | 0 | 0 | 0 | 0 | 0 | 0 | 0 | 0 | 0 | 0.497 |
| Marche | 0 | 0 | 0 | 0 | 0 | 0.163 | 0 | 0 | 0 | 0.149 | 1 | 0 | 0.634 | 0 | 0 | 0 | 0 | 0 | 0 | 0 | 0 |
| Molise | 0 | 0 | 0 | 0.157 | 0 | 0 | 0 | 0 | 0 | 0 | 0 | 1 | 0 | 0 | 0.171 | 0 | 0 | 0 | 0.168 | 0 | 0 |
| Piemonte | 0 | 0 | 0 | 0 | 0 | 0.091 | 0 | 0 | 0.08 | 0 | 0.634 | 0 | 1 | 0 | 0 | 0 | 0.075 | 0 | 0 | 0 | 0.189 |
| Puglia | 0.809 | 0 | 0.209 | 0 | 0.742 | 0 | 0.319 | 0.15 | 0.051 | 0 | 0 | 0 | 0 | 1 | 0 | 0.701 | 0.051 | 0.343 | 0 | 0.329 | 0 |
| Sardegna | 0 | 0 | 0.182 | 0.897 | 0 | 0 | 0.113 | 0 | 0 | 0 | 0 | 0.171 | 0 | 0 | 1 | 0 | 0 | 0.226 | 0.745 | 0.079 | 0 |
| Sicilia | 0.914 | 0 | 0.357 | 0.055 | 0.412 | 0 | 0.472 | 0.071 | 0 | 0 | 0 | 0 | 0 | 0.701 | 0 | 1 | 0 | 0.519 | 0.089 | 0.643 | 0 |
| Toscana | 0 | 0 | 0 | 0 | 0.106 | 0 | 0 | 0.582 | 0.925 | 0 | 0 | 0 | 0.075 | 0.051 | 0 | 0 | 1 | 0 | 0 | 0 | 0 |
| Trento | 0.576 | 0 | 0.958 | 0.229 | 0.247 | 0 | 0.874 | 0 | 0 | 0 | 0 | 0 | 0 | 0.343 | 0.226 | 0.519 | 0 | 1 | 0.353 | 0.958 | 0 |
| Umbria | 0.06 | 0 | 0.303 | 0.718 | 0 | 0 | 0.231 | 0 | 0 | 0 | 0 | 0.168 | 0 | 0 | 0.745 | 0.089 | 0 | 0.353 | 1 | 0.209 | 0 |
| ValleAosta | 0.6 | 0 | 0.782 | 0.121 | 0.216 | 0 | 0.871 | 0 | 0 | 0 | 0 | 0 | 0 | 0.329 | 0.079 | 0.643 | 0 | 0.958 | 0.209 | 1 | 0 |
| Veneto | 0 | 0 | 0 | 0 | 0 | 0.991 | 0 | 0 | 0 | 0.497 | 0 | 0 | 0.189 | 0 | 0 | 0 | 0 | 0 | 0 | 0 | 1 |
| Abruzzo | Basilicata | Bolzano | Calabria | Campania | Emilia | Friuli | Lazio | Liguria | Lombardi | Marche | Molise | Piemonte | Puglia | Sardegna | Sicilia | Toscana | Trento | Umbria | ValleAosta | Veneto | |
|---|---|---|---|---|---|---|---|---|---|---|---|---|---|---|---|---|---|---|---|---|---|
| Abruzzo | 1 | 0 | 0 | 0 | 0.08 | 0 | 0 | 0 | 0 | 0 | 0 | 0 | 0 | 0.25 | 0 | 0.27 | 0 | 0 | 0 | 0.12 | 0 |
| Basilicata | 0 | 1 | 0 | 0.37 | 0 | 0 | 0 | 0 | 0 | 0 | 0 | 0 | 0 | 0 | 0.06 | 0 | 0 | 0 | 0 | 0 | 0 |
| Bolzano | 0 | 0 | 1 | 0.21 | 0 | 0 | 0.95 | 0 | 0 | 0 | 0 | 0.95 | 0 | 0.12 | 0.64 | 0.13 | 0 | 0.79 | 0.78 | 0 | 0 |
| Calabria | 0 | 0.37 | 0.21 | 1 | 0 | 0 | 0.1 | 0 | 0 | 0 | 0 | 0.09 | 0 | 0 | 0.46 | 0 | 0 | 0.24 | 0.35 | 0 | 0 |
| Campania | 0.08 | 0 | 0 | 0 | 1 | 0 | 0 | 0.34 | 0.65 | 0 | 0 | 0 | 0 | 0.05 | 0 | 0.06 | 0.22 | 0 | 0 | 0.34 | 0 |
| Emilia | 0 | 0 | 0 | 0 | 0 | 1 | 0 | 0 | 0 | 0 | 0 | 0 | 0 | 0 | 0 | 0 | 0 | 0 | 0 | 0 | 0 |
| Friuli | 0 | 0 | 0.95 | 0.1 | 0 | 0 | 1 | 0 | 0 | 0 | 0 | 0.43 | 0 | 0.33 | 0.2 | 0.22 | 0 | 0.6 | 0.19 | 0 | 0 |
| Lazio | 0 | 0 | 0 | 0 | 0.34 | 0 | 0 | 1 | 0.48 | 0 | 0 | 0 | 0.18 | 0 | 0 | 0 | 0.61 | 0 | 0 | 0.8 | 0 |
| Liguria | 0 | 0 | 0 | 0 | 0.65 | 0 | 0 | 0.48 | 1 | 0 | 0 | 0 | 0 | 0 | 0 | 0 | 0.4 | 0 | 0 | 0.44 | 0 |
| Lombardi | 0 | 0 | 0 | 0 | 0 | 0 | 0 | 0 | 0 | 1 | 0 | 0 | 0 | 0 | 0 | 0 | 0 | 0 | 0 | 0 | 0.53 |
| Marche | 0 | 0 | 0 | 0 | 0 | 0 | 0 | 0 | 0 | 0 | 1 | 0 | 0.26 | 0 | 0 | 0 | 0 | 0 | 0 | 0 | 0 |
| Molise | 0 | 0 | 0.95 | 0.09 | 0 | 0 | 0.43 | 0 | 0 | 0 | 0 | 1 | 0 | 0.13 | 0.12 | 0.11 | 0 | 0.9 | 0.1 | 0 | 0 |
| Piemonte | 0 | 0 | 0 | 0 | 0 | 0 | 0 | 0.18 | 0 | 0 | 0.26 | 0 | 1 | 0 | 0 | 0 | 0.31 | 0 | 0 | 0.25 | 0 |
| Puglia | 0.25 | 0 | 0.12 | 0 | 0.05 | 0 | 0.33 | 0 | 0 | 0 | 0 | 0.13 | 0 | 1 | 0 | 0.74 | 0 | 0.16 | 0 | 0 | 0 |
| Sardegna | 0 | 0.06 | 0.64 | 0.46 | 0 | 0 | 0.2 | 0 | 0 | 0 | 0 | 0.12 | 0 | 0 | 1 | 0 | 0 | 0.56 | 0.89 | 0 | 0 |
| Sicilia | 0.27 | 0 | 0.13 | 0 | 0.06 | 0 | 0.22 | 0 | 0 | 0 | 0 | 0.11 | 0 | 0.74 | 0 | 1 | 0 | 0.09 | 0 | 0.05 | 0 |
| Toscana | 0 | 0 | 0 | 0 | 0.22 | 0 | 0 | 0.61 | 0.4 | 0 | 0 | 0 | 0.31 | 0 | 0 | 0 | 1 | 0 | 0 | 0.85 | 0 |
| Trento | 0 | 0 | 0.79 | 0.24 | 0 | 0 | 0.6 | 0 | 0 | 0 | 0 | 0.9 | 0 | 0.16 | 0.56 | 0.09 | 0 | 1 | 0.64 | 0 | 0 |
| Umbria | 0 | 0 | 0.78 | 0.35 | 0 | 0 | 0.19 | 0 | 0 | 0 | 0 | 0.1 | 0 | 0 | 0.89 | 0 | 0 | 0.64 | 1 | 0 | 0 |
| ValleAosta | 0.12 | 0 | 0 | 0 | 0.34 | 0 | 0 | 0.8 | 0.44 | 0 | 0 | 0 | 0.25 | 0 | 0 | 0.05 | 0.85 | 0 | 0 | 1 | 0 |
| Veneto | 0 | 0 | 0 | 0 | 0 | 0 | 0 | 0 | 0 | 0.53 | 0 | 0 | 0 | 0 | 0 | 0 | 0 | 0 | 0 | 0 | 1 |
| Abruzzo | Basilicata | Bolzano | Calabria | Campania | Emilia | Friuli | Lazio | Liguria | Lombardi | Marche | Molise | Piemonte | Puglia | Sardegna | Sicilia | Toscana | Trento | Umbria | ValleAosta | Veneto | |
|---|---|---|---|---|---|---|---|---|---|---|---|---|---|---|---|---|---|---|---|---|---|
| Abruzzo | 1 | 0 | 0.14 | 0 | 0.083 | 0 | 0.848 | 0 | 0 | 0 | 0 | 0 | 0 | 0.179 | 0 | 0.607 | 0 | 0.654 | 0 | 0.337 | 0 |
| Basilicata | 0 | 1 | 0 | 0 | 0 | 0 | 0 | 0 | 0 | 0 | 0 | 0 | 0 | 0 | 0 | 0 | 0 | 0 | 0 | 0 | 0 |
| Bolzano | 0.14 | 0 | 1 | 0.561 | 0 | 0 | 0.11 | 0 | 0 | 0 | 0 | 0 | 0 | 0 | 0.14 | 0.159 | 0 | 0.084 | 0.518 | 0.654 | 0 |
| Calabria | 0 | 0 | 0.561 | 1 | 0 | 0 | 0 | 0 | 0 | 0 | 0 | 0 | 0 | 0 | 0.479 | 0 | 0 | 0 | 0.747 | 0.179 | 0 |
| Campania | 0.083 | 0 | 0 | 0 | 1 | 0 | 0.277 | 0.11 | 0 | 0 | 0 | 0 | 0 | 0.848 | 0 | 0 | 0 | 0.37 | 0 | 0.096 | 0 |
| Emilia | 0 | 0 | 0 | 0 | 0 | 1 | 0 | 0 | 0 | 0 | 0 | 0 | 0 | 0 | 0 | 0 | 0 | 0 | 0 | 0 | 0.056 |
| Friuli | 0.848 | 0 | 0.11 | 0 | 0.277 | 0 | 1 | 0 | 0 | 0 | 0 | 0 | 0 | 0.318 | 0 | 0.701 | 0 | 0.902 | 0 | 0.37 | 0.056 |
| Lazio | 0 | 0 | 0 | 0 | 0.11 | 0 | 0 | 1 | 0.62 | 0 | 0 | 0 | 0 | 0.165 | 0 | 0 | 0.456 | 0 | 0 | 0 | 0.056 |
| Liguria | 0 | 0 | 0 | 0 | 0 | 0 | 0 | 0.62 | 1 | 0 | 0 | 0 | 0 | 0.097 | 0 | 0 | 0.609 | 0 | 0 | 0 | 0.056 |
| Lombardi | 0 | 0 | 0 | 0 | 0 | 0 | 0 | 0 | 0 | 1 | 0 | 0 | 0 | 0 | 0 | 0 | 0 | 0 | 0 | 0 | 0.056 |
| Marche | 0 | 0 | 0 | 0 | 0 | 0 | 0 | 0 | 0 | 0 | 1 | 0 | 0.805 | 0 | 0 | 0 | 0 | 0 | 0 | 0 | 0.056 |
| Molise | 0 | 0 | 0 | 0 | 0 | 0 | 0 | 0 | 0 | 0 | 0 | 1 | 0 | 0 | 0 | 0 | 0 | 0 | 0 | 0 | 0 |
| Piemonte | 0 | 0 | 0 | 0 | 0 | 0 | 0 | 0 | 0 | 0 | 0.805 | 0 | 1 | 0 | 0 | 0 | 0 | 0 | 0 | 0 | 0.056 |
| Puglia | 0.179 | 0 | 0 | 0 | 0.848 | 0 | 0.318 | 0.165 | 0.097 | 0 | 0 | 0 | 0 | 1 | 0 | 0.073 | 0 | 0.276 | 0 | 0 | 0.056 |
| Sardegna | 0 | 0 | 0.14 | 0.479 | 0 | 0 | 0 | 0 | 0 | 0 | 0 | 0 | 0 | 0 | 1 | 0 | 0 | 0 | 0.949 | 0 | 0 |
| Sicilia | 0.607 | 0 | 0.159 | 0 | 0 | 0 | 0.701 | 0 | 0 | 0 | 0 | 0 | 0 | 0.073 | 0 | 1 | 0 | 0.337 | 0 | 0.442 | 0.056 |
| Toscana | 0 | 0 | 0 | 0 | 0 | 0 | 0 | 0.456 | 0.609 | 0 | 0 | 0 | 0 | 0 | 0 | 0 | 1 | 0 | 0 | 0 | 0.056 |
| Trento | 0.654 | 0 | 0.084 | 0 | 0.37 | 0 | 0.902 | 0 | 0 | 0 | 0 | 0 | 0 | 0.276 | 0 | 0.337 | 0 | 1 | 0 | 0.481 | 0.056 |
| Umbria | 0 | 0 | 0.518 | 0.747 | 0 | 0 | 0 | 0 | 0 | 0 | 0 | 0 | 0 | 0 | 0.949 | 0 | 0 | 0 | 1 | 0.179 | 0 |
| ValleAosta | 0.337 | 0 | 0.654 | 0.179 | 0.096 | 0 | 0.37 | 0 | 0 | 0 | 0 | 0 | 0 | 0 | 0 | 0.442 | 0 | 0.481 | 0.179 | 1 | 0 |
| Veneto | 0 | 0 | 0 | 0 | 0 | 0.056 | 0.056 | 0.056 | 0.056 | 0.056 | 0.056 | 0 | 0.056 | 0.056 | 0 | 0.056 | 0.056 | 0.056 | 0 | 0 | 1 |
| Abruzzo | Basilicata | Bolzano | Calabria | Campania | Emilia | Friuli | Lazio | Liguria | Lombardi | Marche | Molise | Piemonte | Puglia | Sardegna | Sicilia | Toscana | Trento | Umbria | ValleAosta | Veneto | |
|---|---|---|---|---|---|---|---|---|---|---|---|---|---|---|---|---|---|---|---|---|---|
| Abruzzo | 1 | 0 | 0.084 | 0 | 0.337 | 0 | 0.62 | 0 | 0 | 0 | 0.209 | 0 | 0 | 0.456 | 0 | 1 | 0 | 0.535 | 0 | 0 | 0 |
| Basilicata | 0 | 1 | 0 | 0 | 0 | 0 | 0 | 0 | 0 | 0 | 0.159 | 0.276 | 0 | 0 | 0 | 0 | 0 | 0 | 0 | 0 | 0 |
| Bolzano | 0.084 | 0 | 1 | 0 | 0 | 0 | 0 | 0 | 0 | 0 | 0.209 | 0 | 0 | 0 | 0 | 0.128 | 0 | 0 | 0.383 | 0.096 | 0.096 |
| Calabria | 0 | 0 | 0 | 1 | 0 | 0 | 0 | 0 | 0 | 0 | 0.179 | 0 | 0 | 0 | 0.2 | 0 | 0 | 0 | 0.2 | 0.565 | 0.565 |
| Campania | 0.337 | 0 | 0 | 0 | 1 | 0 | 0.565 | 0 | 0 | 0 | 0.179 | 0 | 0 | 0.654 | 0 | 0.337 | 0 | 1 | 0 | 0 | 0 |
| Emilia | 0 | 0 | 0 | 0 | 0 | 1 | 0 | 0 | 0 | 0 | 0 | 0 | 0.535 | 0 | 0 | 0 | 0 | 0 | 0 | 0 | 0 |
| Friuli | 0.62 | 0 | 0 | 0 | 0.565 | 0 | 1 | 0 | 0 | 0 | 0.209 | 0 | 0 | 0 | 0 | 0.798 | 0 | 0.259 | 0 | 0 | 0 |
| Lazio | 0 | 0 | 0 | 0 | 0 | 0 | 0 | 1 | 0.902 | 0 | 0.201 | 0 | 0 | 0 | 0 | 0 | 0.62 | 0 | 0 | 0 | 0 |
| Liguria | 0 | 0 | 0 | 0 | 0 | 0 | 0 | 0.902 | 1 | 0 | 0.318 | 0 | 0 | 0 | 0 | 0 | 0.805 | 0 | 0 | 0 | 0 |
| Lombardi | 0 | 0 | 0 | 0 | 0 | 0 | 0 | 0 | 0 | 1 | 0 | 0 | 0 | 0 | 0 | 0 | 0 | 0 | 0 | 0 | 0 |
| Marche | 0.209 | 0.159 | 0.209 | 0.179 | 0.179 | 0 | 0.209 | 0.201 | 0.318 | 0 | 1 | 0.179 | 0 | 0.209 | 0.209 | 0.209 | 0.259 | 0.209 | 0.209 | 0.209 | 0.209 |
| Molise | 0 | 0.276 | 0 | 0 | 0 | 0 | 0 | 0 | 0 | 0 | 0.179 | 1 | 0 | 0 | 0 | 0 | 0 | 0 | 0 | 0 | 0 |
| Piemonte | 0 | 0 | 0 | 0 | 0 | 0.535 | 0 | 0 | 0 | 0 | 0 | 0 | 1 | 0 | 0 | 0 | 0 | 0 | 0 | 0 | 0 |
| Puglia | 0.456 | 0 | 0 | 0 | 0.654 | 0 | 0 | 0 | 0 | 0 | 0.209 | 0 | 0 | 1 | 0 | 0.259 | 0 | 0.71 | 0 | 0 | 0 |
| Sardegna | 0 | 0 | 0 | 0.2 | 0 | 0 | 0 | 0 | 0 | 0 | 0.209 | 0 | 0 | 0 | 1 | 0 | 0 | 0 | 0.055 | 0.318 | 0.318 |
| Sicilia | 1 | 0 | 0.128 | 0 | 0.337 | 0 | 0.798 | 0 | 0 | 0 | 0.209 | 0 | 0 | 0.259 | 0 | 1 | 0 | 0.535 | 0 | 0 | 0 |
| Toscana | 0 | 0 | 0 | 0 | 0 | 0 | 0 | 0.62 | 0.805 | 0 | 0.259 | 0 | 0 | 0 | 0 | 0 | 1 | 0 | 0 | 0 | 0 |
| Trento | 0.535 | 0 | 0 | 0 | 1 | 0 | 0.259 | 0 | 0 | 0 | 0.209 | 0 | 0 | 0.71 | 0 | 0.535 | 0 | 1 | 0 | 0 | 0 |
| Umbria | 0 | 0 | 0.383 | 0.2 | 0 | 0 | 0 | 0 | 0 | 0 | 0.209 | 0 | 0 | 0 | 0.055 | 0 | 0 | 0 | 1 | 0.443 | 0.443 |
| ValleAosta | 0 | 0 | 0.096 | 0.565 | 0 | 0 | 0 | 0 | 0 | 0 | 0.209 | 0 | 0 | 0 | 0.318 | 0 | 0 | 0 | 0.443 | 1 | 1 |
| Veneto | 1 | 1 | 1 | 1 | 1 | 1 | 1 | 1 | 1 | 1 | 1 | 1 | 1 | 1 | 1 | 1 | 1 | 1 | 1 | 1 | 1 |
| Abruzzo | Basilicata | Bolzano | Calabria | Campania | Emilia | Friuli | Lazio | Liguria | Lombardi | Marche | Molise | Piemonte | Puglia | Sardegna | Sicilia | Toscana | Trento | Umbria | ValleAosta | Veneto | |
|---|---|---|---|---|---|---|---|---|---|---|---|---|---|---|---|---|---|---|---|---|---|
| Abruzzo | 1 | 0 | 0 | 0 | 0 | 0 | 0 | 0 | 0 | 0 | 0 | 0 | 0 | 0 | 0 | 0.11 | 0 | 0.06 | 0 | 0 | 0 |
| Basilicata | 0 | 1 | 0 | 0 | 0 | 0 | 0 | 0 | 0 | 0 | 0 | 0.07 | 0 | 0 | 0 | 0 | 0 | 0 | 0 | 0 | 0 |
| Bolzano | 0 | 0 | 1 | 0 | 0 | 0 | 0.9 | 0 | 0 | 0 | 0 | 0 | 0 | 0 | 0 | 0 | 0 | 0 | 0 | 0 | 0 |
| Calabria | 0 | 0 | 0 | 1 | 0 | 0 | 0 | 0 | 0 | 0 | 0 | 0 | 0 | 0 | 0.14 | 0 | 0 | 0 | 0 | 0 | 0 |
| Campania | 0 | 0 | 0 | 0 | 1 | 0 | 0 | 0 | 0 | 0 | 0 | 0 | 0 | 0.32 | 0 | 0.14 | 0 | 0.08 | 0 | 0 | 0 |
| Emilia | 0 | 0 | 0 | 0 | 0 | 1 | 0 | 0 | 0 | 0 | 0 | 0 | 0 | 0 | 0 | 0 | 0 | 0 | 0 | 0 | 0 |
| Friuli | 0 | 0 | 0.9 | 0 | 0 | 0 | 1 | 0 | 0 | 0 | 0 | 0 | 0 | 0 | 0 | 0 | 0 | 0 | 0 | 0 | 0 |
| Lazio | 0 | 0 | 0 | 0 | 0 | 0 | 0 | 1 | 0.32 | 0 | 0.53 | 0 | 0 | 0 | 0 | 0 | 0.07 | 0 | 0 | 0 | 0 |
| Liguria | 0 | 0 | 0 | 0 | 0 | 0 | 0 | 0.32 | 1 | 0 | 0.62 | 0 | 0 | 0 | 0 | 0 | 0.26 | 0 | 0 | 0 | 0 |
| Lombardi | 0 | 0 | 0 | 0 | 0 | 0 | 0 | 0 | 0 | 1 | 0 | 0 | 0 | 0 | 0 | 0 | 0 | 0 | 0 | 0 | 0 |
| Marche | 0 | 0 | 0 | 0 | 0 | 0 | 0 | 0.53 | 0.62 | 0 | 1 | 0 | 0 | 0 | 0 | 0 | 0.16 | 0 | 0 | 0 | 0 |
| Molise | 0 | 0.07 | 0 | 0 | 0 | 0 | 0 | 0 | 0 | 0 | 0 | 1 | 0 | 0 | 0 | 0 | 0 | 0 | 0 | 0 | 0 |
| Piemonte | 0 | 0 | 0 | 0 | 0 | 0 | 0 | 0 | 0 | 0 | 0 | 0 | 1 | 0 | 0 | 0 | 0 | 0 | 0 | 0 | 0 |
| Puglia | 0 | 0 | 0 | 0 | 0.32 | 0 | 0 | 0 | 0 | 0 | 0 | 0 | 0 | 1 | 0 | 0.08 | 0 | 0.08 | 0 | 0 | 0 |
| Sardegna | 0 | 0 | 0 | 0.14 | 0 | 0 | 0 | 0 | 0 | 0 | 0 | 0 | 0 | 0 | 1 | 0 | 0 | 0 | 0 | 0 | 0 |
| Sicilia | 0.11 | 0 | 0 | 0 | 0.14 | 0 | 0 | 0 | 0 | 0 | 0 | 0 | 0 | 0.08 | 0 | 1 | 0 | 0.56 | 0 | 0 | 0 |
| Toscana | 0 | 0 | 0 | 0 | 0 | 0 | 0 | 0.07 | 0.26 | 0 | 0.16 | 0 | 0 | 0 | 0 | 0 | 1 | 0 | 0 | 0 | 0 |
| Trento | 0.06 | 0 | 0 | 0 | 0.08 | 0 | 0 | 0 | 0 | 0 | 0 | 0 | 0 | 0.08 | 0 | 0.56 | 0 | 1 | 0 | 0 | 0 |
| Umbria | 0 | 0 | 0 | 0 | 0 | 0 | 0 | 0 | 0 | 0 | 0 | 0 | 0 | 0 | 0 | 0 | 0 | 0 | 1 | 0 | 0 |
| ValleAosta | 0 | 0 | 0 | 0 | 0 | 0 | 0 | 0 | 0 | 0 | 0 | 0 | 0 | 0 | 0 | 0 | 0 | 0 | 0 | 1 | 0 |
| Veneto | 0 | 0 | 0 | 0 | 0 | 0 | 0 | 0 | 0 | 0 | 0 | 0 | 0 | 0 | 0 | 0 | 0 | 0 | 0 | 0 | 1 |
| Abruzzo | Basilicata | Bolzano | Calabria | Campania | Emilia | Friuli | Lazio | Liguria | Lombardi | Marche | Molise | Piemonte | Puglia | Sardegna | Sicilia | Toscana | Trento | Umbria | ValleAosta | Veneto | |
|---|---|---|---|---|---|---|---|---|---|---|---|---|---|---|---|---|---|---|---|---|---|
| Abruzzo | 1 | 0.052 | 0.251 | 0.146 | 0.758 | 0 | 0.764 | 0.197 | 0 | 0 | 0 | 0.111 | 0 | 0.863 | 0 | 0.848 | 0 | 0.779 | 0.989 | 0.868 | 0 |
| Basilicata | 0.052 | 1 | 0.185 | 0.245 | 0 | 0 | 0 | 0 | 0 | 0 | 0 | 0.193 | 0 | 0 | 0.581 | 0.118 | 0 | 0 | 0 | 0 | 0 |
| Bolzano | 0.251 | 0.185 | 1 | 0.547 | 0.192 | 0 | 0.339 | 0 | 0 | 0 | 0 | 0.522 | 0 | 0.372 | 0.073 | 0.514 | 0 | 0.423 | 0.184 | 0.2 | 0 |
| Calabria | 0.146 | 0.245 | 0.547 | 1 | 0.061 | 0 | 0.158 | 0 | 0 | 0 | 0 | 0.765 | 0 | 0.183 | 0.158 | 0.317 | 0 | 0.208 | 0.059 | 0 | 0 |
| Campania | 0.758 | 0 | 0.192 | 0.061 | 1 | 0 | 0.608 | 0.375 | 0.066 | 0 | 0 | 0 | 0 | 0.509 | 0 | 0.461 | 0.073 | 0.493 | 0.839 | 0.736 | 0 |
| Emilia | 0 | 0 | 0 | 0 | 0 | 1 | 0 | 0 | 0 | 0 | 0.798 | 0 | 0.6 | 0 | 0 | 0 | 0 | 0 | 0 | 0 | 0 |
| Friuli | 0.764 | 0 | 0.339 | 0.158 | 0.608 | 0 | 1 | 0.093 | 0 | 0 | 0 | 0.118 | 0 | 0.945 | 0 | 0.922 | 0 | 0.919 | 0.701 | 0.789 | 0 |
| Lazio | 0.197 | 0 | 0 | 0 | 0.375 | 0 | 0.093 | 1 | 0.238 | 0 | 0 | 0 | 0 | 0.058 | 0 | 0.07 | 0.198 | 0.062 | 0.12 | 0.139 | 0 |
| Liguria | 0 | 0 | 0 | 0 | 0.066 | 0 | 0 | 0.238 | 1 | 0 | 0 | 0 | 0.059 | 0 | 0 | 0 | 0.539 | 0 | 0 | 0 | 0 |
| Lombardi | 0 | 0 | 0 | 0 | 0 | 0 | 0 | 0 | 0 | 1 | 0.115 | 0 | 0 | 0 | 0 | 0 | 0 | 0 | 0 | 0 | 0.608 |
| Marche | 0 | 0 | 0 | 0 | 0 | 0.798 | 0 | 0 | 0 | 0.115 | 1 | 0 | 0.785 | 0 | 0 | 0 | 0.141 | 0 | 0 | 0 | 0 |
| Molise | 0.111 | 0.193 | 0.522 | 0.765 | 0 | 0 | 0.118 | 0 | 0 | 0 | 0 | 1 | 0 | 0.233 | 0.216 | 0.392 | 0 | 0.272 | 0 | 0 | 0 |
| Piemonte | 0 | 0 | 0 | 0 | 0 | 0.6 | 0 | 0 | 0.059 | 0 | 0.785 | 0 | 1 | 0 | 0 | 0 | 0.192 | 0 | 0 | 0 | 0 |
| Puglia | 0.863 | 0 | 0.372 | 0.183 | 0.509 | 0 | 0.945 | 0.058 | 0 | 0 | 0 | 0.233 | 0 | 1 | 0 | 0.745 | 0 | 0.84 | 0.754 | 0.571 | 0 |
| Sardegna | 0 | 0.581 | 0.073 | 0.158 | 0 | 0 | 0 | 0 | 0 | 0 | 0 | 0.216 | 0 | 0 | 1 | 0 | 0 | 0 | 0 | 0 | 0 |
| Sicilia | 0.848 | 0.118 | 0.514 | 0.317 | 0.461 | 0 | 0.922 | 0.07 | 0 | 0 | 0 | 0.392 | 0 | 0.745 | 0 | 1 | 0 | 0.94 | 0.574 | 0.688 | 0 |
| Toscana | 0 | 0 | 0 | 0 | 0.073 | 0 | 0 | 0.198 | 0.539 | 0 | 0.141 | 0 | 0.192 | 0 | 0 | 0 | 1 | 0 | 0 | 0 | 0 |
| Trento | 0.779 | 0 | 0.423 | 0.208 | 0.493 | 0 | 0.919 | 0.062 | 0 | 0 | 0 | 0.272 | 0 | 0.84 | 0 | 0.94 | 0 | 1 | 0.692 | 0.577 | 0 |
| Umbria | 0.989 | 0 | 0.184 | 0.059 | 0.839 | 0 | 0.701 | 0.12 | 0 | 0 | 0 | 0 | 0 | 0.754 | 0 | 0.574 | 0 | 0.692 | 1 | 0.912 | 0 |
| ValleAosta | 0.868 | 0 | 0.2 | 0 | 0.736 | 0 | 0.789 | 0.139 | 0 | 0 | 0 | 0 | 0 | 0.571 | 0 | 0.688 | 0 | 0.577 | 0.912 | 1 | 0 |
| Veneto | 0 | 0 | 0 | 0 | 0 | 0 | 0 | 0 | 0 | 0.608 | 0 | 0 | 0 | 0 | 0 | 0 | 0 | 0 | 0 | 0 | 1 |
| Abruzzo | Basilicata | Bolzano | Calabria | Campania | Emilia | Friuli | Lazio | Liguria | Lombardi | Marche | Molise | Piemonte | Puglia | Sardegna | Sicilia | Toscana | Trento | Umbria | ValleAosta | Veneto | |
|---|---|---|---|---|---|---|---|---|---|---|---|---|---|---|---|---|---|---|---|---|---|
| Abruzzo | 0 | 0 | 0 | 0 | 0 | 0 | 0 | 0.14 | 0.14 | 0 | 0 | 0 | 0.32 | 0 | 0 | 0 | 0 | 0 | 0 | 0 | 0 |
| Basilicata | 0 | 0 | 0 | 0 | 0 | 0 | 0 | 0.14 | 0.14 | 0 | 0 | 0 | 0.32 | 0 | 0 | 0 | 0 | 0 | 0 | 0 | 0 |
| Bolzano | 0 | 0 | 0 | 0 | 0 | 0 | 0 | 0.14 | 0.14 | 0 | 0 | 0 | 0.32 | 0 | 0 | 0 | 0 | 0 | 0 | 0 | 0 |
| Calabria | 0 | 0 | 0 | 0 | 0 | 0 | 0 | 0.14 | 0.14 | 0 | 0 | 0 | 0.32 | 0 | 0 | 0 | 0 | 0 | 0 | 0 | 0 |
| Campania | 0 | 0 | 0 | 0 | 0 | 0 | 0 | 0.14 | 0.14 | 0 | 0 | 0 | 0.32 | 0 | 0 | 0 | 0 | 0 | 0 | 0 | 0 |
| Emilia | 0 | 0 | 0 | 0 | 0 | 1 | 0 | 0 | 0 | 0 | 0.37 | 0 | 0 | 0 | 0 | 0 | 0 | 0 | 0 | 0 | 0 |
| Friuli | 0 | 0 | 0 | 0 | 0 | 0 | 0 | 0.14 | 0.14 | 0 | 0 | 0 | 0.32 | 0 | 0 | 0 | 0 | 0 | 0 | 0 | 0 |
| Lazio | 0.14 | 0.14 | 0.14 | 0.14 | 0.14 | 0 | 0.14 | 1 | 1 | 0 | 0.12 | 0.14 | 0.66 | 0.14 | 0.14 | 0.14 | 0.14 | 0.14 | 0.14 | 0.14 | 0 |
| Liguria | 0.14 | 0.14 | 0.14 | 0.14 | 0.14 | 0 | 0.14 | 1 | 1 | 0 | 0.12 | 0.14 | 0.66 | 0.14 | 0.14 | 0.14 | 0.14 | 0.14 | 0.14 | 0.14 | 0 |
| Lombardi | 0 | 0 | 0 | 0 | 0 | 0 | 0 | 0 | 0 | 1 | 0 | 0 | 0 | 0 | 0 | 0 | 0 | 0 | 0 | 0 | 0 |
| Marche | 0.02 | 0.02 | 0.02 | 0.02 | 0.02 | 0.37 | 0.02 | 0.12 | 0.12 | 0 | 1 | 0.02 | 0.06 | 0.02 | 0.02 | 0.02 | 0.02 | 0.02 | 0.02 | 0.02 | 0 |
| Molise | 0 | 0 | 0 | 0 | 0 | 0 | 0 | 0.14 | 0.14 | 0 | 0 | 0 | 0.32 | 0 | 0 | 0 | 0 | 0 | 0 | 0 | 0 |
| Piemonte | 0.32 | 0.32 | 0.32 | 0.32 | 0.32 | 0 | 0.32 | 0.66 | 0.66 | 0 | 0.06 | 0.32 | 1 | 0.32 | 0.32 | 0.32 | 0.32 | 0.32 | 0.32 | 0.32 | 0 |
| Puglia | 0 | 0 | 0 | 0 | 0 | 0 | 0 | 0.14 | 0.14 | 0 | 0 | 0 | 0.32 | 0 | 0 | 0 | 0 | 0 | 0 | 0 | 0 |
| Sardegna | 0 | 0 | 0 | 0 | 0 | 0 | 0 | 0.14 | 0.14 | 0 | 0 | 0 | 0.32 | 0 | 0 | 0 | 0 | 0 | 0 | 0 | 0 |
| Sicilia | 0 | 0 | 0 | 0 | 0 | 0 | 0 | 0.14 | 0.14 | 0 | 0 | 0 | 0.32 | 0 | 0 | 0 | 0 | 0 | 0 | 0 | 0 |
| Toscana | 0 | 0 | 0 | 0 | 0 | 0 | 0 | 0.14 | 0.14 | 0 | 0 | 0 | 0.32 | 0 | 0 | 0 | 0 | 0 | 0 | 0 | 0 |
| Trento | 0 | 0 | 0 | 0 | 0 | 0 | 0 | 0.14 | 0.14 | 0 | 0 | 0 | 0.32 | 0 | 0 | 0 | 0 | 0 | 0 | 0 | 0 |
| Umbria | 0 | 0 | 0 | 0 | 0 | 0 | 0 | 0.14 | 0.14 | 0 | 0 | 0 | 0.32 | 0 | 0 | 0 | 0 | 0 | 0 | 0 | 0 |
| ValleAosta | 0 | 0 | 0 | 0 | 0 | 0 | 0 | 0.14 | 0.14 | 0 | 0 | 0 | 0.32 | 0 | 0 | 0 | 0 | 0 | 0 | 0 | 0 |
| Veneto | 0 | 0 | 0 | 0 | 0 | 0 | 0 | 0 | 0 | 0 | 0 | 0 | 0 | 0 | 0 | 0 | 0 | 0 | 0 | 0 | 1 |
| Abruzzo | Basilicata | Bolzano | Calabria | Campania | Emilia | Friuli | Lazio | Liguria | Lombardi | Marche | Molise | Piemonte | Puglia | Sardegna | Sicilia | Toscana | Trento | Umbria | ValleAosta | Veneto | |
|---|---|---|---|---|---|---|---|---|---|---|---|---|---|---|---|---|---|---|---|---|---|
| Abruzzo | 0 | 0 | 0 | 0 | 0.32 | 0 | 0.14 | 0 | 0 | 0 | 0 | 0.06 | 0 | 0 | 0 | 0 | 0 | 0.14 | 0 | 0 | 0 |
| Basilicata | 0 | 0 | 0 | 0 | 0.32 | 0 | 0.14 | 0 | 0 | 0 | 0 | 0.06 | 0 | 0 | 0 | 0 | 0 | 0.14 | 0 | 0 | 0 |
| Bolzano | 0 | 0 | 0 | 0 | 0.32 | 0 | 0.14 | 0 | 0 | 0 | 0 | 0.06 | 0 | 0 | 0 | 0 | 0 | 0.14 | 0 | 0 | 0 |
| Calabria | 0 | 0 | 0 | 0 | 0.32 | 0 | 0.14 | 0 | 0 | 0 | 0 | 0.06 | 0 | 0 | 0 | 0 | 0 | 0.14 | 0 | 0 | 0 |
| Campania | 0.32 | 0.32 | 0.32 | 0.32 | 1 | 0 | 0.66 | 0 | 0 | 0 | 0 | 0.38 | 0 | 0.2 | 0.32 | 0.32 | 0.08 | 0.66 | 0 | 0.12 | 0 |
| Emilia | 0 | 0 | 0 | 0 | 0 | 1 | 0 | 0 | 0 | 0 | 0 | 0 | 0.13 | 0 | 0 | 0 | 0 | 0 | 0 | 0 | 0 |
| Friuli | 0.14 | 0.14 | 0.14 | 0.14 | 0.66 | 0 | 1 | 0 | 0 | 0 | 0 | 0.33 | 0 | 0.2 | 0.14 | 0.14 | 0 | 0.87 | 0 | 0.12 | 0 |
| Lazio | 0.01 | 0.01 | 0.01 | 0.01 | 0 | 0 | 0 | 1 | 0.75 | 0 | 0 | 0.05 | 0.05 | 0.09 | 0.01 | 0.01 | 0.3 | 0 | 0.17 | 0.79 | 0 |
| Liguria | 0 | 0 | 0 | 0 | 0 | 0 | 0 | 0.75 | 1 | 0 | 0 | 0 | 0.05 | 0 | 0 | 0 | 0.65 | 0 | 0 | 0.61 | 0 |
| Lombardi | 0 | 0 | 0 | 0 | 0 | 0 | 0 | 0 | 0 | 1 | 0 | 0 | 0 | 0 | 0 | 0 | 0 | 0 | 0 | 0 | 0.9 |
| Marche | 0 | 0 | 0 | 0 | 0 | 0 | 0 | 0 | 0 | 0 | 1 | 0 | 0.85 | 0 | 0 | 0 | 0 | 0 | 0 | 0 | 0 |
| Molise | 0.06 | 0.06 | 0.06 | 0.06 | 0.38 | 0 | 0.33 | 0.05 | 0 | 0 | 0 | 1 | 0 | 0.78 | 0.06 | 0.06 | 0.08 | 0.45 | 0.19 | 0.19 | 0 |
| Piemonte | 0 | 0 | 0 | 0 | 0 | 0.13 | 0 | 0.05 | 0.05 | 0 | 0.85 | 0 | 1 | 0 | 0 | 0 | 0 | 0 | 0 | 0.05 | 0 |
| Puglia | 0.02 | 0.02 | 0.02 | 0.02 | 0.2 | 0 | 0.2 | 0.09 | 0 | 0 | 0 | 0.78 | 0 | 1 | 0.02 | 0.02 | 0.13 | 0.29 | 0.2 | 0.32 | 0 |
| Sardegna | 0 | 0 | 0 | 0 | 0.32 | 0 | 0.14 | 0 | 0 | 0 | 0 | 0.06 | 0 | 0 | 0 | 0 | 0 | 0.14 | 0 | 0 | 0 |
| Sicilia | 0 | 0 | 0 | 0 | 0.32 | 0 | 0.14 | 0 | 0 | 0 | 0 | 0.06 | 0 | 0 | 0 | 0 | 0 | 0.14 | 0 | 0 | 0 |
| Toscana | 0.01 | 0.01 | 0.01 | 0.01 | 0.08 | 0 | 0 | 0.3 | 0.65 | 0 | 0 | 0.08 | 0 | 0.13 | 0.01 | 0.01 | 1 | 0 | 0.26 | 0.95 | 0 |
| Trento | 0.14 | 0.14 | 0.14 | 0.14 | 0.66 | 0 | 0.87 | 0 | 0 | 0 | 0 | 0.45 | 0 | 0.29 | 0.14 | 0.14 | 0 | 1 | 0 | 0.12 | 0 |
| Umbria | 0 | 0 | 0 | 0 | 0 | 0 | 0 | 0.17 | 0 | 0 | 0 | 0.19 | 0 | 0.2 | 0 | 0 | 0.26 | 0 | 1 | 0.65 | 0 |
| ValleAosta | 0.03 | 0.03 | 0.03 | 0.03 | 0.12 | 0 | 0.12 | 0.79 | 0.61 | 0 | 0 | 0.19 | 0.05 | 0.32 | 0.03 | 0.03 | 0.95 | 0.12 | 0.65 | 1 | 0 |
| Veneto | 0 | 0 | 0 | 0 | 0 | 0 | 0 | 0 | 0 | 0.9 | 0 | 0 | 0 | 0 | 0 | 0 | 0 | 0 | 0 | 0 | 1 |
| Abruzzo | Basilicata | Bolzano | Calabria | Campania | Emilia | Friuli | Lazio | Liguria | Lombardi | Marche | Molise | Piemonte | Puglia | Sardegna | Sicilia | Toscana | Trento | Umbria | ValleAosta | Veneto | |
|---|---|---|---|---|---|---|---|---|---|---|---|---|---|---|---|---|---|---|---|---|---|
| Abruzzo | 1 | 0 | 0 | 0 | 0.847 | 0 | 0.158 | 0.084 | 0 | 0 | 0 | 0 | 0 | 0 | 0 | 0.158 | 0 | 0.2 | 0.481 | 0.403 | 0 |
| Basilicata | 0 | 1 | 0.05 | 0 | 0 | 0 | 0 | 0 | 0 | 0 | 0 | 0 | 0 | 0 | 0 | 0.068 | 0 | 0 | 0 | 0 | 0 |
| Bolzano | 0 | 0.05 | 1 | 0.398 | 0 | 0 | 0 | 0 | 0 | 0 | 0 | 0.234 | 0 | 0.36 | 0 | 0.478 | 0 | 0.272 | 0 | 0 | 0 |
| Calabria | 0 | 0 | 0.398 | 1 | 0 | 0 | 0 | 0 | 0 | 0 | 0 | 0.419 | 0 | 0.108 | 0 | 0.4 | 0 | 0.06 | 0 | 0 | 0 |
| Campania | 0.847 | 0 | 0 | 0 | 1 | 0 | 0.062 | 0.108 | 0 | 0 | 0 | 0 | 0 | 0 | 0 | 0 | 0 | 0.054 | 0.176 | 0.332 | 0 |
| Emilia | 0 | 0 | 0 | 0 | 0 | 1 | 0 | 0 | 0 | 0 | 0 | 0 | 0.456 | 0 | 0 | 0 | 0 | 0 | 0 | 0 | 0.056 |
| Friuli | 0.158 | 0 | 0 | 0 | 0.062 | 0 | 1 | 0 | 0 | 0 | 0 | 0 | 0 | 0.132 | 0 | 0.442 | 0 | 0.608 | 0.48 | 0.564 | 0.056 |
| Lazio | 0.084 | 0 | 0 | 0 | 0.108 | 0 | 0 | 1 | 0 | 0 | 0 | 0 | 0 | 0 | 0 | 0 | 0 | 0 | 0 | 0.062 | 0.056 |
| Liguria | 0 | 0 | 0 | 0 | 0 | 0 | 0 | 0 | 1 | 0 | 0.48 | 0 | 0 | 0 | 0 | 0 | 0.209 | 0 | 0 | 0 | 0.056 |
| Lombardi | 0 | 0 | 0 | 0 | 0 | 0 | 0 | 0 | 0 | 1 | 0 | 0 | 0 | 0 | 0 | 0 | 0 | 0 | 0 | 0 | 0.056 |
| Marche | 0 | 0 | 0 | 0 | 0 | 0 | 0 | 0 | 0.48 | 0 | 1 | 0 | 0 | 0 | 0 | 0 | 0.179 | 0 | 0 | 0 | 0 |
| Molise | 0 | 0 | 0.234 | 0.419 | 0 | 0 | 0 | 0 | 0 | 0 | 0 | 1 | 0 | 0.143 | 0 | 0.601 | 0 | 0.062 | 0 | 0 | 0 |
| Piemonte | 0 | 0 | 0 | 0 | 0 | 0.456 | 0 | 0 | 0 | 0 | 0 | 0 | 1 | 0 | 0 | 0 | 0.128 | 0 | 0 | 0 | 0.056 |
| Puglia | 0 | 0 | 0.36 | 0.108 | 0 | 0 | 0.132 | 0 | 0 | 0 | 0 | 0.143 | 0 | 1 | 0 | 0.948 | 0 | 0.693 | 0.06 | 0 | 0 |
| Sardegna | 0 | 0 | 0 | 0 | 0 | 0 | 0 | 0 | 0 | 0 | 0 | 0 | 0 | 0 | 0 | 0 | 0 | 0 | 0 | 0 | 0 |
| Sicilia | 0.158 | 0.068 | 0.478 | 0.4 | 0 | 0 | 0.442 | 0 | 0 | 0 | 0 | 0.601 | 0 | 0.948 | 0.003 | 1 | 0 | 0.564 | 0.223 | 0.124 | 0.056 |
| Toscana | 0 | 0 | 0 | 0 | 0 | 0 | 0 | 0 | 0.209 | 0 | 0.179 | 0 | 0.128 | 0 | 0.001 | 0 | 1 | 0 | 0 | 0 | 0.056 |
| Trento | 0.2 | 0 | 0.272 | 0.06 | 0.054 | 0 | 0.608 | 0 | 0 | 0 | 0 | 0.062 | 0 | 0.693 | 0.001 | 0.564 | 0 | 1 | 0.405 | 0.124 | 0.056 |
| Umbria | 0.481 | 0 | 0 | 0 | 0.176 | 0 | 0.48 | 0 | 0 | 0 | 0 | 0 | 0 | 0.06 | 0.001 | 0.223 | 0 | 0.405 | 1 | 0.949 | 0.056 |
| ValleAosta | 0.403 | 0 | 0 | 0 | 0.332 | 0 | 0.564 | 0.062 | 0 | 0 | 0 | 0 | 0 | 0 | 0.001 | 0.124 | 0 | 0.124 | 0.949 | 1 | 0 |
| Veneto | 0 | 0 | 0 | 0 | 0 | 0.056 | 0.056 | 0.056 | 0.056 | 0.056 | 0 | 0 | 0.056 | 0 | 0.005 | 0.056 | 0.056 | 0.056 | 0.056 | 0 | 1 |
| Abruzzo | Basilicata | Bolzano | Calabria | Campania | Emilia | Friuli | Lazio | Liguria | Lombardi | Marche | Molise | Piemonte | Puglia | Sardegna | Sicilia | Toscana | Trento | Umbria | ValleAosta | Veneto | |
|---|---|---|---|---|---|---|---|---|---|---|---|---|---|---|---|---|---|---|---|---|---|
| Abruzzo | 1 | 0 | 0 | 0 | 0.37 | 0 | 0 | 0.521 | 0 | 0 | 0.179 | 0 | 0 | 0 | 0 | 0.306 | 0 | 0 | 0 | 0 | 0 |
| Basilicata | 0 | 1 | 0 | 0 | 0 | 0 | 0 | 0 | 0 | 0 | 0.177 | 0.237 | 0 | 0 | 0.157 | 0 | 0 | 0 | 0 | 0 | 0 |
| Bolzano | 0 | 0 | 1 | 0 | 0 | 0 | 0.073 | 0 | 0 | 0 | 0.178 | 0 | 0 | 0.248 | 0 | 0 | 0 | 0.072 | 0.157 | 0.797 | 0.797 |
| Calabria | 0 | 0 | 0 | 1 | 0 | 0 | 0 | 0 | 0 | 0 | 0.179 | 0 | 0 | 0.063 | 0.244 | 0 | 0 | 0 | 0 | 0.084 | 0.084 |
| Campania | 0.37 | 0 | 0 | 0 | 1 | 0 | 0.406 | 0.276 | 0 | 0 | 0.405 | 0 | 0 | 0.276 | 0 | 1 | 0 | 0.275 | 0.138 | 0 | 0 |
| Emilia | 0 | 0 | 0 | 0 | 0 | 1 | 0 | 0 | 0 | 0 | 0 | 0 | 0.805 | 0 | 0 | 0 | 0 | 0 | 0 | 0 | 0 |
| Friuli | 0 | 0 | 0.073 | 0 | 0.406 | 0 | 1 | 0 | 0 | 0 | 0.179 | 0 | 0 | 0.798 | 0 | 0.306 | 0 | 0.898 | 0.651 | 0 | 0 |
| Lazio | 0.521 | 0 | 0 | 0 | 0.276 | 0 | 0 | 1 | 0 | 0 | 0.2 | 0 | 0 | 0 | 0 | 0.11 | 0 | 0 | 0 | 0 | 0 |
| Liguria | 0 | 0 | 0 | 0 | 0 | 0 | 0 | 0 | 1 | 0 | 0.11 | 0 | 0 | 0 | 0 | 0 | 0 | 0 | 0 | 0 | 0 |
| Lombardi | 0 | 0 | 0 | 0 | 0 | 0 | 0 | 0 | 0 | 1 | 0 | 0 | 0 | 0 | 0 | 0 | 0 | 0 | 0 | 0 | 0 |
| Marche | 0.179 | 0.177 | 0.178 | 0.179 | 0.405 | 0 | 0.179 | 0.2 | 0.11 | 0 | 1 | 0.174 | 0 | 0.179 | 0.14 | 0.179 | 0 | 0.179 | 0.177 | 0.179 | 0.179 |
| Molise | 0 | 0.237 | 0 | 0 | 0 | 0 | 0 | 0 | 0 | 0 | 0.174 | 1 | 0 | 0 | 0.195 | 0 | 0 | 0 | 0 | 0 | 0 |
| Piemonte | 0 | 0 | 0 | 0 | 0 | 0.805 | 0 | 0 | 0 | 0 | 0 | 0 | 1 | 0 | 0 | 0 | 0 | 0 | 0 | 0 | 0 |
| Puglia | 0 | 0 | 0.248 | 0.063 | 0.276 | 0 | 0.798 | 0 | 0 | 0 | 0.179 | 0 | 0 | 1 | 0 | 0.277 | 0 | 0.608 | 0.847 | 0.096 | 0.096 |
| Sardegna | 0 | 0.157 | 0 | 0.244 | 0 | 0 | 0 | 0 | 0 | 0 | 0.14 | 0.195 | 0 | 0 | 1 | 0 | 0 | 0 | 0 | 0 | 0 |
| Sicilia | 0.306 | 0 | 0 | 0 | 1 | 0 | 0.306 | 0.11 | 0 | 0 | 0.179 | 0 | 0 | 0.277 | 0 | 1 | 0 | 0.337 | 0.177 | 0 | 0 |
| Toscana | 0 | 0 | 0 | 0 | 0 | 0 | 0 | 0 | 0 | 0 | 0 | 0 | 0 | 0 | 0 | 0 | 1 | 0 | 0 | 0 | 0 |
| Trento | 0 | 0 | 0.072 | 0 | 0.275 | 0 | 0.898 | 0 | 0 | 0 | 0.179 | 0 | 0 | 0.608 | 0 | 0.337 | 0 | 1 | 0.563 | 0.055 | 0.055 |
| Umbria | 0 | 0 | 0.157 | 0 | 0.138 | 0 | 0.651 | 0 | 0 | 0 | 0.177 | 0 | 0 | 0.847 | 0 | 0.177 | 0 | 0.563 | 1 | 0.072 | 0.072 |
| ValleAosta | 0 | 0 | 0.797 | 0.084 | 0 | 0 | 0 | 0 | 0 | 0 | 0.179 | 0 | 0 | 0.096 | 0 | 0 | 0 | 0.055 | 0.072 | 1 | 1 |
| Veneto | 1 | 1 | 1 | 1 | 1 | 1 | 1 | 1 | 1 | 1 | 1 | 1 | 1 | 1 | 1 | 1 | 1 | 1 | 1 | 1 | 1 |
| Abruzzo | Basilicata | Bolzano | Calabria | Campania | Emilia | Friuli | Lazio | Liguria | Lombardi | Marche | Molise | Piemonte | Puglia | Sardegna | Sicilia | Toscana | Trento | Umbria | ValleAosta | Veneto | |
|---|---|---|---|---|---|---|---|---|---|---|---|---|---|---|---|---|---|---|---|---|---|
| Abruzzo | 1 | 0 | 0 | 0 | 0 | 0 | 0 | 0 | 0 | 0 | 0 | 0 | 0 | 0.276 | 0 | 0.094 | 0 | 0.848 | 0 | 0 | 0 |
| Basilicata | 0 | 1 | 0 | 0 | 0 | 0 | 0 | 0 | 0 | 0 | 0 | 0 | 0 | 0 | 0 | 0 | 0 | 0 | 0 | 0 | 0 |
| Bolzano | 0 | 0 | 1 | 0 | 0 | 0 | 0 | 0 | 0 | 0 | 0 | 0 | 0 | 0 | 0 | 0 | 0 | 0 | 0.52 | 0 | 0 |
| Calabria | 0 | 0 | 0 | 1 | 0 | 0 | 0 | 0 | 0 | 0 | 0 | 0 | 0 | 0 | 0.133 | 0 | 0 | 0 | 0 | 0.082 | 0 |
| Campania | 0 | 0 | 0 | 0 | 1 | 0 | 0 | 0.249 | 0 | 0 | 0 | 0 | 0 | 0 | 0 | 0 | 0 | 0 | 0 | 0 | 0 |
| Emilia | 0 | 0 | 0 | 0 | 0 | 1 | 0 | 0 | 0 | 0 | 0 | 0 | 0 | 0 | 0 | 0 | 0 | 0 | 0 | 0 | 0.096 |
| Friuli | 0 | 0 | 0 | 0 | 0 | 0 | 1 | 0 | 0 | 0 | 0 | 0 | 0 | 0 | 0 | 0 | 0 | 0.096 | 0 | 0 | 0 |
| Lazio | 0 | 0 | 0 | 0 | 0.249 | 0 | 0 | 1 | 0 | 0 | 0 | 0 | 0 | 0 | 0 | 0 | 0 | 0 | 0 | 0 | 0 |
| Liguria | 0 | 0 | 0 | 0 | 0 | 0 | 0 | 0 | 1 | 0 | 0.335 | 0 | 0 | 0 | 0 | 0 | 0 | 0 | 0 | 0 | 0 |
| Lombardi | 0 | 0 | 0 | 0 | 0 | 0 | 0 | 0 | 0 | 1 | 0 | 0 | 0 | 0 | 0 | 0 | 0 | 0 | 0 | 0 | 0 |
| Marche | 0 | 0 | 0 | 0 | 0 | 0 | 0 | 0 | 0.335 | 0 | 1 | 0 | 0 | 0 | 0 | 0 | 0 | 0 | 0 | 0 | 0 |
| Molise | 0 | 0 | 0 | 0 | 0 | 0 | 0 | 0 | 0 | 0 | 0 | 1 | 0 | 0 | 0 | 0 | 0 | 0 | 0 | 0 | 0 |
| Piemonte | 0 | 0 | 0 | 0 | 0 | 0 | 0 | 0 | 0 | 0 | 0 | 0 | 1 | 0 | 0 | 0 | 0 | 0 | 0 | 0 | 0 |
| Puglia | 0.276 | 0 | 0 | 0 | 0 | 0 | 0 | 0 | 0 | 0 | 0 | 0 | 0 | 1 | 0 | 0.564 | 0 | 0.337 | 0 | 0 | 0 |
| Sardegna | 0 | 0 | 0 | 0.133 | 0 | 0 | 0 | 0 | 0 | 0 | 0 | 0 | 0 | 0 | 1 | 0 | 0 | 0 | 0 | 0 | 0 |
| Sicilia | 0.094 | 0 | 0 | 0 | 0 | 0 | 0 | 0 | 0 | 0 | 0 | 0 | 0 | 0.564 | 0 | 1 | 0 | 0.305 | 0 | 0 | 0 |
| Toscana | 0 | 0 | 0 | 0 | 0 | 0 | 0 | 0 | 0 | 0 | 0 | 0 | 0 | 0 | 0 | 0 | 1 | 0 | 0 | 0 | 0 |
| Trento | 0.848 | 0 | 0 | 0 | 0 | 0 | 0.096 | 0 | 0 | 0 | 0 | 0 | 0 | 0.337 | 0 | 0.305 | 0 | 1 | 0 | 0 | 0 |
| Umbria | 0 | 0 | 0.52 | 0 | 0 | 0 | 0 | 0 | 0 | 0 | 0 | 0 | 0 | 0 | 0 | 0 | 0 | 0 | 1 | 0 | 0 |
| ValleAosta | 0 | 0 | 0 | 0.082 | 0 | 0 | 0 | 0 | 0 | 0 | 0 | 0 | 0 | 0 | 0 | 0 | 0 | 0 | 0 | 1 | 0 |
| Veneto | 0 | 0 | 0 | 0 | 0 | 0.096 | 0 | 0 | 0 | 0 | 0 | 0 | 0 | 0 | 0 | 0 | 0 | 0 | 0 | 0 | 1 |
| Abruzzo | Basilicata | Bolzano | Calabria | Campania | Emilia | Friuli | Lazio | Liguria | Lombardi | Marche | Molise | Piemonte | Puglia | Sardegna | Sicilia | Toscana | Trento | Umbria | ValleAosta | Veneto | |
|---|---|---|---|---|---|---|---|---|---|---|---|---|---|---|---|---|---|---|---|---|---|
| Abruzzo | 1 | 0 | 0.225 | 0 | 0.472 | 0 | 0.427 | 0.098 | 0 | 0 | 0 | 0 | 0 | 0.957 | 0 | 0.819 | 0 | 0.494 | 0.119 | 0.609 | 0 |
| Basilicata | 0 | 1 | 0 | 0 | 0 | 0 | 0 | 0 | 0 | 0 | 0 | 0.077 | 0 | 0 | 0 | 0 | 0 | 0 | 0 | 0 | 0 |
| Bolzano | 0.225 | 0 | 1 | 0.186 | 0.099 | 0 | 0.845 | 0 | 0 | 0 | 0 | 0 | 0 | 0.251 | 0.171 | 0.317 | 0 | 0.958 | 0.567 | 0.652 | 0 |
| Calabria | 0 | 0 | 0.186 | 1 | 0 | 0 | 0.128 | 0 | 0 | 0 | 0 | 0.24 | 0 | 0 | 0.833 | 0.052 | 0 | 0.219 | 0.457 | 0.099 | 0 |
| Campania | 0.472 | 0 | 0.099 | 0 | 1 | 0 | 0.247 | 0.295 | 0.093 | 0 | 0 | 0 | 0 | 0.6 | 0 | 0.39 | 0.087 | 0.204 | 0 | 0.279 | 0 |
| Emilia | 0 | 0 | 0 | 0 | 0 | 1 | 0 | 0 | 0 | 0.22 | 0.217 | 0 | 0.129 | 0 | 0 | 0 | 0 | 0 | 0 | 0 | 0.837 |
| Friuli | 0.427 | 0 | 0.845 | 0.128 | 0.247 | 0 | 1 | 0 | 0 | 0 | 0 | 0 | 0 | 0.381 | 0.12 | 0.501 | 0 | 0.91 | 0.357 | 0.973 | 0 |
| Lazio | 0.098 | 0 | 0 | 0 | 0.295 | 0 | 0 | 1 | 0.615 | 0 | 0 | 0 | 0 | 0.116 | 0 | 0.065 | 0.46 | 0 | 0 | 0 | 0 |
| Liguria | 0 | 0 | 0 | 0 | 0.093 | 0 | 0 | 0.615 | 1 | 0 | 0 | 0 | 0.077 | 0 | 0 | 0 | 0.877 | 0 | 0 | 0 | 0 |
| Lombardi | 0 | 0 | 0 | 0 | 0 | 0.22 | 0 | 0 | 0 | 1 | 0.14 | 0 | 0 | 0 | 0 | 0 | 0 | 0 | 0 | 0 | 0.486 |
| Marche | 0 | 0 | 0 | 0 | 0 | 0.217 | 0 | 0 | 0 | 0.14 | 1 | 0 | 0.634 | 0 | 0 | 0 | 0 | 0 | 0 | 0 | 0 |
| Molise | 0 | 0.077 | 0 | 0.24 | 0 | 0 | 0 | 0 | 0 | 0 | 0 | 1 | 0 | 0 | 0.27 | 0 | 0 | 0.07 | 0.138 | 0 | 0 |
| Piemonte | 0 | 0 | 0 | 0 | 0 | 0.129 | 0 | 0 | 0.077 | 0 | 0.634 | 0 | 1 | 0 | 0 | 0 | 0.09 | 0 | 0 | 0 | 0.161 |
| Puglia | 0.957 | 0 | 0.251 | 0 | 0.6 | 0 | 0.381 | 0.116 | 0 | 0 | 0 | 0 | 0 | 1 | 0 | 0.803 | 0 | 0.385 | 0.11 | 0.447 | 0 |
| Sardegna | 0 | 0 | 0.171 | 0.833 | 0 | 0 | 0.12 | 0 | 0 | 0 | 0 | 0.27 | 0 | 0 | 1 | 0 | 0 | 0.233 | 0.398 | 0.058 | 0 |
| Sicilia | 0.819 | 0 | 0.317 | 0.052 | 0.39 | 0 | 0.501 | 0.065 | 0 | 0 | 0 | 0 | 0 | 0.803 | 0 | 1 | 0 | 0.486 | 0.191 | 0.732 | 0 |
| Toscana | 0 | 0 | 0 | 0 | 0.087 | 0 | 0 | 0.46 | 0.877 | 0 | 0 | 0 | 0.09 | 0 | 0 | 0 | 1 | 0 | 0 | 0 | 0 |
| Trento | 0.494 | 0 | 0.958 | 0.219 | 0.204 | 0 | 0.91 | 0 | 0 | 0 | 0 | 0.07 | 0 | 0.385 | 0.233 | 0.486 | 0 | 1 | 0.49 | 0.947 | 0 |
| Umbria | 0.119 | 0 | 0.567 | 0.457 | 0 | 0 | 0.357 | 0 | 0 | 0 | 0 | 0.138 | 0 | 0.11 | 0.398 | 0.191 | 0 | 0.49 | 1 | 0.307 | 0 |
| ValleAosta | 0.609 | 0 | 0.652 | 0.099 | 0.279 | 0 | 0.973 | 0 | 0 | 0 | 0 | 0 | 0 | 0.447 | 0.058 | 0.732 | 0 | 0.947 | 0.307 | 1 | 0 |
| Veneto | 0 | 0 | 0 | 0 | 0 | 0.837 | 0 | 0 | 0 | 0.486 | 0 | 0 | 0.161 | 0 | 0 | 0 | 0 | 0 | 0 | 0 | 1 |
| Abruzzo | Basilicata | Bolzano | Calabria | Campania | Emilia | Friuli | Lazio | Liguria | Lombardi | Marche | Molise | Piemonte | Puglia | Sardegna | Sicilia | Toscana | Trento | Umbria | ValleAosta | Veneto | |
|---|---|---|---|---|---|---|---|---|---|---|---|---|---|---|---|---|---|---|---|---|---|
| Abruzzo | 1 | 0 | 0.89 | 0 | 0.55 | 0 | 0 | 0.59 | 0 | 0 | 0 | 0 | 0 | 0.58 | 0 | 0.73 | 0.06 | 0 | 0 | 0.08 | 0 |
| Basilicata | 0 | 0 | 0 | 0 | 0 | 0 | 0 | 0 | 0 | 0 | 0 | 0 | 0 | 0 | 0 | 0 | 0 | 0 | 0 | 0.32 | 0 |
| Bolzano | 0.89 | 0 | 1 | 0 | 0.5 | 0 | 0 | 0.5 | 0 | 0 | 0 | 0 | 0 | 0.25 | 0 | 0.59 | 0 | 0 | 0 | 0 | 0 |
| Calabria | 0 | 0 | 0 | 0 | 0 | 0 | 0 | 0 | 0 | 0 | 0 | 0 | 0 | 0 | 0 | 0 | 0 | 0 | 0 | 0.32 | 0 |
| Campania | 0.55 | 0.02 | 0.5 | 0.02 | 1 | 0 | 0.02 | 0.89 | 0.05 | 0 | 0 | 0.02 | 0.09 | 0.28 | 0.02 | 0.6 | 0.19 | 0.02 | 0.02 | 0.06 | 0 |
| Emilia | 0 | 0 | 0 | 0 | 0 | 1 | 0 | 0 | 0 | 0 | 0.11 | 0 | 0 | 0 | 0 | 0 | 0 | 0 | 0 | 0 | 0 |
| Friuli | 0 | 0 | 0 | 0 | 0 | 0 | 0 | 0 | 0 | 0 | 0 | 0 | 0 | 0 | 0 | 0 | 0 | 0 | 0 | 0.32 | 0 |
| Lazio | 0.59 | 0.02 | 0.5 | 0.02 | 0.89 | 0 | 0.02 | 1 | 0.05 | 0 | 0 | 0.02 | 0.09 | 0.28 | 0.02 | 0.59 | 0.19 | 0.02 | 0.02 | 0.06 | 0 |
| Liguria | 0 | 0 | 0 | 0 | 0.05 | 0 | 0 | 0.05 | 1 | 0 | 0.08 | 0 | 0.8 | 0 | 0 | 0.05 | 0.33 | 0 | 0 | 0 | 0 |
| Lombardi | 0 | 0 | 0 | 0 | 0 | 0 | 0 | 0 | 0 | 1 | 0 | 0 | 0 | 0 | 0 | 0 | 0 | 0 | 0 | 0 | 0 |
| Marche | 0 | 0 | 0 | 0 | 0 | 0.11 | 0 | 0 | 0.08 | 0 | 1 | 0 | 0 | 0 | 0 | 0 | 0 | 0 | 0 | 0 | 0 |
| Molise | 0 | 0 | 0 | 0 | 0 | 0 | 0 | 0 | 0 | 0 | 0 | 0 | 0 | 0 | 0 | 0 | 0 | 0 | 0 | 0.32 | 0 |
| Piemonte | 0 | 0 | 0 | 0 | 0.09 | 0 | 0 | 0.09 | 0.8 | 0 | 0 | 0 | 1 | 0 | 0 | 0 | 0.53 | 0 | 0 | 0 | 0 |
| Puglia | 0.58 | 0.02 | 0.25 | 0.02 | 0.28 | 0 | 0.02 | 0.28 | 0 | 0 | 0 | 0.02 | 0 | 1 | 0.02 | 0.17 | 0 | 0.02 | 0.02 | 0.11 | 0 |
| Sardegna | 0 | 0 | 0 | 0 | 0 | 0 | 0 | 0 | 0 | 0 | 0 | 0 | 0 | 0 | 0 | 0 | 0 | 0 | 0 | 0.32 | 0 |
| Sicilia | 0.73 | 0 | 0.59 | 0 | 0.6 | 0 | 0 | 0.59 | 0.05 | 0 | 0 | 0 | 0 | 0.17 | 0 | 1 | 0 | 0 | 0 | 0 | 0 |
| Toscana | 0.06 | 0 | 0 | 0 | 0.19 | 0 | 0 | 0.19 | 0.33 | 0 | 0 | 0 | 0.53 | 0 | 0 | 0 | 1 | 0 | 0 | 0 | 0 |
| Trento | 0 | 0 | 0 | 0 | 0 | 0 | 0 | 0 | 0 | 0 | 0 | 0 | 0 | 0 | 0 | 0 | 0 | 0 | 0 | 0.32 | 0 |
| Umbria | 0 | 0 | 0 | 0 | 0 | 0 | 0 | 0 | 0 | 0 | 0 | 0 | 0 | 0 | 0 | 0 | 0 | 0 | 0 | 0.32 | 0 |
| ValleAosta | 0.08 | 0.32 | 0 | 0.32 | 0.06 | 0 | 0.32 | 0.06 | 0 | 0 | 0 | 0.32 | 0 | 0.11 | 0.32 | 0 | 0 | 0.32 | 0.32 | 1 | 0 |
| Veneto | 0 | 0 | 0 | 0 | 0 | 0 | 0 | 0 | 0 | 0 | 0 | 0 | 0 | 0 | 0 | 0 | 0 | 0 | 0 | 0 | 1 |
| Abruzzo | Basilicata | Bolzano | Calabria | Campania | Emilia | Friuli | Lazio | Liguria | Lombardi | Marche | Molise | Piemonte | Puglia | Sardegna | Sicilia | Toscana | Trento | Umbria | ValleAosta | Veneto | |
|---|---|---|---|---|---|---|---|---|---|---|---|---|---|---|---|---|---|---|---|---|---|
| Abruzzo | 1 | 0 | 0 | 0 | 0.08 | 0 | 0.05 | 0 | 0 | 0 | 0 | 0 | 0 | 0.37 | 0 | 0.27 | 0 | 0 | 0 | 0.12 | 0 |
| Basilicata | 0 | 1 | 0 | 0.37 | 0 | 0 | 0 | 0 | 0 | 0 | 0 | 0 | 0 | 0 | 0.06 | 0 | 0 | 0 | 0 | 0 | 0 |
| Bolzano | 0 | 0 | 1 | 0.21 | 0 | 0 | 0.74 | 0 | 0 | 0 | 0 | 0.7 | 0 | 0.12 | 0.64 | 0.13 | 0 | 1 | 0.43 | 0 | 0 |
| Calabria | 0 | 0.37 | 0.21 | 1 | 0 | 0 | 0.1 | 0 | 0 | 0 | 0 | 0.05 | 0 | 0 | 0.46 | 0 | 0 | 0.24 | 0 | 0 | 0 |
| Campania | 0.08 | 0 | 0 | 0 | 1 | 0 | 0 | 0.28 | 0.06 | 0 | 0 | 0 | 0 | 0.07 | 0 | 0.06 | 0.18 | 0 | 0 | 0.34 | 0 |
| Emilia | 0 | 0 | 0 | 0 | 0 | 1 | 0 | 0 | 0 | 0 | 0 | 0 | 0 | 0 | 0 | 0 | 0 | 0 | 0 | 0 | 0 |
| Friuli | 0.05 | 0 | 0.74 | 0.1 | 0 | 0 | 1 | 0 | 0 | 0 | 0 | 1 | 0 | 0.33 | 0.2 | 0.33 | 0 | 0.7 | 0.84 | 0 | 0 |
| Lazio | 0 | 0 | 0 | 0 | 0.28 | 0 | 0 | 1 | 0.48 | 0 | 0 | 0 | 0.13 | 0 | 0 | 0 | 0.7 | 0 | 0 | 0.9 | 0 |
| Liguria | 0 | 0 | 0 | 0 | 0.06 | 0 | 0 | 0.48 | 1 | 0 | 0 | 0 | 0 | 0 | 0 | 0 | 0.52 | 0 | 0 | 0.85 | 0 |
| Lombardi | 0 | 0 | 0 | 0 | 0 | 0 | 0 | 0 | 0 | 1 | 0 | 0 | 0 | 0 | 0 | 0 | 0 | 0 | 0 | 0 | 0.53 |
| Marche | 0 | 0 | 0 | 0 | 0 | 0 | 0 | 0 | 0 | 0 | 1 | 0 | 0.46 | 0 | 0 | 0 | 0 | 0 | 0 | 0 | 0 |
| Molise | 0 | 0 | 0.7 | 0.05 | 0 | 0 | 1 | 0 | 0 | 0 | 0 | 1 | 0 | 0.3 | 0.07 | 0.27 | 0 | 0.65 | 0.56 | 0 | 0 |
| Piemonte | 0 | 0 | 0 | 0 | 0 | 0 | 0 | 0.13 | 0 | 0 | 0.46 | 0 | 1 | 0 | 0 | 0 | 0.32 | 0 | 0 | 0.16 | 0 |
| Puglia | 0.37 | 0 | 0.12 | 0 | 0.07 | 0 | 0.33 | 0 | 0 | 0 | 0 | 0.3 | 0 | 1 | 0 | 0.95 | 0 | 0.16 | 0.18 | 0 | 0 |
| Sardegna | 0 | 0.06 | 0.64 | 0.46 | 0 | 0 | 0.2 | 0 | 0 | 0 | 0 | 0.07 | 0 | 0 | 1 | 0 | 0 | 0.56 | 0.06 | 0 | 0 |
| Sicilia | 0.27 | 0 | 0.13 | 0 | 0.06 | 0 | 0.33 | 0 | 0 | 0 | 0 | 0.27 | 0 | 0.95 | 0 | 1 | 0 | 0.16 | 0.13 | 0.05 | 0 |
| Toscana | 0 | 0 | 0 | 0 | 0.18 | 0 | 0 | 0.7 | 0.52 | 0 | 0 | 0 | 0.32 | 0 | 0 | 0 | 1 | 0 | 0 | 0.9 | 0 |
| Trento | 0 | 0 | 1 | 0.24 | 0 | 0 | 0.7 | 0 | 0 | 0 | 0 | 0.65 | 0 | 0.16 | 0.56 | 0.16 | 0 | 1 | 0.56 | 0 | 0 |
| Umbria | 0 | 0 | 0.43 | 0 | 0 | 0 | 0.84 | 0 | 0 | 0 | 0 | 0.56 | 0 | 0.18 | 0.06 | 0.13 | 0 | 0.56 | 1 | 0 | 0 |
| ValleAosta | 0.12 | 0 | 0 | 0 | 0.34 | 0 | 0 | 0.9 | 0.85 | 0 | 0 | 0 | 0.16 | 0 | 0 | 0.05 | 0.9 | 0 | 0 | 1 | 0 |
| Veneto | 0 | 0 | 0 | 0 | 0 | 0 | 0 | 0 | 0 | 0.53 | 0 | 0 | 0 | 0 | 0 | 0 | 0 | 0 | 0 | 0 | 1 |
| Abruzzo | Basilicata | Bolzano | Calabria | Campania | Emilia | Friuli | Lazio | Liguria | Lombardi | Marche | Molise | Piemonte | Puglia | Sardegna | Sicilia | Toscana | Trento | Umbria | ValleAosta | Veneto | |
|---|---|---|---|---|---|---|---|---|---|---|---|---|---|---|---|---|---|---|---|---|---|
| Abruzzo | 1 | 0 | 0 | 0 | 0.141 | 0 | 0.949 | 0 | 0 | 0 | 0 | 0 | 0 | 0.336 | 0 | 0.224 | 0 | 0.848 | 0 | 0.406 | 0 |
| Basilicata | 0 | 0 | 0 | 0 | 0 | 0 | 0 | 0 | 0 | 0 | 0 | 0 | 0 | 0 | 0 | 0 | 0 | 0 | 0 | 0 | 0 |
| Bolzano | 0 | 0.001 | 1 | 0.481 | 0 | 0 | 0.083 | 0 | 0 | 0 | 0 | 0 | 0 | 0 | 0.054 | 0.249 | 0 | 0.124 | 1 | 0.306 | 0 |
| Calabria | 0 | 0.001 | 0.481 | 1 | 0 | 0 | 0 | 0 | 0 | 0 | 0 | 0 | 0 | 0 | 0.198 | 0 | 0 | 0 | 0.368 | 0.073 | 0.056 |
| Campania | 0.141 | 0.001 | 0 | 0 | 1 | 0 | 0.177 | 0.11 | 0 | 0 | 0 | 0 | 0 | 0.701 | 0 | 0 | 0 | 0.179 | 0 | 0.141 | 0 |
| Emilia | 0 | 0.001 | 0 | 0 | 0 | 1 | 0 | 0 | 0 | 0 | 0 | 0 | 0 | 0 | 0 | 0 | 0 | 0 | 0 | 0 | 0.056 |
| Friuli | 0.949 | 0.001 | 0.083 | 0 | 0.177 | 0 | 1 | 0 | 0 | 0 | 0 | 0 | 0 | 0.277 | 0 | 0.478 | 0 | 0.949 | 0.096 | 0.521 | 0 |
| Lazio | 0 | 0.001 | 0 | 0 | 0.11 | 0 | 0 | 1 | 0.383 | 0 | 0 | 0 | 0 | 0.053 | 0 | 0 | 0.165 | 0 | 0 | 0 | 0.056 |
| Liguria | 0 | 0.001 | 0 | 0 | 0 | 0 | 0 | 0.383 | 1 | 0 | 0 | 0 | 0 | 0 | 0 | 0 | 0.535 | 0 | 0 | 0 | 0.056 |
| Lombardi | 0 | 0.001 | 0 | 0 | 0 | 0 | 0 | 0 | 0 | 1 | 0 | 0 | 0 | 0 | 0 | 0 | 0 | 0 | 0 | 0 | 0.056 |
| Marche | 0 | 0.001 | 0 | 0 | 0 | 0 | 0 | 0 | 0 | 0 | 1 | 0 | 0.383 | 0 | 0 | 0 | 0 | 0 | 0 | 0 | 0.056 |
| Molise | 0 | 0.001 | 0 | 0 | 0 | 0 | 0 | 0 | 0 | 0 | 0 | 1 | 0 | 0 | 0 | 0 | 0 | 0 | 0 | 0 | 0 |
| Piemonte | 0 | 0.001 | 0 | 0 | 0 | 0 | 0 | 0 | 0 | 0 | 0.383 | 0 | 1 | 0 | 0 | 0 | 0 | 0 | 0 | 0 | 0.056 |
| Puglia | 0.336 | 0.001 | 0 | 0 | 0.701 | 0 | 0.277 | 0.053 | 0 | 0 | 0 | 0 | 0 | 1 | 0 | 0.084 | 0 | 0.456 | 0 | 0.125 | 0.056 |
| Sardegna | 0 | 0.001 | 0.054 | 0.198 | 0 | 0 | 0 | 0 | 0 | 0 | 0 | 0 | 0 | 0 | 1 | 0 | 0 | 0 | 0 | 0 | 0 |
| Sicilia | 0.224 | 0.001 | 0.249 | 0 | 0 | 0 | 0.478 | 0 | 0 | 0 | 0 | 0 | 0 | 0.084 | 0 | 1 | 0 | 0.482 | 0.179 | 0.949 | 0 |
| Toscana | 0 | 0.001 | 0 | 0 | 0 | 0 | 0 | 0.165 | 0.535 | 0 | 0 | 0 | 0 | 0 | 0 | 0 | 1 | 0 | 0 | 0 | 0.056 |
| Trento | 0.848 | 0.001 | 0.124 | 0 | 0.179 | 0 | 0.949 | 0 | 0 | 0 | 0 | 0 | 0 | 0.456 | 0 | 0.482 | 0 | 1 | 0.084 | 0.805 | 0.056 |
| Umbria | 0 | 0.001 | 1 | 0.368 | 0 | 0 | 0.096 | 0 | 0 | 0 | 0 | 0 | 0 | 0 | 0 | 0.179 | 0 | 0.084 | 1 | 0.306 | 0.056 |
| ValleAosta | 0.406 | 0.001 | 0.306 | 0.073 | 0.141 | 0 | 0.521 | 0 | 0 | 0 | 0 | 0 | 0 | 0.125 | 0 | 0.949 | 0 | 0.805 | 0.306 | 1 | 0.056 |
| Veneto | 0 | 0.005 | 0 | 0.056 | 0 | 0.056 | 0 | 0.056 | 0.056 | 0.056 | 0.056 | 0 | 0.056 | 0.056 | 0 | 0 | 0.056 | 0.056 | 0.056 | 0.056 | 1 |
| Abruzzo | Basilicata | Bolzano | Calabria | Campania | Emilia | Friuli | Lazio | Liguria | Lombardi | Marche | Molise | Piemonte | Puglia | Sardegna | Sicilia | Toscana | Trento | Umbria | ValleAosta | Veneto | |
|---|---|---|---|---|---|---|---|---|---|---|---|---|---|---|---|---|---|---|---|---|---|
| Abruzzo | 1 | 0 | 0 | 0 | 0.482 | 0 | 0.383 | 0 | 0 | 0 | 0.209 | 0 | 0 | 0.902 | 0 | 0.805 | 0 | 0.805 | 0 | 0 | 0 |
| Basilicata | 0 | 1 | 0 | 0 | 0 | 0 | 0 | 0 | 0 | 0 | 0.179 | 0.109 | 0 | 0 | 0 | 0 | 0 | 0 | 0 | 0 | 0 |
| Bolzano | 0 | 0 | 1 | 0 | 0 | 0 | 0.053 | 0 | 0 | 0 | 0.209 | 0 | 0 | 0 | 0 | 0.073 | 0 | 0 | 0.62 | 0.201 | 0.201 |
| Calabria | 0 | 0 | 0 | 1 | 0 | 0 | 0 | 0 | 0 | 0 | 0.209 | 0 | 0 | 0 | 0.165 | 0 | 0 | 0 | 0 | 0.535 | 0.535 |
| Campania | 0.482 | 0 | 0 | 0 | 1 | 0 | 0.442 | 0 | 0 | 0 | 0.179 | 0 | 0 | 0.949 | 0 | 0.482 | 0 | 0.749 | 0 | 0 | 0 |
| Emilia | 0 | 0 | 0 | 0 | 0 | 1 | 0 | 0 | 0 | 0 | 0 | 0 | 0.62 | 0 | 0 | 0 | 0 | 0 | 0 | 0 | 0 |
| Friuli | 0.383 | 0 | 0.053 | 0 | 0.442 | 0 | 1 | 0 | 0 | 0 | 0.209 | 0 | 0 | 0.128 | 0 | 0.701 | 0 | 0.306 | 0 | 0 | 0 |
| Lazio | 0 | 0 | 0 | 0 | 0 | 0 | 0 | 1 | 0.456 | 0 | 0.201 | 0 | 0 | 0 | 0 | 0 | 0.165 | 0 | 0 | 0 | 0 |
| Liguria | 0 | 0 | 0 | 0 | 0 | 0 | 0 | 0.456 | 1 | 0 | 0.383 | 0 | 0 | 0 | 0 | 0 | 0.71 | 0 | 0 | 0 | 0 |
| Lombardi | 0 | 0 | 0 | 0 | 0 | 0 | 0 | 0 | 0 | 1 | 0 | 0 | 0 | 0 | 0 | 0 | 0 | 0 | 0 | 0 | 0 |
| Marche | 0.209 | 0.179 | 0.209 | 0.209 | 0.179 | 0 | 0.209 | 0.201 | 0.383 | 0 | 1 | 0.209 | 0 | 0.209 | 0.209 | 0.209 | 0.805 | 0.209 | 0.209 | 0.209 | 0.209 |
| Molise | 0 | 0.109 | 0 | 0 | 0 | 0 | 0 | 0 | 0 | 0 | 0.209 | 1 | 0 | 0 | 0 | 0 | 0 | 0 | 0 | 0 | 0 |
| Piemonte | 0 | 0 | 0 | 0 | 0 | 0.62 | 0 | 0 | 0 | 0 | 0 | 0 | 1 | 0 | 0 | 0 | 0 | 0 | 0 | 0 | 0 |
| Puglia | 0.902 | 0 | 0 | 0 | 0.949 | 0 | 0.128 | 0 | 0 | 0 | 0.209 | 0 | 0 | 1 | 0 | 0.535 | 0 | 0.805 | 0 | 0 | 0 |
| Sardegna | 0 | 0 | 0 | 0.165 | 0 | 0 | 0 | 0 | 0 | 0 | 0.209 | 0 | 0 | 0 | 1 | 0 | 0 | 0 | 0 | 0.318 | 0.318 |
| Sicilia | 0.805 | 0 | 0.073 | 0 | 0.482 | 0 | 0.701 | 0 | 0 | 0 | 0.209 | 0 | 0 | 0.535 | 0 | 1 | 0 | 0.701 | 0.053 | 0 | 0 |
| Toscana | 0 | 0 | 0 | 0 | 0 | 0 | 0 | 0.165 | 0.71 | 0 | 0.805 | 0 | 0 | 0 | 0 | 0 | 1 | 0 | 0 | 0 | 0 |
| Trento | 0.805 | 0 | 0 | 0 | 0.749 | 0 | 0.306 | 0 | 0 | 0 | 0.209 | 0 | 0 | 0.805 | 0 | 0.701 | 0 | 1 | 0 | 0 | 0 |
| Umbria | 0 | 0 | 0.62 | 0 | 0 | 0 | 0 | 0 | 0 | 0 | 0.209 | 0 | 0 | 0 | 0 | 0.053 | 0 | 0 | 1 | 0.306 | 0.306 |
| ValleAosta | 0 | 0 | 0.201 | 0.535 | 0 | 0 | 0 | 0 | 0 | 0 | 0.209 | 0 | 0 | 0 | 0.318 | 0 | 0 | 0 | 0.306 | 1 | 1 |
| Veneto | 0 | 0 | 0.201 | 0.535 | 0 | 0 | 0 | 0 | 0 | 0 | 0.209 | 0 | 0 | 0 | 0.318 | 0 | 0 | 0 | 0.306 | 1 | 1 |
| Abruzzo | Basilicata | Bolzano | Calabria | Campania | Emilia | Friuli | Lazio | Liguria | Lombardi | Marche | Molise | Piemonte | Puglia | Sardegna | Sicilia | Toscana | Trento | Umbria | ValleAosta | Veneto | |
|---|---|---|---|---|---|---|---|---|---|---|---|---|---|---|---|---|---|---|---|---|---|
| Abruzzo | 1 | 0 | 0 | 0 | 0 | 0 | 0 | 0 | 0 | 0 | 0 | 0 | 0 | 0 | 0 | 0.11 | 0 | 0.128 | 0 | 0 | 0 |
| Basilicata | 0 | 1 | 0 | 0 | 0 | 0 | 0 | 0 | 0 | 0 | 0 | 0.402 | 0 | 0 | 0 | 0 | 0 | 0 | 0 | 0 | 0 |
| Bolzano | 0 | 0 | 1 | 0 | 0 | 0 | 0.609 | 0 | 0 | 0 | 0 | 0 | 0 | 0 | 0 | 0 | 0 | 0 | 0 | 0 | 0 |
| Calabria | 0 | 0 | 0 | 1 | 0 | 0 | 0 | 0 | 0 | 0 | 0 | 0 | 0 | 0 | 0.11 | 0 | 0 | 0 | 0 | 0 | 0 |
| Campania | 0 | 0 | 0 | 0 | 1 | 0 | 0 | 0 | 0 | 0 | 0 | 0 | 0 | 1 | 0 | 0 | 0 | 0 | 0 | 0 | 0 |
| Emilia | 0 | 0 | 0 | 0 | 0 | 1 | 0 | 0 | 0 | 0 | 0 | 0 | 0 | 0 | 0 | 0 | 0 | 0 | 0 | 0 | 0 |
| Friuli | 0 | 0 | 0.609 | 0 | 0 | 0 | 1 | 0 | 0 | 0 | 0 | 0 | 0 | 0 | 0 | 0 | 0 | 0 | 0 | 0 | 0 |
| Lazio | 0 | 0 | 0 | 0 | 0 | 0 | 0 | 1 | 0.179 | 0 | 0.141 | 0 | 0 | 0 | 0 | 0 | 0 | 0 | 0 | 0 | 0 |
| Liguria | 0 | 0 | 0 | 0 | 0 | 0 | 0 | 0.179 | 1 | 0 | 0.71 | 0 | 0 | 0 | 0 | 0 | 0 | 0 | 0 | 0 | 0 |
| Lombardi | 0 | 0 | 0 | 0 | 0 | 0 | 0 | 0 | 0 | 1 | 0 | 0 | 0 | 0 | 0 | 0 | 0 | 0 | 0 | 0 | 0 |
| Marche | 0 | 0 | 0 | 0 | 0 | 0 | 0 | 0.141 | 0.71 | 0 | 1 | 0 | 0 | 0 | 0 | 0 | 0 | 0 | 0 | 0 | 0 |
| Molise | 0 | 0.402 | 0 | 0 | 0 | 0 | 0 | 0 | 0 | 0 | 0 | 1 | 0 | 0 | 0 | 0 | 0 | 0 | 0 | 0 | 0 |
| Piemonte | 0 | 0 | 0 | 0 | 0 | 0 | 0 | 0 | 0 | 0 | 0 | 0 | 1 | 0 | 0 | 0 | 0 | 0 | 0 | 0 | 0 |
| Puglia | 0 | 0 | 0 | 0 | 1 | 0 | 0 | 0 | 0 | 0 | 0 | 0 | 0 | 1 | 0 | 0.141 | 0 | 0.097 | 0 | 0 | 0 |
| Sardegna | 0 | 0 | 0 | 0.11 | 0 | 0 | 0 | 0 | 0 | 0 | 0 | 0 | 0 | 0 | 1 | 0 | 0 | 0 | 0 | 0.337 | 0 |
| Sicilia | 0.11 | 0 | 0 | 0 | 0 | 0 | 0 | 0 | 0 | 0 | 0 | 0 | 0 | 0.141 | 0 | 1 | 0 | 0.565 | 0 | 0 | 0 |
| Toscana | 0 | 0 | 0 | 0 | 0 | 0 | 0 | 0 | 0 | 0 | 0 | 0 | 0 | 0 | 0 | 0 | 1 | 0 | 0 | 0 | 0 |
| Trento | 0.128 | 0 | 0 | 0 | 0 | 0 | 0 | 0 | 0 | 0 | 0 | 0 | 0 | 0.097 | 0 | 0.565 | 0 | 1 | 0 | 0 | 0 |
| Umbria | 0 | 0 | 0 | 0 | 0 | 0 | 0 | 0 | 0 | 0 | 0 | 0 | 0 | 0 | 0 | 0 | 0 | 0 | 1 | 0 | 0 |
| ValleAosta | 0 | 0 | 0 | 0 | 0 | 0 | 0 | 0 | 0 | 0 | 0 | 0 | 0 | 0 | 0.337 | 0 | 0 | 0 | 0 | 1 | 0 |
| Veneto | 0 | 0 | 0 | 0 | 0 | 0 | 0 | 0 | 0 | 0 | 0 | 0 | 0 | 0 | 0 | 0 | 0 | 0 | 0 | 0 | 1 |
| Abruzzo | Basilicata | Bolzano | Calabria | Campania | Emilia | Friuli | Lazio | Liguria | Lombardi | Marche | Molise | Piemonte | Puglia | Sardegna | Sicilia | Toscana | Trento | Umbria | ValleAosta | Veneto | |
|---|---|---|---|---|---|---|---|---|---|---|---|---|---|---|---|---|---|---|---|---|---|
| Abruzzo | 1 | 0.262 | 0.607 | 0.914 | 0 | 0 | 0 | 0.151 | 0 | 0 | 0 | 0.135 | 0 | 0.154 | 0.973 | 0.08 | 0 | 0.224 | 0.144 | 0 | 0 |
| Basilicata | 0.262 | 1 | 0.19 | 0.279 | 0 | 0 | 0 | 0 | 0 | 0 | 0 | 0.919 | 0 | 0 | 0.164 | 0 | 0 | 0 | 0 | 0 | 0 |
| Bolzano | 0.607 | 0.19 | 1 | 0.699 | 0.106 | 0 | 0.217 | 0.438 | 0.143 | 0 | 0 | 0.106 | 0.072 | 0.383 | 0.533 | 0.338 | 0 | 0.522 | 0.537 | 0.309 | 0 |
| Calabria | 0.914 | 0.279 | 0.699 | 1 | 0 | 0 | 0 | 0.119 | 0 | 0 | 0 | 0.156 | 0 | 0.074 | 0.813 | 0 | 0 | 0.172 | 0.067 | 0 | 0 |
| Campania | 0 | 0 | 0.106 | 0 | 1 | 0 | 0.778 | 0.357 | 0.648 | 0 | 0 | 0 | 0.717 | 0.173 | 0 | 0.268 | 0.333 | 0.301 | 0.213 | 0.677 | 0 |
| Emilia | 0 | 0 | 0 | 0 | 0 | 1 | 0 | 0 | 0 | 0.793 | 0.259 | 0 | 0 | 0 | 0 | 0 | 0 | 0 | 0 | 0 | 0 |
| Friuli | 0 | 0 | 0.217 | 0 | 0.778 | 0 | 1 | 0.608 | 0.946 | 0 | 0 | 0 | 0.55 | 0.329 | 0 | 0.424 | 0.226 | 0.484 | 0.37 | 0.962 | 0 |
| Lazio | 0.151 | 0 | 0.438 | 0.119 | 0.357 | 0 | 0.608 | 1 | 0.595 | 0 | 0 | 0 | 0.145 | 0.783 | 0.165 | 1 | 0.099 | 0.797 | 0.815 | 0.54 | 0 |
| Liguria | 0 | 0 | 0.143 | 0 | 0.648 | 0 | 0.946 | 0.595 | 1 | 0 | 0 | 0 | 0.472 | 0.271 | 0 | 0.436 | 0.304 | 0.275 | 0.429 | 0.851 | 0 |
| Lombardi | 0 | 0 | 0 | 0 | 0 | 0.793 | 0 | 0 | 0 | 1 | 0.677 | 0 | 0 | 0 | 0 | 0 | 0 | 0 | 0 | 0 | 0.053 |
| Marche | 0 | 0 | 0 | 0 | 0 | 0.259 | 0 | 0 | 0 | 0.677 | 1 | 0 | 0 | 0 | 0 | 0 | 0 | 0 | 0 | 0 | 0 |
| Molise | 0.135 | 0.919 | 0.106 | 0.156 | 0 | 0 | 0 | 0 | 0 | 0 | 0 | 1 | 0 | 0 | 0.063 | 0 | 0 | 0 | 0 | 0 | 0 |
| Piemonte | 0 | 0 | 0.072 | 0 | 0.717 | 0 | 0.55 | 0.145 | 0.472 | 0 | 0 | 0 | 1 | 0.072 | 0 | 0.158 | 0.989 | 0.115 | 0.115 | 0.793 | 0 |
| Puglia | 0.154 | 0 | 0.383 | 0.074 | 0.173 | 0 | 0.329 | 0.783 | 0.271 | 0 | 0 | 0 | 0.072 | 1 | 0.2 | 0.722 | 0.05 | 0.984 | 0.874 | 0.326 | 0 |
| Sardegna | 0.973 | 0.164 | 0.533 | 0.813 | 0 | 0 | 0 | 0.165 | 0 | 0 | 0 | 0.063 | 0 | 0.2 | 1 | 0.095 | 0 | 0.25 | 0.177 | 0 | 0 |
| Sicilia | 0.08 | 0 | 0.338 | 0 | 0.268 | 0 | 0.424 | 1 | 0.436 | 0 | 0 | 0 | 0.158 | 0.722 | 0.095 | 1 | 0.091 | 0.752 | 0.826 | 0.314 | 0 |
| Toscana | 0 | 0 | 0 | 0 | 0.333 | 0 | 0.226 | 0.099 | 0.304 | 0 | 0 | 0 | 0.989 | 0.05 | 0 | 0.091 | 1 | 0.062 | 0.068 | 0.245 | 0 |
| Trento | 0.224 | 0 | 0.522 | 0.172 | 0.301 | 0 | 0.484 | 0.797 | 0.275 | 0 | 0 | 0 | 0.115 | 0.984 | 0.25 | 0.752 | 0.062 | 1 | 0.903 | 0.493 | 0 |
| Umbria | 0.144 | 0 | 0.537 | 0.067 | 0.213 | 0 | 0.37 | 0.815 | 0.429 | 0 | 0 | 0 | 0.115 | 0.874 | 0.177 | 0.826 | 0.068 | 0.903 | 1 | 0.382 | 0 |
| ValleAosta | 0 | 0 | 0.309 | 0 | 0.677 | 0 | 0.962 | 0.54 | 0.851 | 0 | 0 | 0 | 0.793 | 0.326 | 0 | 0.314 | 0.245 | 0.493 | 0.382 | 1 | 0 |
| Veneto | 0 | 0 | 0 | 0 | 0 | 0 | 0 | 0 | 0 | 0.053 | 0 | 0 | 0 | 0 | 0 | 0 | 0 | 0 | 0 | 0 | 1 |
| Abruzzo | Basilicata | Bolzano | Calabria | Campania | Emilia | Friuli | Lazio | Liguria | Lombardi | Marche | Molise | Piemonte | Puglia | Sardegna | Sicilia | Toscana | Trento | Umbria | ValleAosta | Veneto | |
|---|---|---|---|---|---|---|---|---|---|---|---|---|---|---|---|---|---|---|---|---|---|
| Abruzzo | 1 | 0.32 | 0.32 | 0.38 | 0.1 | 0 | 0.92 | 0.32 | 0 | 0 | 0 | 0.32 | 0 | 0.25 | 0.32 | 0 | 0.2 | 0.32 | 0.53 | 0.42 | 0 |
| Basilicata | 0.32 | 0 | 0 | 0.06 | 0 | 0 | 0.32 | 0 | 0 | 0 | 0 | 0 | 0 | 0.06 | 0 | 0 | 0.06 | 0 | 0.14 | 0.14 | 0 |
| Bolzano | 0.32 | 0 | 0 | 0.06 | 0 | 0 | 0.32 | 0 | 0 | 0 | 0 | 0 | 0 | 0.06 | 0 | 0 | 0.06 | 0 | 0.14 | 0.14 | 0 |
| Calabria | 0.38 | 0.06 | 0.06 | 1 | 0.27 | 0 | 0.38 | 0.06 | 0.05 | 0 | 0 | 0.06 | 0 | 0.52 | 0.06 | 0 | 0.52 | 0.06 | 0.94 | 0.94 | 0 |
| Campania | 0.1 | 0.03 | 0.03 | 0.27 | 1 | 0 | 0.12 | 0.03 | 0.39 | 0 | 0.19 | 0.03 | 0.56 | 0.49 | 0.03 | 0.84 | 0.58 | 0.03 | 0.26 | 0.32 | 0 |
| Emilia | 0 | 0 | 0 | 0 | 0 | 1 | 0 | 0 | 0 | 0 | 0 | 0 | 0 | 0 | 0 | 0 | 0 | 0 | 0 | 0 | 0 |
| Friuli | 0.92 | 0.32 | 0.32 | 0.38 | 0.12 | 0 | 1 | 0.32 | 0 | 0 | 0 | 0.32 | 0 | 0.38 | 0.32 | 0 | 0.38 | 0.32 | 0.66 | 0.42 | 0 |
| Lazio | 0.32 | 0 | 0 | 0.06 | 0 | 0 | 0.32 | 0 | 0 | 0 | 0 | 0 | 0 | 0.06 | 0 | 0 | 0.06 | 0 | 0.14 | 0.14 | 0 |
| Liguria | 0 | 0.01 | 0.01 | 0.05 | 0.39 | 0 | 0 | 0.01 | 1 | 0 | 0.75 | 0.01 | 0.4 | 0.05 | 0.01 | 0.17 | 0.06 | 0.01 | 0 | 0.08 | 0 |
| Lombardi | 0 | 0 | 0 | 0 | 0 | 0 | 0 | 0 | 0 | 1 | 0 | 0 | 0 | 0 | 0 | 0 | 0 | 0 | 0 | 0 | 0 |
| Marche | 0 | 0 | 0 | 0 | 0.19 | 0 | 0 | 0 | 0.75 | 0 | 1 | 0 | 0.51 | 0.08 | 0 | 0.24 | 0.08 | 0 | 0 | 0 | 0 |
| Molise | 0.32 | 0 | 0 | 0.06 | 0 | 0 | 0.32 | 0 | 0 | 0 | 0 | 0 | 0 | 0.06 | 0 | 0 | 0.06 | 0 | 0.14 | 0.14 | 0 |
| Piemonte | 0 | 0 | 0 | 0 | 0.56 | 0 | 0 | 0 | 0.4 | 0 | 0.51 | 0 | 1 | 0.17 | 0 | 0.74 | 0.26 | 0 | 0.06 | 0.18 | 0 |
| Puglia | 0.25 | 0.06 | 0.06 | 0.52 | 0.49 | 0 | 0.38 | 0.06 | 0.05 | 0 | 0.08 | 0.06 | 0.17 | 1 | 0.06 | 0.31 | 0.67 | 0.06 | 0.59 | 0.94 | 0 |
| Sardegna | 0.32 | 0 | 0 | 0.06 | 0 | 0 | 0.32 | 0 | 0 | 0 | 0 | 0 | 0 | 0.06 | 0 | 0 | 0.06 | 0 | 0.14 | 0.14 | 0 |
| Sicilia | 0 | 0 | 0 | 0 | 0.84 | 0 | 0 | 0 | 0.17 | 0 | 0.24 | 0 | 0.74 | 0.31 | 0 | 1 | 0.47 | 0 | 0.1 | 0.28 | 0 |
| Toscana | 0.2 | 0.06 | 0.06 | 0.52 | 0.58 | 0 | 0.38 | 0.06 | 0.06 | 0 | 0.08 | 0.06 | 0.26 | 0.67 | 0.06 | 0.47 | 1 | 0.06 | 0.41 | 0.94 | 0 |
| Trento | 0.32 | 0 | 0 | 0.06 | 0 | 0 | 0.32 | 0 | 0 | 0 | 0 | 0 | 0 | 0.06 | 0 | 0 | 0.06 | 0 | 0.14 | 0.14 | 0 |
| Umbria | 0.53 | 0.14 | 0.14 | 0.94 | 0.26 | 0 | 0.66 | 0.14 | 0 | 0 | 0 | 0.14 | 0.06 | 0.59 | 0.14 | 0.1 | 0.41 | 0.14 | 1 | 0.75 | 0 |
| ValleAosta | 0.42 | 0.14 | 0.14 | 0.94 | 0.32 | 0 | 0.42 | 0.14 | 0.08 | 0 | 0 | 0.14 | 0.18 | 0.94 | 0.14 | 0.28 | 0.94 | 0.14 | 0.75 | 1 | 0 |
| Veneto | 0 | 0 | 0 | 0 | 0 | 0 | 0 | 0 | 0 | 0 | 0 | 0 | 0 | 0 | 0 | 0 | 0 | 0 | 0 | 0 | 1 |
| Abruzzo | Basilicata | Bolzano | Calabria | Campania | Emilia | Friuli | Lazio | Liguria | Lombardi | Marche | Molise | Piemonte | Puglia | Sardegna | Sicilia | Toscana | Trento | Umbria | ValleAosta | Veneto | |
|---|---|---|---|---|---|---|---|---|---|---|---|---|---|---|---|---|---|---|---|---|---|
| Abruzzo | 1 | 0.32 | 0.41 | 0.13 | 0 | 0 | 0 | 0 | 0 | 0 | 0 | 0.22 | 0 | 0 | 0.41 | 0 | 0 | 0 | 0 | 0 | 0 |
| Basilicata | 0.32 | 1 | 0 | 0.62 | 0 | 0 | 0 | 0 | 0 | 0 | 0 | 0.51 | 0 | 0 | 0.95 | 0 | 0 | 0 | 0 | 0 | 0 |
| Bolzano | 0.41 | 0 | 1 | 0 | 0 | 0 | 0 | 0 | 0 | 0 | 0 | 0.12 | 0 | 0 | 0.15 | 0 | 0 | 0 | 0 | 0 | 0 |
| Calabria | 0.13 | 0.62 | 0 | 1 | 0 | 0 | 0 | 0.05 | 0 | 0 | 0 | 0.75 | 0 | 0 | 0.65 | 0 | 0 | 0 | 0 | 0 | 0 |
| Campania | 0 | 0 | 0 | 0 | 1 | 0 | 0.14 | 0 | 0 | 0 | 0.18 | 0 | 0.11 | 0 | 0 | 0 | 0.8 | 0 | 0 | 0.25 | 0 |
| Emilia | 0 | 0 | 0 | 0 | 0 | 1 | 0 | 0 | 0 | 0.16 | 0 | 0 | 0 | 0 | 0 | 0 | 0 | 0 | 0 | 0 | 0 |
| Friuli | 0 | 0 | 0 | 0 | 0.14 | 0 | 1 | 0.2 | 0 | 0 | 0 | 0 | 0 | 0 | 0 | 0.25 | 0.52 | 0 | 0.16 | 0.06 | 0 |
| Lazio | 0 | 0 | 0 | 0.05 | 0 | 0 | 0.2 | 1 | 0.4 | 0 | 0 | 0 | 0 | 0.4 | 0 | 0.75 | 0.11 | 0.16 | 0.85 | 0 | 0 |
| Liguria | 0 | 0 | 0 | 0 | 0 | 0 | 0 | 0.4 | 1 | 0 | 0 | 0.12 | 0 | 0.48 | 0 | 0.34 | 0 | 0.11 | 0.17 | 0 | 0 |
| Lombardi | 0 | 0 | 0 | 0 | 0 | 0.16 | 0 | 0 | 0 | 1 | 0 | 0 | 0 | 0 | 0 | 0 | 0 | 0 | 0 | 0 | 0 |
| Marche | 0 | 0 | 0 | 0 | 0.18 | 0 | 0 | 0 | 0 | 0 | 1 | 0 | 0.8 | 0 | 0 | 0 | 0.14 | 0 | 0 | 0.8 | 0 |
| Molise | 0.22 | 0.51 | 0.12 | 0.75 | 0 | 0 | 0 | 0 | 0.12 | 0 | 0 | 1 | 0 | 0.18 | 0.42 | 0 | 0 | 0.6 | 0 | 0 | 0 |
| Piemonte | 0 | 0 | 0 | 0 | 0.11 | 0 | 0 | 0 | 0 | 0 | 0.8 | 0 | 1 | 0 | 0 | 0 | 0.13 | 0 | 0 | 0.71 | 0 |
| Puglia | 0 | 0 | 0 | 0 | 0 | 0 | 0 | 0.4 | 0.48 | 0 | 0 | 0.18 | 0 | 1 | 0 | 0.27 | 0 | 0.61 | 0.08 | 0 | 0 |
| Sardegna | 0.41 | 0.95 | 0.15 | 0.65 | 0 | 0 | 0 | 0 | 0 | 0 | 0 | 0.42 | 0 | 0 | 1 | 0 | 0 | 0.06 | 0 | 0 | 0 |
| Sicilia | 0 | 0 | 0 | 0 | 0 | 0 | 0.25 | 0.75 | 0.34 | 0 | 0 | 0 | 0 | 0.27 | 0 | 1 | 0.14 | 0.14 | 0.95 | 0 | 0 |
| Toscana | 0 | 0 | 0 | 0 | 0.8 | 0 | 0.52 | 0.11 | 0 | 0 | 0.14 | 0 | 0.13 | 0 | 0 | 0.14 | 1 | 0 | 0.16 | 0.21 | 0 |
| Trento | 0 | 0 | 0 | 0 | 0 | 0 | 0 | 0.16 | 0.11 | 0 | 0 | 0.6 | 0 | 0.61 | 0.06 | 0.14 | 0 | 1 | 0 | 0 | 0 |
| Umbria | 0 | 0 | 0 | 0 | 0 | 0 | 0.16 | 0.85 | 0.17 | 0 | 0 | 0 | 0 | 0.08 | 0 | 0.95 | 0.16 | 0 | 1 | 0 | 0 |
| ValleAosta | 0 | 0 | 0 | 0 | 0.25 | 0 | 0.06 | 0 | 0 | 0 | 0.8 | 0 | 0.71 | 0 | 0 | 0 | 0.21 | 0 | 0 | 1 | 0 |
| Veneto | 0 | 0 | 0 | 0 | 0 | 0 | 0 | 0 | 0 | 0 | 0 | 0 | 0 | 0 | 0 | 0 | 0 | 0 | 0 | 0 | 1 |
| Abruzzo | Basilicata | Bolzano | Calabria | Campania | Emilia | Friuli | Lazio | Liguria | Lombardi | Marche | Molise | Piemonte | Puglia | Sardegna | Sicilia | Toscana | Trento | Umbria | ValleAosta | Veneto | |
|---|---|---|---|---|---|---|---|---|---|---|---|---|---|---|---|---|---|---|---|---|---|
| Abruzzo | 1 | 0 | 0.064 | 0.404 | 0 | 0 | 0 | 0 | 0 | 0 | 0 | 0 | 0 | 0 | 0.33 | 0 | 0 | 0 | 0 | 0 | 0 |
| Basilicata | 0 | 1 | 0 | 0.521 | 0 | 0 | 0 | 0 | 0 | 0 | 0 | 0 | 0 | 0 | 0 | 0 | 0 | 0 | 0 | 0 | 0 |
| Bolzano | 0.064 | 0 | 1 | 0 | 0.209 | 0 | 0.165 | 1 | 0.609 | 0 | 0 | 0 | 0.62 | 0.25 | 0.109 | 0.798 | 0 | 1 | 0.71 | 0.71 | 0.056 |
| Calabria | 0.404 | 0.521 | 0 | 1 | 0 | 0 | 0 | 0 | 0 | 0 | 0 | 0.647 | 0 | 0 | 0.158 | 0 | 0 | 0 | 0 | 0 | 0 |
| Campania | 0 | 0 | 0.209 | 0 | 1 | 0 | 0.71 | 0.128 | 0.443 | 0 | 0 | 0 | 0.383 | 0 | 0 | 0.055 | 0.053 | 0.209 | 0 | 0.522 | 0.056 |
| Emilia | 0 | 0 | 0 | 0 | 0 | 1 | 0 | 0 | 0 | 0 | 0 | 0 | 0 | 0 | 0 | 0 | 0 | 0 | 0 | 0 | 0.056 |
| Friuli | 0 | 0 | 0.165 | 0 | 0.71 | 0 | 1 | 0.073 | 0.318 | 0 | 0 | 0 | 0.25 | 0 | 0 | 0.073 | 0.073 | 0.209 | 0 | 0.62 | 0.056 |
| Lazio | 0 | 0 | 1 | 0 | 0.128 | 0 | 0.073 | 1 | 0.535 | 0 | 0 | 0 | 0.456 | 0.128 | 0 | 1 | 0 | 0.902 | 0.701 | 0.805 | 0.056 |
| Liguria | 0 | 0 | 0.609 | 0 | 0.443 | 0 | 0.318 | 0.535 | 1 | 0 | 0 | 0 | 1 | 0.063 | 0 | 0.383 | 0 | 0.609 | 0.318 | 1 | 0.056 |
| Lombardi | 0 | 0 | 0 | 0 | 0 | 0 | 0 | 0 | 0 | 1 | 0 | 0 | 0 | 0 | 0 | 0 | 0 | 0 | 0 | 0 | 0.056 |
| Marche | 0 | 0 | 0 | 0 | 0 | 0 | 0 | 0 | 0 | 0 | 1 | 0 | 0 | 0 | 0 | 0 | 0.71 | 0 | 0 | 0.073 | 0.056 |
| Molise | 0 | 0 | 0 | 0.647 | 0 | 0 | 0 | 0 | 0 | 0 | 0 | 1 | 0 | 0 | 0 | 0 | 0 | 0 | 0 | 0 | 0 |
| Piemonte | 0 | 0 | 0.62 | 0 | 0.383 | 0 | 0.25 | 0.456 | 1 | 0 | 0 | 0 | 1 | 0 | 0 | 0.165 | 0 | 0.318 | 0.097 | 0.71 | 0.056 |
| Puglia | 0 | 0 | 0.25 | 0 | 0 | 0 | 0 | 0.128 | 0.063 | 0 | 0 | 0 | 0 | 1 | 0.249 | 0.097 | 0 | 0.224 | 0.209 | 0.259 | 0.056 |
| Sardegna | 0.33 | 0 | 0.109 | 0.158 | 0 | 0 | 0 | 0 | 0 | 0 | 0 | 0 | 0 | 0.249 | 1 | 0 | 0 | 0.063 | 0 | 0.084 | 0 |
| Sicilia | 0 | 0 | 0.798 | 0 | 0.055 | 0 | 0.073 | 1 | 0.383 | 0 | 0 | 0 | 0.165 | 0.097 | 0 | 1 | 0 | 0.902 | 0.62 | 0.701 | 0.056 |
| Toscana | 0 | 0 | 0 | 0 | 0.053 | 0 | 0.073 | 0 | 0 | 0 | 0.71 | 0 | 0 | 0 | 0 | 0 | 1 | 0 | 0 | 0.097 | 0.056 |
| Trento | 0 | 0 | 1 | 0 | 0.209 | 0 | 0.209 | 0.902 | 0.609 | 0 | 0 | 0 | 0.318 | 0.224 | 0.063 | 0.902 | 0 | 1 | 0.902 | 0.805 | 0.056 |
| Umbria | 0 | 0 | 0.71 | 0 | 0 | 0 | 0 | 0.701 | 0.318 | 0 | 0 | 0 | 0.097 | 0.209 | 0 | 0.62 | 0 | 0.902 | 1 | 0.71 | 0.056 |
| ValleAosta | 0 | 0 | 0.71 | 0 | 0.522 | 0 | 0.62 | 0.805 | 1 | 0 | 0.073 | 0 | 0.71 | 0.259 | 0.084 | 0.701 | 0.097 | 0.805 | 0.71 | 1 | 0.056 |
| Veneto | 0 | 0 | 0.056 | 0 | 0.056 | 0.056 | 0.056 | 0.056 | 0.056 | 0.056 | 0.056 | 0 | 0.056 | 0.056 | 0 | 0.056 | 0.056 | 0.056 | 0.056 | 0.056 | 1 |
| Abruzzo | Basilicata | Bolzano | Calabria | Campania | Emilia | Friuli | Lazio | Liguria | Lombardi | Marche | Molise | Piemonte | Puglia | Sardegna | Sicilia | Toscana | Trento | Umbria | ValleAosta | Veneto | |
|---|---|---|---|---|---|---|---|---|---|---|---|---|---|---|---|---|---|---|---|---|---|
| Abruzzo | 1 | 0 | 0 | 0.159 | 0 | 0 | 0 | 0 | 0 | 0 | 0.179 | 0 | 0.084 | 0.159 | 0.805 | 0.609 | 0 | 0 | 0.053 | 0.165 | 0.165 |
| Basilicata | 0 | 1 | 0 | 0 | 0 | 0 | 0 | 0 | 0 | 0 | 0.179 | 0 | 0 | 0 | 0 | 0 | 0 | 0 | 0 | 0 | 0 |
| Bolzano | 0 | 0 | 1 | 0 | 0.277 | 0 | 0.71 | 0.902 | 1 | 0 | 0.179 | 0 | 0.848 | 0.383 | 0 | 0 | 0 | 0.71 | 0.456 | 0.128 | 0.128 |
| Calabria | 0.159 | 0 | 0 | 1 | 0 | 0 | 0 | 0 | 0 | 0 | 0.179 | 0 | 0 | 0 | 0.209 | 0 | 0 | 0 | 0 | 0 | 0 |
| Campania | 0 | 0 | 0.277 | 0 | 1 | 0 | 0.565 | 0.141 | 0.565 | 0 | 0.276 | 0 | 0.654 | 0.11 | 0 | 0 | 0 | 0.949 | 0.2 | 0 | 0 |
| Emilia | 0 | 0 | 0 | 0 | 0 | 1 | 0 | 0 | 0 | 0 | 0 | 0 | 0 | 0 | 0 | 0 | 0 | 0 | 0 | 0 | 0 |
| Friuli | 0 | 0 | 0.71 | 0 | 0.565 | 0 | 1 | 0.535 | 1 | 0 | 0.224 | 0 | 0.654 | 0.259 | 0 | 0 | 0 | 0.805 | 0.383 | 0.053 | 0.053 |
| Lazio | 0 | 0 | 0.902 | 0 | 0.141 | 0 | 0.535 | 1 | 0.535 | 0 | 0.2 | 0 | 0.898 | 0.62 | 0 | 0 | 0 | 0.318 | 0.71 | 0.318 | 0.318 |
| Liguria | 0 | 0 | 1 | 0 | 0.565 | 0 | 1 | 0.535 | 1 | 0 | 0.179 | 0 | 0.654 | 0.383 | 0 | 0 | 0 | 0.902 | 0.535 | 0 | 0 |
| Lombardi | 0 | 0 | 0 | 0 | 0 | 0 | 0 | 0 | 0 | 1 | 0 | 0 | 0 | 0 | 0 | 0 | 0 | 0 | 0 | 0 | 0 |
| Marche | 0.179 | 0.179 | 0.179 | 0.179 | 0.276 | 0 | 0.224 | 0.2 | 0.179 | 0 | 1 | 0.178 | 0.564 | 0.179 | 0.179 | 0.179 | 0.124 | 0.277 | 0.179 | 0.179 | 0.179 |
| Molise | 0 | 0 | 0 | 0 | 0 | 0 | 0 | 0 | 0 | 0 | 0.178 | 1 | 0 | 0 | 0 | 0 | 0 | 0 | 0 | 0 | 0 |
| Piemonte | 0.084 | 0 | 0.848 | 0 | 0.654 | 0 | 0.654 | 0.898 | 0.654 | 0 | 0.564 | 0 | 1 | 0.337 | 0.084 | 0 | 0.654 | 0.654 | 0.565 | 0.749 | 0.749 |
| Puglia | 0.159 | 0 | 0.383 | 0 | 0.11 | 0 | 0.259 | 0.62 | 0.383 | 0 | 0.179 | 0 | 0.337 | 1 | 0.097 | 0.165 | 0 | 0.318 | 1 | 0.902 | 0.902 |
| Sardegna | 0.805 | 0 | 0 | 0.209 | 0 | 0 | 0 | 0 | 0 | 0 | 0.179 | 0 | 0.084 | 0.097 | 1 | 0.805 | 0 | 0 | 0.053 | 0.097 | 0.097 |
| Sicilia | 0.609 | 0 | 0 | 0 | 0 | 0 | 0 | 0 | 0 | 0 | 0.179 | 0 | 0 | 0.165 | 0.805 | 1 | 0 | 0 | 0.073 | 0.073 | 0.073 |
| Toscana | 0 | 0 | 0 | 0 | 0 | 0 | 0 | 0 | 0 | 0 | 0.124 | 0 | 0.654 | 0 | 0 | 0 | 1 | 0 | 0 | 0 | 0 |
| Trento | 0 | 0 | 0.71 | 0 | 0.949 | 0 | 0.805 | 0.318 | 0.902 | 0 | 0.277 | 0 | 0.654 | 0.318 | 0 | 0 | 0 | 1 | 0.306 | 0 | 0 |
| Umbria | 0.053 | 0 | 0.456 | 0 | 0.2 | 0 | 0.383 | 0.71 | 0.535 | 0 | 0.179 | 0 | 0.565 | 1 | 0.053 | 0.073 | 0 | 0.306 | 1 | 0.383 | 0.383 |
| ValleAosta | 0.165 | 0 | 0.128 | 0 | 0 | 0 | 0.053 | 0.318 | 0 | 0 | 0.179 | 0 | 0.749 | 0.902 | 0.097 | 0.073 | 0 | 0 | 0.383 | 1 | 1 |
| Veneto | 0.165 | 0 | 0.128 | 0 | 0 | 0 | 0.053 | 0.318 | 0 | 0 | 0.179 | 0 | 0.749 | 0.902 | 0.097 | 0.073 | 0 | 0 | 0.383 | 1 | 1 |
| Abruzzo | Basilicata | Bolzano | Calabria | Campania | Emilia | Friuli | Lazio | Liguria | Lombardi | Marche | Molise | Piemonte | Puglia | Sardegna | Sicilia | Toscana | Trento | Umbria | ValleAosta | Veneto | |
|---|---|---|---|---|---|---|---|---|---|---|---|---|---|---|---|---|---|---|---|---|---|
| Abruzzo | 1 | 0 | 0.535 | 0 | 0.128 | 0 | 0 | 0 | 0 | 0 | 0 | 0 | 0 | 0.165 | 0.073 | 0.209 | 0 | 0 | 0.456 | 0 | 0 |
| Basilicata | 0 | 1 | 0 | 0 | 0 | 0 | 0 | 0 | 0 | 0 | 0 | 0 | 0 | 0 | 0 | 0 | 0 | 0 | 0 | 0 | 0 |
| Bolzano | 0.535 | 0 | 1 | 0 | 0.209 | 0 | 0 | 0 | 0 | 0 | 0 | 0 | 0 | 0.125 | 0 | 0.535 | 0 | 0 | 1 | 0 | 0 |
| Calabria | 0 | 0 | 0 | 1 | 0 | 0 | 0 | 0 | 0 | 0 | 0 | 0 | 0 | 0 | 0.165 | 0 | 0 | 0 | 0 | 0.456 | 0 |
| Campania | 0.128 | 0 | 0.209 | 0 | 1 | 0 | 0.71 | 0.128 | 0.073 | 0 | 0 | 0 | 0 | 0.535 | 0 | 0.71 | 0 | 0.456 | 0.259 | 0 | 0 |
| Emilia | 0 | 0 | 0 | 0 | 0 | 1 | 0 | 0 | 0 | 0 | 0 | 0 | 0 | 0 | 0 | 0 | 0 | 0 | 0 | 0 | 0.073 |
| Friuli | 0 | 0 | 0 | 0 | 0.71 | 0 | 1 | 0.128 | 0.055 | 0 | 0 | 0 | 0 | 0.209 | 0 | 0.259 | 0 | 0.71 | 0.073 | 0 | 0 |
| Lazio | 0 | 0 | 0 | 0 | 0.128 | 0 | 0.128 | 1 | 0.805 | 0 | 0 | 0 | 0 | 0 | 0 | 0 | 0 | 0.209 | 0 | 0 | 0 |
| Liguria | 0 | 0 | 0 | 0 | 0.073 | 0 | 0.055 | 0.805 | 1 | 0 | 0 | 0 | 0 | 0 | 0 | 0 | 0 | 0.097 | 0 | 0 | 0 |
| Lombardi | 0 | 0 | 0 | 0 | 0 | 0 | 0 | 0 | 0 | 1 | 0 | 0 | 0 | 0 | 0 | 0 | 0 | 0 | 0 | 0 | 0 |
| Marche | 0 | 0 | 0 | 0 | 0 | 0 | 0 | 0 | 0 | 0 | 1 | 0 | 0 | 0 | 0 | 0 | 0.902 | 0 | 0 | 0 | 0 |
| Molise | 0 | 0 | 0 | 0 | 0 | 0 | 0 | 0 | 0 | 0 | 0 | 1 | 0 | 0 | 0 | 0 | 0 | 0 | 0 | 0 | 0 |
| Piemonte | 0 | 0 | 0 | 0 | 0 | 0 | 0 | 0 | 0 | 0 | 0 | 0 | 1 | 0 | 0 | 0 | 0 | 0 | 0 | 0 | 0 |
| Puglia | 0.165 | 0 | 0.125 | 0 | 0.535 | 0 | 0.209 | 0 | 0 | 0 | 0 | 0 | 0 | 1 | 0 | 0.902 | 0 | 0.073 | 0.456 | 0 | 0 |
| Sardegna | 0.073 | 0 | 0 | 0.165 | 0 | 0 | 0 | 0 | 0 | 0 | 0 | 0 | 0 | 0 | 1 | 0 | 0 | 0 | 0 | 0.259 | 0 |
| Sicilia | 0.209 | 0 | 0.535 | 0 | 0.71 | 0 | 0.259 | 0 | 0 | 0 | 0 | 0 | 0 | 0.902 | 0 | 1 | 0 | 0.165 | 0.535 | 0 | 0 |
| Toscana | 0 | 0 | 0 | 0 | 0 | 0 | 0 | 0 | 0 | 0 | 0.902 | 0 | 0 | 0 | 0 | 0 | 1 | 0 | 0 | 0 | 0 |
| Trento | 0 | 0 | 0 | 0 | 0.456 | 0 | 0.71 | 0.209 | 0.097 | 0 | 0 | 0 | 0 | 0.073 | 0 | 0.165 | 0 | 1 | 0 | 0 | 0 |
| Umbria | 0.456 | 0 | 1 | 0 | 0.259 | 0 | 0.073 | 0 | 0 | 0 | 0 | 0 | 0 | 0.456 | 0 | 0.535 | 0 | 0 | 1 | 0 | 0 |
| ValleAosta | 0 | 0 | 0 | 0.456 | 0 | 0 | 0 | 0 | 0 | 0 | 0 | 0 | 0 | 0 | 0.259 | 0 | 0 | 0 | 0 | 1 | 0 |
| Veneto | 0 | 0 | 0 | 0 | 0 | 0.073 | 0 | 0 | 0 | 0 | 0 | 0 | 0 | 0 | 0 | 0 | 0 | 0 | 0 | 0 | 1 |
| Abruzzo | Basilicata | Bolzano | Calabria | Campania | Emilia | Friuli | Lazio | Liguria | Lombardi | Marche | Molise | Piemonte | Puglia | Sardegna | Sicilia | Toscana | Trento | Umbria | ValleAosta | Veneto | |
|---|---|---|---|---|---|---|---|---|---|---|---|---|---|---|---|---|---|---|---|---|---|
| Abruzzo | 1 | 0 | 0.898 | 0.16 | 0.103 | 0 | 0.336 | 0.147 | 0 | 0 | 0 | 0 | 0 | 0.596 | 0.213 | 0.541 | 0 | 0.968 | 0.945 | 0.307 | 0 |
| Basilicata | 0 | 1 | 0 | 0.094 | 0 | 0 | 0 | 0 | 0 | 0 | 0 | 0.49 | 0 | 0 | 0.104 | 0 | 0 | 0 | 0 | 0 | 0 |
| Bolzano | 0.898 | 0 | 1 | 0.213 | 0.119 | 0 | 0.471 | 0.122 | 0 | 0 | 0 | 0 | 0 | 0.497 | 0.222 | 0.371 | 0 | 0.989 | 0.967 | 0.531 | 0 |
| Calabria | 0.16 | 0.094 | 0.213 | 1 | 0 | 0 | 0 | 0 | 0 | 0 | 0 | 0.198 | 0 | 0.067 | 0.84 | 0 | 0 | 0.257 | 0.179 | 0 | 0 |
| Campania | 0.103 | 0 | 0.119 | 0 | 1 | 0 | 0.48 | 0.914 | 0.485 | 0 | 0 | 0 | 0 | 0.304 | 0 | 0.295 | 0.214 | 0.247 | 0.109 | 0.554 | 0 |
| Emilia | 0 | 0 | 0 | 0 | 0 | 1 | 0 | 0 | 0 | 0.478 | 0.266 | 0 | 0 | 0 | 0 | 0 | 0 | 0 | 0 | 0 | 0.071 |
| Friuli | 0.336 | 0 | 0.471 | 0 | 0.48 | 0 | 1 | 0.468 | 0.197 | 0 | 0 | 0 | 0 | 0.783 | 0 | 0.717 | 0.077 | 0.625 | 0.367 | 0.936 | 0 |
| Lazio | 0.147 | 0 | 0.122 | 0 | 0.914 | 0 | 0.468 | 1 | 0.61 | 0 | 0 | 0 | 0 | 0.337 | 0 | 0.368 | 0.235 | 0.19 | 0.132 | 0.485 | 0 |
| Liguria | 0 | 0 | 0 | 0 | 0.485 | 0 | 0.197 | 0.61 | 1 | 0 | 0 | 0 | 0.104 | 0.096 | 0 | 0.097 | 0.573 | 0.052 | 0 | 0.248 | 0 |
| Lombardi | 0 | 0 | 0 | 0 | 0 | 0.478 | 0 | 0 | 0 | 1 | 0.241 | 0 | 0 | 0 | 0 | 0 | 0 | 0 | 0 | 0 | 0.626 |
| Marche | 0 | 0 | 0 | 0 | 0 | 0.266 | 0 | 0 | 0 | 0.241 | 1 | 0 | 0.218 | 0 | 0 | 0 | 0 | 0 | 0 | 0 | 0 |
| Molise | 0 | 0.49 | 0 | 0.198 | 0 | 0 | 0 | 0 | 0 | 0 | 0 | 1 | 0 | 0 | 0.153 | 0 | 0 | 0 | 0 | 0 | 0 |
| Piemonte | 0 | 0 | 0 | 0 | 0 | 0 | 0 | 0 | 0.104 | 0 | 0.218 | 0 | 1 | 0 | 0 | 0 | 0.262 | 0 | 0 | 0 | 0 |
| Puglia | 0.596 | 0 | 0.497 | 0.067 | 0.304 | 0 | 0.783 | 0.337 | 0.096 | 0 | 0 | 0 | 0 | 1 | 0.091 | 0.963 | 0 | 0.703 | 0.615 | 0.697 | 0 |
| Sardegna | 0.213 | 0.104 | 0.222 | 0.84 | 0 | 0 | 0 | 0 | 0 | 0 | 0 | 0.153 | 0 | 0.091 | 1 | 0.068 | 0 | 0.255 | 0.232 | 0 | 0 |
| Sicilia | 0.541 | 0 | 0.371 | 0 | 0.295 | 0 | 0.717 | 0.368 | 0.097 | 0 | 0 | 0 | 0 | 0.963 | 0.068 | 1 | 0 | 0.65 | 0.577 | 0.605 | 0 |
| Toscana | 0 | 0 | 0 | 0 | 0.214 | 0 | 0.077 | 0.235 | 0.573 | 0 | 0 | 0 | 0.262 | 0 | 0 | 0 | 1 | 0 | 0 | 0.083 | 0 |
| Trento | 0.968 | 0 | 0.989 | 0.257 | 0.247 | 0 | 0.625 | 0.19 | 0.052 | 0 | 0 | 0 | 0 | 0.703 | 0.255 | 0.65 | 0 | 1 | 0.925 | 0.607 | 0 |
| Umbria | 0.945 | 0 | 0.967 | 0.179 | 0.109 | 0 | 0.367 | 0.132 | 0 | 0 | 0 | 0 | 0 | 0.615 | 0.232 | 0.577 | 0 | 0.925 | 1 | 0.331 | 0 |
| ValleAosta | 0.307 | 0 | 0.531 | 0 | 0.554 | 0 | 0.936 | 0.485 | 0.248 | 0 | 0 | 0 | 0 | 0.697 | 0 | 0.605 | 0.083 | 0.607 | 0.331 | 1 | 0 |
| Veneto | 0 | 0 | 0 | 0 | 0 | 0.071 | 0 | 0 | 0 | 0.626 | 0 | 0 | 0 | 0 | 0 | 0 | 0 | 0 | 0 | 0 | 1 |
| Abruzzo | Basilicata | Bolzano | Calabria | Campania | Emilia | Friuli | Lazio | Liguria | Lombardi | Marche | Molise | Piemonte | Puglia | Sardegna | Sicilia | Toscana | Trento | Umbria | ValleAosta | Veneto | |
|---|---|---|---|---|---|---|---|---|---|---|---|---|---|---|---|---|---|---|---|---|---|
| Abruzzo | 1 | 0 | 0.89 | 0.36 | 0.42 | 0 | 0.2 | 0.69 | 0 | 0 | 0 | 0 | 0 | 0.79 | 0 | 0.1 | 0.06 | 0 | 0.39 | 0.67 | 0 |
| Basilicata | 0 | 0 | 0 | 0.06 | 0 | 0 | 0.32 | 0 | 0 | 0 | 0 | NA | 0 | 0 | NA | 0 | 0 | NA | 0.14 | 0.14 | 0 |
| Bolzano | 0.89 | 0 | 1 | 0.11 | 0.5 | 0 | 0 | 0.5 | 0 | 0 | 0 | 0 | 0 | 0.78 | 0 | 0 | 0 | 0 | 0.27 | 0.27 | 0 |
| Calabria | 0.36 | 0.06 | 0.11 | 1 | 0.19 | 0 | 0.38 | 0.19 | 0 | 0 | 0 | 0.06 | 0 | 0.27 | 0.06 | 0 | 0 | 0.06 | 0.94 | 0.94 | 0 |
| Campania | 0.42 | 0.03 | 0.5 | 0.19 | 1 | 0 | 0.12 | 0.35 | 0.09 | 0 | 0 | 0.03 | 0.44 | 0.38 | 0.03 | 0.79 | 0.9 | 0.03 | 0.12 | 0.32 | 0 |
| Emilia | 0 | 0 | 0 | 0 | 0 | 1 | 0 | 0 | 0 | 0 | 0.07 | 0 | 0 | 0 | 0 | 0 | 0 | 0 | 0 | 0 | 0 |
| Friuli | 0.2 | 0.32 | 0 | 0.38 | 0.12 | 0 | 1 | 0.2 | 0 | 0 | 0 | 0.32 | 0 | 0.2 | 0.32 | 0 | 0 | 0.32 | 0.66 | 0.42 | 0 |
| Lazio | 0.69 | 0.02 | 0.5 | 0.19 | 0.35 | 0 | 0.2 | 1 | 0.05 | 0 | 0 | 0.02 | 0 | 0.89 | 0.02 | 0.28 | 0.19 | 0.02 | 0.2 | 0.67 | 0 |
| Liguria | 0 | 0 | 0 | 0 | 0.09 | 0 | 0 | 0.05 | 1 | 0 | 0.25 | 0 | 0.56 | 0 | 0 | 0.12 | 0.16 | 0 | 0 | 0 | 0 |
| Lombardi | 0 | 0 | 0 | 0 | 0 | 0 | 0 | 0 | 0 | 1 | 0 | 0 | 0 | 0 | 0 | 0 | 0 | 0 | 0 | 0 | 0 |
| Marche | 0 | 0 | 0 | 0 | 0 | 0.07 | 0 | 0 | 0.25 | 0 | 1 | 0 | 0.09 | 0 | 0 | 0 | 0 | 0 | 0 | 0 | 0 |
| Molise | 0 | NA | 0 | 0.06 | 0 | 0 | 0.32 | 0 | 0 | 0 | 0 | NA | 0 | 0 | NA | 0 | 0 | NA | 0.14 | 0.14 | 0 |
| Piemonte | 0 | 0 | 0 | 0 | 0.44 | 0 | 0 | 0 | 0.56 | 0 | 0.09 | 0 | 1 | 0 | 0 | 0.06 | 0.24 | 0 | 0 | 0 | 0 |
| Puglia | 0.79 | 0.02 | 0.78 | 0.27 | 0.38 | 0 | 0.2 | 0.89 | 0 | 0 | 0 | 0.02 | 0 | 1 | 0.02 | 0.35 | 0.19 | 0.02 | 0.2 | 0.67 | 0 |
| Sardegna | 0 | NA | 0 | 0.06 | 0 | 0 | 0.32 | 0 | 0 | 0 | 0 | NA | 0 | 0 | NA | 0 | 0 | NA | 0.14 | 0.14 | 0 |
| Sicilia | 0.1 | 0 | 0 | 0 | 0.79 | 0 | 0 | 0.28 | 0.12 | 0 | 0 | 0 | 0.06 | 0.35 | 0 | 1 | 0.59 | 0 | 0 | 0.25 | 0 |
| Toscana | 0.06 | 0 | 0 | 0 | 0.9 | 0 | 0 | 0.19 | 0.16 | 0 | 0 | 0 | 0.24 | 0.19 | 0 | 0.59 | 1 | 0 | 0 | 0.09 | 0 |
| Trento | 0 | NA | 0 | 0.06 | 0 | 0 | 0.32 | 0 | 0 | 0 | 0 | NA | 0 | 0 | NA | 0 | 0 | NA | 0.14 | 0.14 | 0 |
| Umbria | 0.39 | 0.14 | 0.27 | 0.94 | 0.12 | 0 | 0.66 | 0.2 | 0 | 0 | 0 | 0.14 | 0 | 0.2 | 0.14 | 0 | 0 | 0.14 | 1 | 0.75 | 0 |
| ValleAosta | 0.67 | 0.14 | 0.27 | 0.94 | 0.32 | 0 | 0.42 | 0.67 | 0 | 0 | 0 | 0.14 | 0 | 0.67 | 0.14 | 0.25 | 0.09 | 0.14 | 0.75 | 1 | 0 |
| Veneto | 0 | 0 | 0 | 0 | 0 | 0 | 0 | 0 | 0 | 0 | 0 | 0 | 0 | 0 | 0 | 0 | 0 | 0 | 0 | 0 | 1 |
| Abruzzo | Basilicata | Bolzano | Calabria | Campania | Emilia | Friuli | Lazio | Liguria | Lombardi | Marche | Molise | Piemonte | Puglia | Sardegna | Sicilia | Toscana | Trento | Umbria | ValleAosta | Veneto | |
|---|---|---|---|---|---|---|---|---|---|---|---|---|---|---|---|---|---|---|---|---|---|
| Abruzzo | 1 | 0 | 0 | 0 | 0 | 0 | 0 | 0 | 0 | 0 | 0 | 0.61 | 0 | 0.48 | 0 | 0.22 | 0 | 0.65 | 0.05 | 0 | 0 |
| Basilicata | 0 | 1 | 0.41 | 0.35 | 0 | 0 | 0 | 0 | 0 | 0 | 0 | 0.07 | 0 | 0 | 0.33 | 0 | 0 | 0 | 0 | 0 | 0 |
| Bolzano | 0 | 0.41 | 1 | 0.95 | 0 | 0 | 0 | 0 | 0 | 0 | 0 | 0.22 | 0 | 0 | 0.74 | 0 | 0 | 0.15 | 0 | 0 | 0 |
| Calabria | 0 | 0.35 | 0.95 | 1 | 0 | 0 | 0 | 0 | 0 | 0 | 0 | 0.18 | 0 | 0 | 0.7 | 0 | 0 | 0.08 | 0 | 0 | 0 |
| Campania | 0 | 0 | 0 | 0 | 1 | 0 | 0.07 | 0.62 | 0.18 | 0 | 0 | 0 | 0 | 0 | 0 | 0 | 0.62 | 0 | 0 | 0.31 | 0 |
| Emilia | 0 | 0 | 0 | 0 | 0 | 1 | 0 | 0 | 0 | 0 | 0 | 0 | 0 | 0 | 0 | 0 | 0 | 0 | 0 | 0 | 0 |
| Friuli | 0 | 0 | 0 | 0 | 0.07 | 0 | 1 | 0.46 | 0.52 | 0 | 0 | 0 | 0 | 0.13 | 0 | 0.48 | 0.12 | 0 | 0.25 | 0.05 | 0 |
| Lazio | 0 | 0 | 0 | 0 | 0.62 | 0 | 0.46 | 1 | 0.48 | 0 | 0 | 0 | 0 | 0.1 | 0 | 0.28 | 0.38 | 0 | 0.11 | 0.16 | 0 |
| Liguria | 0 | 0 | 0 | 0 | 0.18 | 0 | 0.52 | 0.48 | 1 | 0 | 0 | 0 | 0 | 0 | 0 | 0.22 | 0.31 | 0 | 0.2 | 0.08 | 0 |
| Lombardi | 0 | 0 | 0 | 0 | 0 | 0 | 0 | 0 | 0 | 1 | 0 | 0 | 0 | 0 | 0 | 0 | 0 | 0 | 0 | 0 | 0 |
| Marche | 0 | 0 | 0 | 0 | 0 | 0 | 0 | 0 | 0 | 0 | 1 | 0 | 0.62 | 0 | 0 | 0 | 0 | 0 | 0 | 0.62 | 0 |
| Molise | 0.61 | 0.07 | 0.22 | 0.18 | 0 | 0 | 0 | 0 | 0 | 0 | 0 | 1 | 0 | 0.18 | 0.16 | 0 | 0 | 0.75 | 0 | 0 | 0 |
| Piemonte | 0 | 0 | 0 | 0 | 0 | 0 | 0 | 0 | 0 | 0 | 0.62 | 0 | 1 | 0 | 0 | 0 | 0.16 | 0 | 0 | 0.62 | 0 |
| Puglia | 0.48 | 0 | 0 | 0 | 0 | 0 | 0.13 | 0.1 | 0 | 0 | 0 | 0.18 | 0 | 1 | 0 | 0.48 | 0 | 0.31 | 0.34 | 0 | 0 |
| Sardegna | 0 | 0.33 | 0.74 | 0.7 | 0 | 0 | 0 | 0 | 0 | 0 | 0 | 0.16 | 0 | 0 | 1 | 0 | 0 | 0.16 | 0 | 0 | 0 |
| Sicilia | 0.22 | 0 | 0 | 0 | 0 | 0 | 0.48 | 0.28 | 0.22 | 0 | 0 | 0 | 0 | 0.48 | 0 | 1 | 0 | 0.11 | 0.95 | 0 | 0 |
| Toscana | 0 | 0 | 0 | 0 | 0.62 | 0 | 0.12 | 0.38 | 0.31 | 0 | 0 | 0 | 0.16 | 0 | 0 | 0 | 1 | 0 | 0 | 0.46 | 0 |
| Trento | 0.65 | 0 | 0.15 | 0.08 | 0 | 0 | 0 | 0 | 0 | 0 | 0 | 0.75 | 0 | 0.31 | 0.16 | 0.11 | 0 | 1 | 0.06 | 0 | 0 |
| Umbria | 0.05 | 0 | 0 | 0 | 0 | 0 | 0.25 | 0.11 | 0.2 | 0 | 0 | 0 | 0 | 0.34 | 0 | 0.95 | 0 | 0.06 | 1 | 0 | 0 |
| ValleAosta | 0 | 0 | 0 | 0 | 0.31 | 0 | 0.05 | 0.16 | 0.08 | 0 | 0.62 | 0 | 0.62 | 0 | 0 | 0 | 0.46 | 0 | 0 | 1 | 0 |
| Veneto | 0 | 0 | 0 | 0 | 0 | 0 | 0 | 0 | 0 | 0 | 0 | 0 | 0 | 0 | 0 | 0 | 0 | 0 | 0 | 0 | 1 |
| Abruzzo | Basilicata | Bolzano | Calabria | Campania | Emilia | Friuli | Lazio | Liguria | Lombardi | Marche | Molise | Piemonte | Puglia | Sardegna | Sicilia | Toscana | Trento | Umbria | ValleAosta | Veneto | |
|---|---|---|---|---|---|---|---|---|---|---|---|---|---|---|---|---|---|---|---|---|---|
| Abruzzo | 1 | 0 | 0.406 | 0 | 0 | 0 | 0 | 0 | 0 | 0 | 0 | 0 | 0 | 0.224 | 0.178 | 0.141 | 0 | 0.277 | 0.48 | 0.224 | 0 |
| Basilicata | 0 | 1 | 0 | 0 | 0 | 0 | 0 | 0 | 0 | 0 | 0 | 0 | 0 | 0 | 0 | 0 | 0 | 0 | 0 | 0 | 0 |
| Bolzano | 0.406 | 0 | 1 | 0 | 0 | 0 | 0.11 | 0.097 | 0 | 0 | 0 | 0 | 0 | 1 | 0.096 | 0.805 | 0 | 0.798 | 0.609 | 0.71 | 0.056 |
| Calabria | 0 | 0 | 0 | 1 | 0 | 0 | 0 | 0 | 0 | 0 | 0 | 0.244 | 0 | 0 | 0.306 | 0 | 0 | 0 | 0 | 0 | 0.056 |
| Campania | 0 | 0 | 0 | 0 | 1 | 0 | 0.565 | 0.902 | 0.306 | 0 | 0 | 0 | 0 | 0 | 0 | 0 | 0 | 0.209 | 0 | 0.306 | 0.056 |
| Emilia | 0 | 0 | 0 | 0 | 0 | 1 | 0 | 0 | 0 | 0 | 0 | 0 | 0 | 0 | 0 | 0 | 0 | 0 | 0 | 0 | 0.056 |
| Friuli | 0 | 0 | 0.11 | 0 | 0.565 | 0 | 1 | 0.654 | 0.277 | 0 | 0 | 0 | 0 | 0.11 | 0 | 0.179 | 0 | 0.277 | 0 | 0.482 | 0 |
| Lazio | 0 | 0 | 0.097 | 0 | 0.902 | 0 | 0.654 | 1 | 0.456 | 0 | 0 | 0 | 0 | 0.073 | 0 | 0.128 | 0 | 0.259 | 0 | 0.383 | 0.056 |
| Liguria | 0 | 0 | 0 | 0 | 0.306 | 0 | 0.277 | 0.456 | 1 | 0 | 0 | 0 | 0 | 0 | 0 | 0 | 0.128 | 0.097 | 0 | 0.165 | 0.056 |
| Lombardi | 0 | 0 | 0 | 0 | 0 | 0 | 0 | 0 | 0 | 1 | 0 | 0 | 0 | 0 | 0 | 0 | 0 | 0 | 0 | 0 | 0.667 |
| Marche | 0 | 0 | 0 | 0 | 0 | 0 | 0 | 0 | 0 | 0 | 1 | 0 | 0.805 | 0 | 0 | 0 | 0.053 | 0 | 0 | 0 | 0.056 |
| Molise | 0 | 0 | 0 | 0.244 | 0 | 0 | 0 | 0 | 0 | 0 | 0 | 1 | 0 | 0 | 0 | 0 | 0 | 0 | 0 | 0 | 0 |
| Piemonte | 0 | 0 | 0 | 0 | 0 | 0 | 0 | 0 | 0 | 0 | 0.805 | 0 | 1 | 0 | 0 | 0 | 0.097 | 0 | 0 | 0 | 0.056 |
| Puglia | 0.224 | 0 | 1 | 0 | 0 | 0 | 0.11 | 0.073 | 0 | 0 | 0 | 0 | 0 | 1 | 0 | 0.902 | 0 | 0.805 | 0.62 | 1 | 0.056 |
| Sardegna | 0.178 | 0 | 0.096 | 0.306 | 0 | 0 | 0 | 0 | 0 | 0 | 0 | 0 | 0 | 0 | 1 | 0 | 0 | 0 | 0 | 0.053 | 0.056 |
| Sicilia | 0.141 | 0 | 0.805 | 0 | 0 | 0 | 0.179 | 0.128 | 0 | 0 | 0 | 0 | 0 | 0.902 | 0 | 1 | 0 | 1 | 0.456 | 1 | 0.056 |
| Toscana | 0 | 0 | 0 | 0 | 0 | 0 | 0 | 0 | 0.128 | 0 | 0.053 | 0 | 0.097 | 0 | 0 | 0 | 1 | 0 | 0 | 0 | 0.056 |
| Trento | 0.277 | 0 | 0.798 | 0 | 0.209 | 0 | 0.277 | 0.259 | 0.097 | 0 | 0 | 0 | 0 | 0.805 | 0 | 1 | 0 | 1 | 0.535 | 1 | 0.056 |
| Umbria | 0.48 | 0 | 0.609 | 0 | 0 | 0 | 0 | 0 | 0 | 0 | 0 | 0 | 0 | 0.62 | 0 | 0.456 | 0 | 0.535 | 1 | 0.62 | 0.056 |
| ValleAosta | 0.224 | 0 | 0.71 | 0 | 0.306 | 0 | 0.482 | 0.383 | 0.165 | 0 | 0 | 0 | 0 | 1 | 0.053 | 1 | 0 | 1 | 0.62 | 1 | 0.056 |
| Veneto | 0 | 0 | 0.056 | 0.056 | 0.056 | 0.056 | 0 | 0.056 | 0.056 | 0.667 | 0.056 | 0 | 0.056 | 0.056 | 0.056 | 0.056 | 0.056 | 0.056 | 0.056 | 0.056 | 1 |
| Abruzzo | Basilicata | Bolzano | Calabria | Campania | Emilia | Friuli | Lazio | Liguria | Lombardi | Marche | Molise | Piemonte | Puglia | Sardegna | Sicilia | Toscana | Trento | Umbria | ValleAosta | Veneto | |
|---|---|---|---|---|---|---|---|---|---|---|---|---|---|---|---|---|---|---|---|---|---|
| Abruzzo | 1 | 0 | 0.306 | 0 | 0 | 0 | 0.128 | 0 | 0 | 0 | 0.209 | 0 | 0 | 0.318 | 0.073 | 1 | 0 | 0.073 | 0.71 | 0.805 | 0.805 |
| Basilicata | 0 | 1 | 0 | 0 | 0 | 0 | 0 | 0 | 0 | 0 | 0.209 | 0.609 | 0 | 0 | 0 | 0 | 0 | 0 | 0 | 0 | 0 |
| Bolzano | 0.306 | 0 | 1 | 0 | 0.11 | 0 | 0.535 | 0 | 0 | 0 | 0.209 | 0 | 0 | 0.902 | 0 | 0.259 | 0 | 0.25 | 0.535 | 0.165 | 0.165 |
| Calabria | 0 | 0 | 0 | 1 | 0 | 0 | 0 | 0 | 0 | 0 | 0.209 | 0 | 0 | 0 | 0.383 | 0 | 0 | 0 | 0 | 0 | 0 |
| Campania | 0 | 0 | 0.11 | 0 | 1 | 0 | 0.277 | 0.141 | 0 | 0 | 0.179 | 0 | 0 | 0.224 | 0 | 0 | 0 | 0.848 | 0.064 | 0 | 0 |
| Emilia | 0 | 0 | 0 | 0 | 0 | 1 | 0 | 0 | 0 | 0 | 0 | 0 | 0 | 0 | 0 | 0 | 0 | 0 | 0 | 0 | 0 |
| Friuli | 0.128 | 0 | 0.535 | 0 | 0.277 | 0 | 1 | 0.053 | 0 | 0 | 0.209 | 0 | 0 | 0.71 | 0 | 0.073 | 0 | 0.71 | 0.165 | 0 | 0 |
| Lazio | 0 | 0 | 0 | 0 | 0.141 | 0 | 0.053 | 1 | 0.456 | 0 | 0.201 | 0 | 0 | 0 | 0 | 0 | 0 | 0.073 | 0 | 0 | 0 |
| Liguria | 0 | 0 | 0 | 0 | 0 | 0 | 0 | 0.456 | 1 | 0 | 0.259 | 0 | 0 | 0 | 0 | 0 | 0 | 0 | 0 | 0 | 0 |
| Lombardi | 0 | 0 | 0 | 0 | 0 | 0 | 0 | 0 | 0 | 1 | 0 | 0 | 0 | 0 | 0 | 0 | 0 | 0 | 0 | 0 | 0 |
| Marche | 0.209 | 0.209 | 0.209 | 0.209 | 0.179 | 0 | 0.209 | 0.201 | 0.259 | 0 | 1 | 0.209 | 0 | 0.209 | 0.209 | 0.209 | 0.456 | 0.209 | 0.209 | 0.209 | 0.209 |
| Molise | 0 | 0.609 | 0 | 0 | 0 | 0 | 0 | 0 | 0 | 0 | 0.209 | 1 | 0 | 0 | 0 | 0 | 0 | 0 | 0 | 0 | 0 |
| Piemonte | 0 | 0 | 0 | 0 | 0 | 0 | 0 | 0 | 0 | 0 | 0 | 0 | 1 | 0 | 0 | 0 | 0 | 0 | 0 | 0 | 0 |
| Puglia | 0.318 | 0 | 0.902 | 0 | 0.224 | 0 | 0.71 | 0 | 0 | 0 | 0.209 | 0 | 0 | 1 | 0 | 0.318 | 0 | 0.456 | 0.456 | 0.128 | 0.128 |
| Sardegna | 0.073 | 0 | 0 | 0.383 | 0 | 0 | 0 | 0 | 0 | 0 | 0.209 | 0 | 0 | 0 | 1 | 0.096 | 0 | 0 | 0 | 0.128 | 0.128 |
| Sicilia | 1 | 0 | 0.259 | 0 | 0 | 0 | 0.073 | 0 | 0 | 0 | 0.209 | 0 | 0 | 0.318 | 0.096 | 1 | 0 | 0.053 | 0.71 | 0.805 | 0.805 |
| Toscana | 0 | 0 | 0 | 0 | 0 | 0 | 0 | 0 | 0 | 0 | 0.456 | 0 | 0 | 0 | 0 | 0 | 1 | 0 | 0 | 0 | 0 |
| Trento | 0.073 | 0 | 0.25 | 0 | 0.848 | 0 | 0.71 | 0.073 | 0 | 0 | 0.209 | 0 | 0 | 0.456 | 0 | 0.053 | 0 | 1 | 0.165 | 0 | 0 |
| Umbria | 0.71 | 0 | 0.535 | 0 | 0.064 | 0 | 0.165 | 0 | 0 | 0 | 0.209 | 0 | 0 | 0.456 | 0 | 0.71 | 0 | 0.165 | 1 | 0.383 | 0.383 |
| ValleAosta | 0.805 | 0 | 0.165 | 0 | 0 | 0 | 0 | 0 | 0 | 0 | 0.209 | 0 | 0 | 0.128 | 0.128 | 0.805 | 0 | 0 | 0.383 | 1 | 1 |
| Veneto | 0.805 | 0 | 0.165 | 0 | 0 | 0 | 0 | 0 | 0 | 0 | 0.209 | 0 | 0 | 0.128 | 0.128 | 0.805 | 0 | 0 | 0.383 | 1 | 1 |
| Abruzzo | Basilicata | Bolzano | Calabria | Campania | Emilia | Friuli | Lazio | Liguria | Lombardi | Marche | Molise | Piemonte | Puglia | Sardegna | Sicilia | Toscana | Trento | Umbria | ValleAosta | Veneto | |
|---|---|---|---|---|---|---|---|---|---|---|---|---|---|---|---|---|---|---|---|---|---|
| Abruzzo | 1 | 0 | 1 | 0 | 0 | 0 | 0.306 | 0 | 0 | 0 | 0 | 0 | 0 | 0 | 0 | 0.165 | 0 | 0 | 0.456 | 0 | 0 |
| Basilicata | 0 | 1 | 0 | 0 | 0 | 0 | 0 | 0 | 0 | 0 | 0 | 0 | 0 | 0 | 0 | 0 | 0 | 0 | 0 | 0 | 0 |
| Bolzano | 1 | 0 | 1 | 0 | 0 | 0 | 0.073 | 0 | 0 | 0 | 0 | 0 | 0 | 0 | 0 | 0.097 | 0 | 0 | 0.383 | 0 | 0 |
| Calabria | 0 | 0 | 0 | 1 | 0 | 0 | 0 | 0 | 0 | 0 | 0 | 0 | 0 | 0 | 0.318 | 0 | 0 | 0 | 0 | 0.482 | 0 |
| Campania | 0 | 0 | 0 | 0 | 1 | 0 | 0.053 | 0 | 0 | 0 | 0 | 0 | 0 | 0.71 | 0 | 0.318 | 0 | 0.456 | 0 | 0 | 0 |
| Emilia | 0 | 0 | 0 | 0 | 0 | 1 | 0 | 0 | 0 | 0 | 0 | 0 | 0 | 0 | 0 | 0 | 0 | 0 | 0 | 0 | 0 |
| Friuli | 0.306 | 0 | 0.073 | 0 | 0.053 | 0 | 1 | 0 | 0 | 0 | 0 | 0 | 0 | 0.209 | 0 | 0.535 | 0 | 0.097 | 0 | 0 | 0 |
| Lazio | 0 | 0 | 0 | 0 | 0 | 0 | 0 | 1 | 0.62 | 0 | 0 | 0 | 0 | 0 | 0 | 0 | 0 | 0 | 0 | 0 | 0 |
| Liguria | 0 | 0 | 0 | 0 | 0 | 0 | 0 | 0.62 | 1 | 0 | 0 | 0 | 0 | 0 | 0 | 0 | 0 | 0 | 0 | 0 | 0 |
| Lombardi | 0 | 0 | 0 | 0 | 0 | 0 | 0 | 0 | 0 | 1 | 0 | 0 | 0 | 0 | 0 | 0 | 0 | 0 | 0 | 0 | 0 |
| Marche | 0 | 0 | 0 | 0 | 0 | 0 | 0 | 0 | 0 | 0 | 1 | 0 | 0 | 0 | 0 | 0 | 0.456 | 0 | 0 | 0 | 0 |
| Molise | 0 | 0 | 0 | 0 | 0 | 0 | 0 | 0 | 0 | 0 | 0 | 1 | 0 | 0 | 0 | 0 | 0 | 0 | 0 | 0 | 0 |
| Piemonte | 0 | 0 | 0 | 0 | 0 | 0 | 0 | 0 | 0 | 0 | 0 | 0 | 1 | 0 | 0 | 0 | 0 | 0 | 0 | 0 | 0.805 |
| Puglia | 0 | 0 | 0 | 0 | 0.71 | 0 | 0.209 | 0 | 0 | 0 | 0 | 0 | 0 | 1 | 0 | 0.443 | 0 | 0.805 | 0 | 0 | 0 |
| Sardegna | 0 | 0 | 0 | 0.318 | 0 | 0 | 0 | 0 | 0 | 0 | 0 | 0 | 0 | 0 | 1 | 0 | 0 | 0 | 0 | 0.277 | 0 |
| Sicilia | 0.165 | 0 | 0.097 | 0 | 0.318 | 0 | 0.535 | 0 | 0 | 0 | 0 | 0 | 0 | 0.443 | 0 | 1 | 0 | 0.805 | 0 | 0 | 0 |
| Toscana | 0 | 0 | 0 | 0 | 0 | 0 | 0 | 0 | 0 | 0 | 0.456 | 0 | 0 | 0 | 0 | 0 | 1 | 0 | 0 | 0 | 0 |
| Trento | 0 | 0 | 0 | 0 | 0.456 | 0 | 0.097 | 0 | 0 | 0 | 0 | 0 | 0 | 0.805 | 0 | 0.805 | 0 | 1 | 0 | 0 | 0 |
| Umbria | 0.456 | 0 | 0.383 | 0 | 0 | 0 | 0 | 0 | 0 | 0 | 0 | 0 | 0 | 0 | 0 | 0 | 0 | 0 | 1 | 0 | 0 |
| ValleAosta | 0 | 0 | 0 | 0.482 | 0 | 0 | 0 | 0 | 0 | 0 | 0 | 0 | 0 | 0 | 0.277 | 0 | 0 | 0 | 0 | 1 | 0 |
| Veneto | 0 | 0 | 0 | 0 | 0 | 0 | 0 | 0 | 0 | 0 | 0 | 0 | 0.805 | 0 | 0 | 0 | 0 | 0 | 0 | 0 | 1 |
| Abruzzo | Basilicata | Bolzano | Calabria | Campania | Emilia | Friuli | Lazio | Liguria | Lombardi | Marche | Molise | Piemonte | Puglia | Sardegna | Sicilia | Toscana | Trento | Umbria | ValleAosta | Veneto | |
|---|---|---|---|---|---|---|---|---|---|---|---|---|---|---|---|---|---|---|---|---|---|
| Abruzzo | 1 | 0 | 0.62 | 0.147 | 0.236 | 0 | 0.603 | 0.051 | 0 | 0 | 0 | 0 | 0 | 0.526 | 0.22 | 0.671 | 0 | 0.953 | 0.809 | 0.345 | 0 |
| Basilicata | 0 | 1 | 0 | 0.069 | 0 | 0 | 0 | 0 | 0 | 0 | 0 | 0.208 | 0 | 0 | 0.068 | 0 | 0 | 0 | 0 | 0 | 0 |
| Bolzano | 0.62 | 0 | 1 | 0.178 | 0.153 | 0 | 0.426 | 0 | 0 | 0 | 0 | 0 | 0 | 0.305 | 0.395 | 0.649 | 0 | 0.718 | 0.549 | 0.251 | 0 |
| Calabria | 0.147 | 0.069 | 0.178 | 1 | 0 | 0 | 0 | 0 | 0 | 0 | 0 | 0 | 0 | 0.05 | 0.935 | 0.104 | 0 | 0.193 | 0.086 | 0 | 0 |
| Campania | 0.236 | 0 | 0.153 | 0 | 1 | 0 | 0.562 | 0.336 | 0.219 | 0 | 0 | 0 | 0 | 0.721 | 0 | 0.488 | 0 | 0.279 | 0.252 | 0.793 | 0 |
| Emilia | 0 | 0 | 0 | 0 | 0 | 1 | 0 | 0 | 0 | 0.398 | 0 | 0 | 0 | 0 | 0 | 0 | 0 | 0 | 0 | 0 | 0.131 |
| Friuli | 0.603 | 0 | 0.426 | 0 | 0.562 | 0 | 1 | 0.139 | 0.104 | 0 | 0 | 0 | 0 | 0.877 | 0.059 | 0.845 | 0 | 0.565 | 0.643 | 0.686 | 0 |
| Lazio | 0.051 | 0 | 0 | 0 | 0.336 | 0 | 0.139 | 1 | 0.737 | 0 | 0 | 0 | 0.07 | 0.211 | 0 | 0.197 | 0.172 | 0.082 | 0.061 | 0.231 | 0 |
| Liguria | 0 | 0 | 0 | 0 | 0.219 | 0 | 0.104 | 0.737 | 1 | 0 | 0 | 0 | 0.084 | 0.125 | 0 | 0.097 | 0.285 | 0.058 | 0 | 0.13 | 0 |
| Lombardi | 0 | 0 | 0 | 0 | 0 | 0.398 | 0 | 0 | 0 | 1 | 0.082 | 0 | 0 | 0 | 0 | 0 | 0 | 0 | 0 | 0 | 0.741 |
| Marche | 0 | 0 | 0 | 0 | 0 | 0 | 0 | 0 | 0 | 0.082 | 1 | 0 | 0.567 | 0 | 0 | 0 | 0.084 | 0 | 0 | 0 | 0 |
| Molise | 0 | 0.208 | 0 | 0 | 0 | 0 | 0 | 0 | 0 | 0 | 0 | 1 | 0 | 0 | 0 | 0 | 0 | 0 | 0 | 0 | 0 |
| Piemonte | 0 | 0 | 0 | 0 | 0 | 0 | 0 | 0.07 | 0.084 | 0 | 0.567 | 0 | 1 | 0 | 0 | 0 | 0.279 | 0 | 0 | 0 | 0 |
| Puglia | 0.526 | 0 | 0.305 | 0.05 | 0.721 | 0 | 0.877 | 0.211 | 0.125 | 0 | 0 | 0 | 0 | 1 | 0.07 | 0.898 | 0 | 0.547 | 0.516 | 0.893 | 0 |
| Sardegna | 0.22 | 0.068 | 0.395 | 0.935 | 0 | 0 | 0.059 | 0 | 0 | 0 | 0 | 0 | 0 | 0.07 | 1 | 0.11 | 0 | 0.283 | 0.123 | 0 | 0 |
| Sicilia | 0.671 | 0 | 0.649 | 0.104 | 0.488 | 0 | 0.845 | 0.197 | 0.097 | 0 | 0 | 0 | 0 | 0.898 | 0.11 | 1 | 0 | 0.781 | 0.809 | 0.581 | 0 |
| Toscana | 0 | 0 | 0 | 0 | 0 | 0 | 0 | 0.172 | 0.285 | 0 | 0.084 | 0 | 0.279 | 0 | 0 | 0 | 1 | 0 | 0 | 0 | 0 |
| Trento | 0.953 | 0 | 0.718 | 0.193 | 0.279 | 0 | 0.565 | 0.082 | 0.058 | 0 | 0 | 0 | 0 | 0.547 | 0.283 | 0.781 | 0 | 1 | 0.844 | 0.424 | 0 |
| Umbria | 0.809 | 0 | 0.549 | 0.086 | 0.252 | 0 | 0.643 | 0.061 | 0 | 0 | 0 | 0 | 0 | 0.516 | 0.123 | 0.809 | 0 | 0.844 | 1 | 0.481 | 0 |
| ValleAosta | 0.345 | 0 | 0.251 | 0 | 0.793 | 0 | 0.686 | 0.231 | 0.13 | 0 | 0 | 0 | 0 | 0.893 | 0 | 0.581 | 0 | 0.424 | 0.481 | 1 | 0 |
| Veneto | 0 | 0 | 0 | 0 | 0 | 0.131 | 0 | 0 | 0 | 0.741 | 0 | 0 | 0 | 0 | 0 | 0 | 0 | 0 | 0 | 0 | 1 |
| Abruzzo | Basilicata | Bolzano | Calabria | Campania | Emilia | Friuli | Lazio | Liguria | Lombardi | Marche | Molise | Piemonte | Puglia | Sardegna | Sicilia | Toscana | Trento | Umbria | ValleAosta | Veneto | |
|---|---|---|---|---|---|---|---|---|---|---|---|---|---|---|---|---|---|---|---|---|---|
| Abruzzo | 1 | 0.06 | 0.23 | 0.23 | 0.34 | 0 | 0.38 | 0.57 | 0.46 | 0 | 0 | 0.06 | 0.78 | 0.6 | 0.06 | 0.67 | 0.34 | 0.06 | 0.3 | 0.71 | 0 |
| Basilicata | 0.06 | 0 | 0.32 | 0.32 | 0 | 0 | 0.32 | 0.53 | 0.12 | 0 | 0 | 0 | 0.26 | 0.14 | 0 | 0.53 | 0 | 0 | 0.32 | 0.14 | 0 |
| Bolzano | 0.23 | 0.32 | 1 | 1 | 0.07 | 0 | 0.92 | 0.81 | 0.2 | 0 | 0 | 0.32 | 0.41 | 0.48 | 0.32 | 0.81 | 0.06 | 0.32 | 0.92 | 0.48 | 0 |
| Calabria | 0.23 | 0.32 | 1 | 1 | 0.07 | 0 | 0.92 | 0.81 | 0.2 | 0 | 0 | 0.32 | 0.41 | 0.48 | 0.32 | 0.81 | 0.06 | 0.32 | 0.92 | 0.48 | 0 |
| Campania | 0.34 | 0.03 | 0.07 | 0.07 | 1 | 0 | 0.16 | 0.17 | 0.79 | 0 | 0.07 | 0.03 | 0.79 | 0.18 | 0.03 | 0.27 | 0.84 | 0.03 | 0.09 | 0.29 | 0 |
| Emilia | 0 | 0 | 0 | 0 | 0 | 1 | 0 | 0 | 0 | 0 | 0 | 0 | 0 | 0 | 0 | 0 | 0 | 0 | 0 | 0 | 0 |
| Friuli | 0.38 | 0.32 | 0.92 | 0.92 | 0.16 | 0 | 1 | 0.94 | 0.23 | 0 | 0 | 0.32 | 0.5 | 0.66 | 0.32 | 0.94 | 0.2 | 0.32 | 0.92 | 0.66 | 0 |
| Lazio | 0.57 | 0.53 | 0.81 | 0.81 | 0.17 | 0 | 0.94 | 1 | 0.32 | 0 | 0 | 0.53 | 0.41 | 0.88 | 0.53 | 0.78 | 0.22 | 0.53 | 0.87 | 0.71 | 0 |
| Liguria | 0.46 | 0.12 | 0.2 | 0.2 | 0.79 | 0 | 0.23 | 0.32 | 1 | 0 | 0.25 | 0.12 | 0.84 | 0.34 | 0.12 | 0.32 | 0.74 | 0.12 | 0.23 | 0.34 | 0 |
| Lombardi | 0 | 0 | 0 | 0 | 0 | 0 | 0 | 0 | 0 | 1 | 0 | 0 | 0 | 0 | 0 | 0 | 0 | 0 | 0 | 0 | 0 |
| Marche | 0 | 0 | 0 | 0 | 0.07 | 0 | 0 | 0 | 0.25 | 0 | 1 | 0 | 0.17 | 0 | 0 | 0 | 0.05 | 0 | 0 | 0 | 0 |
| Molise | 0.06 | 0 | 0.32 | 0.32 | 0 | 0 | 0.32 | 0.53 | 0.12 | 0 | 0 | 0 | 0.26 | 0.14 | 0 | 0.53 | 0 | 0 | 0.32 | 0.14 | 0 |
| Piemonte | 0.78 | 0.26 | 0.41 | 0.41 | 0.79 | 0 | 0.5 | 0.41 | 0.84 | 0 | 0.17 | 0.26 | 1 | 0.57 | 0.26 | 0.54 | 0.95 | 0.26 | 0.41 | 0.67 | 0 |
| Puglia | 0.6 | 0.14 | 0.48 | 0.48 | 0.18 | 0 | 0.66 | 0.88 | 0.34 | 0 | 0 | 0.14 | 0.57 | 1 | 0.14 | 0.94 | 0.15 | 0.14 | 0.59 | 0.94 | 0 |
| Sardegna | 0.06 | 0 | 0.32 | 0.32 | 0 | 0 | 0.32 | 0.53 | 0.12 | 0 | 0 | 0 | 0.26 | 0.14 | 0 | 0.53 | 0 | 0 | 0.32 | 0.14 | 0 |
| Sicilia | 0.67 | 0.53 | 0.81 | 0.81 | 0.27 | 0 | 0.94 | 0.78 | 0.32 | 0 | 0 | 0.53 | 0.54 | 0.94 | 0.53 | 1 | 0.37 | 0.53 | 0.81 | 0.77 | 0 |
| Toscana | 0.34 | 0.02 | 0.06 | 0.06 | 0.84 | 0 | 0.2 | 0.22 | 0.74 | 0 | 0.05 | 0.02 | 0.95 | 0.15 | 0.02 | 0.37 | 1 | 0.02 | 0.08 | 0.29 | 0 |
| Trento | 0.06 | 0 | 0.32 | 0.32 | 0 | 0 | 0.32 | 0.53 | 0.12 | 0 | 0 | 0 | 0.26 | 0.14 | 0 | 0.53 | 0 | 0 | 0.32 | 0.14 | 0 |
| Umbria | 0.3 | 0.32 | 0.92 | 0.92 | 0.09 | 0 | 0.92 | 0.87 | 0.23 | 0 | 0 | 0.32 | 0.41 | 0.59 | 0.32 | 0.81 | 0.08 | 0.32 | 1 | 0.53 | 0 |
| ValleAosta | 0.71 | 0.14 | 0.48 | 0.48 | 0.29 | 0 | 0.66 | 0.71 | 0.34 | 0 | 0 | 0.14 | 0.67 | 0.94 | 0.14 | 0.77 | 0.29 | 0.14 | 0.53 | 1 | 0 |
| Veneto | 0 | 0 | 0 | 0 | 0 | 0 | 0 | 0 | 0 | 0 | 0 | 0 | 0 | 0 | 0 | 0 | 0 | 0 | 0 | 0 | 1 |
| Abruzzo | Basilicata | Bolzano | Calabria | Campania | Emilia | Friuli | Lazio | Liguria | Lombardi | Marche | Molise | Piemonte | Puglia | Sardegna | Sicilia | Toscana | Trento | Umbria | ValleAosta | Veneto | |
|---|---|---|---|---|---|---|---|---|---|---|---|---|---|---|---|---|---|---|---|---|---|
| Abruzzo | 1 | 0.13 | 0.18 | 0.28 | 0.09 | 0 | 0 | 0 | 0.56 | 0 | 0 | 0.95 | 0 | 0.08 | 0.54 | 0.6 | 0 | 0.21 | 0.17 | 0 | 0 |
| Basilicata | 0.13 | 1 | 0.94 | 0.78 | 0 | 0 | 0 | 0 | 0.19 | 0 | 0 | 0.22 | 0 | 0 | 0.45 | 0.32 | 0 | 0 | 0 | 0 | 0 |
| Bolzano | 0.18 | 0.94 | 1 | 0.77 | 0 | 0 | 0 | 0 | 0.32 | 0 | 0 | 0.39 | 0 | 0 | 0.44 | 0.25 | 0 | 0.1 | 0.06 | 0 | 0 |
| Calabria | 0.28 | 0.78 | 0.77 | 1 | 0 | 0 | 0 | 0 | 0.33 | 0 | 0 | 0.45 | 0 | 0 | 0.63 | 0.32 | 0 | 0.1 | 0.07 | 0 | 0 |
| Campania | 0.09 | 0 | 0 | 0 | 1 | 0 | 0.65 | 0.65 | 0.41 | 0 | 0.1 | 0.08 | 0.13 | 0.37 | 0.05 | 0.27 | 0.2 | 0.18 | 0.22 | 0.1 | 0 |
| Emilia | 0 | 0 | 0 | 0 | 0 | 1 | 0 | 0 | 0 | 0 | 0 | 0 | 0 | 0 | 0 | 0 | 0 | 0 | 0 | 0 | 0 |
| Friuli | 0 | 0 | 0 | 0 | 0.65 | 0 | 1 | 0.18 | 0.22 | 0 | 0 | 0 | 0.07 | 0.25 | 0 | 0.75 | 0.06 | 0.08 | 0.16 | 0.06 | 0 |
| Lazio | 0 | 0 | 0 | 0 | 0.65 | 0 | 0.18 | 1 | 0.25 | 0 | 0.14 | 0 | 0.11 | 0.06 | 0 | 0.22 | 0.22 | 0 | 0 | 0.18 | 0 |
| Liguria | 0.56 | 0.19 | 0.32 | 0.33 | 0.41 | 0 | 0.22 | 0.25 | 1 | 0 | 0 | 0.8 | 0 | 0.65 | 0.47 | 1 | 0.08 | 0.75 | 0.85 | 0 | 0 |
| Lombardi | 0 | 0 | 0 | 0 | 0 | 0 | 0 | 0 | 0 | 1 | 0 | 0 | 0 | 0 | 0 | 0 | 0 | 0 | 0 | 0 | 0.38 |
| Marche | 0 | 0 | 0 | 0 | 0.1 | 0 | 0 | 0.14 | 0 | 0 | 1 | 0 | 0.85 | 0 | 0 | 0 | 0.53 | 0 | 0 | 0.8 | 0 |
| Molise | 0.95 | 0.22 | 0.39 | 0.45 | 0.08 | 0 | 0 | 0 | 0.8 | 0 | 0 | 1 | 0 | 0.2 | 0.74 | 0.4 | 0 | 0.44 | 0.3 | 0 | 0 |
| Piemonte | 0 | 0 | 0 | 0 | 0.13 | 0 | 0.07 | 0.11 | 0 | 0 | 0.85 | 0 | 1 | 0 | 0 | 0 | 0.46 | 0 | 0 | 0.9 | 0 |
| Puglia | 0.08 | 0 | 0 | 0 | 0.37 | 0 | 0.25 | 0.06 | 0.65 | 0 | 0 | 0.2 | 0 | 1 | 0.07 | 0.95 | 0 | 0.65 | 0.7 | 0 | 0 |
| Sardegna | 0.54 | 0.45 | 0.44 | 0.63 | 0.05 | 0 | 0 | 0 | 0.47 | 0 | 0 | 0.74 | 0 | 0.07 | 1 | 0.43 | 0 | 0.17 | 0.13 | 0 | 0 |
| Sicilia | 0.6 | 0.32 | 0.25 | 0.32 | 0.27 | 0 | 0.75 | 0.22 | 1 | 0 | 0 | 0.4 | 0 | 0.95 | 0.43 | 1 | 0 | 0.65 | 0.8 | 0 | 0 |
| Toscana | 0 | 0 | 0 | 0 | 0.2 | 0 | 0.06 | 0.22 | 0.08 | 0 | 0.53 | 0 | 0.46 | 0 | 0 | 0 | 1 | 0 | 0 | 0.71 | 0 |
| Trento | 0.21 | 0 | 0.1 | 0.1 | 0.18 | 0 | 0.08 | 0 | 0.75 | 0 | 0 | 0.44 | 0 | 0.65 | 0.17 | 0.65 | 0 | 1 | 0.95 | 0 | 0 |
| Umbria | 0.17 | 0 | 0.06 | 0.07 | 0.22 | 0 | 0.16 | 0 | 0.85 | 0 | 0 | 0.3 | 0 | 0.7 | 0.13 | 0.8 | 0 | 0.95 | 1 | 0 | 0 |
| ValleAosta | 0 | 0 | 0 | 0 | 0.1 | 0 | 0.06 | 0.18 | 0 | 0 | 0.8 | 0 | 0.9 | 0 | 0 | 0 | 0.71 | 0 | 0 | 1 | 0 |
| Veneto | 0 | 0 | 0 | 0 | 0 | 0 | 0 | 0 | 0 | 0.38 | 0 | 0 | 0 | 0 | 0 | 0 | 0 | 0 | 0 | 0 | 1 |
| Abruzzo | Basilicata | Bolzano | Calabria | Campania | Emilia | Friuli | Lazio | Liguria | Lombardi | Marche | Molise | Piemonte | Puglia | Sardegna | Sicilia | Toscana | Trento | Umbria | ValleAosta | Veneto | |
|---|---|---|---|---|---|---|---|---|---|---|---|---|---|---|---|---|---|---|---|---|---|
| Abruzzo | 0 | 0 | 0.159 | 0.275 | 0.109 | 0 | 0.125 | 0.063 | 0 | 0 | 0 | 0 | 0.073 | 0.201 | 0.337 | 0.535 | 0 | 0.053 | 0.609 | 0.608 | 0.056 |
| Basilicata | 0 | 1 | 0 | 0 | 0 | 0 | 0 | 0 | 0 | 0 | 0 | 0.164 | 0 | 0 | 0 | 0 | 0 | 0 | 0 | 0 | 0 |
| Bolzano | 0.159 | 0 | 1 | 0 | 0.949 | 0 | 0.37 | 0.37 | 0 | 0 | 0 | 0 | 0.159 | 0.482 | 0 | 0.275 | 0 | 0.798 | 0.249 | 0.701 | 0 |
| Calabria | 0.275 | 0 | 0 | 1 | 0 | 0 | 0 | 0 | 0 | 0 | 0 | 0 | 0 | 0 | 1 | 0.073 | 0 | 0 | 0 | 0.159 | 0.056 |
| Campania | 0.109 | 0 | 0.949 | 0 | 1 | 0 | 0.535 | 0.383 | 0 | 0 | 0 | 0 | 0.165 | 0.701 | 0 | 0.25 | 0 | 0.62 | 0.224 | 0.749 | 0.056 |
| Emilia | 0 | 0 | 0 | 0 | 0 | 1 | 0 | 0 | 0 | 0 | 0 | 0 | 0 | 0 | 0 | 0 | 0 | 0 | 0 | 0 | 0.056 |
| Friuli | 0.125 | 0 | 0.37 | 0 | 0.535 | 0 | 1 | 0.71 | 0.209 | 0 | 0 | 0 | 0.318 | 0.25 | 0 | 0.073 | 0 | 1 | 0.073 | 0.306 | 0.056 |
| Lazio | 0.063 | 0 | 0.37 | 0 | 0.383 | 0 | 0.71 | 1 | 0.383 | 0 | 0 | 0 | 0.456 | 0.318 | 0 | 0.165 | 0.179 | 0.805 | 0.165 | 0.141 | 0.056 |
| Liguria | 0 | 0 | 0 | 0 | 0 | 0 | 0.209 | 0.383 | 1 | 0 | 0 | 0 | 0.805 | 0 | 0 | 0 | 0.482 | 0.128 | 0 | 0 | 0.056 |
| Lombardi | 0 | 0 | 0 | 0 | 0 | 0 | 0 | 0 | 0 | 1 | 0 | 0 | 0 | 0 | 0 | 0 | 0 | 0 | 0 | 0 | 0.222 |
| Marche | 0 | 0 | 0 | 0 | 0 | 0 | 0 | 0 | 0 | 0 | 1 | 0 | 0.406 | 0 | 0 | 0 | 0.224 | 0 | 0 | 0 | 0 |
| Molise | 0 | 0.164 | 0 | 0 | 0 | 0 | 0 | 0 | 0 | 0 | 0 | 1 | 0 | 0 | 0 | 0 | 0 | 0 | 0 | 0 | 0 |
| Piemonte | 0.073 | 0 | 0.159 | 0 | 0.165 | 0 | 0.318 | 0.456 | 0.805 | 0 | 0.406 | 0 | 1 | 0.128 | 0 | 0.097 | 0.949 | 0.318 | 0.055 | 0.084 | 0.056 |
| Puglia | 0.201 | 0 | 0.482 | 0 | 0.701 | 0 | 0.25 | 0.318 | 0 | 0 | 0 | 0 | 0.128 | 1 | 0 | 0.535 | 0 | 0.306 | 0.522 | 0.848 | 0.056 |
| Sardegna | 0.337 | 0 | 0 | 1 | 0 | 0 | 0 | 0 | 0 | 0 | 0 | 0 | 0 | 0 | 1 | 0.14 | 0 | 0 | 0 | 0.224 | 0 |
| Sicilia | 0.535 | 0 | 0.275 | 0.073 | 0.25 | 0 | 0.073 | 0.165 | 0 | 0 | 0 | 0 | 0.097 | 0.535 | 0.14 | 1 | 0 | 0.159 | 1 | 0.565 | 0.056 |
| Toscana | 0 | 0 | 0 | 0 | 0 | 0 | 0 | 0.179 | 0.482 | 0 | 0.224 | 0 | 0.949 | 0 | 0 | 0 | 1 | 0.141 | 0 | 0 | 0 |
| Trento | 0.053 | 0 | 0.798 | 0 | 0.62 | 0 | 1 | 0.805 | 0.128 | 0 | 0 | 0 | 0.318 | 0.306 | 0 | 0.159 | 0.141 | 1 | 0.165 | 0.249 | 0.056 |
| Umbria | 0.609 | 0 | 0.249 | 0 | 0.224 | 0 | 0.073 | 0.165 | 0 | 0 | 0 | 0 | 0.055 | 0.522 | 0 | 1 | 0 | 0.165 | 1 | 0.749 | 0.056 |
| ValleAosta | 0.608 | 0 | 0.701 | 0.159 | 0.749 | 0 | 0.306 | 0.141 | 0 | 0 | 0 | 0 | 0.084 | 0.848 | 0.224 | 0.565 | 0 | 0.249 | 0.749 | 1 | 0 |
| Veneto | 0.056 | 0 | 0 | 0.056 | 0.056 | 0.056 | 0.056 | 0.056 | 0.056 | 0.222 | 0 | 0 | 0.056 | 0.056 | 0 | 0.056 | 0 | 0.056 | 0.056 | 0 | 1 |
| Abruzzo | Basilicata | Bolzano | Calabria | Campania | Emilia | Friuli | Lazio | Liguria | Lombardi | Marche | Molise | Piemonte | Puglia | Sardegna | Sicilia | Toscana | Trento | Umbria | ValleAosta | Veneto | |
|---|---|---|---|---|---|---|---|---|---|---|---|---|---|---|---|---|---|---|---|---|---|
| Abruzzo | 1 | 0 | 0.71 | 0 | 0.209 | 0 | 0.848 | 0 | 0 | 0 | 0.209 | 0 | 0 | 0.383 | 0.109 | 1 | 0 | 0.62 | 0.7 | 0.371 | 0.371 |
| Basilicata | 0 | 1 | 0 | 0 | 0 | 0 | 0 | 0 | 0 | 0 | 0.159 | 0.14 | 0 | 0 | 0.055 | 0 | 0 | 0.159 | 0 | 0 | 0 |
| Bolzano | 0.71 | 0 | 1 | 0 | 0.383 | 0 | 0.805 | 0 | 0 | 0 | 0.209 | 0 | 0 | 0.456 | 0.073 | 0.62 | 0 | 0.654 | 0.949 | 0.159 | 0.159 |
| Calabria | 0 | 0 | 0 | 1 | 0 | 0 | 0.165 | 0 | 0 | 0 | 0.209 | 0 | 0 | 0 | 0.902 | 0.055 | 0 | 0.209 | 0 | 0.125 | 0.125 |
| Campania | 0.209 | 0 | 0.383 | 0 | 1 | 0 | 0.71 | 0.096 | 0.128 | 0 | 0.306 | 0 | 0 | 0.654 | 0.128 | 0.259 | 0 | 0.898 | 0.084 | 0.128 | 0.128 |
| Emilia | 0 | 0 | 0 | 0 | 0 | 1 | 0 | 0 | 0 | 0.097 | 0 | 0 | 0.383 | 0 | 0 | 0 | 0 | 0 | 0 | 0 | 0 |
| Friuli | 0.848 | 0 | 0.805 | 0.165 | 0.71 | 0 | 1 | 0 | 0 | 0 | 0.159 | 0 | 0 | 0.522 | 0.305 | 0.902 | 0 | 0.798 | 0.798 | 0.609 | 0.609 |
| Lazio | 0 | 0 | 0 | 0 | 0.096 | 0 | 0 | 1 | 1 | 0 | 0.798 | 0 | 0 | 0.306 | 0 | 0 | 0.055 | 0.128 | 0 | 0 | 0 |
| Liguria | 0 | 0 | 0 | 0 | 0.128 | 0 | 0 | 1 | 1 | 0 | 1 | 0 | 0 | 0.259 | 0 | 0 | 0.096 | 0.165 | 0 | 0 | 0 |
| Lombardi | 0 | 0 | 0 | 0 | 0 | 0.097 | 0 | 0 | 0 | 1 | 0 | 0 | 0.053 | 0 | 0 | 0 | 0 | 0 | 0 | 0 | 0 |
| Marche | 0.209 | 0.159 | 0.209 | 0.209 | 0.306 | 0 | 0.159 | 0.798 | 1 | 0 | 1 | 0.096 | 0 | 0.125 | 0.209 | 0.318 | 0.055 | 0.276 | 0.179 | 0.209 | 0.209 |
| Molise | 0 | 0.14 | 0 | 0 | 0 | 0 | 0 | 0 | 0 | 0 | 0.096 | 1 | 0 | 0 | 0 | 0 | 0 | 0.096 | 0 | 0 | 0 |
| Piemonte | 0 | 0 | 0 | 0 | 0 | 0.383 | 0 | 0 | 0 | 0.053 | 0 | 0 | 1 | 0 | 0 | 0 | 0 | 0 | 0 | 0 | 0 |
| Puglia | 0.383 | 0 | 0.456 | 0 | 0.654 | 0 | 0.522 | 0.306 | 0.259 | 0 | 0.125 | 0 | 0 | 1 | 0.053 | 0.318 | 0 | 0.798 | 0.159 | 0.073 | 0.073 |
| Sardegna | 0.109 | 0.055 | 0.073 | 0.902 | 0.128 | 0 | 0.305 | 0 | 0 | 0 | 0.209 | 0 | 0 | 0.053 | 1 | 0.259 | 0 | 0.456 | 0.124 | 0.405 | 0.405 |
| Sicilia | 1 | 0 | 0.62 | 0.055 | 0.259 | 0 | 0.902 | 0 | 0 | 0 | 0.318 | 0 | 0 | 0.318 | 0.259 | 1 | 0 | 0.71 | 0.749 | 0.535 | 0.535 |
| Toscana | 0 | 0 | 0 | 0 | 0 | 0 | 0 | 0.055 | 0.096 | 0 | 0.055 | 0 | 0 | 0 | 0 | 0 | 1 | 0 | 0 | 0 | 0 |
| Trento | 0.62 | 0.159 | 0.654 | 0.209 | 0.898 | 0 | 0.798 | 0.128 | 0.165 | 0 | 0.276 | 0.096 | 0 | 0.798 | 0.456 | 0.71 | 0 | 1 | 0.482 | 0.456 | 0.456 |
| Umbria | 0.7 | 0 | 0.949 | 0 | 0.084 | 0 | 0.798 | 0 | 0 | 0 | 0.179 | 0 | 0 | 0.159 | 0.124 | 0.749 | 0 | 0.482 | 1 | 0.224 | 0.224 |
| ValleAosta | 0.371 | 0 | 0.159 | 0.125 | 0.128 | 0 | 0.609 | 0 | 0 | 0 | 0.209 | 0 | 0 | 0.073 | 0.405 | 0.535 | 0 | 0.456 | 0.224 | 1 | 1 |
| Veneto | 0.371 | 0 | 0.159 | 0.125 | 0.128 | 0 | 0.609 | 0 | 0 | 0 | 0.209 | 0 | 0 | 0.073 | 0.405 | 0.535 | 0 | 0.456 | 0.224 | 1 | 1 |
| Abruzzo | Basilicata | Bolzano | Calabria | Campania | Emilia | Friuli | Lazio | Liguria | Lombardi | Marche | Molise | Piemonte | Puglia | Sardegna | Sicilia | Toscana | Trento | Umbria | ValleAosta | Veneto | |
|---|---|---|---|---|---|---|---|---|---|---|---|---|---|---|---|---|---|---|---|---|---|
| Abruzzo | 1 | 0 | 0.097 | 0 | 0.949 | 0 | 0.165 | 0 | 0.209 | 0 | 0 | 0 | 0 | 0.701 | 0 | 0.71 | 0 | 0.141 | 0.128 | 0 | 0 |
| Basilicata | 0 | 1 | 0 | 0 | 0 | 0 | 0 | 0 | 0 | 0 | 0 | 0.072 | 0 | 0 | 0.141 | 0 | 0 | 0 | 0 | 0.654 | 0 |
| Bolzano | 0.097 | 0 | 1 | 0.565 | 0 | 0 | 0.898 | 0 | 0.128 | 0 | 0 | 0 | 0 | 0 | 0.535 | 0 | 0 | 0.749 | 0.535 | 0.128 | 0 |
| Calabria | 0 | 0 | 0.565 | 1 | 0 | 0 | 0.337 | 0 | 0 | 0 | 0 | 0 | 0 | 0 | 0.337 | 0 | 0 | 0.158 | 0.178 | 0.337 | 0 |
| Campania | 0.949 | 0 | 0 | 0 | 1 | 0 | 0 | 0 | 0.277 | 0 | 0.073 | 0 | 0 | 0.949 | 0 | 0.653 | 0 | 0 | 0 | 0 | 0 |
| Emilia | 0 | 0 | 0 | 0 | 0 | 1 | 0 | 0 | 0 | 0 | 0 | 0 | 0 | 0 | 0 | 0 | 0 | 0 | 0 | 0 | 0 |
| Friuli | 0.165 | 0 | 0.898 | 0.337 | 0 | 0 | 1 | 0 | 0.096 | 0 | 0 | 0 | 0 | 0 | 0.125 | 0 | 0 | 0.848 | 1 | 0.073 | 0 |
| Lazio | 0 | 0 | 0 | 0 | 0 | 0 | 0 | 1 | 1 | 0 | 0.201 | 0 | 0 | 0 | 0 | 0 | 0 | 0 | 0 | 0 | 0 |
| Liguria | 0.209 | 0 | 0.128 | 0 | 0.277 | 0 | 0.096 | 1 | 1 | 0 | 0.898 | 0 | 0 | 0.318 | 0 | 0.383 | 0 | 0.141 | 0.128 | 0 | 0 |
| Lombardi | 0 | 0 | 0 | 0 | 0 | 0 | 0 | 0 | 0 | 1 | 0 | 0 | 0 | 0 | 0 | 0 | 0 | 0 | 0 | 0 | 0 |
| Marche | 0 | 0 | 0 | 0 | 0.073 | 0 | 0 | 0.201 | 0.898 | 0 | 1 | 0 | 0 | 0.053 | 0 | 0.165 | 0 | 0 | 0 | 0 | 0 |
| Molise | 0 | 0.072 | 0 | 0 | 0 | 0 | 0 | 0 | 0 | 0 | 0 | 1 | 0 | 0 | 0 | 0 | 0 | 0 | 0 | 0.337 | 0 |
| Piemonte | 0 | 0 | 0 | 0 | 0 | 0 | 0 | 0 | 0 | 0 | 0 | 0 | 1 | 0 | 0 | 0 | 0 | 0 | 0 | 0 | 0 |
| Puglia | 0.701 | 0 | 0 | 0 | 0.949 | 0 | 0 | 0 | 0.318 | 0 | 0.053 | 0 | 0 | 1 | 0 | 0.535 | 0 | 0 | 0 | 0 | 0 |
| Sardegna | 0 | 0.141 | 0.535 | 0.337 | 0 | 0 | 0.125 | 0 | 0 | 0 | 0 | 0 | 0 | 0 | 1 | 0 | 0 | 0.084 | 0.097 | 0.535 | 0 |
| Sicilia | 0.71 | 0 | 0 | 0 | 0.653 | 0 | 0 | 0 | 0.383 | 0 | 0.165 | 0 | 0 | 0.535 | 0 | 1 | 0 | 0 | 0 | 0 | 0 |
| Toscana | 0 | 0 | 0 | 0 | 0 | 0 | 0 | 0 | 0 | 0 | 0 | 0 | 0 | 0 | 0 | 0 | 1 | 0 | 0 | 0 | 0 |
| Trento | 0.141 | 0 | 0.749 | 0.158 | 0 | 0 | 0.848 | 0 | 0.141 | 0 | 0 | 0 | 0 | 0 | 0.084 | 0 | 0 | 1 | 0.949 | 0 | 0 |
| Umbria | 0.128 | 0 | 0.535 | 0.178 | 0 | 0 | 1 | 0 | 0.128 | 0 | 0 | 0 | 0 | 0 | 0.097 | 0 | 0 | 0.949 | 1 | 0.097 | 0 |
| ValleAosta | 0 | 0.654 | 0.128 | 0.337 | 0 | 0 | 0.073 | 0 | 0 | 0 | 0 | 0.337 | 0 | 0 | 0.535 | 0 | 0 | 0 | 0.097 | 1 | 0 |
| Veneto | 0 | 0 | 0 | 0 | 0 | 0 | 0 | 0 | 0 | 0 | 0 | 0 | 0 | 0 | 0 | 0 | 0 | 0 | 0 | 0 | 1 |
| Abruzzo | Basilicata | Bolzano | Calabria | Campania | Emilia | Friuli | Lazio | Liguria | Lombardi | Marche | Molise | Piemonte | Puglia | Sardegna | Sicilia | Toscana | Trento | Umbria | ValleAosta | Veneto | |
|---|---|---|---|---|---|---|---|---|---|---|---|---|---|---|---|---|---|---|---|---|---|
| Abruzzo | 1 | 0 | 0.13 | 0.361 | 0.085 | 0 | 0.05 | 0 | 0 | 0 | 0.109 | 0.21 | 0.116 | 0.895 | 0 | 0 | 0 | 0.545 | 0.337 | 0.459 | 0 |
| Basilicata | 0 | 0 | 0 | 0 | 0 | 0 | 0 | 0 | 0 | 0 | 0 | 0 | 0 | 0 | 0 | 0 | 0 | 0 | 0 | 0 | 0 |
| Bolzano | 0.13 | 0.001 | 1 | 0.087 | 0 | 0 | 0 | 0 | 0 | 0 | 0.896 | 0.676 | 0.799 | 0 | 0.468 | 0 | 0 | 0 | 0.112 | 0.635 | 0 |
| Calabria | 0.361 | 0 | 0.087 | 1 | 0.078 | 0 | 0 | 0 | 0 | 0 | 0.253 | 0.67 | 0.155 | 0.261 | 0 | 0 | 0 | 0.218 | 0.642 | 0.489 | 0 |
| Campania | 0.085 | 0 | 0 | 0.078 | 1 | 0 | 0.553 | 0 | 0 | 0 | 0 | 0 | 0 | 0.265 | 0 | 0.687 | 0.391 | 0.592 | 0.079 | 0 | 0 |
| Emilia | 0 | 0 | 0 | 0 | 0 | 1 | 0 | 0.147 | 0.268 | 0 | 0 | 0 | 0 | 0 | 0 | 0 | 0 | 0 | 0 | 0 | 0 |
| Friuli | 0.05 | 0 | 0 | 0 | 0.553 | 0 | 1 | 0.131 | 0.094 | 0 | 0 | 0 | 0 | 0.051 | 0 | 0.505 | 0.844 | 0.205 | 0 | 0 | 0 |
| Lazio | 0 | 0 | 0 | 0 | 0 | 0.147 | 0.131 | 1 | 0.286 | 0 | 0 | 0 | 0 | 0 | 0 | 0 | 0 | 0 | 0 | 0 | 0 |
| Liguria | 0 | 0 | 0 | 0 | 0 | 0.268 | 0.094 | 0.286 | 1 | 0 | 0 | 0 | 0 | 0 | 0 | 0 | 0.055 | 0 | 0 | 0 | 0 |
| Lombardi | 0 | 0 | 0 | 0 | 0 | 0 | 0 | 0 | 0 | 1 | 0 | 0 | 0 | 0 | 0 | 0 | 0 | 0 | 0 | 0 | 0.506 |
| Marche | 0.109 | 0.002 | 0.896 | 0.253 | 0 | 0 | 0 | 0 | 0 | 0 | 1 | 0.571 | 0.891 | 0 | 0.673 | 0 | 0 | 0 | 0.271 | 0.435 | 0 |
| Molise | 0.21 | 0 | 0.676 | 0.67 | 0 | 0 | 0 | 0 | 0 | 0 | 0.571 | 1 | 0.666 | 0.116 | 0.229 | 0 | 0 | 0.125 | 0.855 | 0.769 | 0 |
| Piemonte | 0.116 | 0.003 | 0.799 | 0.155 | 0 | 0 | 0 | 0 | 0 | 0 | 0.891 | 0.666 | 1 | 0 | 0.606 | 0 | 0 | 0 | 0.191 | 0.425 | 0 |
| Puglia | 0.895 | 0 | 0 | 0.261 | 0.265 | 0 | 0.051 | 0 | 0 | 0 | 0 | 0.116 | 0 | 1 | 0 | 0 | 0 | 0.675 | 0.686 | 0.093 | 0 |
| Sardegna | 0 | 0.006 | 0.468 | 0 | 0 | 0 | 0 | 0 | 0 | 0 | 0.673 | 0.229 | 0.606 | 0 | 1 | 0 | 0 | 0 | 0.065 | 0.201 | 0 |
| Sicilia | 0 | 0 | 0 | 0 | 0.687 | 0 | 0.505 | 0 | 0 | 0 | 0 | 0 | 0 | 0 | 0 | 1 | 0.719 | 0.263 | 0 | 0 | 0 |
| Toscana | 0 | 0 | 0 | 0 | 0.391 | 0 | 0.844 | 0 | 0.055 | 0 | 0 | 0 | 0 | 0 | 0 | 0.719 | 1 | 0.121 | 0 | 0 | 0 |
| Trento | 0.545 | 0 | 0 | 0.218 | 0.592 | 0 | 0.205 | 0 | 0 | 0 | 0 | 0.125 | 0 | 0.675 | 0 | 0.263 | 0.121 | 1 | 0.253 | 0.125 | 0 |
| Umbria | 0.337 | 0 | 0.112 | 0.642 | 0.079 | 0 | 0 | 0 | 0 | 0 | 0.271 | 0.855 | 0.191 | 0.686 | 0.065 | 0 | 0 | 0.253 | 1 | 0.497 | 0 |
| ValleAosta | 0.459 | 0 | 0.635 | 0.489 | 0 | 0 | 0 | 0 | 0 | 0 | 0.435 | 0.769 | 0.425 | 0.093 | 0.201 | 0 | 0 | 0.125 | 0.497 | 1 | 0 |
| Veneto | 0 | 0 | 0 | 0 | 0 | 0 | 0 | 0 | 0 | 0.506 | 0 | 0 | 0 | 0 | 0 | 0 | 0 | 0 | 0 | 0 | 1 |
| Abruzzo | Basilicata | Bolzano | Calabria | Campania | Emilia | Friuli | Lazio | Liguria | Lombardi | Marche | Molise | Piemonte | Puglia | Sardegna | Sicilia | Toscana | Trento | Umbria | ValleAosta | Veneto | |
|---|---|---|---|---|---|---|---|---|---|---|---|---|---|---|---|---|---|---|---|---|---|
| Abruzzo | 0 | 0 | 0 | 0 | 0 | 0 | 0 | 0 | 0.14 | 0 | 0 | 0 | 0 | 0 | 0 | 0 | 0.06 | 0 | 0 | 0 | 0 |
| Basilicata | 0 | 0 | 0 | 0 | 0 | 0 | 0 | 0 | 0.14 | 0 | 0 | 0 | 0 | 0 | 0 | 0 | 0.06 | 0 | 0 | 0 | 0 |
| Bolzano | 0 | 0 | 0 | 0 | 0 | 0 | 0 | 0 | 0.14 | 0 | 0 | 0 | 0 | 0 | 0 | 0 | 0.06 | 0 | 0 | 0 | 0 |
| Calabria | 0 | 0 | 0 | 0 | 0 | 0 | 0 | 0 | 0.14 | 0 | 0 | 0 | 0 | 0 | 0 | 0 | 0.06 | 0 | 0 | 0 | 0 |
| Campania | 0 | 0 | 0 | 0 | 0 | 0 | 0 | 0 | 0.14 | 0 | 0 | 0 | 0 | 0 | 0 | 0 | 0.06 | 0 | 0 | 0 | 0 |
| Emilia | 0 | 0 | 0 | 0 | 0 | 0 | 0 | 0 | 0.14 | 0 | 0 | 0 | 0 | 0 | 0 | 0 | 0.06 | 0 | 0 | 0 | 0 |
| Friuli | 0 | 0 | 0 | 0 | 0 | 0 | 0 | 0 | 0.14 | 0 | 0 | 0 | 0 | 0 | 0 | 0 | 0.06 | 0 | 0 | 0 | 0 |
| Lazio | 0 | 0 | 0 | 0 | 0 | 0 | 0 | 1 | 0.16 | 0.64 | 0.14 | 0 | 0 | 0 | 0 | 0 | 0 | 0 | 0 | 0 | 0 |
| Liguria | 0.14 | 0.14 | 0.14 | 0.14 | 0.14 | 0.14 | 0.14 | 0.16 | 1 | 0.12 | 0.14 | 0.14 | 0.14 | 0.14 | 0.14 | 0.67 | 0.94 | 0.14 | 0.14 | 0.14 | 0 |
| Lombardi | 0.02 | 0.02 | 0.02 | 0.02 | 0.02 | 0.02 | 0.02 | 0.64 | 0.12 | 1 | 0.63 | 0.02 | 0.02 | 0.02 | 0.02 | 0.28 | 0.19 | 0.02 | 0.02 | 0.02 | 0 |
| Marche | 0 | 0 | 0 | 0 | 0 | 0 | 0 | 0.14 | 0.14 | 0.63 | 0 | 0 | 0 | 0 | 0 | 0 | 0 | 0 | 0 | 0 | 0 |
| Molise | 0 | 0 | 0 | 0 | 0 | 0 | 0 | 0 | 0.14 | 0 | 0 | 0 | 0 | 0 | 0 | 0 | 0.06 | 0 | 0 | 0 | 0 |
| Piemonte | 0 | 0 | 0 | 0 | 0 | 0 | 0 | 0 | 0.14 | 0 | 0 | 0 | 0 | 0 | 0 | 0 | 0.06 | 0 | 0 | 0 | 0 |
| Puglia | 0 | 0 | 0 | 0 | 0 | 0 | 0 | 0 | 0.14 | 0 | 0 | 0 | 0 | 0 | 0 | 0 | 0.06 | 0 | 0 | 0 | 0 |
| Sardegna | 0 | 0 | 0 | 0 | 0 | 0 | 0 | 0 | 0.14 | 0 | 0 | 0 | 0 | 0 | 0 | 0 | 0.06 | 0 | 0 | 0 | 0 |
| Sicilia | 0.02 | 0.02 | 0.02 | 0.02 | 0.02 | 0.02 | 0.02 | 0 | 0.67 | 0.28 | 0 | 0.02 | 0.02 | 0.02 | 0.02 | 1 | 0.19 | 0.02 | 0.02 | 0.02 | 0 |
| Toscana | 0.06 | 0.06 | 0.06 | 0.06 | 0.06 | 0.06 | 0.06 | 0 | 0.94 | 0.19 | 0 | 0.06 | 0.06 | 0.06 | 0.06 | 0.19 | 1 | 0.06 | 0.06 | 0.06 | 0 |
| Trento | 0 | 0 | 0 | 0 | 0 | 0 | 0 | 0 | 0.14 | 0 | 0 | 0 | 0 | 0 | 0 | 0 | 0.06 | 0 | 0 | 0 | 0 |
| Umbria | 0 | 0 | 0 | 0 | 0 | 0 | 0 | 0 | 0.14 | 0 | 0 | 0 | 0 | 0 | 0 | 0 | 0.06 | 0 | 0 | 0 | 0 |
| ValleAosta | 0 | 0 | 0 | 0 | 0 | 0 | 0 | 0 | 0.14 | 0 | 0 | 0 | 0 | 0 | 0 | 0 | 0.06 | 0 | 0 | 0 | 0 |
| Veneto | 0 | 0 | 0 | 0 | 0 | 0 | 0 | 0 | 0 | 0 | 0 | 0 | 0 | 0 | 0 | 0 | 0 | 0 | 0 | 0 | 1 |
| Abruzzo | Basilicata | Bolzano | Calabria | Campania | Emilia | Friuli | Lazio | Liguria | Lombardi | Marche | Molise | Piemonte | Puglia | Sardegna | Sicilia | Toscana | Trento | Umbria | ValleAosta | Veneto | |
|---|---|---|---|---|---|---|---|---|---|---|---|---|---|---|---|---|---|---|---|---|---|
| Abruzzo | 0 | 0 | 0 | 0 | 0.32 | 0 | 0.06 | 0 | 0 | 0 | 0 | 0 | 0 | 0 | 0 | 0 | 0 | 0 | 0 | 0.32 | 0 |
| Basilicata | 0 | 0 | 0 | 0 | 0.32 | 0 | 0.06 | 0 | 0 | 0 | 0 | 0 | 0 | 0 | 0 | 0 | 0 | 0 | 0 | 0.32 | 0 |
| Bolzano | 0 | 0 | 0 | 0 | 0.32 | 0 | 0.06 | 0 | 0 | 0 | 0 | 0 | 0 | 0 | 0 | 0 | 0 | 0 | 0 | 0.32 | 0 |
| Calabria | 0 | 0 | 0 | 0 | 0.32 | 0 | 0.06 | 0 | 0 | 0 | 0 | 0 | 0 | 0 | 0 | 0 | 0 | 0 | 0 | 0.32 | 0 |
| Campania | 0.32 | 0.32 | 0.32 | 0.32 | 1 | 0 | 0.17 | 0 | 0 | 0 | 0 | 0.32 | 0.32 | 0 | 0.32 | 0 | 0 | 0.32 | 0.32 | 1 | 0 |
| Emilia | 0 | 0 | 0 | 0 | 0 | 1 | 0 | 0 | 0.1 | 0 | 0.85 | 0 | 0 | 0 | 0 | 0 | 0 | 0 | 0 | 0 | 0 |
| Friuli | 0.06 | 0.06 | 0.06 | 0.06 | 0.17 | 0 | 1 | 0 | 0 | 0 | 0 | 0.06 | 0.06 | 0.95 | 0.06 | 0.63 | 0.63 | 0.06 | 0.06 | 0.17 | 0 |
| Lazio | 0 | 0 | 0 | 0 | 0 | 0 | 0 | 0 | 0 | 0 | 0 | 0 | 0 | 0 | 0 | 0 | 0 | 0 | 0 | 0 | 0 |
| Liguria | 0 | 0 | 0 | 0 | 0 | 0.1 | 0 | 0 | 1 | 0 | 0.17 | 0 | 0 | 0 | 0 | 0 | 0 | 0 | 0 | 0 | 0 |
| Lombardi | 0 | 0 | 0 | 0 | 0 | 0 | 0 | 0 | 0 | 1 | 0 | 0 | 0 | 0 | 0 | 0 | 0 | 0 | 0 | 0 | 0.48 |
| Marche | 0 | 0 | 0 | 0 | 0 | 0.85 | 0 | 0.01 | 0.17 | 0 | 1 | 0 | 0 | 0 | 0 | 0 | 0 | 0 | 0 | 0 | 0 |
| Molise | 0 | 0 | 0 | 0 | 0.32 | 0 | 0.06 | 0 | 0 | 0 | 0 | 0 | 0 | 0 | 0 | 0 | 0 | 0 | 0 | 0.32 | 0 |
| Piemonte | 0 | 0 | 0 | 0 | 0.32 | 0 | 0.06 | 0 | 0 | 0 | 0 | 0 | 0 | 0 | 0 | 0 | 0 | 0 | 0 | 0.32 | 0 |
| Puglia | 0.01 | 0.01 | 0.01 | 0.01 | 0 | 0 | 0.95 | 0 | 0 | 0 | 0 | 0.01 | 0.01 | 1 | 0.01 | 0 | 0.14 | 0.01 | 0.01 | 0 | 0 |
| Sardegna | 0 | 0 | 0 | 0 | 0.32 | 0 | 0.06 | 0 | 0 | 0 | 0 | 0 | 0 | 0 | 0 | 0 | 0 | 0 | 0 | 0.32 | 0 |
| Sicilia | 0 | 0 | 0 | 0 | 0 | 0 | 0.63 | 0 | 0 | 0 | 0 | 0 | 0 | 0 | 0 | 0 | 0 | 0 | 0 | 0 | 0 |
| Toscana | 0 | 0 | 0 | 0 | 0 | 0 | 0.63 | 0 | 0 | 0 | 0 | 0 | 0 | 0.14 | 0 | 0 | 0 | 0 | 0 | 0 | 0 |
| Trento | 0 | 0 | 0 | 0 | 0.32 | 0 | 0.06 | 0 | 0 | 0 | 0 | 0 | 0 | 0 | 0 | 0 | 0 | 0 | 0 | 0.32 | 0 |
| Umbria | 0 | 0 | 0 | 0 | 0.32 | 0 | 0.06 | 0 | 0 | 0 | 0 | 0 | 0 | 0 | 0 | 0 | 0 | 0 | 0 | 0.32 | 0 |
| ValleAosta | 0.32 | 0.32 | 0.32 | 0.32 | 1 | 0 | 0.17 | 0 | 0 | 0 | 0 | 0.32 | 0.32 | 0 | 0.32 | 0 | 0 | 0.32 | 0.32 | 1 | 0 |
| Veneto | 0 | 0 | 0 | 0 | 0 | 0 | 0 | 0 | 0 | 0.48 | 0 | 0 | 0 | 0 | 0 | 0 | 0 | 0 | 0 | 0 | 1 |
| Abruzzo | Basilicata | Bolzano | Calabria | Campania | Emilia | Friuli | Lazio | Liguria | Lombardi | Marche | Molise | Piemonte | Puglia | Sardegna | Sicilia | Toscana | Trento | Umbria | ValleAosta | Veneto | |
|---|---|---|---|---|---|---|---|---|---|---|---|---|---|---|---|---|---|---|---|---|---|
| Abruzzo | 1 | 0 | 0 | 0.647 | 0.168 | 0 | 0 | 0 | 0 | 0 | 0 | 0 | 0 | 0.648 | 0 | 0.79 | 0 | 0.596 | 0.645 | 0.117 | 0 |
| Basilicata | 0 | 0 | 0 | 0 | 0 | 0 | 0 | 0 | 0 | 0 | 0 | 0 | 0 | 0 | 0 | 0 | 0 | 0 | 0 | 0.141 | 0 |
| Bolzano | 0 | 0 | 0 | 0 | 0 | 0 | 0 | 0 | 0 | 0 | 0 | 0 | 0 | 0 | 0 | 0 | 0 | 0 | 0 | 0.141 | 0 |
| Calabria | 0.647 | 0.001 | 0.001 | 1 | 0.052 | 0 | 0 | 0 | 0 | 0 | 0 | 0.001 | 0.001 | 0.827 | 0.001 | 0 | 0 | 0 | 0.08 | 0.067 | 0 |
| Campania | 0.168 | 0.001 | 0.001 | 0.052 | 1 | 0 | 0.563 | 0.176 | 0.07 | 0 | 0 | 0.001 | 0.001 | 0.053 | 0.001 | 0.393 | 0.698 | 0.475 | 0.137 | 0 | 0 |
| Emilia | 0 | 0.001 | 0.001 | 0 | 0 | 1 | 0 | 0 | 0 | 0 | 0.701 | 0.001 | 0.001 | 0 | 0.001 | 0 | 0 | 0 | 0 | 0 | 0.056 |
| Friuli | 0 | 0.001 | 0.001 | 0 | 0.563 | 0 | 1 | 0 | 0.221 | 0 | 0 | 0.001 | 0.001 | 0 | 0.001 | 0 | 0.119 | 0 | 0 | 0 | 0 |
| Lazio | 0 | 0.001 | 0.001 | 0 | 0.176 | 0 | 0 | 1 | 0.795 | 0 | 0 | 0.001 | 0.001 | 0 | 0.001 | 0 | 0 | 0 | 0 | 0 | 0 |
| Liguria | 0 | 0.001 | 0.001 | 0 | 0.07 | 0 | 0.221 | 0.795 | 1 | 0 | 0 | 0.001 | 0.001 | 0 | 0.001 | 0 | 0.153 | 0 | 0 | 0 | 0 |
| Lombardi | 0 | 0.001 | 0.001 | 0 | 0 | 0 | 0 | 0 | 0 | 1 | 0 | 0.001 | 0.001 | 0 | 0.001 | 0 | 0 | 0 | 0 | 0 | 0.056 |
| Marche | 0 | 0.001 | 0.001 | 0 | 0 | 0.701 | 0 | 0 | 0 | 0 | 1 | 0.001 | 0.001 | 0 | 0.001 | 0 | 0 | 0 | 0 | 0 | 0.056 |
| Molise | 0 | 0 | 0 | 0 | 0 | 0 | 0 | 0 | 0 | 0 | 0 | 0 | 0 | 0 | 0 | 0 | 0 | 0 | 0 | 0.141 | 0 |
| Piemonte | 0 | 0 | 0 | 0 | 0 | 0 | 0 | 0 | 0 | 0 | 0 | 0 | 0 | 0 | 0 | 0 | 0 | 0 | 0 | 0.141 | 0 |
| Puglia | 0.648 | 0.001 | 0.001 | 0.827 | 0.053 | 0 | 0 | 0 | 0 | 0 | 0 | 0.001 | 0.001 | 1 | 0.001 | 0 | 0 | 0.051 | 0.163 | 0.052 | 0 |
| Sardegna | 0 | 0 | 0 | 0 | 0 | 0 | 0 | 0 | 0 | 0 | 0 | 0 | 0 | 0 | 0 | 0 | 0 | 0 | 0 | 0.141 | 0 |
| Sicilia | 0.79 | 0.001 | 0.001 | 0 | 0.393 | 0 | 0 | 0 | 0 | 0 | 0 | 0.001 | 0.001 | 0 | 0.001 | 1 | 0.066 | 0.422 | 0.831 | 0 | 0 |
| Toscana | 0 | 0.001 | 0.001 | 0 | 0.698 | 0 | 0.119 | 0 | 0.153 | 0 | 0 | 0.001 | 0.001 | 0 | 0.001 | 0.066 | 1 | 0.093 | 0 | 0 | 0 |
| Trento | 0.596 | 0.003 | 0.003 | 0 | 0.475 | 0 | 0 | 0 | 0 | 0 | 0 | 0.003 | 0.003 | 0.051 | 0.003 | 0.422 | 0.093 | 1 | 0.17 | 0 | 0 |
| Umbria | 0.645 | 0.003 | 0.003 | 0.08 | 0.137 | 0 | 0 | 0 | 0 | 0 | 0 | 0.003 | 0.003 | 0.163 | 0.003 | 0.831 | 0 | 0.17 | 1 | 0 | 0 |
| ValleAosta | 0.117 | 0.141 | 0.141 | 0.067 | 0 | 0 | 0 | 0 | 0 | 0 | 0 | 0.141 | 0.141 | 0.052 | 0.141 | 0 | 0 | 0 | 0 | 1 | 0 |
| Veneto | 0 | 0.005 | 0.005 | 0 | 0 | 0.056 | 0 | 0 | 0 | 0.056 | 0.056 | 0.005 | 0.005 | 0 | 0.005 | 0 | 0 | 0 | 0 | 0 | 1 |
| Abruzzo | Basilicata | Bolzano | Calabria | Campania | Emilia | Friuli | Lazio | Liguria | Lombardi | Marche | Molise | Piemonte | Puglia | Sardegna | Sicilia | Toscana | Trento | Umbria | ValleAosta | Veneto | |
|---|---|---|---|---|---|---|---|---|---|---|---|---|---|---|---|---|---|---|---|---|---|
| Abruzzo | 1 | 0 | 0 | 0 | 0 | 0 | 0 | 0 | 0 | 0 | 0.177 | 0 | 0.092 | 0 | 0 | 0.053 | 0 | 0.094 | 0 | 0.516 | 0.516 |
| Basilicata | 0 | 0 | 0 | 0 | 0 | 0 | 0 | 0 | 0 | 0 | 0 | 0 | 0 | 0 | 0.061 | 0 | 0 | 0 | 0 | 0 | 0 |
| Bolzano | 0 | 0 | 0 | 0 | 0 | 0 | 0 | 0 | 0 | 0 | 0 | 0 | 0 | 0 | 0.061 | 0 | 0 | 0 | 0 | 0 | 0 |
| Calabria | 0 | 0.001 | 0.001 | 1 | 0 | 0 | 0 | 0 | 0 | 0 | 0.176 | 0 | 0.846 | 0.284 | 0.324 | 0 | 0 | 0 | 0.073 | 0.651 | 0.651 |
| Campania | 0 | 0.001 | 0.001 | 0 | 1 | 0 | 0.7 | 0 | 0 | 0 | 0.177 | 0 | 0 | 0 | 0 | 0 | 0.48 | 0.246 | 0 | 0 | 0 |
| Emilia | 0 | 0.001 | 0.001 | 0 | 0 | 1 | 0 | 0 | 0 | 0 | 0 | 0 | 0 | 0 | 0 | 0 | 0 | 0 | 0 | 0 | 0 |
| Friuli | 0 | 0.001 | 0.001 | 0 | 0.7 | 0 | 1 | 0.902 | 0.053 | 0 | 0.522 | 0 | 0 | 0 | 0 | 0.054 | 0.201 | 0.11 | 0 | 0 | 0 |
| Lazio | 0 | 0.001 | 0.001 | 0 | 0 | 0 | 0.902 | 1 | 0 | 0 | 0.2 | 0 | 0 | 0 | 0 | 0 | 0 | 0 | 0 | 0 | 0 |
| Liguria | 0 | 0.001 | 0.001 | 0 | 0 | 0 | 0.053 | 0 | 1 | 0 | 0.749 | 0 | 0 | 0 | 0 | 0 | 0 | 0 | 0 | 0 | 0 |
| Lombardi | 0 | 0.001 | 0.001 | 0 | 0 | 0 | 0 | 0 | 0 | 1 | 0 | 0 | 0 | 0 | 0 | 0 | 0 | 0 | 0 | 0 | 0 |
| Marche | 0.177 | 0.009 | 0.009 | 0.176 | 0.177 | 0 | 0.522 | 0.2 | 0.749 | 0 | 1 | 0.176 | 0.077 | 0.175 | 0.054 | 0.178 | 0.179 | 0.179 | 0.172 | 0.078 | 0.078 |
| Molise | 0 | 0.001 | 0.001 | 0 | 0 | 0 | 0 | 0 | 0 | 0 | 0.176 | 1 | 0.651 | 0 | 0 | 0 | 0 | 0 | 0 | 0.746 | 0.746 |
| Piemonte | 0.092 | 0.025 | 0.025 | 0.846 | 0 | 0 | 0 | 0 | 0 | 0 | 0.077 | 0.651 | 1 | 0.948 | 0.338 | 0 | 0 | 0 | 0.648 | 0.594 | 0.594 |
| Puglia | 0 | 0.001 | 0.001 | 0.284 | 0 | 0 | 0 | 0 | 0 | 0 | 0.175 | 0 | 0.948 | 1 | 0.215 | 0 | 0 | 0 | 0.113 | 0.697 | 0.697 |
| Sardegna | 0 | 0.061 | 0.061 | 0.324 | 0 | 0 | 0 | 0 | 0 | 0 | 0.054 | 0 | 0.338 | 0.215 | 1 | 0 | 0 | 0 | 0.071 | 0.194 | 0.194 |
| Sicilia | 0.053 | 0.001 | 0.001 | 0 | 0 | 0 | 0.054 | 0 | 0 | 0 | 0.178 | 0 | 0 | 0 | 0 | 1 | 0.249 | 0.521 | 0 | 0.062 | 0.062 |
| Toscana | 0 | 0.001 | 0.001 | 0 | 0.48 | 0 | 0.201 | 0 | 0 | 0 | 0.179 | 0 | 0 | 0 | 0 | 0.249 | 1 | 0.442 | 0 | 0 | 0 |
| Trento | 0.094 | 0.001 | 0.001 | 0 | 0.246 | 0 | 0.11 | 0 | 0 | 0 | 0.179 | 0 | 0 | 0 | 0 | 0.521 | 0.442 | 1 | 0 | 0 | 0 |
| Umbria | 0 | 0.001 | 0.001 | 0.073 | 0 | 0 | 0 | 0 | 0 | 0 | 0.172 | 0 | 0.648 | 0.113 | 0.071 | 0 | 0 | 0 | 1 | 0.648 | 0.648 |
| ValleAosta | 0.516 | 0.025 | 0.025 | 0.651 | 0 | 0 | 0 | 0 | 0 | 0 | 0.078 | 0.746 | 0.594 | 0.697 | 0.194 | 0.062 | 0 | 0 | 0.648 | 1 | 1 |
| Veneto | 0.516 | 0 | 0 | 0.651 | 0 | 0 | 0 | 0 | 0 | 0 | 0.078 | 0.746 | 0.594 | 0.697 | 0.194 | 0.062 | 0 | 0 | 0.648 | 1 | 1 |
| Abruzzo | Basilicata | Bolzano | Calabria | Campania | Emilia | Friuli | Lazio | Liguria | Lombardi | Marche | Molise | Piemonte | Puglia | Sardegna | Sicilia | Toscana | Trento | Umbria | ValleAosta | Veneto | |
|---|---|---|---|---|---|---|---|---|---|---|---|---|---|---|---|---|---|---|---|---|---|
| Abruzzo | 1 | 0 | 0 | 0 | 0 | 0 | 0 | 0 | 0 | 0 | 0 | 0 | 0.654 | 0.7 | 0.063 | 0 | 0 | 0 | 0.653 | 0 | 0 |
| Basilicata | 0 | 1 | 0 | 0 | 0 | 0 | 0 | 0 | 0 | 0 | 0 | 0 | 0 | 0 | 0 | 0 | 0 | 0 | 0 | 0 | 0 |
| Bolzano | 0 | 0 | 1 | 0 | 0.405 | 0 | 0 | 0 | 0 | 0 | 0 | 0 | 0.405 | 0 | 0 | 0.063 | 0.949 | 0 | 0 | 0 | 0 |
| Calabria | 0 | 0 | 0 | 1 | 0 | 0 | 0 | 0 | 0 | 0 | 0.121 | 0 | 0 | 0 | 0 | 0 | 0 | 0 | 0.43 | 0 | 0 |
| Campania | 0 | 0 | 0.405 | 0 | 1 | 0 | 0 | 0 | 0 | 0 | 0 | 0 | 0.654 | 0 | 0 | 0.083 | 0.276 | 0 | 0 | 0 | 0 |
| Emilia | 0 | 0 | 0 | 0 | 0 | 1 | 0 | 0 | 0 | 0 | 0 | 0 | 0 | 0 | 0 | 0 | 0 | 0 | 0 | 0 | 0 |
| Friuli | 0 | 0 | 0 | 0 | 0 | 0 | 1 | 0.318 | 0.073 | 0 | 0 | 0 | 0.277 | 0 | 0 | 0 | 0 | 0.073 | 0 | 0 | 0 |
| Lazio | 0 | 0 | 0 | 0 | 0 | 0 | 0.318 | 1 | 0 | 0 | 0 | 0 | 0.654 | 0 | 0 | 0 | 0 | 0.259 | 0 | 0 | 0 |
| Liguria | 0 | 0 | 0 | 0 | 0 | 0 | 0.073 | 0 | 1 | 0 | 0 | 0 | 0 | 0 | 0 | 0 | 0 | 0 | 0 | 0 | 0 |
| Lombardi | 0 | 0 | 0 | 0 | 0 | 0 | 0 | 0 | 0 | 1 | 0 | 0 | 0 | 0 | 0 | 0 | 0 | 0 | 0 | 0 | 0 |
| Marche | 0 | 0 | 0 | 0.121 | 0 | 0 | 0 | 0 | 0 | 0 | 1 | 0 | 0 | 0 | 0 | 0 | 0 | 0 | 0.698 | 0 | 0 |
| Molise | 0 | 0 | 0 | 0 | 0 | 0 | 0 | 0 | 0 | 0 | 0 | 1 | 0 | 0 | 1 | 0 | 0 | 0 | 0.898 | 0 | 0 |
| Piemonte | 0.654 | 0 | 0.405 | 0 | 0.654 | 0 | 0.277 | 0.654 | 0 | 0 | 0 | 0 | 1 | 0.405 | 0 | 0.654 | 0.654 | 0.848 | 0 | 0 | 0 |
| Puglia | 0.7 | 0 | 0 | 0 | 0 | 0 | 0 | 0 | 0 | 0 | 0 | 0 | 0.405 | 1 | 0.174 | 0 | 0 | 0 | 0.748 | 0 | 0 |
| Sardegna | 0.063 | 0 | 0 | 0 | 0 | 0 | 0 | 0 | 0 | 0 | 0 | 1 | 0 | 0.174 | 1 | 0 | 0 | 0 | 0.948 | 0 | 0 |
| Sicilia | 0 | 0 | 0.063 | 0 | 0.083 | 0 | 0 | 0 | 0 | 0 | 0 | 0 | 0.654 | 0 | 0 | 1 | 0 | 0 | 0.222 | 0 | 0 |
| Toscana | 0 | 0 | 0.949 | 0 | 0.276 | 0 | 0 | 0 | 0 | 0 | 0 | 0 | 0.654 | 0 | 0 | 0 | 1 | 0.141 | 0 | 0 | 0 |
| Trento | 0 | 0 | 0 | 0 | 0 | 0 | 0.073 | 0.259 | 0 | 0 | 0 | 0 | 0.848 | 0 | 0 | 0 | 0.141 | 1 | 0 | 0 | 0 |
| Umbria | 0.653 | 0 | 0 | 0.43 | 0 | 0 | 0 | 0 | 0 | 0 | 0.698 | 0.898 | 0 | 0.748 | 0.948 | 0.222 | 0 | 0 | 1 | 0 | 0 |
| ValleAosta | 0 | 0 | 0 | 0 | 0 | 0 | 0 | 0 | 0 | 0 | 0 | 0 | 0 | 0 | 0 | 0 | 0 | 0 | 0 | 0 | 0 |
| Veneto | 0 | 0 | 0 | 0 | 0 | 0 | 0 | 0 | 0 | 0 | 0 | 0 | 0 | 0 | 0 | 0 | 0 | 0 | 0 | 0.001 | 1 |
| Abruzzo | Basilicata | Bolzano | Calabria | Campania | Emilia | Friuli | Lazio | Liguria | Lombardi | Marche | Molise | Piemonte | Puglia | Sardegna | Sicilia | Toscana | Trento | Umbria | ValleAosta | Veneto | |
|---|---|---|---|---|---|---|---|---|---|---|---|---|---|---|---|---|---|---|---|---|---|
| Abruzzo | 1 | 0 | 0.785 | 0.097 | 0.926 | 0 | 0.253 | 0.111 | 0 | 0 | 0 | 0.067 | 0 | 0.157 | 0.124 | 0.421 | 0.405 | 0.789 | 0.262 | 0.42 | 0 |
| Basilicata | 0 | 1 | 0 | 0 | 0 | 0 | 0 | 0 | 0 | 0 | 0 | 0 | 0 | 0 | 0 | 0 | 0 | 0 | 0 | 0 | 0 |
| Bolzano | 0.785 | 0 | 1 | 0.155 | 0.691 | 0 | 0.148 | 0.067 | 0 | 0 | 0 | 0.101 | 0 | 0.104 | 0.188 | 0.517 | 0.291 | 0.972 | 0.431 | 0.346 | 0 |
| Calabria | 0.097 | 0 | 0.155 | 1 | 0.088 | 0 | 0 | 0 | 0 | 0 | 0 | 0.784 | 0 | 0 | 0.859 | 0.366 | 0 | 0.212 | 0.45 | 0 | 0 |
| Campania | 0.926 | 0 | 0.691 | 0.088 | 1 | 0 | 0.324 | 0.158 | 0 | 0 | 0 | 0 | 0 | 0.228 | 0.131 | 0.362 | 0.478 | 0.691 | 0.312 | 0.464 | 0 |
| Emilia | 0 | 0 | 0 | 0 | 0 | 1 | 0 | 0 | 0 | 0.563 | 0.224 | 0 | 0 | 0 | 0 | 0 | 0 | 0 | 0 | 0 | 0.939 |
| Friuli | 0.253 | 0 | 0.148 | 0 | 0.324 | 0 | 1 | 0.679 | 0.117 | 0 | 0 | 0 | 0.055 | 0.989 | 0 | 0 | 0.939 | 0.18 | 0 | 0.472 | 0 |
| Lazio | 0.111 | 0 | 0.067 | 0 | 0.158 | 0 | 0.679 | 1 | 0.231 | 0 | 0 | 0 | 0.099 | 0.662 | 0 | 0 | 0.613 | 0.08 | 0 | 0.25 | 0 |
| Liguria | 0 | 0 | 0 | 0 | 0 | 0 | 0.117 | 0.231 | 1 | 0 | 0 | 0 | 0.568 | 0.125 | 0 | 0 | 0.088 | 0 | 0 | 0 | 0 |
| Lombardi | 0 | 0 | 0 | 0 | 0 | 0.563 | 0 | 0 | 0 | 1 | 0.302 | 0 | 0 | 0 | 0 | 0 | 0 | 0 | 0 | 0 | 0.896 |
| Marche | 0 | 0 | 0 | 0 | 0 | 0.224 | 0 | 0 | 0 | 0.302 | 1 | 0 | 0.182 | 0 | 0 | 0 | 0 | 0 | 0 | 0 | 0.107 |
| Molise | 0.067 | 0 | 0.101 | 0.784 | 0 | 0 | 0 | 0 | 0 | 0 | 0 | 1 | 0 | 0 | 0.69 | 0.267 | 0 | 0.157 | 0.322 | 0 | 0 |
| Piemonte | 0 | 0 | 0 | 0 | 0 | 0 | 0.055 | 0.099 | 0.568 | 0 | 0.182 | 0 | 1 | 0.07 | 0 | 0 | 0 | 0 | 0 | 0 | 0 |
| Puglia | 0.157 | 0 | 0.104 | 0 | 0.228 | 0 | 0.989 | 0.662 | 0.125 | 0 | 0 | 0 | 0.07 | 1 | 0 | 0 | 0.71 | 0.109 | 0 | 0.289 | 0 |
| Sardegna | 0.124 | 0 | 0.188 | 0.859 | 0.131 | 0 | 0 | 0 | 0 | 0 | 0 | 0.69 | 0 | 0 | 1 | 0.384 | 0 | 0.258 | 0.638 | 0 | 0 |
| Sicilia | 0.421 | 0 | 0.517 | 0.366 | 0.362 | 0 | 0 | 0 | 0 | 0 | 0 | 0.267 | 0 | 0 | 0.384 | 1 | 0.123 | 0.612 | 0.686 | 0.09 | 0 |
| Toscana | 0.405 | 0 | 0.291 | 0 | 0.478 | 0 | 0.939 | 0.613 | 0.088 | 0 | 0 | 0 | 0 | 0.71 | 0 | 0.123 | 1 | 0.272 | 0.102 | 0.995 | 0 |
| Trento | 0.789 | 0 | 0.972 | 0.212 | 0.691 | 0 | 0.18 | 0.08 | 0 | 0 | 0 | 0.157 | 0 | 0.109 | 0.258 | 0.612 | 0.272 | 1 | 0.537 | 0.257 | 0 |
| Umbria | 0.262 | 0 | 0.431 | 0.45 | 0.312 | 0 | 0 | 0 | 0 | 0 | 0 | 0.322 | 0 | 0 | 0.638 | 0.686 | 0.102 | 0.537 | 1 | 0 | 0 |
| ValleAosta | 0.42 | 0 | 0.346 | 0 | 0.464 | 0 | 0.472 | 0.25 | 0 | 0 | 0 | 0 | 0 | 0.289 | 0 | 0.09 | 0.995 | 0.257 | 0 | 1 | 0 |
| Veneto | 0 | 0 | 0 | 0 | 0 | 0.939 | 0 | 0 | 0 | 0.896 | 0.107 | 0 | 0 | 0 | 0 | 0 | 0 | 0 | 0 | 0 | 1 |
| Abruzzo | Basilicata | Bolzano | Calabria | Campania | Emilia | Friuli | Lazio | Liguria | Lombardi | Marche | Molise | Piemonte | Puglia | Sardegna | Sicilia | Toscana | Trento | Umbria | ValleAosta | Veneto | |
|---|---|---|---|---|---|---|---|---|---|---|---|---|---|---|---|---|---|---|---|---|---|
| Abruzzo | 0 | 0 | 0 | 0 | 0 | 0 | 0 | 0 | 0 | 0 | 0 | 0 | 0 | 0 | 0 | 0 | 0 | 0 | 0 | 0 | 0 |
| Basilicata | 0 | 0 | 0 | 0 | 0 | 0 | 0 | 0 | 0 | 0 | 0 | 0 | 0 | 0 | 0 | 0 | 0 | 0 | 0 | 0 | 0 |
| Bolzano | 0 | 0 | 0 | 0 | 0 | 0 | 0 | 0 | 0 | 0 | 0 | 0 | 0 | 0 | 0 | 0 | 0 | 0 | 0 | 0 | 0 |
| Calabria | 0 | 0 | 0 | 0 | 0 | 0 | 0 | 0 | 0 | 0 | 0 | 0 | 0 | 0 | 0 | 0 | 0 | 0 | 0 | 0 | 0 |
| Campania | 0 | 0 | 0 | 0 | 0 | 0 | 0 | 0 | 0 | 0 | 0 | 0 | 0 | 0 | 0 | 0 | 0 | 0 | 0 | 0 | 0 |
| Emilia | 0.01 | 0.01 | 0.01 | 0.01 | 0.01 | 1 | 0.01 | 0.01 | 0.01 | 0 | 0.01 | 0.01 | 0.01 | 0.01 | 0.01 | 0.01 | 0.01 | 0.01 | 0.01 | 0.01 | 0 |
| Friuli | 0 | 0 | 0 | 0 | 0 | 0 | 0 | 0 | 0 | 0 | 0 | 0 | 0 | 0 | 0 | 0 | 0 | 0 | 0 | 0 | 0 |
| Lazio | 0 | 0 | 0 | 0 | 0 | 0 | 0 | 0 | 0 | 0 | 0 | 0 | 0 | 0 | 0 | 0 | 0 | 0 | 0 | 0 | 0 |
| Liguria | 0 | 0 | 0 | 0 | 0 | 0 | 0 | 0 | 0 | 0 | 0 | 0 | 0 | 0 | 0 | 0 | 0 | 0 | 0 | 0 | 0 |
| Lombardi | 0 | 0 | 0 | 0 | 0 | 0 | 0 | 0 | 0 | 1 | 0 | 0 | 0 | 0 | 0 | 0 | 0 | 0 | 0 | 0 | 0 |
| Marche | 0 | 0 | 0 | 0 | 0 | 0 | 0 | 0 | 0 | 0 | 1 | 0 | 0 | 0 | 0 | 0 | 0.01 | 0 | 0 | 0 | 0 |
| Molise | 0 | 0 | 0 | 0 | 0 | 0 | 0 | 0 | 0 | 0 | 0 | 0 | 0 | 0 | 0 | 0 | 0 | 0 | 0 | 0 | 0 |
| Piemonte | 0 | 0 | 0 | 0 | 0 | 0 | 0 | 0 | 0 | 0 | 0 | 0 | 0 | 0 | 0 | 0 | 0 | 0 | 0 | 0 | 0 |
| Puglia | 0 | 0 | 0 | 0 | 0 | 0 | 0 | 0 | 0 | 0 | 0 | 0 | 0 | 0 | 0 | 0 | 0 | 0 | 0 | 0 | 0 |
| Sardegna | 0 | 0 | 0 | 0 | 0 | 0 | 0 | 0 | 0 | 0 | 0 | 0 | 0 | 0 | 0 | 0 | 0 | 0 | 0 | 0 | 0 |
| Sicilia | 0 | 0 | 0 | 0 | 0 | 0 | 0 | 0 | 0 | 0 | 0 | 0 | 0 | 0 | 0 | 0 | 0 | 0 | 0 | 0 | 0 |
| Toscana | 0 | 0 | 0 | 0 | 0 | 0 | 0 | 0 | 0 | 0 | 0.01 | 0 | 0 | 0 | 0 | 0 | 0 | 0 | 0 | 0 | 0 |
| Trento | 0 | 0 | 0 | 0 | 0 | 0 | 0 | 0 | 0 | 0 | 0 | 0 | 0 | 0 | 0 | 0 | 0 | 0 | 0 | 0 | 0 |
| Umbria | 0 | 0 | 0 | 0 | 0 | 0 | 0 | 0 | 0 | 0 | 0 | 0 | 0 | 0 | 0 | 0 | 0 | 0 | 0 | 0 | 0 |
| ValleAosta | 0 | 0 | 0 | 0 | 0 | 0 | 0 | 0 | 0 | 0 | 0 | 0 | 0 | 0 | 0 | 0 | 0 | 0 | 0 | 0 | 0 |
| Veneto | 0 | 0 | 0 | 0 | 0 | 0 | 0 | 0 | 0 | 0 | 0 | 0 | 0 | 0 | 0 | 0 | 0 | 0 | 0 | 0 | 1 |
| Abruzzo | Basilicata | Bolzano | Calabria | Campania | Emilia | Friuli | Lazio | Liguria | Lombardi | Marche | Molise | Piemonte | Puglia | Sardegna | Sicilia | Toscana | Trento | Umbria | ValleAosta | Veneto | |
|---|---|---|---|---|---|---|---|---|---|---|---|---|---|---|---|---|---|---|---|---|---|
| Abruzzo | 0 | 0 | 0 | 0 | 0 | 0 | 0.32 | 0.06 | 0 | 0 | 0 | 0 | 0 | 0 | 0 | 0 | 0 | 0 | 0 | 0 | 0 |
| Basilicata | 0 | 0 | 0 | 0 | 0 | 0 | 0.32 | 0.06 | 0 | 0 | 0 | 0 | 0 | 0 | 0 | 0 | 0 | 0 | 0 | 0 | 0 |
| Bolzano | 0 | 0 | 0 | 0 | 0 | 0 | 0.32 | 0.06 | 0 | 0 | 0 | 0 | 0 | 0 | 0 | 0 | 0 | 0 | 0 | 0 | 0 |
| Calabria | 0 | 0 | 0 | 0 | 0 | 0 | 0.32 | 0.06 | 0 | 0 | 0 | 0 | 0 | 0 | 0 | 0 | 0 | 0 | 0 | 0 | 0 |
| Campania | 0 | 0 | 0 | 0 | 0 | 0 | 0.32 | 0.06 | 0 | 0 | 0 | 0 | 0 | 0 | 0 | 0 | 0 | 0 | 0 | 0 | 0 |
| Emilia | 0 | 0 | 0 | 0 | 0 | 1 | 0 | 0 | 0 | 0 | 0 | 0 | 0 | 0 | 0 | 0 | 0 | 0 | 0 | 0 | 0 |
| Friuli | 0.32 | 0.32 | 0.32 | 0.32 | 0.32 | 0 | 1 | 0.23 | 0 | 0 | 0 | 0.32 | 0.06 | 0 | 0.32 | 0.32 | 0.32 | 0.32 | 0.32 | 0 | 0 |
| Lazio | 0.06 | 0.06 | 0.06 | 0.06 | 0.06 | 0 | 0.23 | 1 | 0.05 | 0 | 0 | 0.06 | 0.24 | 0.34 | 0.06 | 0.06 | 0.06 | 0.06 | 0.06 | 0.06 | 0 |
| Liguria | 0 | 0 | 0 | 0 | 0 | 0 | 0 | 0.05 | 1 | 0 | 0 | 0 | 0.75 | 0.17 | 0 | 0 | 0 | 0 | 0 | 0.9 | 0 |
| Lombardi | 0 | 0 | 0 | 0 | 0 | 0 | 0 | 0 | 0 | 1 | 0 | 0 | 0 | 0 | 0 | 0 | 0 | 0 | 0 | 0 | 0.26 |
| Marche | 0 | 0 | 0 | 0 | 0 | 0 | 0 | 0 | 0 | 0 | 1 | 0 | 0 | 0 | 0 | 0 | 0 | 0 | 0 | 0 | 0 |
| Molise | 0 | 0 | 0 | 0 | 0 | 0 | 0.32 | 0.06 | 0 | 0 | 0 | 0 | 0 | 0 | 0 | 0 | 0 | 0 | 0 | 0 | 0 |
| Piemonte | 0.02 | 0.02 | 0.02 | 0.02 | 0.02 | 0 | 0.06 | 0.24 | 0.75 | 0 | 0 | 0.02 | 1 | 0.51 | 0.02 | 0.02 | 0.02 | 0.02 | 0.02 | 0.56 | 0 |
| Puglia | 0.01 | 0.01 | 0.01 | 0.01 | 0.01 | 0 | 0 | 0.34 | 0.17 | 0 | 0 | 0.01 | 0.51 | 1 | 0.01 | 0.01 | 0.01 | 0.01 | 0.01 | 0.21 | 0 |
| Sardegna | 0 | 0 | 0 | 0 | 0 | 0 | 0.32 | 0.06 | 0 | 0 | 0 | 0 | 0 | 0 | 0 | 0 | 0 | 0 | 0 | 0 | 0 |
| Sicilia | 0 | 0 | 0 | 0 | 0 | 0 | 0.32 | 0.06 | 0 | 0 | 0 | 0 | 0 | 0 | 0 | 0 | 0 | 0 | 0 | 0 | 0 |
| Toscana | 0 | 0 | 0 | 0 | 0 | 0 | 0.32 | 0.06 | 0 | 0 | 0 | 0 | 0 | 0 | 0 | 0 | 0 | 0 | 0 | 0 | 0 |
| Trento | 0 | 0 | 0 | 0 | 0 | 0 | 0.32 | 0.06 | 0 | 0 | 0 | 0 | 0 | 0 | 0 | 0 | 0 | 0 | 0 | 0 | 0 |
| Umbria | 0 | 0 | 0 | 0 | 0 | 0 | 0.32 | 0.06 | 0 | 0 | 0 | 0 | 0 | 0 | 0 | 0 | 0 | 0 | 0 | 0 | 0 |
| ValleAosta | 0 | 0 | 0 | 0 | 0 | 0 | 0 | 0.06 | 0.9 | 0 | 0 | 0 | 0.56 | 0.21 | 0 | 0 | 0 | 0 | 0 | 1 | 0 |
| Veneto | 0 | 0 | 0 | 0 | 0 | 0 | 0 | 0 | 0 | 0.26 | 0 | 0 | 0 | 0 | 0 | 0 | 0 | 0 | 0 | 0 | 1 |
| Abruzzo | Basilicata | Bolzano | Calabria | Campania | Emilia | Friuli | Lazio | Liguria | Lombardi | Marche | Molise | Piemonte | Puglia | Sardegna | Sicilia | Toscana | Trento | Umbria | ValleAosta | Veneto | |
|---|---|---|---|---|---|---|---|---|---|---|---|---|---|---|---|---|---|---|---|---|---|
| Abruzzo | 1 | 0 | 0.693 | 0 | 0.896 | 0 | 0 | 0 | 0 | 0 | 0 | 0 | 0 | 0 | 0 | 0.489 | 0.212 | 0.507 | 0 | 0.346 | 0 |
| Basilicata | 0 | 0 | 0 | 0.317 | 0 | 0 | 0 | 0 | 0 | 0 | 0 | 0 | 0 | 0 | 0.317 | 0 | 0 | 0 | 0 | 0 | 0 |
| Bolzano | 0.693 | 0.025 | 1 | 0.074 | 0.599 | 0 | 0 | 0 | 0 | 0 | 0 | 0.025 | 0 | 0 | 0.101 | 0.785 | 0.09 | 0.947 | 0.414 | 0.192 | 0 |
| Calabria | 0 | 0.317 | 0.074 | 1 | 0 | 0 | 0 | 0 | 0 | 0 | 0 | 0.317 | 0 | 0 | 0.917 | 0.059 | 0 | 0.073 | 0.107 | 0 | 0 |
| Campania | 0.896 | 0.009 | 0.599 | 0 | 1 | 0 | 0 | 0 | 0 | 0 | 0 | 0.009 | 0 | 0.082 | 0 | 0.639 | 0.431 | 0.597 | 0.195 | 0.239 | 0 |
| Emilia | 0 | 0.001 | 0 | 0 | 0 | 1 | 0 | 0 | 0 | 0 | 0 | 0.001 | 0 | 0 | 0 | 0 | 0 | 0 | 0 | 0 | 0.111 |
| Friuli | 0 | 0.001 | 0 | 0 | 0 | 0 | 1 | 0.607 | 0.14 | 0 | 0 | 0.001 | 0 | 0.519 | 0 | 0 | 0.092 | 0 | 0 | 0.402 | 0.056 |
| Lazio | 0 | 0.001 | 0 | 0 | 0 | 0 | 0.607 | 1 | 0.2 | 0 | 0 | 0.001 | 0 | 0.08 | 0 | 0 | 0 | 0 | 0 | 0.177 | 0 |
| Liguria | 0 | 0.001 | 0 | 0 | 0 | 0 | 0.14 | 0.2 | 1 | 0 | 0 | 0.001 | 0.055 | 0 | 0 | 0 | 0 | 0 | 0 | 0.082 | 0 |
| Lombardi | 0 | 0.001 | 0 | 0 | 0 | 0 | 0 | 0 | 0 | 1 | 0 | 0.001 | 0 | 0 | 0 | 0 | 0 | 0 | 0 | 0 | 0.056 |
| Marche | 0 | 0.001 | 0 | 0 | 0 | 0 | 0 | 0 | 0 | 0 | 1 | 0.001 | 0.902 | 0 | 0 | 0 | 0 | 0 | 0 | 0 | 0.056 |
| Molise | 0 | 0 | 0 | 0.317 | 0 | 0 | 0 | 0 | 0 | 0 | 0 | 0 | 0 | 0 | 0.317 | 0 | 0 | 0 | 0 | 0 | 0 |
| Piemonte | 0 | 0.001 | 0 | 0 | 0 | 0 | 0 | 0 | 0.055 | 0 | 0.902 | 0.001 | 1 | 0 | 0 | 0 | 0 | 0 | 0 | 0 | 0.056 |
| Puglia | 0 | 0.001 | 0 | 0 | 0.082 | 0 | 0.519 | 0.08 | 0 | 0 | 0 | 0.001 | 0 | 1 | 0 | 0 | 0.357 | 0 | 0 | 0.175 | 0 |
| Sardegna | 0 | 0.317 | 0.101 | 0.917 | 0 | 0 | 0 | 0 | 0 | 0 | 0 | 0.317 | 0 | 0 | 1 | 0.107 | 0 | 0.116 | 0.199 | 0 | 0 |
| Sicilia | 0.489 | 0.023 | 0.785 | 0.059 | 0.639 | 0 | 0 | 0 | 0 | 0 | 0 | 0.023 | 0 | 0 | 0.107 | 1 | 0.103 | 1 | 0.276 | 0.149 | 0 |
| Toscana | 0.212 | 0.001 | 0.09 | 0 | 0.431 | 0 | 0.092 | 0 | 0 | 0 | 0 | 0.001 | 0 | 0.357 | 0 | 0.103 | 1 | 0.134 | 0 | 0.844 | 0 |
| Trento | 0.507 | 0.025 | 0.947 | 0.073 | 0.597 | 0 | 0 | 0 | 0 | 0 | 0 | 0.025 | 0 | 0 | 0.116 | 1 | 0.134 | 1 | 0.413 | 0.129 | 0 |
| Umbria | 0 | 0.023 | 0.414 | 0.107 | 0.195 | 0 | 0 | 0 | 0 | 0 | 0 | 0.023 | 0 | 0 | 0.199 | 0.276 | 0 | 0.413 | 1 | 0 | 0 |
| ValleAosta | 0.346 | 0.001 | 0.192 | 0 | 0.239 | 0 | 0.402 | 0.177 | 0.082 | 0 | 0 | 0.001 | 0 | 0.175 | 0 | 0.149 | 0.844 | 0.129 | 0 | 1 | 0 |
| Veneto | 0 | 0.005 | 0 | 0 | 0 | 0.111 | 0.056 | 0 | 0 | 0.056 | 0.056 | 0.005 | 0.056 | 0 | 0 | 0 | 0 | 0 | 0 | 0 | 1 |
| Abruzzo | Basilicata | Bolzano | Calabria | Campania | Emilia | Friuli | Lazio | Liguria | Lombardi | Marche | Molise | Piemonte | Puglia | Sardegna | Sicilia | Toscana | Trento | Umbria | ValleAosta | Veneto | |
|---|---|---|---|---|---|---|---|---|---|---|---|---|---|---|---|---|---|---|---|---|---|
| Abruzzo | 1 | 0 | 0.749 | 0 | 0.519 | 0 | 0 | 0 | 0 | 0 | 0.179 | 0 | 0 | 0.097 | 0 | 0 | 0 | 0.7 | 0.158 | 0 | 0 |
| Basilicata | 0 | 0 | 0 | 0 | 0 | 0 | 0 | 0 | 0 | 0 | 0 | 0 | 0 | 0 | 0 | 0 | 0 | 0 | 0 | 0 | 0 |
| Bolzano | 0.749 | 0 | 1 | 0 | 0.516 | 0 | 0 | 0 | 0 | 0 | 0.179 | 0 | 0 | 0 | 0 | 0 | 0 | 0.798 | 0.109 | 0 | 0 |
| Calabria | 0 | 0 | 0 | 1 | 0 | 0 | 0 | 0 | 0 | 0 | 0.177 | 0.947 | 0 | 0 | 0.895 | 0.364 | 0 | 0 | 0.195 | 0.302 | 0.302 |
| Campania | 0.519 | 0 | 0.516 | 0 | 1 | 0 | 0 | 0 | 0 | 0 | 0.177 | 0 | 0 | 0.072 | 0 | 0 | 0 | 0.479 | 0 | 0 | 0 |
| Emilia | 0 | 0 | 0 | 0 | 0 | 1 | 0 | 0 | 0 | 0 | 0 | 0 | 0 | 0 | 0 | 0 | 0 | 0 | 0 | 0 | 0 |
| Friuli | 0 | 0 | 0 | 0 | 0 | 0 | 1 | 0.609 | 0 | 0 | 0.179 | 0 | 0 | 0 | 0 | 0 | 0.898 | 0 | 0 | 0 | 0 |
| Lazio | 0 | 0 | 0 | 0 | 0 | 0 | 0.609 | 1 | 0 | 0 | 0.2 | 0 | 0 | 0 | 0 | 0 | 0.898 | 0 | 0 | 0 | 0 |
| Liguria | 0 | 0 | 0 | 0 | 0 | 0 | 0 | 0 | 1 | 0 | 0.179 | 0 | 0 | 0 | 0 | 0 | 0 | 0 | 0 | 0 | 0 |
| Lombardi | 0 | 0 | 0 | 0 | 0 | 0 | 0 | 0 | 0 | 1 | 0 | 0 | 0 | 0 | 0 | 0 | 0 | 0 | 0 | 0 | 0 |
| Marche | 0.179 | 0 | 0.179 | 0.177 | 0.177 | 0 | 0.179 | 0.2 | 0.179 | 0 | 1 | 0.177 | 0 | 0.179 | 0.17 | 0.178 | 0.482 | 0.179 | 0.178 | 0.177 | 0.177 |
| Molise | 0 | 0 | 0 | 0.947 | 0 | 0 | 0 | 0 | 0 | 0 | 0.177 | 1 | 0 | 0 | 0.687 | 0.367 | 0 | 0 | 0.151 | 0.242 | 0.242 |
| Piemonte | 0 | 0 | 0 | 0 | 0 | 0 | 0 | 0 | 0 | 0 | 0 | 0 | 1 | 0 | 0 | 0 | 0 | 0 | 0 | 0 | 0 |
| Puglia | 0.097 | 0 | 0 | 0 | 0.072 | 0 | 0 | 0 | 0 | 0 | 0.179 | 0 | 0 | 1 | 0 | 0 | 0.383 | 0.11 | 0 | 0 | 0 |
| Sardegna | 0 | 0 | 0 | 0.895 | 0 | 0 | 0 | 0 | 0 | 0 | 0.17 | 0.687 | 0 | 0 | 1 | 0.108 | 0 | 0 | 0.274 | 0.258 | 0.258 |
| Sicilia | 0 | 0 | 0 | 0.364 | 0 | 0 | 0 | 0 | 0 | 0 | 0.178 | 0.367 | 0 | 0 | 0.108 | 1 | 0 | 0 | 0.652 | 0.845 | 0.845 |
| Toscana | 0 | 0 | 0 | 0 | 0 | 0 | 0.898 | 0.898 | 0 | 0 | 0.482 | 0 | 0 | 0.383 | 0 | 0 | 1 | 0 | 0 | 0 | 0 |
| Trento | 0.7 | 0 | 0.798 | 0 | 0.479 | 0 | 0 | 0 | 0 | 0 | 0.179 | 0 | 0 | 0.11 | 0 | 0 | 0 | 1 | 0.222 | 0 | 0 |
| Umbria | 0.158 | 0 | 0.109 | 0.195 | 0 | 0 | 0 | 0 | 0 | 0 | 0.178 | 0.151 | 0 | 0 | 0.274 | 0.652 | 0 | 0.222 | 1 | 0.694 | 0.694 |
| ValleAosta | 0 | 0 | 0 | 0.302 | 0 | 0 | 0 | 0 | 0 | 0 | 0.177 | 0.242 | 0 | 0 | 0.258 | 0.845 | 0 | 0 | 0.694 | 1 | 1 |
| Veneto | 0 | 0 | 0 | 0 | 0 | 0 | 0 | 0 | 0 | 0 | 0.177 | 0.242 | 0 | 0 | 0.258 | 0.845 | 0 | 0 | 0.694 | 1 | 1 |
| Abruzzo | Basilicata | Bolzano | Calabria | Campania | Emilia | Friuli | Lazio | Liguria | Lombardi | Marche | Molise | Piemonte | Puglia | Sardegna | Sicilia | Toscana | Trento | Umbria | ValleAosta | Veneto | |
|---|---|---|---|---|---|---|---|---|---|---|---|---|---|---|---|---|---|---|---|---|---|
| Abruzzo | 1 | 0 | 0.2 | 0 | 0.128 | 0 | 0.159 | 0 | 0 | 0 | 0 | 0 | 0 | 0.902 | 0 | 0 | 0 | 0.165 | 0 | 0 | 0 |
| Basilicata | 0 | 1 | 0 | 0 | 0 | 0 | 0 | 0 | 0 | 0 | 0 | 0 | 0 | 0 | 0 | 0 | 0 | 0 | 0 | 0 | 0 |
| Bolzano | 0.2 | 0 | 1 | 0 | 0 | 0 | 0 | 0 | 0 | 0 | 0 | 0 | 0 | 0.159 | 0 | 0.179 | 0 | 0 | 0 | 0 | 0 |
| Calabria | 0 | 0 | 0 | 1 | 0 | 0 | 0 | 0 | 0 | 0 | 0 | 0 | 0 | 0 | 0.158 | 0 | 0 | 0 | 0.073 | 0 | 0 |
| Campania | 0.128 | 0 | 0 | 0 | 1 | 0 | 0.443 | 0.209 | 0 | 0 | 0 | 0 | 0 | 0.073 | 0 | 0 | 0 | 0.749 | 0 | 0 | 0 |
| Emilia | 0 | 0 | 0 | 0 | 0 | 1 | 0 | 0 | 0 | 0 | 0 | 0 | 0 | 0 | 0 | 0 | 0 | 0 | 0 | 0 | 0 |
| Friuli | 0.159 | 0 | 0 | 0 | 0.443 | 0 | 1 | 0.053 | 0 | 0 | 0 | 0 | 0 | 0.128 | 0 | 0 | 0 | 0.456 | 0 | 0 | 0 |
| Lazio | 0 | 0 | 0 | 0 | 0.209 | 0 | 0.053 | 1 | 0 | 0 | 0 | 0 | 0 | 0 | 0 | 0 | 0 | 0.383 | 0 | 0 | 0 |
| Liguria | 0 | 0 | 0 | 0 | 0 | 0 | 0 | 0 | 1 | 0 | 0.701 | 0 | 0 | 0 | 0 | 0 | 0 | 0 | 0 | 0 | 1 |
| Lombardi | 0 | 0 | 0 | 0 | 0 | 0 | 0 | 0 | 0 | 1 | 0 | 0 | 0 | 0 | 0 | 0 | 0 | 0 | 0 | 0 | 0 |
| Marche | 0 | 0 | 0 | 0 | 0 | 0 | 0 | 0 | 0.701 | 0 | 1 | 0 | 0 | 0 | 0 | 0 | 0 | 0 | 0 | 0 | 0.701 |
| Molise | 0 | 0 | 0 | 0 | 0 | 0 | 0 | 0 | 0 | 0 | 0 | 1 | 0 | 0 | 0 | 0 | 0 | 0 | 0 | 0 | 0 |
| Piemonte | 0 | 0 | 0 | 0 | 0 | 0 | 0 | 0 | 0 | 0 | 0 | 0 | 1 | 0 | 0 | 0 | 0 | 0 | 0 | 0 | 0 |
| Puglia | 0.902 | 0 | 0.159 | 0 | 0.073 | 0 | 0.128 | 0 | 0 | 0 | 0 | 0 | 0 | 1 | 0 | 0 | 0 | 0.096 | 0 | 0 | 0 |
| Sardegna | 0 | 0 | 0 | 0.158 | 0 | 0 | 0 | 0 | 0 | 0 | 0 | 0 | 0 | 0 | 1 | 0.097 | 0 | 0 | 0.368 | 0.096 | 0 |
| Sicilia | 0 | 0 | 0.179 | 0 | 0 | 0 | 0 | 0 | 0 | 0 | 0 | 0 | 0 | 0 | 0.097 | 1 | 0 | 0 | 0.124 | 0.62 | 0 |
| Toscana | 0 | 0 | 0 | 0 | 0 | 0 | 0 | 0 | 0 | 0 | 0 | 0 | 0 | 0 | 0 | 0 | 1 | 0 | 0 | 0 | 0 |
| Trento | 0.165 | 0 | 0 | 0 | 0.749 | 0 | 0.456 | 0.383 | 0 | 0 | 0 | 0 | 0 | 0.096 | 0 | 0 | 0 | 1 | 0 | 0 | 0 |
| Umbria | 0 | 0 | 0 | 0.073 | 0 | 0 | 0 | 0 | 0 | 0 | 0 | 0 | 0 | 0 | 0.368 | 0.124 | 0 | 0 | 1 | 0.248 | 0 |
| ValleAosta | 0 | 0 | 0 | 0 | 0 | 0 | 0 | 0 | 0 | 0 | 0 | 0 | 0 | 0 | 0.096 | 0.62 | 0 | 0 | 0.248 | 1 | 0 |
| Veneto | 0 | 0 | 0 | 0 | 0 | 0 | 0 | 0 | 1 | 0 | 0.701 | 0 | 0 | 0 | 0 | 0 | 0 | 0 | 0 | 0 | 1 |
| Abruzzo | Basilicata | Bolzano | Calabria | Campania | Emilia | Friuli | Lazio | Liguria | Lombardi | Marche | Molise | Piemonte | Puglia | Sardegna | Sicilia | Toscana | Trento | Umbria | ValleAosta | Veneto | |
|---|---|---|---|---|---|---|---|---|---|---|---|---|---|---|---|---|---|---|---|---|---|
| Abruzzo | 1 | 0 | 0.861 | 0.166 | 0.101 | 0 | 0.294 | 0.07 | 0 | 0 | 0 | 0 | 0 | 0.573 | 0.203 | 0.46 | 0 | 0.995 | 0.989 | 0.323 | 0 |
| Basilicata | 0 | 1 | 0 | 0.081 | 0 | 0 | 0 | 0 | 0 | 0 | 0 | 0.398 | 0 | 0 | 0.103 | 0 | 0 | 0 | 0 | 0 | 0 |
| Bolzano | 0.861 | 0 | 1 | 0.228 | 0.125 | 0 | 0.385 | 0 | 0 | 0 | 0 | 0 | 0 | 0.455 | 0.23 | 0.357 | 0 | 0.979 | 0.973 | 0.536 | 0 |
| Calabria | 0.166 | 0.081 | 0.228 | 1 | 0 | 0 | 0 | 0 | 0 | 0 | 0 | 0.23 | 0 | 0.064 | 0.871 | 0 | 0 | 0.265 | 0.186 | 0 | 0 |
| Campania | 0.101 | 0 | 0.125 | 0 | 1 | 0 | 0.614 | 0.747 | 0.386 | 0 | 0 | 0 | 0 | 0.33 | 0 | 0.347 | 0.227 | 0.231 | 0.106 | 0.528 | 0 |
| Emilia | 0 | 0 | 0 | 0 | 0 | 1 | 0 | 0 | 0 | 0.432 | 0.244 | 0 | 0 | 0 | 0 | 0 | 0 | 0 | 0 | 0 | 0.095 |
| Friuli | 0.294 | 0 | 0.385 | 0 | 0.614 | 0 | 1 | 0.394 | 0.173 | 0 | 0 | 0 | 0 | 0.667 | 0 | 0.653 | 0.104 | 0.492 | 0.304 | 0.851 | 0 |
| Lazio | 0.07 | 0 | 0 | 0 | 0.747 | 0 | 0.394 | 1 | 0.591 | 0 | 0 | 0 | 0.075 | 0.188 | 0 | 0.268 | 0.375 | 0.113 | 0.064 | 0.365 | 0 |
| Liguria | 0 | 0 | 0 | 0 | 0.386 | 0 | 0.173 | 0.591 | 1 | 0 | 0 | 0 | 0.138 | 0.073 | 0 | 0.074 | 0.717 | 0 | 0 | 0.188 | 0 |
| Lombardi | 0 | 0 | 0 | 0 | 0 | 0.432 | 0 | 0 | 0 | 1 | 0.189 | 0 | 0 | 0 | 0 | 0 | 0 | 0 | 0 | 0 | 0.728 |
| Marche | 0 | 0 | 0 | 0 | 0 | 0.244 | 0 | 0 | 0 | 0.189 | 1 | 0 | 0.208 | 0 | 0 | 0 | 0 | 0 | 0 | 0 | 0 |
| Molise | 0 | 0.398 | 0 | 0.23 | 0 | 0 | 0 | 0 | 0 | 0 | 0 | 1 | 0 | 0 | 0.189 | 0 | 0 | 0.053 | 0 | 0 | 0 |
| Piemonte | 0 | 0 | 0 | 0 | 0 | 0 | 0 | 0.075 | 0.138 | 0 | 0.208 | 0 | 1 | 0 | 0 | 0 | 0.262 | 0 | 0 | 0 | 0 |
| Puglia | 0.573 | 0 | 0.455 | 0.064 | 0.33 | 0 | 0.667 | 0.188 | 0.073 | 0 | 0 | 0 | 0 | 1 | 0.078 | 0.84 | 0 | 0.693 | 0.527 | 0.722 | 0 |
| Sardegna | 0.203 | 0.103 | 0.23 | 0.871 | 0 | 0 | 0 | 0 | 0 | 0 | 0 | 0.189 | 0 | 0.078 | 1 | 0.054 | 0 | 0.247 | 0.235 | 0 | 0 |
| Sicilia | 0.46 | 0 | 0.357 | 0 | 0.347 | 0 | 0.653 | 0.268 | 0.074 | 0 | 0 | 0 | 0 | 0.84 | 0.054 | 1 | 0.055 | 0.627 | 0.492 | 0.653 | 0 |
| Toscana | 0 | 0 | 0 | 0 | 0.227 | 0 | 0.104 | 0.375 | 0.717 | 0 | 0 | 0 | 0.262 | 0 | 0 | 0.055 | 1 | 0 | 0 | 0.082 | 0 |
| Trento | 0.995 | 0 | 0.979 | 0.265 | 0.231 | 0 | 0.492 | 0.113 | 0 | 0 | 0 | 0.053 | 0 | 0.693 | 0.247 | 0.627 | 0 | 1 | 0.909 | 0.612 | 0 |
| Umbria | 0.989 | 0 | 0.973 | 0.186 | 0.106 | 0 | 0.304 | 0.064 | 0 | 0 | 0 | 0 | 0 | 0.527 | 0.235 | 0.492 | 0 | 0.909 | 1 | 0.305 | 0 |
| ValleAosta | 0.323 | 0 | 0.536 | 0 | 0.528 | 0 | 0.851 | 0.365 | 0.188 | 0 | 0 | 0 | 0 | 0.722 | 0 | 0.653 | 0.082 | 0.612 | 0.305 | 1 | 0 |
| Veneto | 0 | 0 | 0 | 0 | 0 | 0.095 | 0 | 0 | 0 | 0.728 | 0 | 0 | 0 | 0 | 0 | 0 | 0 | 0 | 0 | 0 | 1 |
| Abruzzo | Basilicata | Bolzano | Calabria | Campania | Emilia | Friuli | Lazio | Liguria | Lombardi | Marche | Molise | Piemonte | Puglia | Sardegna | Sicilia | Toscana | Trento | Umbria | ValleAosta | Veneto | |
|---|---|---|---|---|---|---|---|---|---|---|---|---|---|---|---|---|---|---|---|---|---|
| Abruzzo | 1 | 0 | 0.89 | 0.36 | 0.42 | 0 | 0.2 | 0 | 0 | 0 | 0 | 0 | 0 | 0.79 | 0 | 0.07 | 0.06 | 0 | 0.39 | 0.67 | 0 |
| Basilicata | 0 | 0 | 0 | 0.06 | 0 | 0 | 0.32 | 0 | 0 | 0 | 0 | 0 | 0 | 0 | 0 | 0 | 0 | 0 | 0.14 | 0.14 | 0 |
| Bolzano | 0.89 | 0 | 1 | 0.11 | 0.5 | 0 | 0 | 0 | 0 | 0 | 0 | 0 | 0 | 0.78 | 0 | 0 | 0 | 0 | 0.27 | 0.27 | 0 |
| Calabria | 0.36 | 0.06 | 0.11 | 1 | 0.19 | 0 | 0.38 | 0 | 0 | 0 | 0 | 0.06 | 0 | 0.27 | 0.06 | 0 | 0 | 0.06 | 0.94 | 0.94 | 0 |
| Campania | 0.42 | 0.03 | 0.5 | 0.19 | 1 | 0 | 0.12 | 0.69 | 0.09 | 0 | 0 | 0.03 | 0.44 | 0.38 | 0.03 | 0.74 | 0.85 | 0.03 | 0.12 | 0.32 | 0 |
| Emilia | 0 | 0 | 0 | 0 | 0 | 1 | 0 | 0 | 0 | 0 | 0.07 | 0 | 0 | 0 | 0 | 0 | 0 | 0 | 0 | 0 | 0 |
| Friuli | 0.2 | 0.32 | 0 | 0.38 | 0.12 | 0 | 1 | 0 | 0 | 0 | 0 | 0.32 | 0 | 0.2 | 0.32 | 0 | 0 | 0.32 | 0.66 | 0.42 | 0 |
| Lazio | 0 | 0 | 0 | 0 | 0.69 | 0 | 0 | 1 | 0.17 | 0 | 0 | 0 | 0.57 | 0 | 0 | 0.73 | 0.65 | 0 | 0 | 0.16 | 0 |
| Liguria | 0 | 0 | 0 | 0 | 0.09 | 0 | 0 | 0.17 | 1 | 0 | 0.22 | 0 | 0.56 | 0 | 0 | 0.12 | 0.18 | 0 | 0 | 0 | 0 |
| Lombardi | 0 | 0 | 0 | 0 | 0 | 0 | 0 | 0 | 0 | 1 | 0 | 0 | 0 | 0 | 0 | 0 | 0 | 0 | 0 | 0 | 0 |
| Marche | 0 | 0 | 0 | 0 | 0 | 0.07 | 0 | 0 | 0.22 | 0 | 1 | 0 | 0 | 0 | 0 | 0 | 0 | 0 | 0 | 0 | 0 |
| Molise | 0 | 0 | 0 | 0.06 | 0 | 0 | 0.32 | 0 | 0 | 0 | 0 | 0 | 0 | 0 | 0 | 0 | 0 | 0 | 0.14 | 0.14 | 0 |
| Piemonte | 0 | 0 | 0 | 0 | 0.44 | 0 | 0 | 0.57 | 0.56 | 0 | 0 | 0 | 1 | 0 | 0 | 0.65 | 0.3 | 0 | 0 | 0 | 0 |
| Puglia | 0.79 | 0.02 | 0.78 | 0.27 | 0.38 | 0 | 0.2 | 0 | 0 | 0 | 0 | 0.02 | 0 | 1 | 0.02 | 0 | 0.19 | 0.02 | 0.2 | 0.67 | 0 |
| Sardegna | 0 | 0 | 0 | 0.06 | 0 | 0 | 0.32 | 0 | 0 | 0 | 0 | 0 | 0 | 0 | 0 | 0 | 0 | 0 | 0.14 | 0.14 | 0 |
| Sicilia | 0.07 | 0 | 0 | 0 | 0.74 | 0 | 0 | 0.73 | 0.12 | 0 | 0 | 0 | 0.65 | 0 | 0 | 1 | 0.9 | 0 | 0 | 0.2 | 0 |
| Toscana | 0.06 | 0 | 0 | 0 | 0.85 | 0 | 0 | 0.65 | 0.18 | 0 | 0 | 0 | 0.3 | 0.19 | 0 | 0.9 | 1 | 0 | 0 | 0.08 | 0 |
| Trento | 0 | 0 | 0 | 0.06 | 0 | 0 | 0.32 | 0 | 0 | 0 | 0 | 0 | 0 | 0 | 0 | 0 | 0 | 0 | 0.14 | 0.14 | 0 |
| Umbria | 0.39 | 0.14 | 0.27 | 0.94 | 0.12 | 0 | 0.66 | 0 | 0 | 0 | 0 | 0.14 | 0 | 0.2 | 0.14 | 0 | 0 | 0.14 | 1 | 0.75 | 0 |
| ValleAosta | 0.67 | 0.14 | 0.27 | 0.94 | 0.32 | 0 | 0.42 | 0.16 | 0 | 0 | 0 | 0.14 | 0 | 0.67 | 0.14 | 0.2 | 0.08 | 0.14 | 0.75 | 1 | 0 |
| Veneto | 0 | 0 | 0 | 0 | 0 | 0 | 0 | 0 | 0 | 0 | 0 | 0 | 0 | 0 | 0 | 0 | 0 | 0 | 0 | 0 | 1 |
| Abruzzo | Basilicata | Bolzano | Calabria | Campania | Emilia | Friuli | Lazio | Liguria | Lombardi | Marche | Molise | Piemonte | Puglia | Sardegna | Sicilia | Toscana | Trento | Umbria | ValleAosta | Veneto | |
|---|---|---|---|---|---|---|---|---|---|---|---|---|---|---|---|---|---|---|---|---|---|
| Abruzzo | 1 | 0 | 0 | 0 | 0 | 0 | 0 | 0 | 0 | 0 | 0 | 0.61 | 0 | 0.31 | 0 | 0 | 0 | 0.65 | 0.05 | 0 | 0 |
| Basilicata | 0 | 1 | 0.41 | 0.35 | 0 | 0 | 0 | 0 | 0 | 0 | 0 | 0.07 | 0 | 0 | 0.33 | 0 | 0 | 0 | 0 | 0 | 0 |
| Bolzano | 0 | 0.41 | 1 | 0.95 | 0 | 0 | 0 | 0 | 0 | 0 | 0 | 0.22 | 0 | 0 | 0.74 | 0 | 0 | 0.15 | 0 | 0 | 0 |
| Calabria | 0 | 0.35 | 0.95 | 1 | 0 | 0 | 0 | 0 | 0 | 0 | 0 | 0.18 | 0 | 0 | 0.7 | 0 | 0 | 0.08 | 0 | 0 | 0 |
| Campania | 0 | 0 | 0 | 0 | 1 | 0 | 0.11 | 0.61 | 0.38 | 0 | 0 | 0 | 0 | 0 | 0 | 0.06 | 0.52 | 0 | 0 | 0.31 | 0 |
| Emilia | 0 | 0 | 0 | 0 | 0 | 1 | 0 | 0 | 0 | 0 | 0 | 0 | 0 | 0 | 0 | 0 | 0 | 0 | 0 | 0 | 0 |
| Friuli | 0 | 0 | 0 | 0 | 0.11 | 0 | 1 | 0.38 | 0.26 | 0 | 0 | 0 | 0 | 0.16 | 0 | 0.56 | 0.1 | 0 | 0.22 | 0.06 | 0 |
| Lazio | 0 | 0 | 0 | 0 | 0.61 | 0 | 0.38 | 1 | 0.71 | 0 | 0 | 0 | 0 | 0.06 | 0 | 0.18 | 0.46 | 0 | 0.08 | 0.21 | 0 |
| Liguria | 0 | 0 | 0 | 0 | 0.38 | 0 | 0.26 | 0.71 | 1 | 0 | 0 | 0 | 0 | 0 | 0 | 0.12 | 0.38 | 0 | 0 | 0.16 | 0 |
| Lombardi | 0 | 0 | 0 | 0 | 0 | 0 | 0 | 0 | 0 | 1 | 0 | 0 | 0 | 0 | 0 | 0 | 0 | 0 | 0 | 0 | 0 |
| Marche | 0 | 0 | 0 | 0 | 0 | 0 | 0 | 0 | 0 | 0 | 1 | 0 | 0.38 | 0 | 0 | 0 | 0 | 0 | 0 | 0.46 | 0 |
| Molise | 0.61 | 0.07 | 0.22 | 0.18 | 0 | 0 | 0 | 0 | 0 | 0 | 0 | 1 | 0 | 0.11 | 0.16 | 0 | 0 | 0.75 | 0 | 0 | 0 |
| Piemonte | 0 | 0 | 0 | 0 | 0 | 0 | 0 | 0 | 0 | 0 | 0.38 | 0 | 1 | 0 | 0 | 0 | 0.16 | 0 | 0 | 0.71 | 0 |
| Puglia | 0.31 | 0 | 0 | 0 | 0 | 0 | 0.16 | 0.06 | 0 | 0 | 0 | 0.11 | 0 | 1 | 0 | 0.34 | 0 | 0.22 | 0.7 | 0 | 0 |
| Sardegna | 0 | 0.33 | 0.74 | 0.7 | 0 | 0 | 0 | 0 | 0 | 0 | 0 | 0.16 | 0 | 0 | 1 | 0 | 0 | 0.16 | 0 | 0 | 0 |
| Sicilia | 0 | 0 | 0 | 0 | 0.06 | 0 | 0.56 | 0.18 | 0.12 | 0 | 0 | 0 | 0 | 0.34 | 0 | 1 | 0 | 0 | 0.8 | 0 | 0 |
| Toscana | 0 | 0 | 0 | 0 | 0.52 | 0 | 0.1 | 0.46 | 0.38 | 0 | 0 | 0 | 0.16 | 0 | 0 | 0 | 1 | 0 | 0 | 0.46 | 0 |
| Trento | 0.65 | 0 | 0.15 | 0.08 | 0 | 0 | 0 | 0 | 0 | 0 | 0 | 0.75 | 0 | 0.22 | 0.16 | 0 | 0 | 1 | 0.06 | 0 | 0 |
| Umbria | 0.05 | 0 | 0 | 0 | 0 | 0 | 0.22 | 0.08 | 0 | 0 | 0 | 0 | 0 | 0.7 | 0 | 0.8 | 0 | 0.06 | 1 | 0 | 0 |
| ValleAosta | 0 | 0 | 0 | 0 | 0.31 | 0 | 0.06 | 0.21 | 0.16 | 0 | 0.46 | 0 | 0.71 | 0 | 0 | 0 | 0.46 | 0 | 0 | 1 | 0 |
| Veneto | 0 | 0 | 0 | 0 | 0 | 0 | 0 | 0 | 0 | 0 | 0 | 0 | 0 | 0 | 0 | 0 | 0 | 0 | 0 | 0 | 1 |
| Abruzzo | Basilicata | Bolzano | Calabria | Campania | Emilia | Friuli | Lazio | Liguria | Lombardi | Marche | Molise | Piemonte | Puglia | Sardegna | Sicilia | Toscana | Trento | Umbria | ValleAosta | Veneto | |
|---|---|---|---|---|---|---|---|---|---|---|---|---|---|---|---|---|---|---|---|---|---|
| Abruzzo | 1 | 0 | 0.48 | 0 | 0 | 0 | 0 | 0 | 0 | 0 | 0 | 0 | 0 | 0.224 | 0.141 | 0.179 | 0 | 0.277 | 0.565 | 0.277 | 0 |
| Basilicata | 0 | 1 | 0 | 0 | 0 | 0 | 0 | 0 | 0 | 0 | 0 | 0 | 0 | 0 | 0 | 0 | 0 | 0 | 0 | 0 | 0 |
| Bolzano | 0.48 | 0 | 1 | 0.055 | 0 | 0 | 0.097 | 0.073 | 0 | 0 | 0 | 0 | 0 | 0.701 | 0.128 | 0.805 | 0 | 0.62 | 0.805 | 0.71 | 0.056 |
| Calabria | 0 | 0 | 0.055 | 1 | 0 | 0 | 0 | 0 | 0 | 0 | 0 | 0.177 | 0 | 0 | 0.371 | 0 | 0 | 0 | 0 | 0 | 0.056 |
| Campania | 0 | 0 | 0 | 0 | 1 | 0 | 0.805 | 0.902 | 0.318 | 0 | 0 | 0 | 0 | 0.073 | 0 | 0.053 | 0 | 0.209 | 0 | 0.318 | 0.056 |
| Emilia | 0 | 0 | 0 | 0 | 0 | 1 | 0 | 0 | 0 | 0 | 0 | 0 | 0 | 0 | 0 | 0 | 0 | 0 | 0 | 0 | 0.056 |
| Friuli | 0 | 0 | 0.097 | 0 | 0.805 | 0 | 1 | 0.609 | 0.318 | 0 | 0 | 0 | 0 | 0.097 | 0 | 0.097 | 0 | 0.259 | 0 | 0.456 | 0.056 |
| Lazio | 0 | 0 | 0.073 | 0 | 0.902 | 0 | 0.609 | 1 | 0.62 | 0 | 0 | 0 | 0 | 0.073 | 0 | 0.053 | 0.053 | 0.209 | 0 | 0.318 | 0.056 |
| Liguria | 0 | 0 | 0 | 0 | 0.318 | 0 | 0.318 | 0.62 | 1 | 0 | 0 | 0 | 0 | 0 | 0 | 0 | 0.209 | 0.073 | 0 | 0.165 | 0.056 |
| Lombardi | 0 | 0 | 0 | 0 | 0 | 0 | 0 | 0 | 0 | 1 | 0 | 0 | 0 | 0 | 0 | 0 | 0 | 0 | 0 | 0 | 0.5 |
| Marche | 0 | 0 | 0 | 0 | 0 | 0 | 0 | 0 | 0 | 0 | 1 | 0 | 0.62 | 0 | 0 | 0 | 0 | 0 | 0 | 0 | 0.056 |
| Molise | 0 | 0 | 0 | 0.177 | 0 | 0 | 0 | 0 | 0 | 0 | 0 | 1 | 0 | 0 | 0 | 0 | 0 | 0 | 0 | 0 | 0 |
| Piemonte | 0 | 0 | 0 | 0 | 0 | 0 | 0 | 0 | 0 | 0 | 0.62 | 0 | 1 | 0 | 0 | 0 | 0.097 | 0 | 0 | 0 | 0.056 |
| Puglia | 0.224 | 0 | 0.701 | 0 | 0.073 | 0 | 0.097 | 0.073 | 0 | 0 | 0 | 0 | 0 | 1 | 0 | 0.902 | 0 | 0.898 | 0.456 | 1 | 0.056 |
| Sardegna | 0.141 | 0 | 0.128 | 0.371 | 0 | 0 | 0 | 0 | 0 | 0 | 0 | 0 | 0 | 0 | 1 | 0 | 0 | 0 | 0 | 0 | 0.056 |
| Sicilia | 0.179 | 0 | 0.805 | 0 | 0.053 | 0 | 0.097 | 0.053 | 0 | 0 | 0 | 0 | 0 | 0.902 | 0 | 1 | 0 | 1 | 0.456 | 1 | 0.056 |
| Toscana | 0 | 0 | 0 | 0 | 0 | 0 | 0 | 0.053 | 0.209 | 0 | 0 | 0 | 0.097 | 0 | 0 | 0 | 1 | 0 | 0 | 0 | 0.056 |
| Trento | 0.277 | 0 | 0.62 | 0 | 0.209 | 0 | 0.259 | 0.209 | 0.073 | 0 | 0 | 0 | 0 | 0.898 | 0 | 1 | 0 | 1 | 0.443 | 0.898 | 0.056 |
| Umbria | 0.565 | 0 | 0.805 | 0 | 0 | 0 | 0 | 0 | 0 | 0 | 0 | 0 | 0 | 0.456 | 0 | 0.456 | 0 | 0.443 | 1 | 0.62 | 0.056 |
| ValleAosta | 0.277 | 0 | 0.71 | 0 | 0.318 | 0 | 0.456 | 0.318 | 0.165 | 0 | 0 | 0 | 0 | 1 | 0 | 1 | 0 | 0.898 | 0.62 | 1 | 0.056 |
| Veneto | 0 | 0 | 0.056 | 0.056 | 0.056 | 0.056 | 0.056 | 0.056 | 0.056 | 0.5 | 0.056 | 0 | 0.056 | 0.056 | 0.056 | 0.056 | 0.056 | 0.056 | 0.056 | 0.056 | 1 |
| Abruzzo | Basilicata | Bolzano | Calabria | Campania | Emilia | Friuli | Lazio | Liguria | Lombardi | Marche | Molise | Piemonte | Puglia | Sardegna | Sicilia | Toscana | Trento | Umbria | ValleAosta | Veneto | |
|---|---|---|---|---|---|---|---|---|---|---|---|---|---|---|---|---|---|---|---|---|---|
| Abruzzo | 1 | 0 | 0.383 | 0 | 0 | 0 | 0 | 0 | 0 | 0 | 0.209 | 0 | 0 | 0.318 | 0.073 | 1 | 0 | 0.096 | 0.902 | 0.701 | 0.701 |
| Basilicata | 0 | 1 | 0 | 0 | 0 | 0 | 0 | 0 | 0 | 0 | 0.209 | 0.898 | 0 | 0 | 0 | 0 | 0 | 0 | 0 | 0 | 0 |
| Bolzano | 0.383 | 0 | 1 | 0 | 0.084 | 0 | 0.209 | 0 | 0 | 0 | 0.209 | 0 | 0 | 0.805 | 0 | 0.318 | 0 | 0.259 | 0.535 | 0.165 | 0.165 |
| Calabria | 0 | 0 | 0 | 1 | 0 | 0 | 0 | 0 | 0 | 0 | 0.209 | 0 | 0 | 0 | 0.456 | 0 | 0 | 0 | 0 | 0 | 0 |
| Campania | 0 | 0 | 0.084 | 0 | 1 | 0 | 0.654 | 0.141 | 0 | 0 | 0.179 | 0 | 0 | 0.224 | 0 | 0 | 0 | 0.482 | 0 | 0 | 0 |
| Emilia | 0 | 0 | 0 | 0 | 0 | 1 | 0 | 0 | 0 | 0 | 0 | 0 | 0 | 0 | 0 | 0 | 0 | 0 | 0 | 0 | 0 |
| Friuli | 0 | 0 | 0.209 | 0 | 0.654 | 0 | 1 | 0.073 | 0 | 0 | 0.209 | 0 | 0 | 0.318 | 0 | 0.053 | 0 | 0.71 | 0.073 | 0 | 0 |
| Lazio | 0 | 0 | 0 | 0 | 0.141 | 0 | 0.073 | 1 | 0.259 | 0 | 0.201 | 0 | 0 | 0 | 0 | 0 | 0 | 0.055 | 0 | 0 | 0 |
| Liguria | 0 | 0 | 0 | 0 | 0 | 0 | 0 | 0.259 | 1 | 0 | 0.383 | 0 | 0 | 0 | 0 | 0 | 0.128 | 0 | 0 | 0 | 0 |
| Lombardi | 0 | 0 | 0 | 0 | 0 | 0 | 0 | 0 | 0 | 1 | 0 | 0 | 0 | 0 | 0 | 0 | 0 | 0 | 0 | 0 | 0 |
| Marche | 0.209 | 0.209 | 0.209 | 0.209 | 0.179 | 0 | 0.209 | 0.201 | 0.383 | 0 | 1 | 0.209 | 0 | 0.209 | 0.209 | 0.209 | 0.805 | 0.209 | 0.209 | 0.209 | 0.209 |
| Molise | 0 | 0.898 | 0 | 0 | 0 | 0 | 0 | 0 | 0 | 0 | 0.209 | 1 | 0 | 0 | 0 | 0 | 0 | 0 | 0 | 0 | 0 |
| Piemonte | 0 | 0 | 0 | 0 | 0 | 0 | 0 | 0 | 0 | 0 | 0 | 0 | 1 | 0 | 0 | 0 | 0 | 0 | 0 | 0 | 0 |
| Puglia | 0.318 | 0 | 0.805 | 0 | 0.224 | 0 | 0.318 | 0 | 0 | 0 | 0.209 | 0 | 0 | 1 | 0 | 0.25 | 0 | 0.535 | 0.318 | 0.128 | 0.128 |
| Sardegna | 0.073 | 0 | 0 | 0.456 | 0 | 0 | 0 | 0 | 0 | 0 | 0.209 | 0 | 0 | 0 | 1 | 0.053 | 0 | 0 | 0 | 0.128 | 0.128 |
| Sicilia | 1 | 0 | 0.318 | 0 | 0 | 0 | 0.053 | 0 | 0 | 0 | 0.209 | 0 | 0 | 0.25 | 0.053 | 1 | 0 | 0.053 | 0.902 | 0.62 | 0.62 |
| Toscana | 0 | 0 | 0 | 0 | 0 | 0 | 0 | 0 | 0.128 | 0 | 0.805 | 0 | 0 | 0 | 0 | 0 | 1 | 0 | 0 | 0 | 0 |
| Trento | 0.096 | 0 | 0.259 | 0 | 0.482 | 0 | 0.71 | 0.055 | 0 | 0 | 0.209 | 0 | 0 | 0.535 | 0 | 0.053 | 0 | 1 | 0.128 | 0 | 0 |
| Umbria | 0.902 | 0 | 0.535 | 0 | 0 | 0 | 0.073 | 0 | 0 | 0 | 0.209 | 0 | 0 | 0.318 | 0 | 0.902 | 0 | 0.128 | 1 | 0.456 | 0.456 |
| ValleAosta | 0.701 | 0 | 0.165 | 0 | 0 | 0 | 0 | 0 | 0 | 0 | 0.209 | 0 | 0 | 0.128 | 0.128 | 0.62 | 0 | 0 | 0.456 | 1 | 1 |
| Veneto | 0.701 | 0 | 0.165 | 0 | 0 | 0 | 0 | 0 | 0 | 0 | 0.209 | 0 | 0 | 0.128 | 0.128 | 0.62 | 0 | 0 | 0.456 | 1 | 1 |
| Abruzzo | Basilicata | Bolzano | Calabria | Campania | Emilia | Friuli | Lazio | Liguria | Lombardi | Marche | Molise | Piemonte | Puglia | Sardegna | Sicilia | Toscana | Trento | Umbria | ValleAosta | Veneto | |
|---|---|---|---|---|---|---|---|---|---|---|---|---|---|---|---|---|---|---|---|---|---|
| Abruzzo | 1 | 0 | 1 | 0 | 0 | 0 | 0.053 | 0 | 0 | 0 | 0 | 0 | 0 | 0.073 | 0 | 0.209 | 0 | 0 | 0.318 | 0 | 0 |
| Basilicata | 0 | 1 | 0 | 0 | 0 | 0 | 0 | 0 | 0 | 0 | 0 | 0.064 | 0 | 0 | 0 | 0 | 0 | 0 | 0 | 0 | 0 |
| Bolzano | 1 | 0 | 1 | 0 | 0 | 0 | 0 | 0 | 0 | 0 | 0 | 0 | 0 | 0 | 0 | 0.318 | 0 | 0 | 0.209 | 0 | 0 |
| Calabria | 0 | 0 | 0 | 1 | 0 | 0 | 0 | 0 | 0 | 0 | 0 | 0 | 0 | 0 | 0.201 | 0 | 0 | 0 | 0 | 0.443 | 0 |
| Campania | 0 | 0 | 0 | 0 | 1 | 0 | 0.456 | 0 | 0 | 0 | 0 | 0 | 0 | 0.383 | 0 | 0.209 | 0 | 0.902 | 0 | 0 | 0 |
| Emilia | 0 | 0 | 0 | 0 | 0 | 1 | 0 | 0 | 0 | 0 | 0 | 0 | 0 | 0 | 0 | 0 | 0 | 0 | 0 | 0 | 0 |
| Friuli | 0.053 | 0 | 0 | 0 | 0.456 | 0 | 1 | 0 | 0 | 0 | 0 | 0 | 0 | 1 | 0 | 0.62 | 0 | 0.535 | 0 | 0 | 0 |
| Lazio | 0 | 0 | 0 | 0 | 0 | 0 | 0 | 1 | 0.097 | 0 | 0 | 0 | 0 | 0 | 0 | 0 | 0 | 0 | 0 | 0 | 0 |
| Liguria | 0 | 0 | 0 | 0 | 0 | 0 | 0 | 0.097 | 1 | 0 | 0 | 0 | 0 | 0 | 0 | 0 | 0 | 0 | 0 | 0 | 0 |
| Lombardi | 0 | 0 | 0 | 0 | 0 | 0 | 0 | 0 | 0 | 1 | 0 | 0 | 0 | 0 | 0 | 0 | 0 | 0 | 0 | 0 | 0 |
| Marche | 0 | 0 | 0 | 0 | 0 | 0 | 0 | 0 | 0 | 0 | 1 | 0 | 0 | 0 | 0 | 0 | 0.62 | 0 | 0 | 0 | 0 |
| Molise | 0 | 0.064 | 0 | 0 | 0 | 0 | 0 | 0 | 0 | 0 | 0 | 1 | 0 | 0 | 0 | 0 | 0 | 0 | 0 | 0 | 0 |
| Piemonte | 0 | 0 | 0 | 0 | 0 | 0 | 0 | 0 | 0 | 0 | 0 | 0 | 1 | 0 | 0 | 0 | 0 | 0 | 0 | 0 | 0.71 |
| Puglia | 0.073 | 0 | 0 | 0 | 0.383 | 0 | 1 | 0 | 0 | 0 | 0 | 0 | 0 | 1 | 0 | 0.535 | 0 | 0.456 | 0 | 0 | 0 |
| Sardegna | 0 | 0 | 0 | 0.201 | 0 | 0 | 0 | 0 | 0 | 0 | 0 | 0 | 0 | 0 | 1 | 0 | 0 | 0 | 0 | 0.318 | 0 |
| Sicilia | 0.209 | 0 | 0.318 | 0 | 0.209 | 0 | 0.62 | 0 | 0 | 0 | 0 | 0 | 0 | 0.535 | 0 | 1 | 0 | 0.209 | 0 | 0 | 0 |
| Toscana | 0 | 0 | 0 | 0 | 0 | 0 | 0 | 0 | 0 | 0 | 0.62 | 0 | 0 | 0 | 0 | 0 | 1 | 0 | 0 | 0 | 0 |
| Trento | 0 | 0 | 0 | 0 | 0.902 | 0 | 0.535 | 0 | 0 | 0 | 0 | 0 | 0 | 0.456 | 0 | 0.209 | 0 | 1 | 0 | 0 | 0 |
| Umbria | 0.318 | 0 | 0.209 | 0 | 0 | 0 | 0 | 0 | 0 | 0 | 0 | 0 | 0 | 0 | 0 | 0 | 0 | 0 | 1 | 0 | 0 |
| ValleAosta | 0 | 0 | 0 | 0.443 | 0 | 0 | 0 | 0 | 0 | 0 | 0 | 0 | 0 | 0 | 0.318 | 0 | 0 | 0 | 0 | 1 | 0 |
| Veneto | 0 | 0 | 0 | 0 | 0 | 0 | 0 | 0 | 0 | 0 | 0 | 0 | 0.71 | 0 | 0 | 0 | 0 | 0 | 0 | 0 | 1 |
| Abruzzo | Basilicata | Bolzano | Calabria | Campania | Emilia | Friuli | Lazio | Liguria | Lombardi | Marche | Molise | Piemonte | Puglia | Sardegna | Sicilia | Toscana | Trento | Umbria | ValleAosta | Veneto | |
|---|---|---|---|---|---|---|---|---|---|---|---|---|---|---|---|---|---|---|---|---|---|
| Abruzzo | 1 | 0 | 0 | 0.18 | 0.56 | 0 | 0 | 0 | 0 | 0 | 0 | 0 | 0.65 | 0 | 0.15 | 0 | 0.44 | 0.65 | 0.48 | 0 | 0 |
| Basilicata | 0 | 1 | 0.17 | 0.13 | 0 | 0 | 0 | 0 | 0 | 0 | 0 | 0.42 | 0.33 | 0.15 | 0.09 | 0 | 0 | 0.1 | 0.1 | 0 | 0 |
| Bolzano | 0 | 0.17 | 1 | 0.12 | 0 | 0 | 0 | 0 | 0 | 0 | 0 | 0 | 0.65 | 0.2 | 0.1 | 0 | 0 | 0 | 0.06 | 0 | 0 |
| Calabria | 0.18 | 0.13 | 0.12 | 1 | 0.27 | 0 | 0 | 0 | 0 | 0 | 0 | 0 | 0.65 | 0 | 0.95 | 0 | 0.24 | 0.4 | 0.56 | 0 | 0 |
| Campania | 0.56 | 0 | 0 | 0.27 | 1 | 0 | 0.56 | 0 | 0.95 | 0 | 0 | 0 | 0.21 | 0 | 0 | 0 | 0.27 | 0.1 | 0.27 | 0.307 | 0 |
| Emilia | 0 | 0 | 0 | 0 | 0 | 1 | 0 | 0.08 | 0 | 0 | 0.8 | 0 | 0 | 0 | 0 | 0.07 | 0 | 0 | 0 | 0 | 0 |
| Friuli | 0 | 0 | 0 | 0 | 0.56 | 0 | 1 | 0.11 | 0.06 | 0 | 0 | 0 | 0.56 | 0 | 0 | 0 | 0 | 0 | 0 | 0.663 | 0 |
| Lazio | 0 | 0 | 0 | 0 | 0 | 0.08 | 0.11 | 1 | 0 | 0 | 0 | 0 | 0 | 0 | 0 | 0.75 | 0 | 0 | 0 | 0.147 | 0 |
| Liguria | 0 | 0 | 0 | 0 | 0.95 | 0 | 0.06 | 0 | 1 | 0 | 0 | 0 | 0.65 | 0 | 0.13 | 0 | 0.18 | 0 | 0 | 0.184 | 0 |
| Lombardi | 0 | 0 | 0 | 0 | 0 | 0 | 0 | 0 | 0 | 1 | 0 | 0 | 0 | 0 | 0 | 0 | 0 | 0 | 0 | 0 | 0 |
| Marche | 0 | 0 | 0 | 0 | 0 | 0.8 | 0 | 0 | 0 | 0 | 1 | 0 | 0 | 0 | 0 | 0 | 0 | 0 | 0 | 0.686 | 0 |
| Molise | 0 | 0.42 | 0 | 0 | 0 | 0 | 0 | 0 | 0 | 0 | 0 | 1 | 0.17 | 0 | 0 | 0 | 0 | 0 | 0 | 0 | 0 |
| Piemonte | 0 | 0 | 0 | 0 | 0.4 | 0 | 0.18 | 0.65 | 0 | 0 | 0 | 0 | 0.22 | 0 | 0 | 0 | 0 | 0 | 0 | 0.573 | 0 |
| Puglia | 0.65 | 0.33 | 0.65 | 0.65 | 0.21 | 0 | 0.56 | 0 | 0.65 | 0 | 0 | 0.17 | 1 | 0.64 | 0.39 | 0 | 0.65 | 0.65 | 0.65 | 0.197 | 0 |
| Sardegna | 0 | 0.15 | 0.2 | 0 | 0 | 0 | 0 | 0 | 0 | 0 | 0 | 0 | 0.64 | 1 | 0 | 0 | 0 | 0 | 0 | 0 | 0 |
| Sicilia | 0.15 | 0.09 | 0.1 | 0.95 | 0 | 0 | 0 | 0 | 0.13 | 0 | 0 | 0 | 0.39 | 0 | 1 | 0 | 0.95 | 0 | 0 | 0.151 | 0 |
| Toscana | 0 | 0 | 0 | 0 | 0 | 0.07 | 0 | 0.75 | 0 | 0 | 0 | 0 | 0 | 0 | 0 | 1 | 0 | 0 | 0 | 0.398 | 0 |
| Trento | 0.44 | 0 | 0 | 0.24 | 0.27 | 0 | 0 | 0 | 0.18 | 0 | 0 | 0 | 0.65 | 0 | 0.95 | 0 | 1 | 0.95 | 0.85 | 0 | 0 |
| Umbria | 0.65 | 0.1 | 0 | 0.4 | 0.1 | 0 | 0 | 0 | 0 | 0 | 0 | 0 | 0.65 | 0 | 0 | 0 | 0.95 | 1 | 0.75 | 0 | 0 |
| ValleAosta | 0.48 | 0.1 | 0.06 | 0.56 | 0.27 | 0 | 0 | 0 | 0 | 0 | 0 | 0 | 0.65 | 0 | 0 | 0 | 0.85 | 0.75 | 1 | 1 | 0 |
| Veneto | 0 | 0 | 0 | 0 | 0 | 0 | 0 | 0 | 0 | 0 | 0 | 0 | 0 | 0 | 0 | 0 | 0 | 0 | 0 | 0 | 1 |
| Abruzzo | Basilicata | Bolzano | Calabria | Campania | Emilia | Friuli | Lazio | Liguria | Lombardi | Marche | Molise | Piemonte | Puglia | Sardegna | Sicilia | Toscana | Trento | Umbria | ValleAosta | Veneto | |
|---|---|---|---|---|---|---|---|---|---|---|---|---|---|---|---|---|---|---|---|---|---|
| Abruzzo | 1 | 0 | 0 | 0.18 | 0.56 | 0 | 0 | 0 | 0 | 0 | 0 | 0 | 0 | 0.65 | 0 | 0.15 | 0 | 0.44 | 0.65 | 0.48 | 0 |
| Basilicata | 0 | 1 | 0.17 | 0.13 | 0 | 0 | 0 | 0 | 0 | 0 | 0 | 0.42 | 0 | 0.33 | 0.15 | 0.09 | 0 | 0 | 0.1 | 0.1 | 0 |
| Bolzano | 0 | 0.17 | 1 | 0.12 | 0 | 0 | 0 | 0 | 0 | 0 | 0 | 0 | 0 | 0.65 | 0.2 | 0.1 | 0 | 0 | 0 | 0.06 | 0 |
| Calabria | 0.18 | 0.13 | 0.12 | 1 | 0.27 | 0 | 0 | 0 | 0 | 0 | 0 | 0 | 0 | 0.65 | 0 | 0.95 | 0 | 0.24 | 0.4 | 0.56 | 0 |
| Campania | 0.56 | 0 | 0 | 0.27 | 1 | 0 | 0.56 | 0 | 0.95 | 0 | 0 | 0 | 0.4 | 0.21 | 0 | 0 | 0 | 0.27 | 0.1 | 0.27 | 0 |
| Emilia | 0 | 0 | 0 | 0 | 0 | 1 | 0 | 0.08 | 0 | 0 | 0.8 | 0 | 0 | 0 | 0 | 0 | 0.07 | 0 | 0 | 0 | 0 |
| Friuli | 0 | 0 | 0 | 0 | 0.56 | 0 | 1 | 0.11 | 0.06 | 0 | 0 | 0 | 0.18 | 0.56 | 0 | 0 | 0 | 0 | 0 | 0 | 0 |
| Lazio | 0 | 0 | 0 | 0 | 0 | 0.08 | 0.11 | 1 | 0 | 0 | 0 | 0 | 0.65 | 0 | 0 | 0 | 0.75 | 0 | 0 | 0 | 0 |
| Liguria | 0 | 0 | 0 | 0 | 0.95 | 0 | 0.06 | 0 | 1 | 0 | 0 | 0 | 0 | 0.65 | 0 | 0.13 | 0 | 0.18 | 0 | 0 | 0 |
| Lombardi | 0 | 0 | 0 | 0 | 0 | 0 | 0 | 0 | 0 | 1 | 0 | 0 | 0 | 0 | 0 | 0 | 0 | 0 | 0 | 0 | 0 |
| Marche | 0 | 0 | 0 | 0 | 0 | 0.8 | 0 | 0 | 0 | 0 | 1 | 0 | 0 | 0 | 0 | 0 | 0 | 0 | 0 | 0 | 0 |
| Molise | 0 | 0.42 | 0 | 0 | 0 | 0 | 0 | 0 | 0 | 0 | 0 | 1 | 0 | 0.17 | 0 | 0 | 0 | 0 | 0 | 0 | 0 |
| Piemonte | 0 | 0 | 0 | 0 | 0.4 | 0 | 0.18 | 0.65 | 0 | 0 | 0 | 0 | 1 | 0.22 | 0 | 0 | 0 | 0 | 0 | 0 | 0 |
| Puglia | 0.65 | 0.33 | 0.65 | 0.65 | 0.21 | 0 | 0.56 | 0 | 0.65 | 0 | 0 | 0.17 | 0.22 | 1 | 0.64 | 0.39 | 0 | 0.65 | 0.65 | 0.65 | 0 |
| Sardegna | 0 | 0.15 | 0.2 | 0 | 0 | 0 | 0 | 0 | 0 | 0 | 0 | 0 | 0 | 0.64 | 1 | 0 | 0 | 0 | 0 | 0 | 0 |
| Sicilia | 0.15 | 0.09 | 0.1 | 0.95 | 0 | 0 | 0 | 0 | 0.13 | 0 | 0 | 0 | 0 | 0.39 | 0 | 1 | 0 | 0.95 | 0 | 0 | 0 |
| Toscana | 0 | 0 | 0 | 0 | 0 | 0.07 | 0 | 0.75 | 0 | 0 | 0 | 0 | 0 | 0 | 0 | 0 | 1 | 0 | 0 | 0 | 0 |
| Trento | 0.44 | 0 | 0 | 0.24 | 0.27 | 0 | 0 | 0 | 0.18 | 0 | 0 | 0 | 0 | 0.65 | 0 | 0.95 | 0 | 1 | 0.95 | 0.85 | 0 |
| Umbria | 0.65 | 0.1 | 0 | 0.4 | 0.1 | 0 | 0 | 0 | 0 | 0 | 0 | 0 | 0 | 0.65 | 0 | 0 | 0 | 0.95 | 1 | 0.75 | 0 |
| ValleAosta | 0.48 | 0.1 | 0.06 | 0.56 | 0.27 | 0 | 0 | 0 | 0 | 0 | 0 | 0 | 0 | 0.65 | 0 | 0 | 0 | 0.85 | 0.75 | 1 | 0 |
| Veneto | 0 | 0 | 0 | 0 | 0 | 0 | 0 | 0 | 0 | 0 | 0 | 0 | 0 | 0 | 0 | 0 | 0 | 0 | 0 | 0 | 1 |
| Abruzzo | Basilicata | Bolzano | Calabria | Campania | Emilia | Friuli | Lazio | Liguria | Lombardi | Marche | Molise | Piemonte | Puglia | Sardegna | Sicilia | Toscana | Trento | Umbria | ValleAosta | Veneto | |
|---|---|---|---|---|---|---|---|---|---|---|---|---|---|---|---|---|---|---|---|---|---|
| Abruzzo | 1 | 0.1 | 0 | 0.34 | 0 | 0 | 0 | 0 | 0 | 0 | 0 | 0.22 | 0 | 0 | 0.28 | 0 | 0 | 0.06 | 0.48 | 0 | 0 |
| Basilicata | 0.1 | 1 | 0 | 0.95 | 0 | 0 | 0 | 0 | 0 | 0 | 0 | 0.41 | 0 | 0 | 0.9 | 0 | 0 | 0 | 0.07 | 0 | 0 |
| Bolzano | 0 | 0 | 1 | 0 | 0 | 0 | 0 | 0 | 0 | 0 | 0 | 0.95 | 0 | 0 | 0 | 0 | 0 | 0 | 0 | 0 | 0 |
| Calabria | 0.34 | 0.95 | 0 | 1 | 0 | 0 | 0 | 0 | 0 | 0 | 0 | 0.34 | 0 | 0 | 0.65 | 0 | 0 | 0 | 0.14 | 0 | 0 |
| Campania | 0 | 0 | 0 | 0 | 1 | 0 | 0.48 | 0 | 0 | 0 | 0 | 0 | 0.14 | 0 | 0 | 0.11 | 0 | 0 | 0 | 0.34 | 0 |
| Emilia | 0 | 0 | 0 | 0 | 0 | 1 | 0 | 0 | 0 | 0 | 0.41 | 0 | 0 | 0 | 0 | 0 | 0 | 0 | 0 | 0 | 0 |
| Friuli | 0 | 0 | 0 | 0 | 0.48 | 0 | 1 | 0 | 0 | 0 | 0 | 0 | 0.14 | 0.34 | 0 | 0.56 | 0 | 0 | 0 | 0.34 | 0 |
| Lazio | 0 | 0 | 0 | 0 | 0 | 0 | 0 | 1 | 0 | 0 | 0 | 0 | 0.06 | 0 | 0 | 0 | 0.22 | 0 | 0 | 0 | 0 |
| Liguria | 0 | 0 | 0 | 0 | 0 | 0 | 0 | 0 | 1 | 0 | 0 | 0 | 0 | 0 | 0 | 0 | 0 | 0.4 | 0.08 | 0.41 | 0 |
| Lombardi | 0 | 0 | 0 | 0 | 0 | 0 | 0 | 0 | 0 | 1 | 0 | 0 | 0 | 0 | 0 | 0 | 0 | 0 | 0 | 0 | 0 |
| Marche | 0 | 0 | 0 | 0 | 0 | 0.41 | 0 | 0 | 0 | 0 | 1 | 0 | 0 | 0 | 0 | 0 | 0 | 0 | 0 | 0 | 0 |
| Molise | 0.22 | 0.41 | 0.95 | 0.34 | 0 | 0 | 0 | 0 | 0 | 0 | 0 | 1 | 0 | 0 | 0.4 | 0 | 0 | 0 | 0.08 | 0 | 0 |
| Piemonte | 0 | 0 | 0 | 0 | 0.14 | 0 | 0.14 | 0.06 | 0 | 0 | 0 | 0 | 1 | 0 | 0 | 0 | 0.22 | 0 | 0 | 0.11 | 0 |
| Puglia | 0 | 0 | 0 | 0 | 0 | 0 | 0.34 | 0 | 0 | 0 | 0 | 0 | 0 | 1 | 0 | 0.48 | 0 | 0 | 0 | 0.65 | 0 |
| Sardegna | 0.28 | 0.9 | 0 | 0.65 | 0 | 0 | 0 | 0 | 0 | 0 | 0 | 0.4 | 0 | 0 | 1 | 0 | 0 | 0 | 0.11 | 0 | 0 |
| Sicilia | 0 | 0 | 0 | 0 | 0.11 | 0 | 0.56 | 0 | 0 | 0 | 0 | 0 | 0 | 0.48 | 0 | 1 | 0 | 0 | 0 | 0.48 | 0 |
| Toscana | 0 | 0 | 0 | 0 | 0 | 0 | 0 | 0.22 | 0 | 0 | 0 | 0 | 0.22 | 0 | 0 | 0 | 1 | 0 | 0 | 0 | 0 |
| Trento | 0.06 | 0 | 0 | 0 | 0 | 0 | 0 | 0 | 0.4 | 0 | 0 | 0 | 0 | 0 | 0 | 0 | 0 | 1 | 0.21 | 0.17 | 0 |
| Umbria | 0.48 | 0.07 | 0 | 0.14 | 0 | 0 | 0 | 0 | 0.08 | 0 | 0 | 0.08 | 0 | 0 | 0.11 | 0 | 0 | 0.21 | 1 | 0 | 0 |
| ValleAosta | 0 | 0 | 0 | 0 | 0.34 | 0 | 0.34 | 0 | 0.41 | 0 | 0 | 0 | 0.11 | 0.65 | 0 | 0.48 | 0 | 0.17 | 0 | 1 | 0 |
| Veneto | 0 | 0 | 0 | 0 | 0 | 0 | 0 | 0 | 0 | 0 | 0 | 0 | 0 | 0 | 0 | 0 | 0 | 0 | 0 | 0 | 1 |
| Abruzzo | Basilicata | Bolzano | Calabria | Campania | Emilia | Friuli | Lazio | Liguria | Lombardi | Marche | Molise | Piemonte | Puglia | Sardegna | Sicilia | Toscana | Trento | Umbria | ValleAosta | Veneto | |
|---|---|---|---|---|---|---|---|---|---|---|---|---|---|---|---|---|---|---|---|---|---|
| Abruzzo | 1 | 0 | 0.405 | 0.482 | 0 | 0 | 0 | 0 | 0.11 | 0 | 0 | 0 | 0 | 0.11 | 0.084 | 0 | 0 | 0.848 | 0.848 | 0 | 0 |
| Basilicata | 0 | 1 | 0.651 | 0 | 0 | 0 | 0 | 0 | 0 | 0 | 0 | 0 | 0 | 0 | 0 | 0 | 0 | 0 | 0 | 0 | 0 |
| Bolzano | 0.405 | 0.651 | 1 | 0.949 | 0 | 0 | 0 | 0 | 0.064 | 0 | 0 | 0.654 | 0 | 0.064 | 0.749 | 0 | 0 | 0.749 | 0.848 | 0 | 0 |
| Calabria | 0.482 | 0 | 0.949 | 1 | 0 | 0 | 0 | 0 | 0 | 0 | 0 | 0 | 0 | 0 | 0.443 | 0 | 0 | 0.277 | 0.535 | 0 | 0.056 |
| Campania | 0 | 0 | 0 | 0 | 1 | 0 | 0.053 | 0 | 0.383 | 0 | 0 | 0 | 0 | 0.318 | 0 | 1 | 0 | 0 | 0 | 0.097 | 0.056 |
| Emilia | 0 | 0 | 0 | 0 | 0 | 1 | 0 | 0.084 | 0 | 0 | 0 | 0 | 0 | 0 | 0 | 0 | 0 | 0 | 0 | 0 | 0.056 |
| Friuli | 0 | 0 | 0 | 0 | 0.053 | 0 | 1 | 0 | 0 | 0 | 0 | 0 | 0.535 | 0 | 0 | 0.053 | 0.209 | 0 | 0 | 0.456 | 0.056 |
| Lazio | 0 | 0 | 0 | 0 | 0 | 0.084 | 0 | 1 | 0 | 0 | 0 | 0 | 0.064 | 0 | 0 | 0 | 0.141 | 0 | 0 | 0.337 | 0 |
| Liguria | 0.11 | 0 | 0.064 | 0 | 0.383 | 0 | 0 | 0 | 1 | 0 | 0 | 0 | 0 | 0.902 | 0 | 0.318 | 0 | 0 | 0 | 0 | 0.056 |
| Lombardi | 0 | 0 | 0 | 0 | 0 | 0 | 0 | 0 | 0 | 1 | 0 | 0 | 0 | 0 | 0 | 0 | 0 | 0 | 0 | 0 | 0.056 |
| Marche | 0 | 0 | 0 | 0 | 0 | 0 | 0 | 0 | 0 | 0 | 1 | 0 | 0 | 0 | 0 | 0 | 0 | 0 | 0 | 0 | 0 |
| Molise | 0 | 0 | 0.654 | 0 | 0 | 0 | 0 | 0 | 0 | 0 | 0 | 1 | 0 | 0 | 0.209 | 0 | 0 | 0 | 0 | 0 | 0.056 |
| Piemonte | 0 | 0 | 0 | 0 | 0 | 0 | 0.535 | 0.064 | 0 | 0 | 0 | 0 | 1 | 0 | 0 | 0 | 0.383 | 0 | 0 | 0.71 | 0.056 |
| Puglia | 0.11 | 0 | 0.064 | 0 | 0.318 | 0 | 0 | 0 | 0.902 | 0 | 0 | 0 | 0 | 1 | 0 | 0.318 | 0 | 0 | 0 | 0 | 0.056 |
| Sardegna | 0.084 | 0 | 0.749 | 0.443 | 0 | 0 | 0 | 0 | 0 | 0 | 0 | 0.209 | 0 | 0 | 1 | 0 | 0 | 0.084 | 0.128 | 0 | 0.056 |
| Sicilia | 0 | 0 | 0 | 0 | 1 | 0 | 0.053 | 0 | 0.318 | 0 | 0 | 0 | 0 | 0.318 | 0 | 1 | 0 | 0 | 0 | 0.073 | 0.056 |
| Toscana | 0 | 0 | 0 | 0 | 0 | 0 | 0.209 | 0.141 | 0 | 0 | 0 | 0 | 0.383 | 0 | 0 | 0 | 1 | 0 | 0 | 1 | 0.056 |
| Trento | 0.848 | 0 | 0.749 | 0.277 | 0 | 0 | 0 | 0 | 0 | 0 | 0 | 0 | 0 | 0 | 0.084 | 0 | 0 | 1 | 0.749 | 0 | 0 |
| Umbria | 0.848 | 0 | 0.848 | 0.535 | 0 | 0 | 0 | 0 | 0 | 0 | 0 | 0 | 0 | 0 | 0.128 | 0 | 0 | 0.749 | 1 | 0 | 0.056 |
| ValleAosta | 0 | 0 | 0 | 0 | 0.097 | 0 | 0.456 | 0.337 | 0 | 0 | 0 | 0 | 0.71 | 0 | 0 | 0.073 | 1 | 0 | 0 | 1 | 0.056 |
| Veneto | 0 | 0 | 0 | 0.056 | 0.056 | 0.056 | 0.056 | 0 | 0.056 | 0.056 | 0 | 0.056 | 0.056 | 0.056 | 0.056 | 0.056 | 0.056 | 0 | 0.056 | 0.056 | 1 |
| Abruzzo | Basilicata | Bolzano | Calabria | Campania | Emilia | Friuli | Lazio | Liguria | Lombardi | Marche | Molise | Piemonte | Puglia | Sardegna | Sicilia | Toscana | Trento | Umbria | ValleAosta | Veneto | |
|---|---|---|---|---|---|---|---|---|---|---|---|---|---|---|---|---|---|---|---|---|---|
| Abruzzo | 1 | 0 | 0.097 | 0.71 | 0 | 0 | 0 | 0 | 0.073 | 0 | 0.179 | 0 | 0 | 0 | 0 | 0 | 0 | 0.749 | 1 | 0 | 0 |
| Basilicata | 0 | 1 | 0 | 0 | 0 | 0 | 0 | 0 | 0 | 0 | 0.179 | 0.749 | 0 | 0 | 0 | 0 | 0 | 0 | 0 | 0 | 0 |
| Bolzano | 0.097 | 0 | 1 | 0.097 | 0.848 | 0 | 0.084 | 0 | 0.902 | 0 | 0.179 | 0 | 0 | 0.62 | 0 | 0.71 | 0 | 0.084 | 0.097 | 0 | 0 |
| Calabria | 0.71 | 0 | 0.097 | 1 | 0.064 | 0 | 0 | 0 | 0.073 | 0 | 0.179 | 0 | 0 | 0 | 0.165 | 0 | 0 | 0.798 | 0.805 | 0 | 0 |
| Campania | 0 | 0 | 0.848 | 0.064 | 1 | 0 | 0 | 0 | 0.749 | 0 | 0.179 | 0 | 0 | 0.406 | 0 | 0.406 | 0 | 0 | 0.064 | 0 | 0 |
| Emilia | 0 | 0 | 0 | 0 | 0 | 1 | 0 | 0 | 0 | 0 | 0.565 | 0 | 0 | 0 | 0 | 0 | 0 | 0 | 0 | 0 | 0 |
| Friuli | 0 | 0 | 0.084 | 0 | 0 | 0 | 1 | 0 | 0 | 0 | 0.179 | 0 | 0 | 0.11 | 0 | 0 | 0 | 0 | 0 | 0 | 0 |
| Lazio | 0 | 0 | 0 | 0 | 0 | 0 | 0 | 1 | 0 | 0 | 0.199 | 0 | 0 | 0 | 0 | 0 | 0.063 | 0 | 0 | 0.179 | 0 |
| Liguria | 0.073 | 0 | 0.902 | 0.073 | 0.749 | 0 | 0 | 0 | 1 | 0 | 0.179 | 0 | 0 | 0.383 | 0 | 0.383 | 0 | 0 | 0.073 | 0 | 0 |
| Lombardi | 0 | 0 | 0 | 0 | 0 | 0 | 0 | 0 | 0 | 1 | 0 | 0 | 0 | 0 | 0 | 0 | 0 | 0 | 0 | 0 | 0 |
| Marche | 0.179 | 0.179 | 0.179 | 0.179 | 0.179 | 0.565 | 0.179 | 0.199 | 0.179 | 0 | 1 | 0.179 | 0.179 | 0.179 | 0.179 | 0.179 | 0.179 | 0.179 | 0.179 | 0.179 | 0 |
| Molise | 0 | 0.749 | 0 | 0 | 0 | 0 | 0 | 0 | 0 | 0 | 0.179 | 1 | 0 | 0 | 0 | 0 | 0 | 0 | 0 | 0 | 0 |
| Piemonte | 0 | 0 | 0 | 0 | 0 | 0 | 0 | 0 | 0 | 0 | 0.179 | 0 | 1 | 0 | 0 | 0 | 0.71 | 0 | 0 | 0.259 | 0 |
| Puglia | 0 | 0 | 0.62 | 0 | 0.406 | 0 | 0.11 | 0 | 0.383 | 0 | 0.179 | 0 | 0 | 1 | 0 | 0.71 | 0 | 0 | 0 | 0 | 0 |
| Sardegna | 0 | 0 | 0 | 0.165 | 0 | 0 | 0 | 0 | 0 | 0 | 0.179 | 0 | 0 | 0 | 1 | 0 | 0 | 0.11 | 0.073 | 0 | 0 |
| Sicilia | 0 | 0 | 0.71 | 0 | 0.406 | 0 | 0 | 0 | 0.383 | 0 | 0.179 | 0 | 0 | 0.71 | 0 | 1 | 0 | 0 | 0 | 0 | 0 |
| Toscana | 0 | 0 | 0 | 0 | 0 | 0 | 0 | 0.063 | 0 | 0 | 0.179 | 0 | 0.71 | 0 | 0 | 0 | 1 | 0 | 0 | 0.383 | 0 |
| Trento | 0.749 | 0 | 0.084 | 0.798 | 0 | 0 | 0 | 0 | 0 | 0 | 0.179 | 0 | 0 | 0 | 0.11 | 0 | 0 | 1 | 0.654 | 0 | 0 |
| Umbria | 1 | 0 | 0.097 | 0.805 | 0.064 | 0 | 0 | 0 | 0.073 | 0 | 0.179 | 0 | 0 | 0 | 0.073 | 0 | 0 | 0.654 | 1 | 0 | 0 |
| ValleAosta | 0 | 0 | 0 | 0 | 0 | 0 | 0 | 0.179 | 0 | 0 | 0.179 | 0 | 0.259 | 0 | 0 | 0 | 0.383 | 0 | 0 | 1 | 0 |
| Veneto | 0 | 0 | 0 | 0 | 0 | 0 | 0 | 0 | 0 | 0 | 0 | 0 | 0 | 0 | 0 | 0 | 0 | 0 | 0 | 0 | 1 |
| Abruzzo | Basilicata | Bolzano | Calabria | Campania | Emilia | Friuli | Lazio | Liguria | Lombardi | Marche | Molise | Piemonte | Puglia | Sardegna | Sicilia | Toscana | Trento | Umbria | ValleAosta | Veneto | |
|---|---|---|---|---|---|---|---|---|---|---|---|---|---|---|---|---|---|---|---|---|---|
| Abruzzo | 1 | 0 | 0 | 0.62 | 0 | 0 | 0 | 0 | 0.053 | 0 | 0 | 0 | 0 | 0 | 0 | 0 | 0 | 0.209 | 0.902 | 0 | 0 |
| Basilicata | 0 | 1 | 0 | 0 | 0 | 0 | 0 | 0 | 0 | 0 | 0 | 0 | 0 | 0 | 0 | 0 | 0 | 0 | 0 | 0.456 | 0 |
| Bolzano | 0 | 0 | 1 | 0.097 | 0.71 | 0 | 0 | 0 | 0.456 | 0 | 0.318 | 0 | 0 | 0.128 | 0 | 0.209 | 0 | 0 | 0 | 0 | 0 |
| Calabria | 0.62 | 0 | 0.097 | 1 | 0.073 | 0 | 0 | 0 | 0.209 | 0 | 0 | 0 | 0 | 0 | 0 | 0 | 0 | 0.128 | 0.62 | 0 | 0 |
| Campania | 0 | 0 | 0.71 | 0.073 | 1 | 0 | 0.097 | 0 | 0.318 | 0 | 0.902 | 0 | 0 | 0.535 | 0 | 0.318 | 0 | 0 | 0 | 0 | 0 |
| Emilia | 0 | 0 | 0 | 0 | 0 | 1 | 0 | 0 | 0 | 0 | 0 | 0 | 0 | 0 | 0 | 0 | 0 | 0 | 0 | 0 | 0 |
| Friuli | 0 | 0 | 0 | 0 | 0.097 | 0 | 1 | 0 | 0 | 0 | 0.097 | 0 | 0 | 0.259 | 0 | 0.71 | 0 | 0 | 0 | 0 | 0 |
| Lazio | 0 | 0 | 0 | 0 | 0 | 0 | 0 | 1 | 0 | 0 | 0 | 0 | 0 | 0 | 0 | 0 | 0.406 | 0 | 0 | 0 | 0 |
| Liguria | 0.053 | 0 | 0.456 | 0.209 | 0.318 | 0 | 0 | 0 | 1 | 0 | 0.128 | 0 | 0 | 0 | 0 | 0.073 | 0 | 0 | 0.053 | 0 | 0 |
| Lombardi | 0 | 0 | 0 | 0 | 0 | 0 | 0 | 0 | 0 | 1 | 0 | 0 | 0 | 0 | 0 | 0 | 0 | 0 | 0 | 0 | 0.165 |
| Marche | 0 | 0 | 0.318 | 0 | 0.902 | 0 | 0.097 | 0 | 0.128 | 0 | 1 | 0 | 0 | 0.535 | 0 | 0.535 | 0 | 0 | 0 | 0 | 0 |
| Molise | 0 | 0 | 0 | 0 | 0 | 0 | 0 | 0 | 0 | 0 | 0 | 1 | 0 | 0 | 0 | 0 | 0 | 0 | 0 | 0 | 0 |
| Piemonte | 0 | 0 | 0 | 0 | 0 | 0 | 0 | 0 | 0 | 0 | 0 | 0 | 1 | 0 | 0 | 0 | 0.456 | 0 | 0 | 0 | 0 |
| Puglia | 0 | 0 | 0.128 | 0 | 0.535 | 0 | 0.259 | 0 | 0 | 0 | 0.535 | 0 | 0 | 1 | 0 | 0.805 | 0 | 0 | 0 | 0 | 0 |
| Sardegna | 0 | 0 | 0 | 0 | 0 | 0 | 0 | 0 | 0 | 0 | 0 | 0 | 0 | 0 | 1 | 0 | 0 | 0.053 | 0 | 0 | 0 |
| Sicilia | 0 | 0 | 0.209 | 0 | 0.318 | 0 | 0.71 | 0 | 0.073 | 0 | 0.535 | 0 | 0 | 0.805 | 0 | 1 | 0 | 0 | 0 | 0 | 0 |
| Toscana | 0 | 0 | 0 | 0 | 0 | 0 | 0 | 0.406 | 0 | 0 | 0 | 0 | 0.456 | 0 | 0 | 0 | 1 | 0 | 0 | 0 | 0 |
| Trento | 0.209 | 0 | 0 | 0.128 | 0 | 0 | 0 | 0 | 0 | 0 | 0 | 0 | 0 | 0 | 0.053 | 0 | 0 | 1 | 0.318 | 0 | 0 |
| Umbria | 0.902 | 0 | 0 | 0.62 | 0 | 0 | 0 | 0 | 0.053 | 0 | 0 | 0 | 0 | 0 | 0 | 0 | 0 | 0.318 | 1 | 0 | 0 |
| ValleAosta | 0 | 0.456 | 0 | 0 | 0 | 0 | 0 | 0 | 0 | 0 | 0 | 0 | 0 | 0 | 0 | 0 | 0 | 0 | 0 | 1 | 0 |
| Veneto | 0 | 0 | 0 | 0 | 0 | 0 | 0 | 0 | 0 | 0.165 | 0 | 0 | 0 | 0 | 0 | 0 | 0 | 0 | 0 | 0 | 1 |
References
- Wu, Z.; McGoogan, J.M. Characteristics of and important lessons from the coronavirus disease 2019 (COVID-19) outbreak in China: Summary of a report of 72 314 cases from the Chinese Center for Disease Control and Prevention. JAMA 2020. [Google Scholar] [CrossRef] [PubMed]
- Zhu, N.; Zhang, D.; Wang, W.; Li, X.; Yang, B.; Song, J.; Zhao, X.; Huang, B.; Shi, W.; Lu, R.; et al. A novel coronavirus from patients with pneumonia in China, 2019. N. Engl. J. Med. 2020. [Google Scholar] [CrossRef] [PubMed]
- Chen, N.; Zhou, M.; Dong, X.; Qu, J.; Gong, F.; Han, Y.; Qiu, Y.; Wang, J.; Liu, Y.; Wei, Y.; et al. Epidemiological and clinical characteristics of 99 cases of 2019 novel coronavirus pneumonia in Wuhan, China: A descriptive study. Lancet 2020, 395, 507–513. [Google Scholar] [CrossRef]
- Wang, C.; Horby, P.W.; Hayden, F.G.; Gao, G.F. A novel coronavirus outbreak of global health concern. Lancet 2020, 395, 470–473. [Google Scholar] [CrossRef]
- Huang, C.; Wang, Y.; Li, X.; Ren, L.; Zhao, J.; Hu, Y.; Zhang, L.; Fan, G.; Xu, J.; Gu, X.; et al. Clinical features of patients infected with 2019 novel coronavirus in Wuhan, China. Lancet 2020, 395, 497–506. [Google Scholar] [CrossRef]
- Lai, A.; Bergna, A.; Acciarri, C.; Galli, M.; Zehender, G. Early phylogenetic estimate of the effective reproduction number of SARS-CoV-2. J. Med. Virol. 2020. [Google Scholar] [CrossRef] [PubMed]
- Milano, M. Computing Languages for Bioinformatics: R. In Encyclopedia of Bioinformatics and Computational Biology; Gribskov, M., Nakai, K., Schonbach, C., Eds.; Elsevier: Oxford, UK, 2019; Volume 1, pp. 889–895. [Google Scholar]
- Manojlovic, N.; Seemayer, N.; de Ruiter, N.; Weisz, H.; Bauer, S. Analysis of the biological effect of city smog extract. III. Comparative investigations on the effect of city smog extracts on cell replication and DNA-synthesis of kidney cells in vitro from the primate Cercopithecus aethiops (author’s transl). Zentralbl Bakteriol B 1978, 167, 90–97. [Google Scholar] [PubMed]
- Araujo, M.B.; Naimi, B. Spread of SARS-CoV-2 Coronavirus likely to be constrained by climate. medRxiv 2020. [Google Scholar] [CrossRef]
- Agapito, G.; Guzzi, P.H.; Cannataro, M. Challenges and Opportunities for Visualization and Analysis of Graph-Modeled Medical Data. Preprints 2017. [Google Scholar] [CrossRef]
- Csardi, G.; Nepusz, T. The igraph software package for complex network research. InterJ. Complex Syst. 2006, 1695, 1–9. [Google Scholar]
- Pons, P.; Latapy, M. Computing communities in large networks using random walks. In International Symposium on Computer and Information Sciences; Springer: Berlin/Heidelberg, Germany, 2005; pp. 284–293. [Google Scholar]
- Reich, O.; Shalev, G.; Kalvari, T. Modeling COVID-19 on a network: Super-spreaders, testing and containment. medRxiv 2020. [Google Scholar] [CrossRef]
- Herrmann, H.A.; Schwartz, J.M. Using network science to propose strategies for effectively dealing with pandemics: The COVID-19 example. medRxiv 2020. [Google Scholar] [CrossRef]
- Kuzdeuov, A.; Baimukashev, D.; Karabay, A.; Ibragimov, B.; Mirzakhmetov, A.; Nurpeiissov, M.; Lewis, M.; Varol, H.A. A Network-Based Stochastic Epidemic Simulator: Controlling COVID-19 with Region-Specific Policies. medRxiv 2020. [Google Scholar] [CrossRef]
- Kumar, A. Modeling geographical spread of COVID-19 in India using network-based approach. medRxiv 2020. [Google Scholar] [CrossRef]
- Wang, P.; Lu, J.A.; Jin, Y.; Zhu, M.; Wang, L.; Chen, S. Statistical and network analysis of 1212 COVID-19 patients in Henan, China. Int. J. Infect. Dis. 2020. [Google Scholar] [CrossRef] [PubMed]


| Region | Statistics | Hospitalized with Symptoms | Intensive Care | Total Hospitalized | Home Isolation | Total Currently Positive | New Currently Positive | Discharged/Healed | Deceased | Total Cases | Swabs |
|---|---|---|---|---|---|---|---|---|---|---|---|
| Abruzzo | sample size | 35 | 35 | 35 | 35 | 35 | 35 | 35 | 35 | 35 | 35 |
| mean | 198.968 | 36.079 | 235.048 | 664.429 | 899.476 | 45.381 | 105.397 | 102.571 | 1107.444 | 10,235.143 | |
| sd | 144.026 | 26.174 | 167.182 | 654.035 | 797.205 | 38.981 | 135.614 | 107.148 | 1026.840 | 11,061.168 | |
| median | 280 | 41 | 344 | 516 | 860 | 40 | 23 | 63 | 946 | 5488 | |
| Q1 | 31 | 9 | 26 | 11 | 37 | 7 | 0 | 1 | 38 | 310 | |
| Q3 | 324 | 57 | 375 | 1309.5 | 1679.5 | 68.5 | 185.5 | 202 | 2067 | 18,764.5 | |
| Basilicata | sample size | 35 | 35 | 35 | 35 | 35 | 35 | 35 | 35 | 35 | 35 |
| mean | 27.254 | 7.905 | 35.159 | 96.714 | 131.873 | 5.810 | 18.381 | 8.016 | 158.270 | 2407.730 | |
| sd | 25.359 | 6.897 | 30.277 | 84.957 | 114.971 | 6.862 | 33.324 | 9.511 | 144.778 | 2857.527 | |
| median | 22 | 7 | 37 | 95 | 133 | 3 | 0 | 1 | 134 | 1046 | |
| Q1 | 1 | 0.5 | 2 | 5.5 | 7.5 | 1 | 0 | 0 | 7.5 | 151.5 | |
| Q3 | 57.5 | 14.5 | 65.5 | 180.5 | 246 | 9 | 14 | 16 | 310 | 3873 | |
| Bolzano | sample size | 35 | 35 | 35 | 35 | 35 | 35 | 35 | 35 | 35 | 35 |
| mean | 130.000 | 26.063 | 156.063 | 592.143 | 748.206 | 39.381 | 221.730 | 95.270 | 1065.206 | 11,782.746 | |
| sd | 101.958 | 22.913 | 124.171 | 505.379 | 603.912 | 35.063 | 299.997 | 101.007 | 940.736 | 12,108.597 | |
| median | 146 | 20 | 176 | 525 | 791 | 35 | 67 | 48 | 906 | 7744 | |
| Q1 | 12.5 | 2.5 | 15 | 41.5 | 56.5 | 5 | 0 | 0 | 56.5 | 55.5 | |
| Q3 | 224 | 45 | 271 | 955.5 | 1275 | 57 | 400.5 | 195.5 | 1956 | 21,526 | |
| Calabria | sample size | 35 | 35 | 35 | 35 | 35 | 35 | 35 | 35 | 35 | 35 |
| mean | 87.111 | 9.349 | 96.460 | 309.889 | 406.349 | 17.286 | 38.492 | 30.222 | 475.063 | 9352.778 | |
| sd | 67.007 | 7.393 | 72.266 | 280.259 | 347.032 | 19.409 | 56.738 | 31.717 | 422.581 | 9747.839 | |
| median | 101 | 8 | 124 | 248 | 372 | 13 | 7 | 14 | 393 | 5933 | |
| Q1 | 9 | 2 | 11 | 4.5 | 14 | 2 | 1 | 0 | 16 | 382.5 | |
| Q3 | 153 | 15 | 160.5 | 606 | 788.5 | 26.5 | 53.5 | 65.5 | 908 | 17,065 | |
| Campania | sample size | 35 | 35 | 35 | 35 | 35 | 35 | 35 | 35 | 35 | 35 |
| mean | 322.016 | 59.381 | 381.397 | 1077.333 | 1458.730 | 68.746 | 211.857 | 122.238 | 1792.825 | 18,071.143 | |
| sd | 249.885 | 48.701 | 288.747 | 995.719 | 1262.173 | 58.133 | 306.788 | 125.413 | 1633.241 | 20,305.951 | |
| median | 448 | 58 | 562 | 631 | 1169 | 61 | 58 | 83 | 1310 | 8346 | |
| Q1 | 48 | 9.5 | 58.5 | 83.5 | 137.5 | 18 | 2.5 | 0.5 | 140.5 | 1258 | |
| Q3 | 555 | 100 | 647 | 2301 | 2929.5 | 98 | 262.5 | 234.5 | 3479.5 | 32,763 | |
| Emilia | sample size | 35 | 35 | 35 | 35 | 35 | 35 | 35 | 35 | 35 | 35 |
| mean | 2249.873 | 223.810 | 2473.683 | 5045.413 | 7519.095 | 388.095 | 2054.937 | 1348.746 | 10,922.778 | 52,816.127 | |
| sd | 162.468 | 28.585 | 188.984 | 673.216 | 843.362 | 40.047 | 137.073 | 109.628 | 1077.360 | 11,368.142 | |
| median | 2846 | 269 | 3122 | 5195 | 8850 | 350 | 792 | 1174 | 10,816 | 42,395 | |
| Q1 | 707 | 101 | 808 | 694.5 | 1502.5 | 206 | 34.5 | 99 | 1636 | 6067 | |
| Q3 | 3490.5 | 329.5 | 3823.5 | 9392 | 13,049.5 | 547.5 | 3520 | 2439 | 19,381.5 | 88,821.5 | |
| Friuli | sample size | 35 | 35 | 35 | 35 | 35 | 35 | 35 | 35 | 35 | 35 |
| mean | 116.841 | 25.476 | 142.317 | 619.778 | 762.095 | 46.302 | 424.492 | 98.746 | 1285.333 | 17,036.603 | |
| sd | 78.685 | 20.716 | 98.349 | 480.525 | 561.032 | 38.233 | 501.817 | 93.203 | 1087.776 | 17,808.502 | |
| median | 140 | 24 | 163 | 688 | 911 | 41 | 197 | 72 | 1223 | 10,721 | |
| Q1 | 20.5 | 5.5 | 27 | 83 | 110 | 14 | 6.5 | 4.5 | 121 | 1837.5 | |
| Q3 | 177.5 | 42.5 | 218 | 1123 | 1321 | 66.5 | 799 | 182 | 2371 | 28,891 | |
| Lazio | sample size | 35 | 35 | 35 | 35 | 35 | 35 | 35 | 35 | 35 | 35 |
| mean | 737.000 | 104.825 | 841.825 | 1152.556 | 1994.381 | 100.127 | 371.492 | 142.333 | 2508.206 | 36,767.063 | |
| sd | 566.172 | 82.268 | 647.447 | 1108.178 | 1733.590 | 68.227 | 432.751 | 139.154 | 2283.257 | 37,361.801 | |
| median | 878 | 113 | 991 | 844 | 1835 | 99 | 155 | 106 | 2096 | 63 | |
| Q1 | 61 | 16.5 | 75 | 37 | 112 | 28 | 15 | 6 | 133 | 3591 | |
| Q3 | 1254 | 186.5 | 1454.5 | 2229.5 | 3681.5 | 157 | 703.5 | 268 | 4653 | 63,505 | |
| Liguria | sample size | 35 | 35 | 35 | 35 | 35 | 35 | 35 | 35 | 35 | 35 |
| mean | 616.730 | 92.984 | 709.714 | 1069.889 | 1779.603 | 118.857 | 716.048 | 384.111 | 2879.762 | 11,983.048 | |
| sd | 448.690 | 62.407 | 508.265 | 1000.597 | 1428.992 | 80.617 | 881.009 | 378.883 | 2602.383 | 12,820.717 | |
| median | 761 | 102 | 874 | 875 | 2027 | 122 | 260 | 280 | 2567 | 7304 | |
| Q1 | 67 | 31.5 | 97 | 57.5 | 154.5 | 42.5 | 5 | 8 | 167.5 | 859.5 | |
| Q3 | 1027 | 149 | 1178 | 2106.5 | 3317 | 184 | 1254 | 721.5 | 5283.5 | 20,201 | |
| Lombardi | sample size | 35 | 35 | 35 | 35 | 35 | 35 | 35 | 35 | 35 | 35 |
| mean | 7544.905 | 842.306 | 8372.113 | 10,128.694 | 18,500.806 | 1160.694 | 8877.210 | 5497.323 | 32,875.339 | 11,1489.758 | |
| sd | 4403.531 | 443.647 | 4865.273 | 8412.344 | 12,634.922 | 671.258 | 7941.673 | 4831.205 | 25,165.184 | 97,350.121 | |
| median | 9266 | 935.5 | 10,479 | 9787 | 21,390 | 1157.5 | 7560 | 4667.5 | 33,617.5 | 84,689.5 | |
| Q1 | 3585.5 | 513 | 4098.5 | 1299.5 | 5126.5 | 780 | 898 | 542.5 | 6535.5 | 23,554 | |
| Q3 | 11,740.5 | 1219 | 13,004 | 16,754.5 | 29,894 | 1549.5 | 16,551.5 | 10,374.5 | 56,820 | 191,313.5 | |
| Marche | sample size | 35 | 35 | 35 | 35 | 35 | 35 | 35 | 35 | 35 | 35 |
| mean | 612.333 | 103.746 | 840.095 | 1718.381 | 2558.476 | 110.762 | 859.492 | 557.111 | 3975.079 | 18,888.698 | |
| sd | 378.014 | 94.687 | 1151.257 | 3262.427 | 4400.857 | 122.858 | 3100.359 | 1666.182 | 9097.186 | 43,559.955 | |
| median | 742 | 106 | 872 | 1652 | 2795 | 92 | 9 | 310 | 3114 | 8623 | |
| Q1 | 182 | 56 | 242 | 179 | 421 | 47.5 | 0 | 15.5 | 436.5 | 1546.5 | |
| Q3 | 947.5 | 140.5 | 1078 | 2300.5 | 3230.5 | 139 | 1188.5 | 685.5 | 5147.5 | 19,515 | |
| Molise | sample size | 35 | 35 | 35 | 35 | 35 | 35 | 35 | 35 | 35 | 35 |
| mean | 17.365 | 4.778 | 32.429 | 113.873 | 146.302 | 5.476 | 49.302 | 21.508 | 217.111 | 2093.238 | |
| sd | 12.129 | 7.349 | 89.911 | 324.486 | 413.371 | 8.942 | 240.871 | 109.997 | 762.507 | 6553.059 | |
| median | 21 | 4 | 29 | 46 | 81 | 3 | 14 | 8 | 103 | 670 | |
| Q1 | 4 | 2 | 6.5 | 8 | 15 | 0 | 0 | 0 | 15.5 | 229 | |
| Q3 | 27 | 6 | 33.5 | 161 | 193 | 6 | 38 | 13.5 | 244.5 | 2135 | |
| Piemonte | sample size | 35 | 35 | 35 | 35 | 35 | 35 | 35 | 35 | 35 | 35 |
| mean | 2004.476 | 246.460 | 2205.762 | 4051.143 | 6256.905 | 387.778 | 1145.937 | 830.667 | 8233.508 | 33,106.302 | |
| sd | 1412.884 | 167.620 | 1589.582 | 4300.008 | 5660.761 | 277.052 | 1749.509 | 914.100 | 8134.870 | 38,023.991 | |
| median | 2633 | 293 | 2925 | 2631 | 5556 | 490 | 75 | 449 | 6024 | 16,655 | |
| Q1 | 312.5 | 70.5 | 383 | 75.5 | 458 | 71.5 | 0 | 19 | 477 | 2402.5 | |
| Q3 | 3285 | 389 | 3613 | 8018 | 11,873 | 590 | 2054.5 | 1582.5 | 15,510 | 60,017 | |
| Puglia | sample size | 35 | 35 | 35 | 35 | 35 | 35 | 35 | 35 | 35 | 35 |
| mean | 339.349 | 50.921 | 428.397 | 1033.302 | 1461.698 | 68.349 | 223.746 | 163.587 | 1849.032 | 17,381.683 | |
| sd | 264.156 | 47.506 | 454.876 | 1681.225 | 2109.020 | 62.838 | 819.326 | 364.631 | 3249.349 | 22,393.542 | |
| median | 464 | 55 | 517 | 610 | 1095 | 70 | 22 | 65 | 1182 | 9191 | |
| Q1 | 33 | 3.5 | 38 | 25 | 63 | 12 | 1 | 4 | 68 | 828 | |
| Q3 | 593 | 74.5 | 668 | 1663.5 | 2369 | 97 | 242 | 245.5 | 2856.5 | 28,637.5 | |
| Sardegna | sample size | 35 | 35 | 35 | 35 | 35 | 35 | 35 | 35 | 35 | 35 |
| mean | 66.063 | 14.333 | 86.254 | 392.190 | 478.444 | 20.746 | 80.698 | 38.302 | 597.444 | 6286.794 | |
| sd | 48.419 | 11.939 | 80.488 | 404.945 | 483.277 | 21.714 | 127.515 | 58.416 | 647.390 | 8671.555 | |
| median | 90 | 19 | 110 | 350 | 462 | 14 | 13 | 19 | 494 | 3461 | |
| Q1 | 9.5 | 0 | 9.5 | 19 | 28.5 | 3 | 0 | 0 | 28.5 | 243.5 | |
| Q3 | 110.5 | 24 | 134.5 | 693.5 | 820 | 30.5 | 124 | 71 | 1077 | 9782 | |
| Sicilia | sample size | 35 | 35 | 35 | 35 | 35 | 35 | 35 | 35 | 35 | 35 |
| mean | 291.683 | 36.825 | 328.508 | 717.778 | 1046.286 | 48.492 | 117.032 | 75.238 | 1238.556 | 18,631.270 | |
| sd | 235.386 | 28.512 | 259.761 | 664.821 | 906.990 | 39.304 | 156.846 | 82.626 | 1119.763 | 20,974.102 | |
| median | 346 | 39 | 414 | 658 | 1095 | 45 | 36 | 33 | 1164 | 9658 | |
| Q1 | 21 | 1.5 | 21.5 | 49 | 70.5 | 16.5 | 2 | 0 | 72.5 | 1074.5 | |
| Q3 | 523.5 | 62.5 | 570.5 | 1359 | 1984 | 70.5 | 198 | 151 | 2333 | 32,471.5 | |
| Toscana | sample size | 35 | 35 | 35 | 35 | 35 | 35 | 35 | 35 | 35 | 35 |
| mean | 614.079 | 157.556 | 771.635 | 2347.889 | 3119.524 | 145.190 | 384.857 | 244.825 | 3749.206 | 38,949.286 | |
| sd | 443.947 | 106.565 | 548.316 | 2159.489 | 2600.205 | 102.694 | 596.281 | 261.543 | 3318.192 | 41,645.213 | |
| median | 791 | 182 | 959 | 1677 | 2973 | 151 | 95 | 158 | 3226 | 20,952 | |
| Q1 | 95.5 | 47 | 136 | 151 | 287 | 54.5 | 4 | 1 | 292 | 2688.5 | |
| Q3 | 1006.5 | 253.5 | 1258.5 | 4656.5 | 5907 | 221.5 | 475 | 460.5 | 6842.5 | 73,878.5 | |
| Trento | sample size | 35 | 35 | 35 | 35 | 35 | 35 | 35 | 35 | 35 | 35 |
| mean | 194.635 | 36.540 | 231.175 | 794.032 | 1025.206 | 61.810 | 364.571 | 140.905 | 1530.683 | 8887.032 | |
| sd | 141.717 | 29.422 | 170.261 | 682.862 | 828.585 | 49.140 | 511.393 | 147.494 | 1397.661 | 9902.902 | |
| median | 235 | 38 | 279 | 728 | 1094 | 64 | 117 | 86 | 1297 | 4600 | |
| Q1 | 23.5 | 3.5 | 27 | 35 | 62 | 9.5 | 2.5 | 0 | 64.5 | 463 | |
| Q3 | 330.5 | 65.5 | 390 | 1539.5 | 1872.5 | 97.5 | 584.5 | 279.5 | 2893 | 15,813.5 | |
| Umbria | sample size | 35 | 35 | 35 | 35 | 35 | 35 | 35 | 35 | 35 | 35 |
| mean | 83.111 | 24.143 | 107.254 | 304.810 | 412.063 | 21.714 | 266.556 | 25.857 | 704.476 | 9377.429 | |
| sd | 63.988 | 17.534 | 81.024 | 255.039 | 334.552 | 26.258 | 349.658 | 24.549 | 574.593 | 10,190.101 | |
| median | 97 | 24 | 121 | 282 | 407 | 9 | 12 | 20 | 802 | 5428 | |
| Q1 | 7.5 | 3.5 | 63 | 29.5 | 40.5 | 2 | 1 | 0 | 41.5 | 300 | |
| Q3 | 140.5 | 41 | 180.5 | 557 | 737.5 | 32 | 516 | 52 | 1305.5 | 16,993 | |
| ValleAosta | sample size | 35 | 35 | 35 | 35 | 35 | 35 | 35 | 35 | 35 | 35 |
| mean | 59.381 | 10.635 | 70.016 | 238.905 | 308.921 | 17.556 | 122.937 | 50.651 | 482.508 | 1841.619 | |
| sd | 45.414 | 9.612 | 53.000 | 190.234 | 242.055 | 20.339 | 190.354 | 52.707 | 422.643 | 1872.617 | |
| median | 71 | 9 | 89 | 280 | 375 | 7 | 2 | 28 | 408 | 1203 | |
| Q1 | 3 | 0 | 0 | 16 | 18 | 1 | 0 | 0.5 | 18.5 | 94 | |
| Q3 | 97.5 | 20 | 116.5 | 432.5 | 548.5 | 29 | 187.5 | 107 | 890.5 | 3396 | |
| Veneto | sample size | 35 | 35 | 35 | 35 | 35 | 35 | 35 | 35 | 35 | 35 |
| mean | 933.127 | 22.127 | 103.540 | 295.921 | 399.460 | 19.635 | 266.048 | 26.000 | 691.508 | 9239.238 | |
| sd | 625.491 | 19.072 | 83.886 | 261.567 | 343.965 | 25.194 | 350.048 | 24.410 | 586.796 | 10,305.636 | |
| median | 1189 | 22 | 121 | 278 | 407 | 7 | 12 | 20 | 802 | 5428 | |
| Q1 | 233 | 67.5 | 300.5 | 561 | 861.5 | 119.5 | 50.5 | 27.5 | 939.5 | 19,021.5 | |
| Q3 | 1456 | 283 | 1748 | 8361 | 9945 | 415 | 2084.5 | 812 | 13,594.5 | 185,806 |
| Regions | Population Density People per km | Intensive Care Beds |
|---|---|---|
| Abruzzo | 121 | 73 |
| Basilicata | 56 | 49 |
| Bolzano | 71 | 48 |
| Calabria | 128 | 107 |
| Campania | 424 | 350 |
| Emilia | 199 | 650 |
| Friuli | 153 | 494 |
| Lazio | 341 | 540 |
| Liguria | 286 | 75 |
| Lombardi | 422 | 1067 |
| Marche | 162 | 400 |
| Molise | 69 | 30 |
| Piemonte | 172 | 320 |
| Puglia | 206 | 320 |
| Sardegna | 68 | 150 |
| Sicilia | 194 | 441 |
| Toscana | 162 | 447 |
| Trento | 79 | 75 |
| Umbria | 104 | 69 |
| ValleAosta | 39 | 15 |
| Veneto | 267 | 498 |
| Hospitalized with Symptoms | Intensive Care | Home Isolation | Total Currently Positive | Discharged/Healed | Deceased | Total Cases | Swabs | |
|---|---|---|---|---|---|---|---|---|
| Population Density | p-value > 0.05 | p-value > 0.05 | p-value > 0.05 | p-value > 0.05 | p-value > 0.05 | p-value > 0.05 | p-value > 0.05 | p-value > 0.05 |
| Bed | p-value > 0.05 | p-value > 0.05 | p-value > 0.05 | p-value > 0.05 | p-value > 0.05 | p-value > 0.05 | p-value > 0.05 | p-value > 0.05 |
| R2 | 0.617 | 0.631 | 0.685 | 0.666 | 0.504 | 0.544 | 0.627 | 0.318 |
© 2020 by the authors. Licensee MDPI, Basel, Switzerland. This article is an open access article distributed under the terms and conditions of the Creative Commons Attribution (CC BY) license (http://creativecommons.org/licenses/by/4.0/).
Share and Cite
Milano, M.; Cannataro, M. Statistical and Network-Based Analysis of Italian COVID-19 Data: Communities Detection and Temporal Evolution. Int. J. Environ. Res. Public Health 2020, 17, 4182. https://doi.org/10.3390/ijerph17124182
Milano M, Cannataro M. Statistical and Network-Based Analysis of Italian COVID-19 Data: Communities Detection and Temporal Evolution. International Journal of Environmental Research and Public Health. 2020; 17(12):4182. https://doi.org/10.3390/ijerph17124182
Chicago/Turabian StyleMilano, Marianna, and Mario Cannataro. 2020. "Statistical and Network-Based Analysis of Italian COVID-19 Data: Communities Detection and Temporal Evolution" International Journal of Environmental Research and Public Health 17, no. 12: 4182. https://doi.org/10.3390/ijerph17124182
APA StyleMilano, M., & Cannataro, M. (2020). Statistical and Network-Based Analysis of Italian COVID-19 Data: Communities Detection and Temporal Evolution. International Journal of Environmental Research and Public Health, 17(12), 4182. https://doi.org/10.3390/ijerph17124182