Analysis of Mortality Change Rate from Temperature in Summer by Age, Occupation, Household Type, and Chronic Diseases in 229 Korean Municipalities from 2007–2016


Abstract
1. Introduction
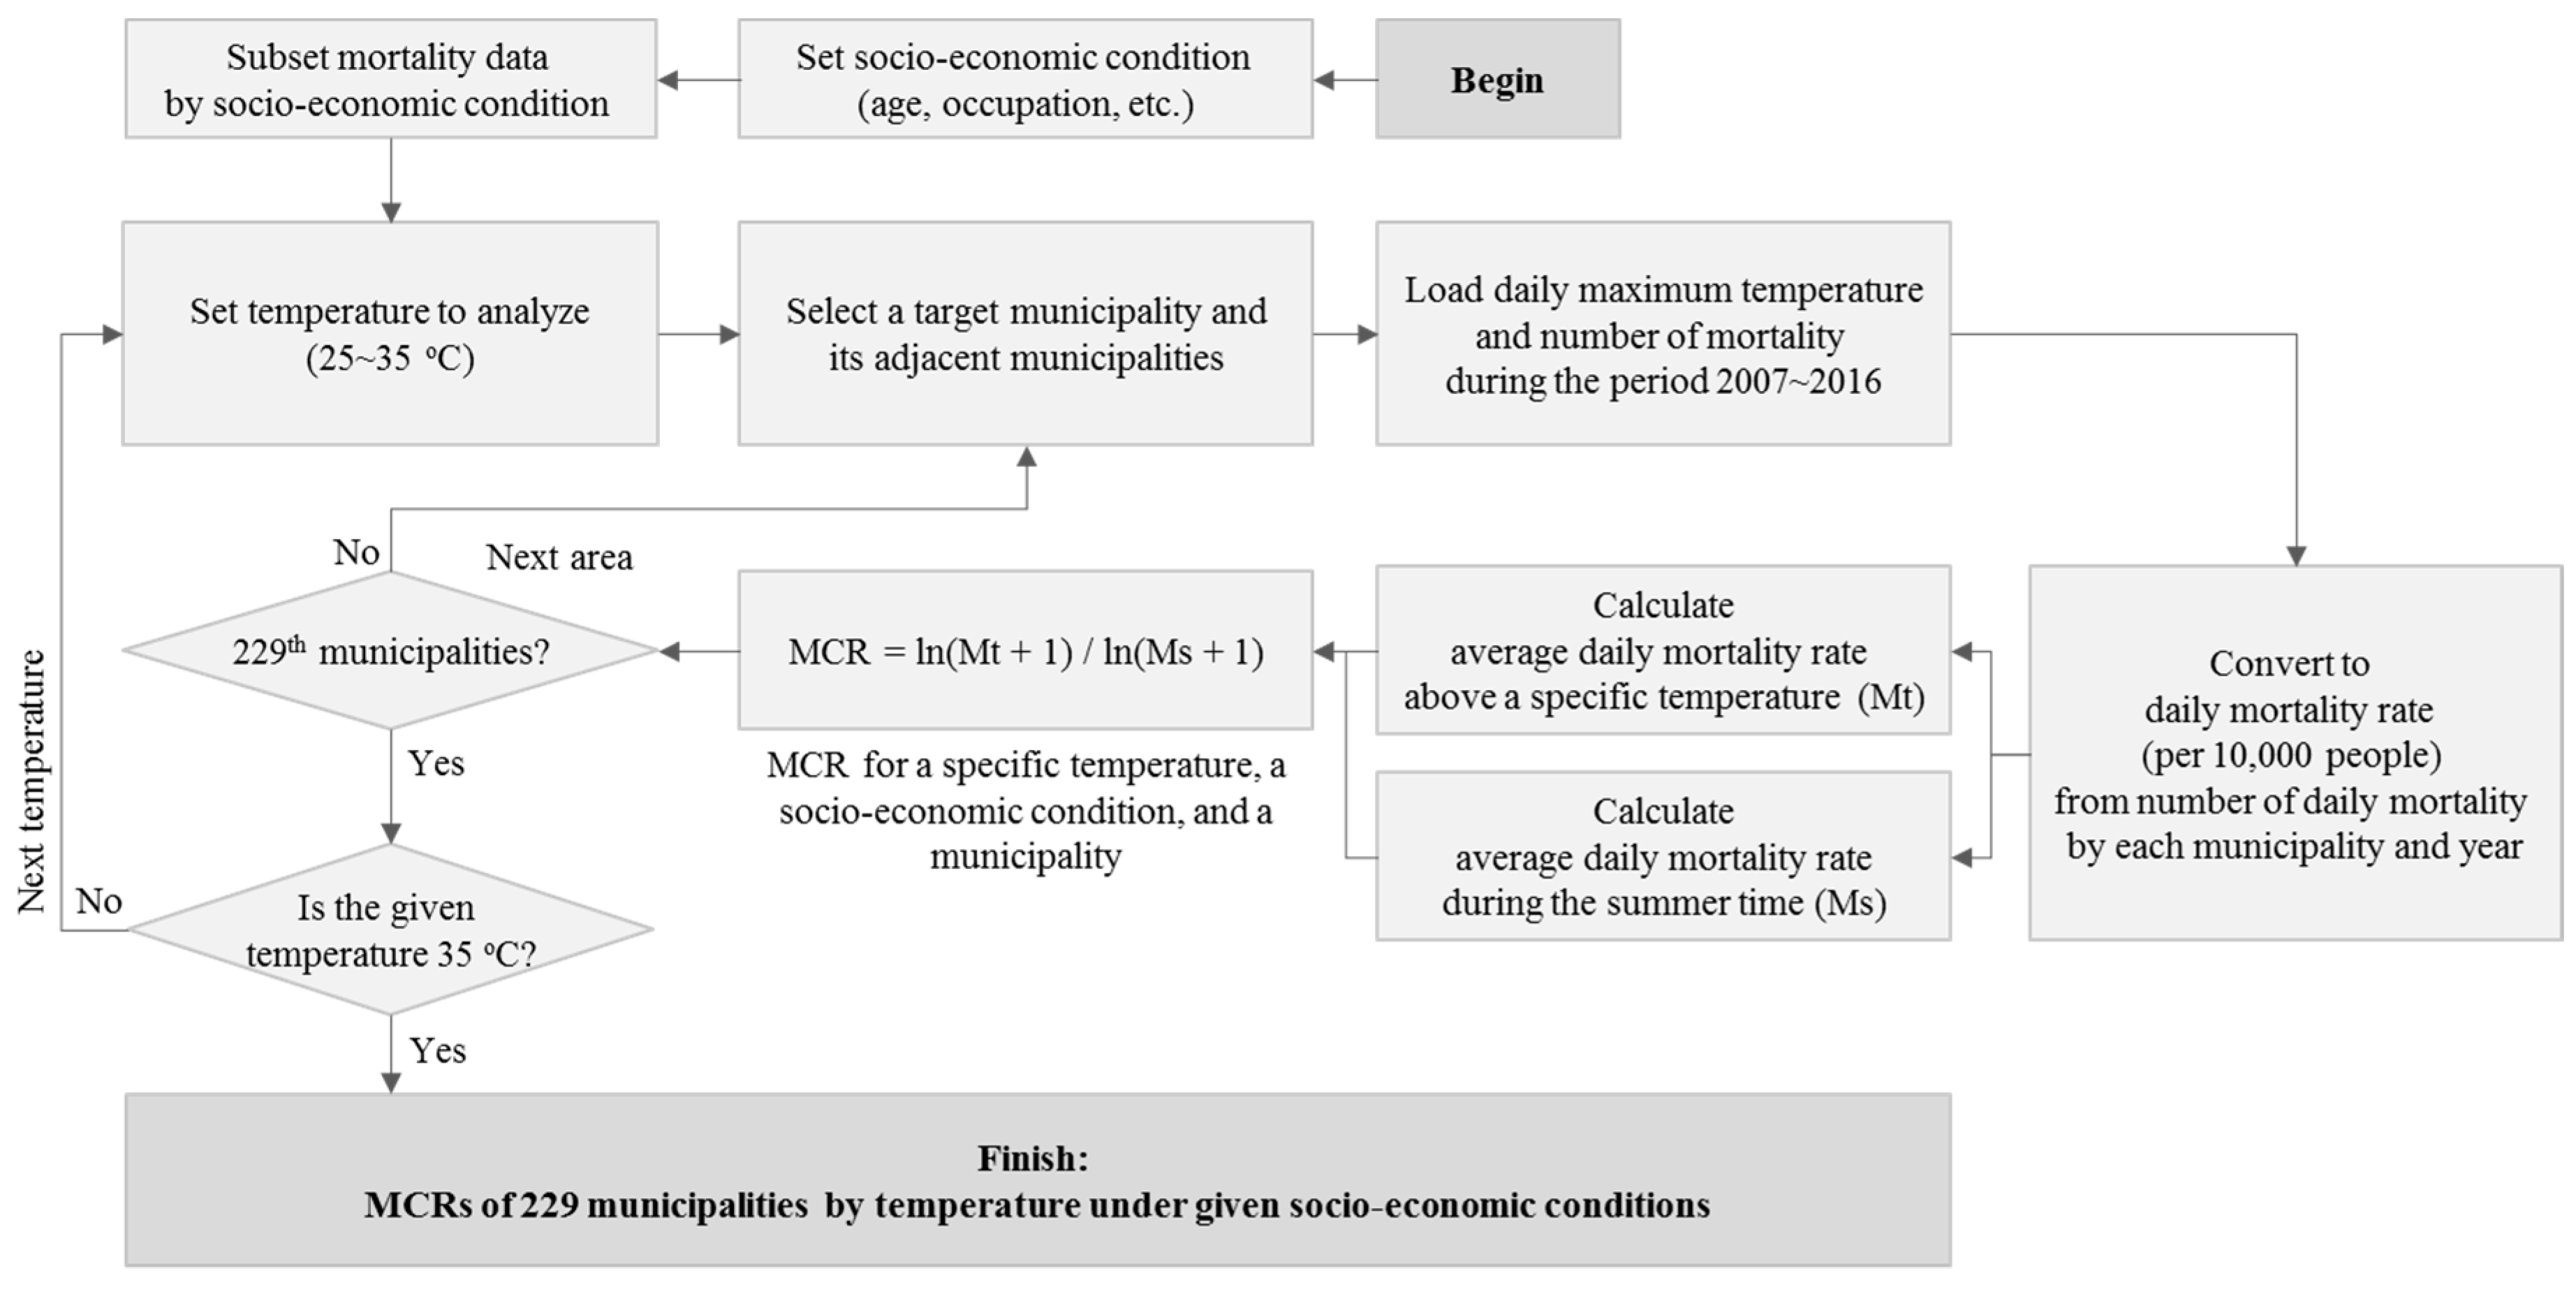
2. Methods
3. Results
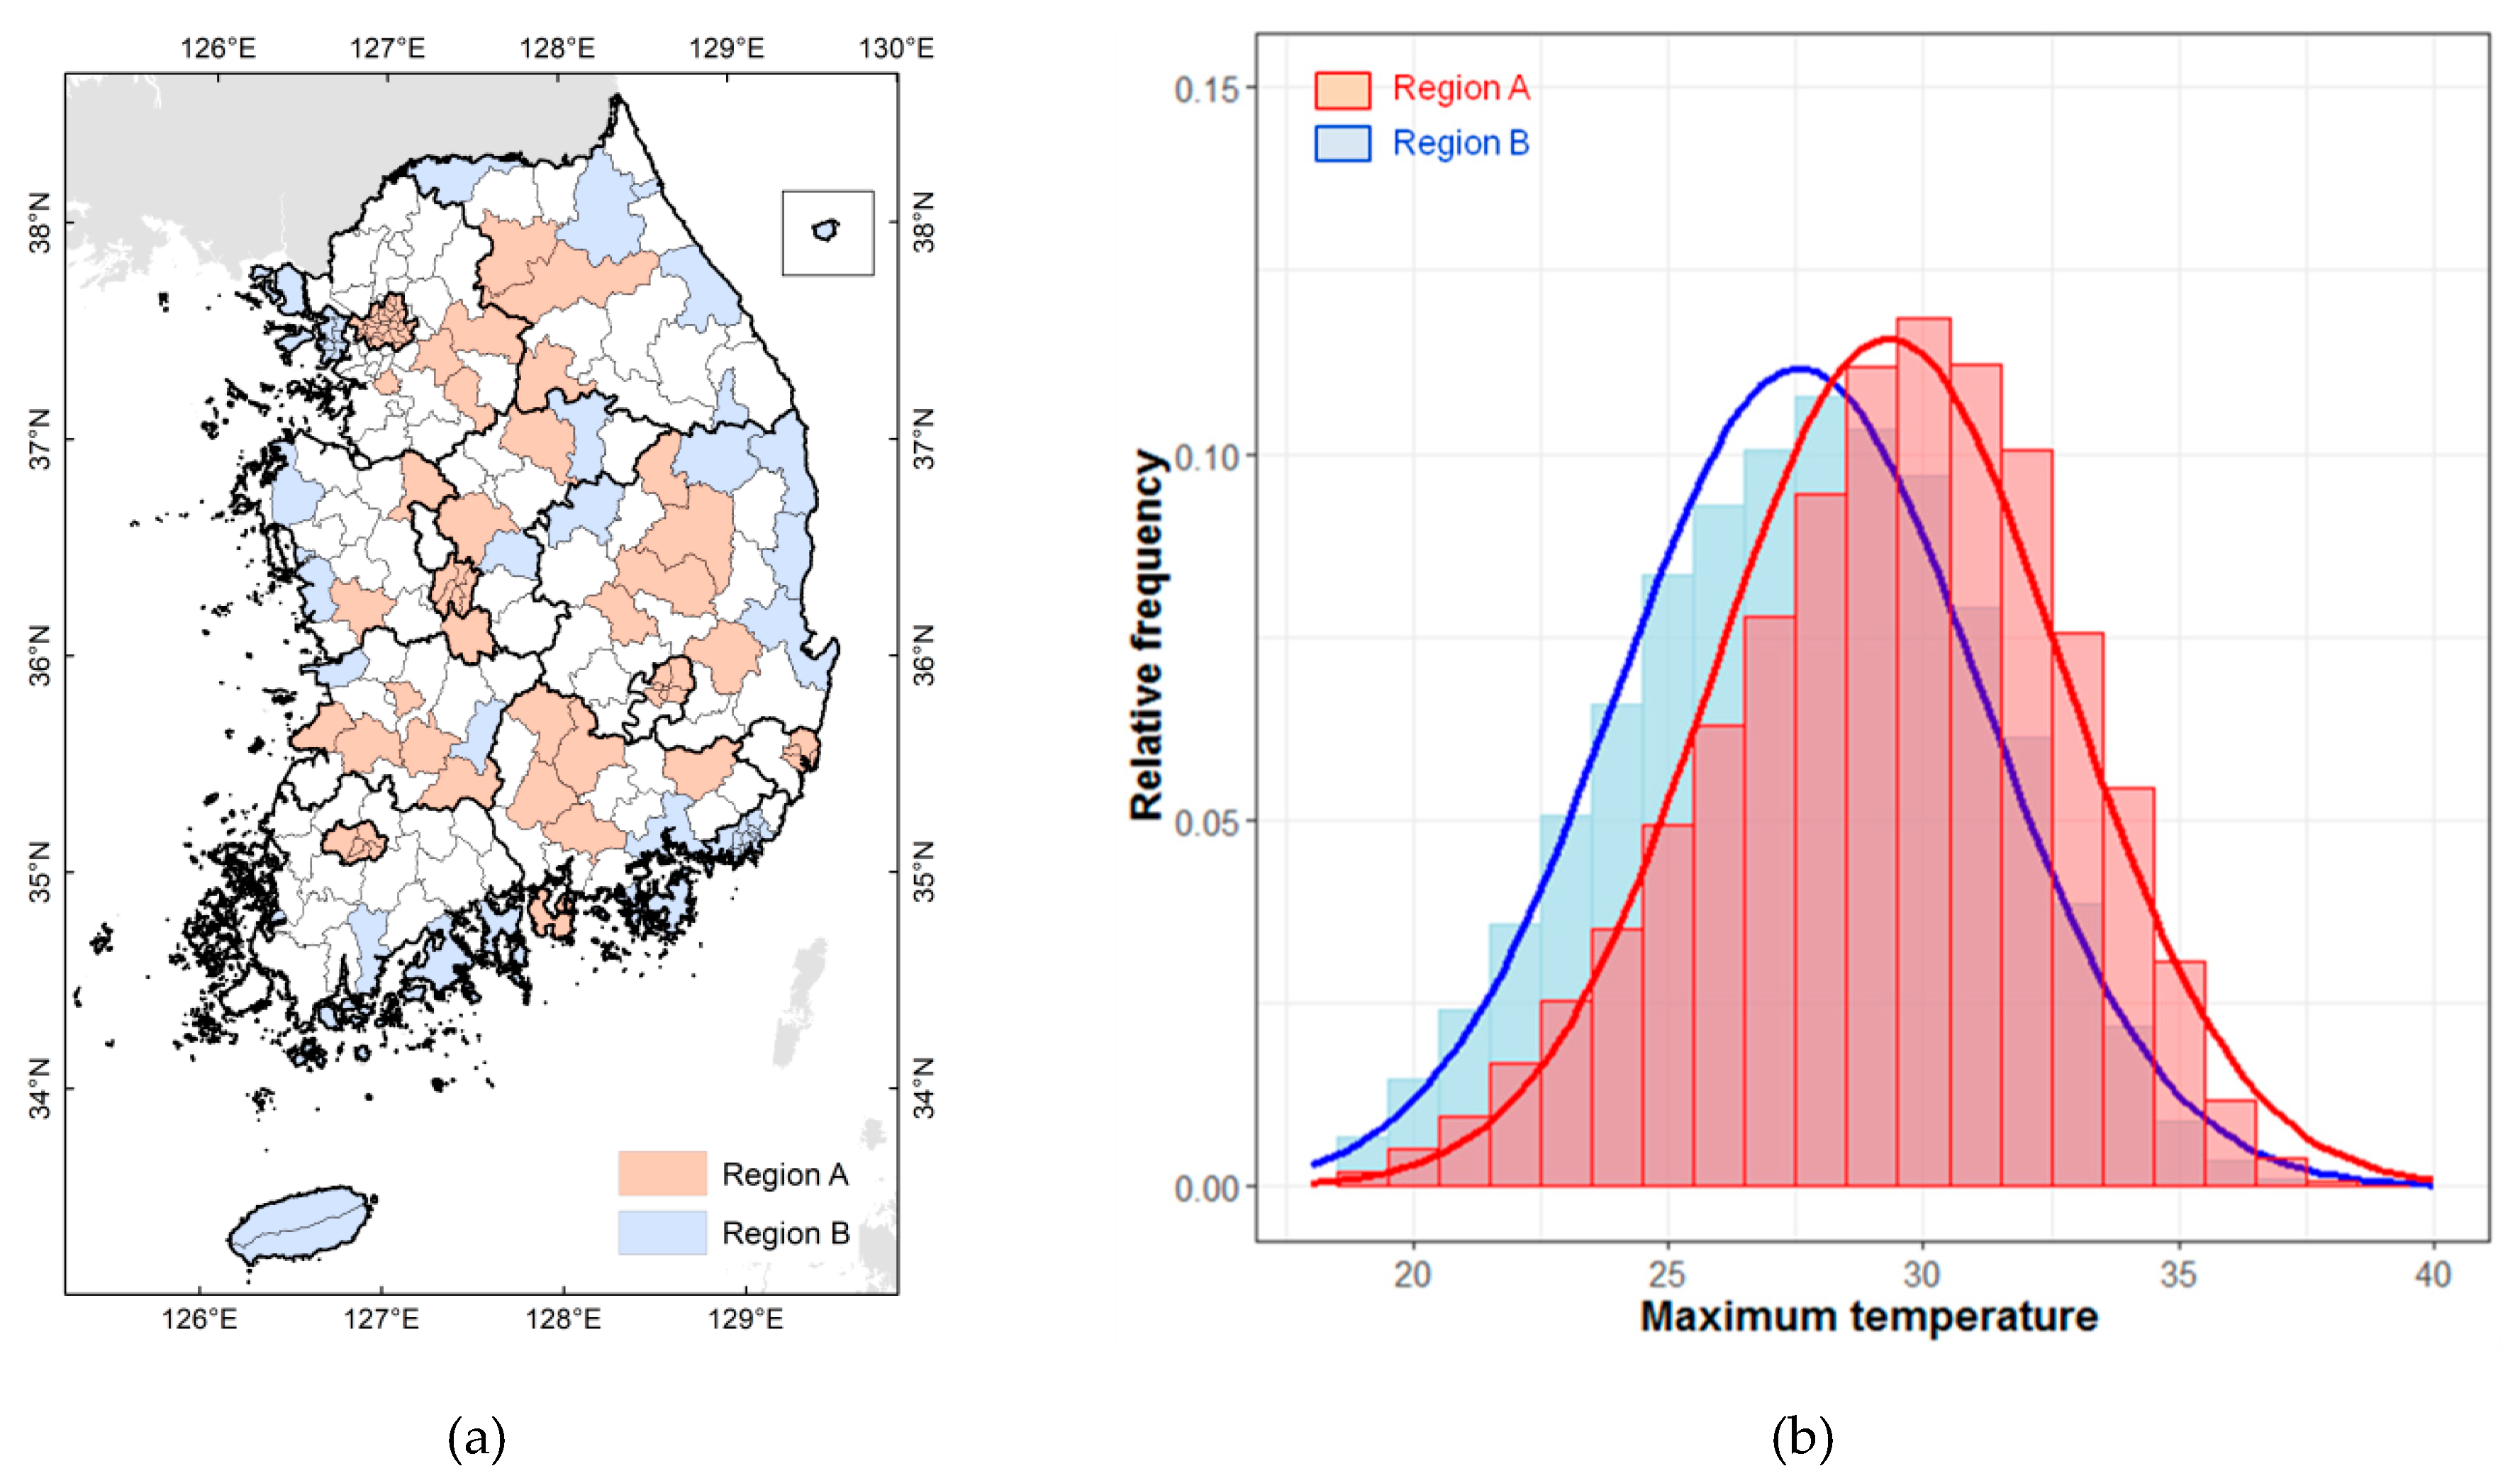
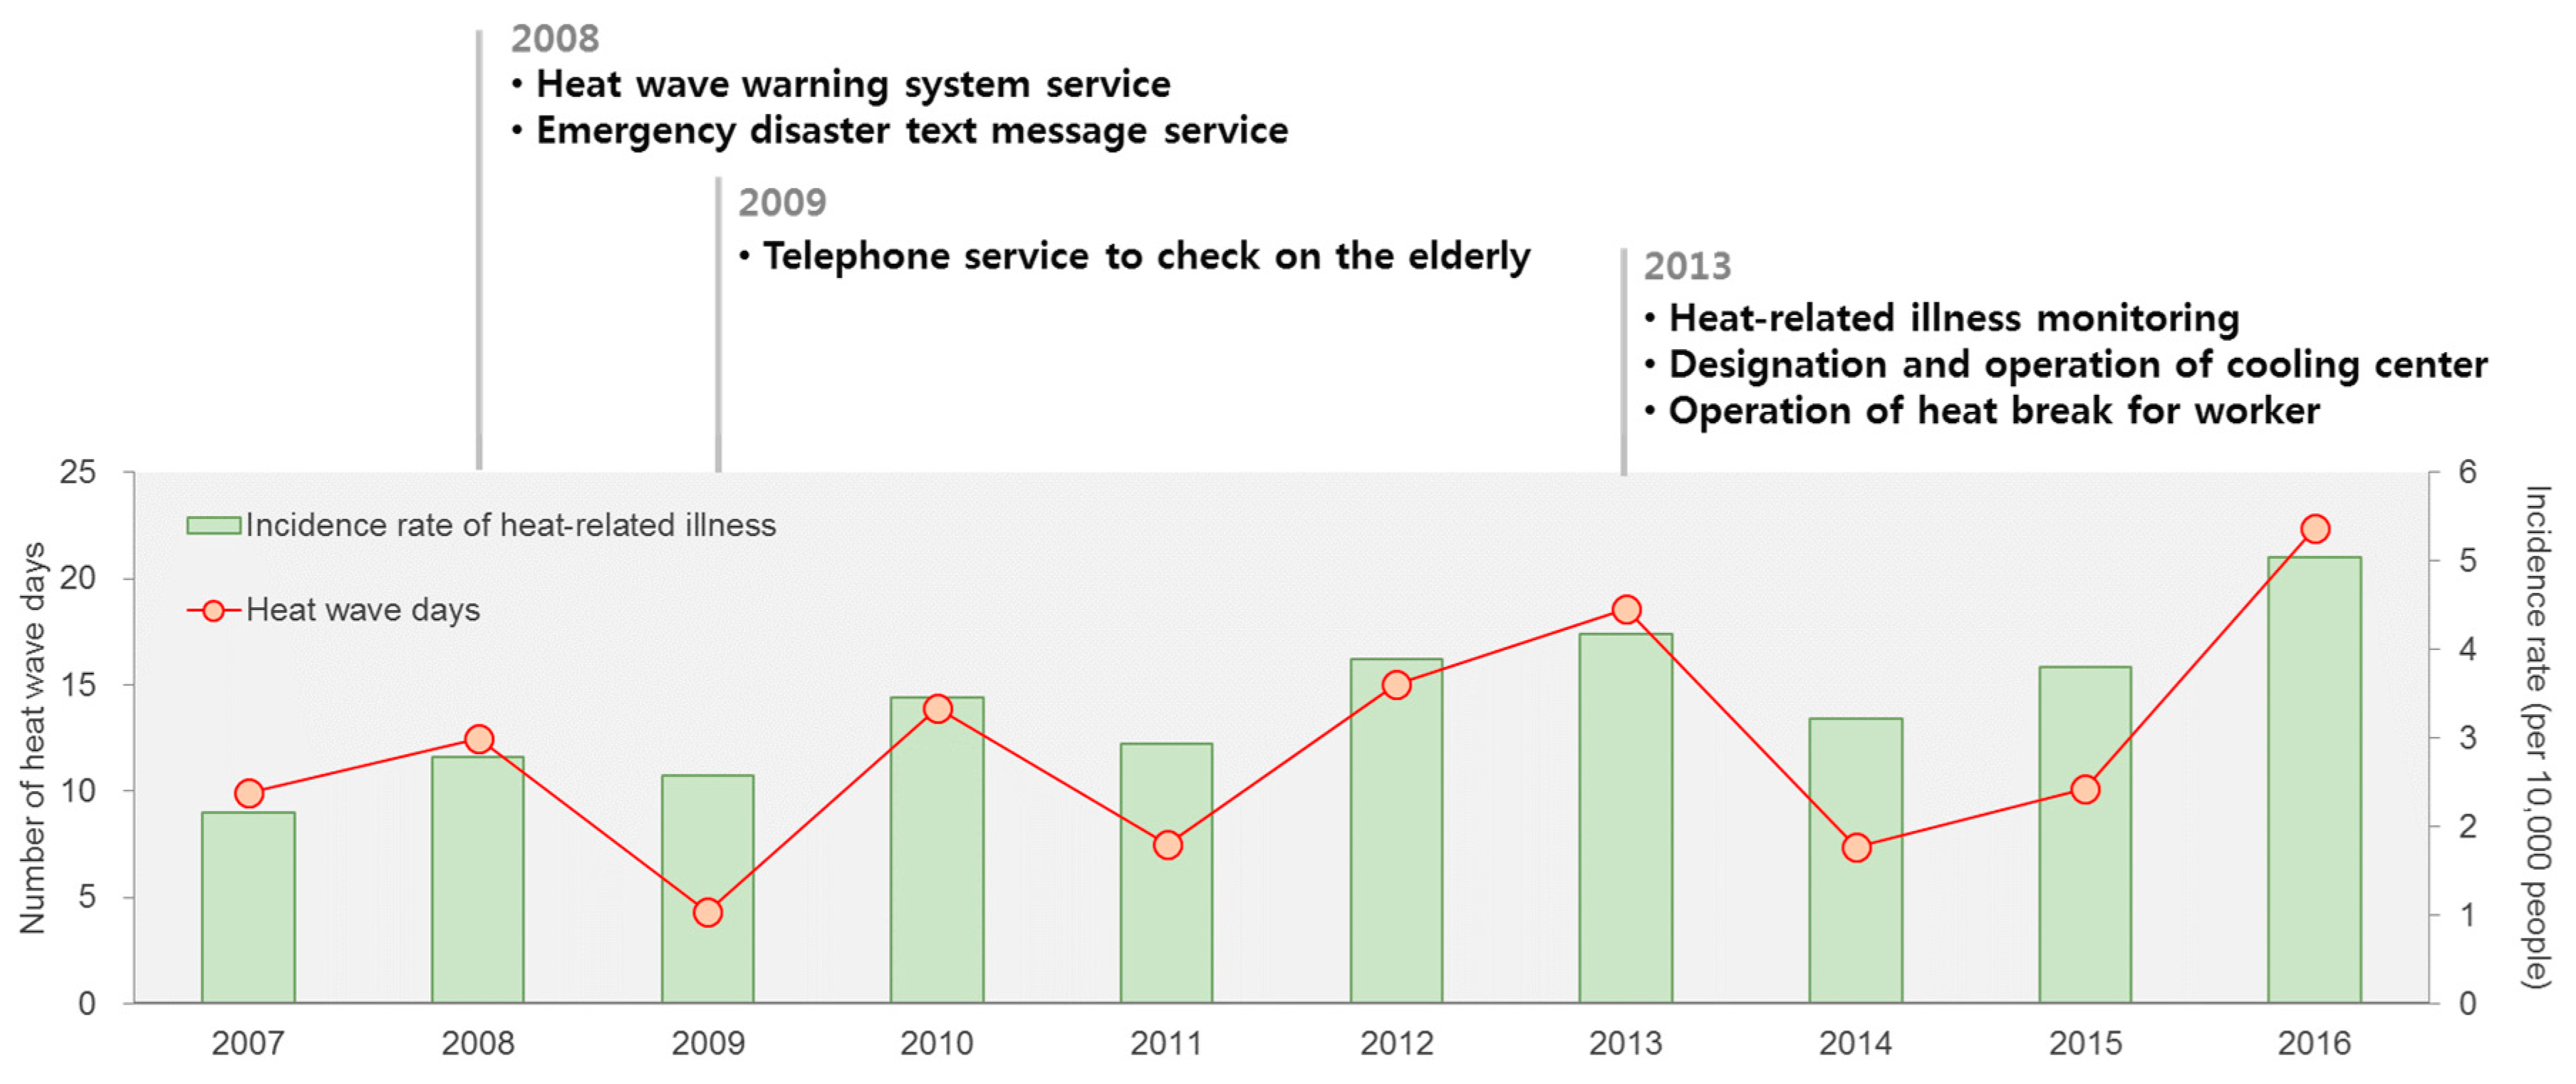
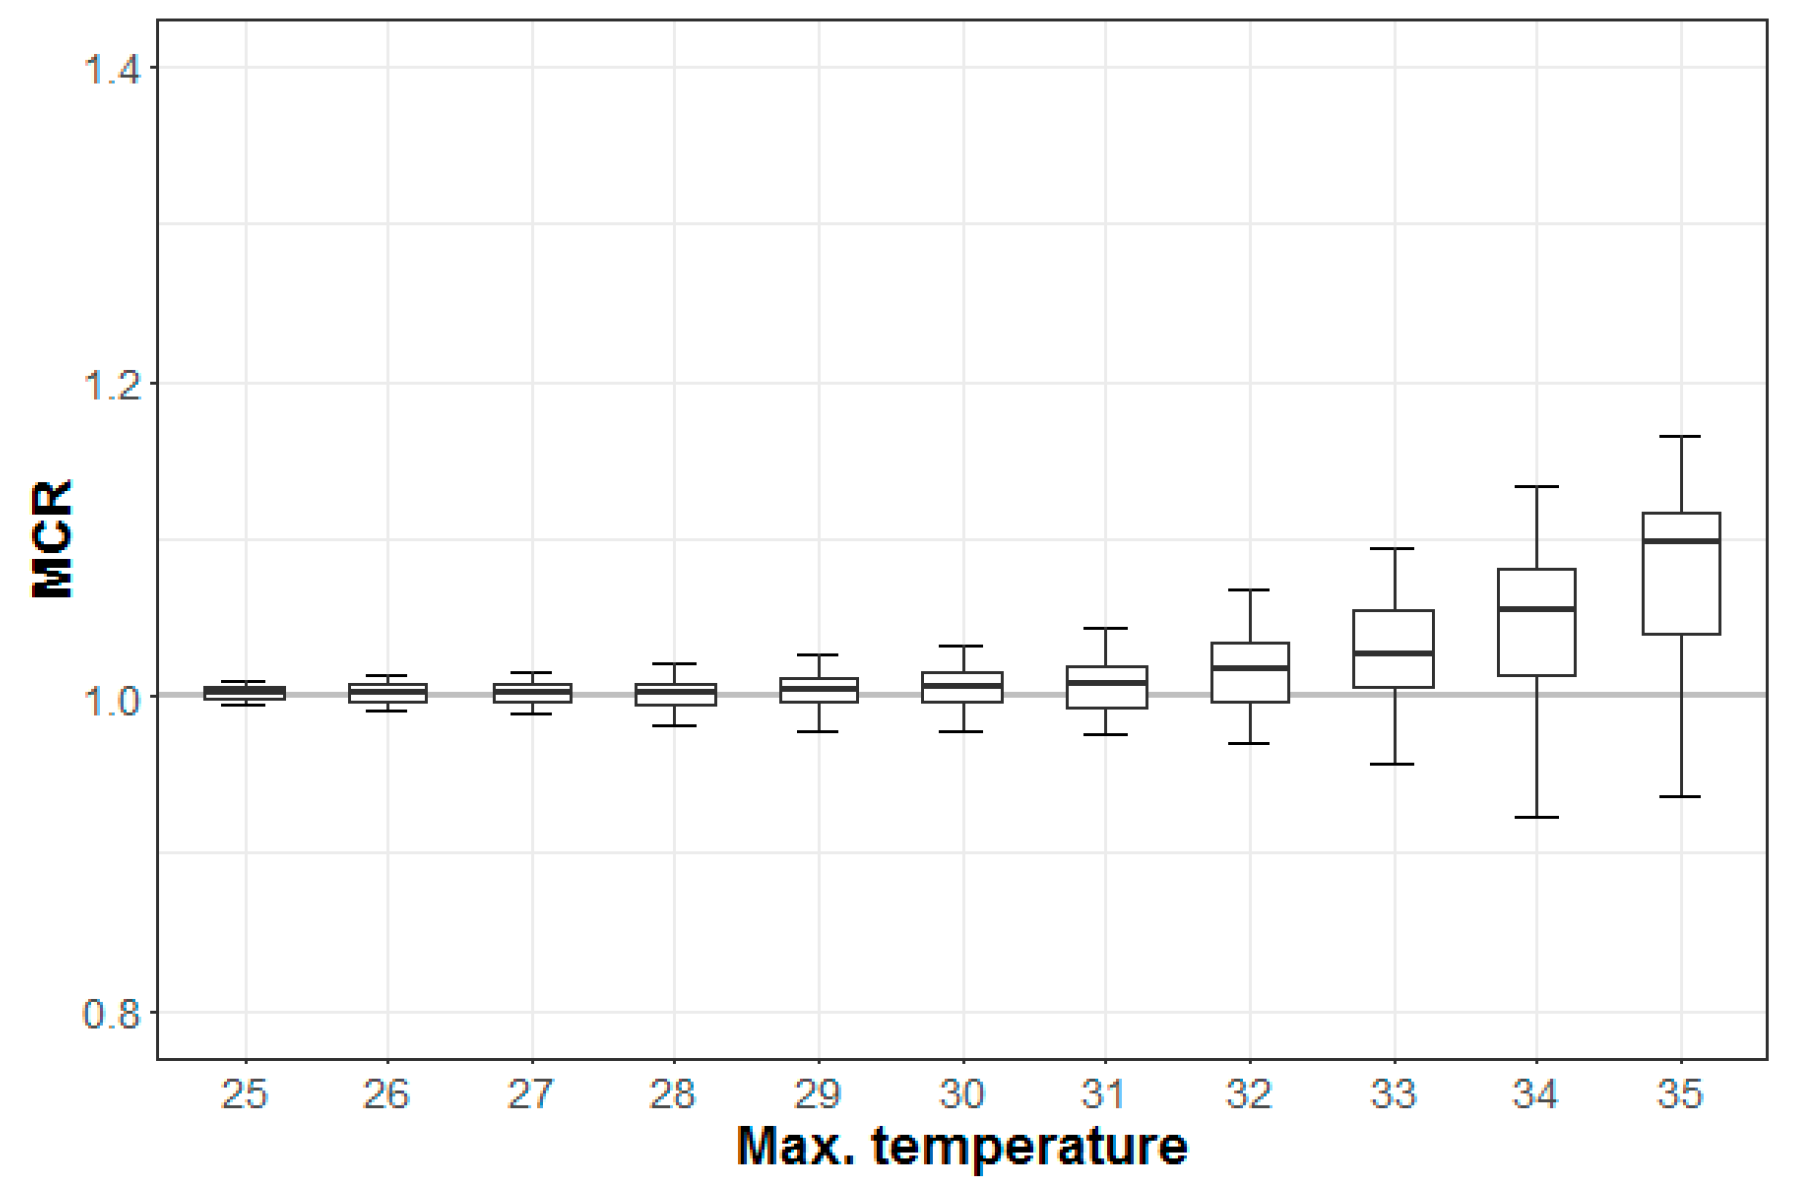
3.1. Impacts of Temperature in South Korea
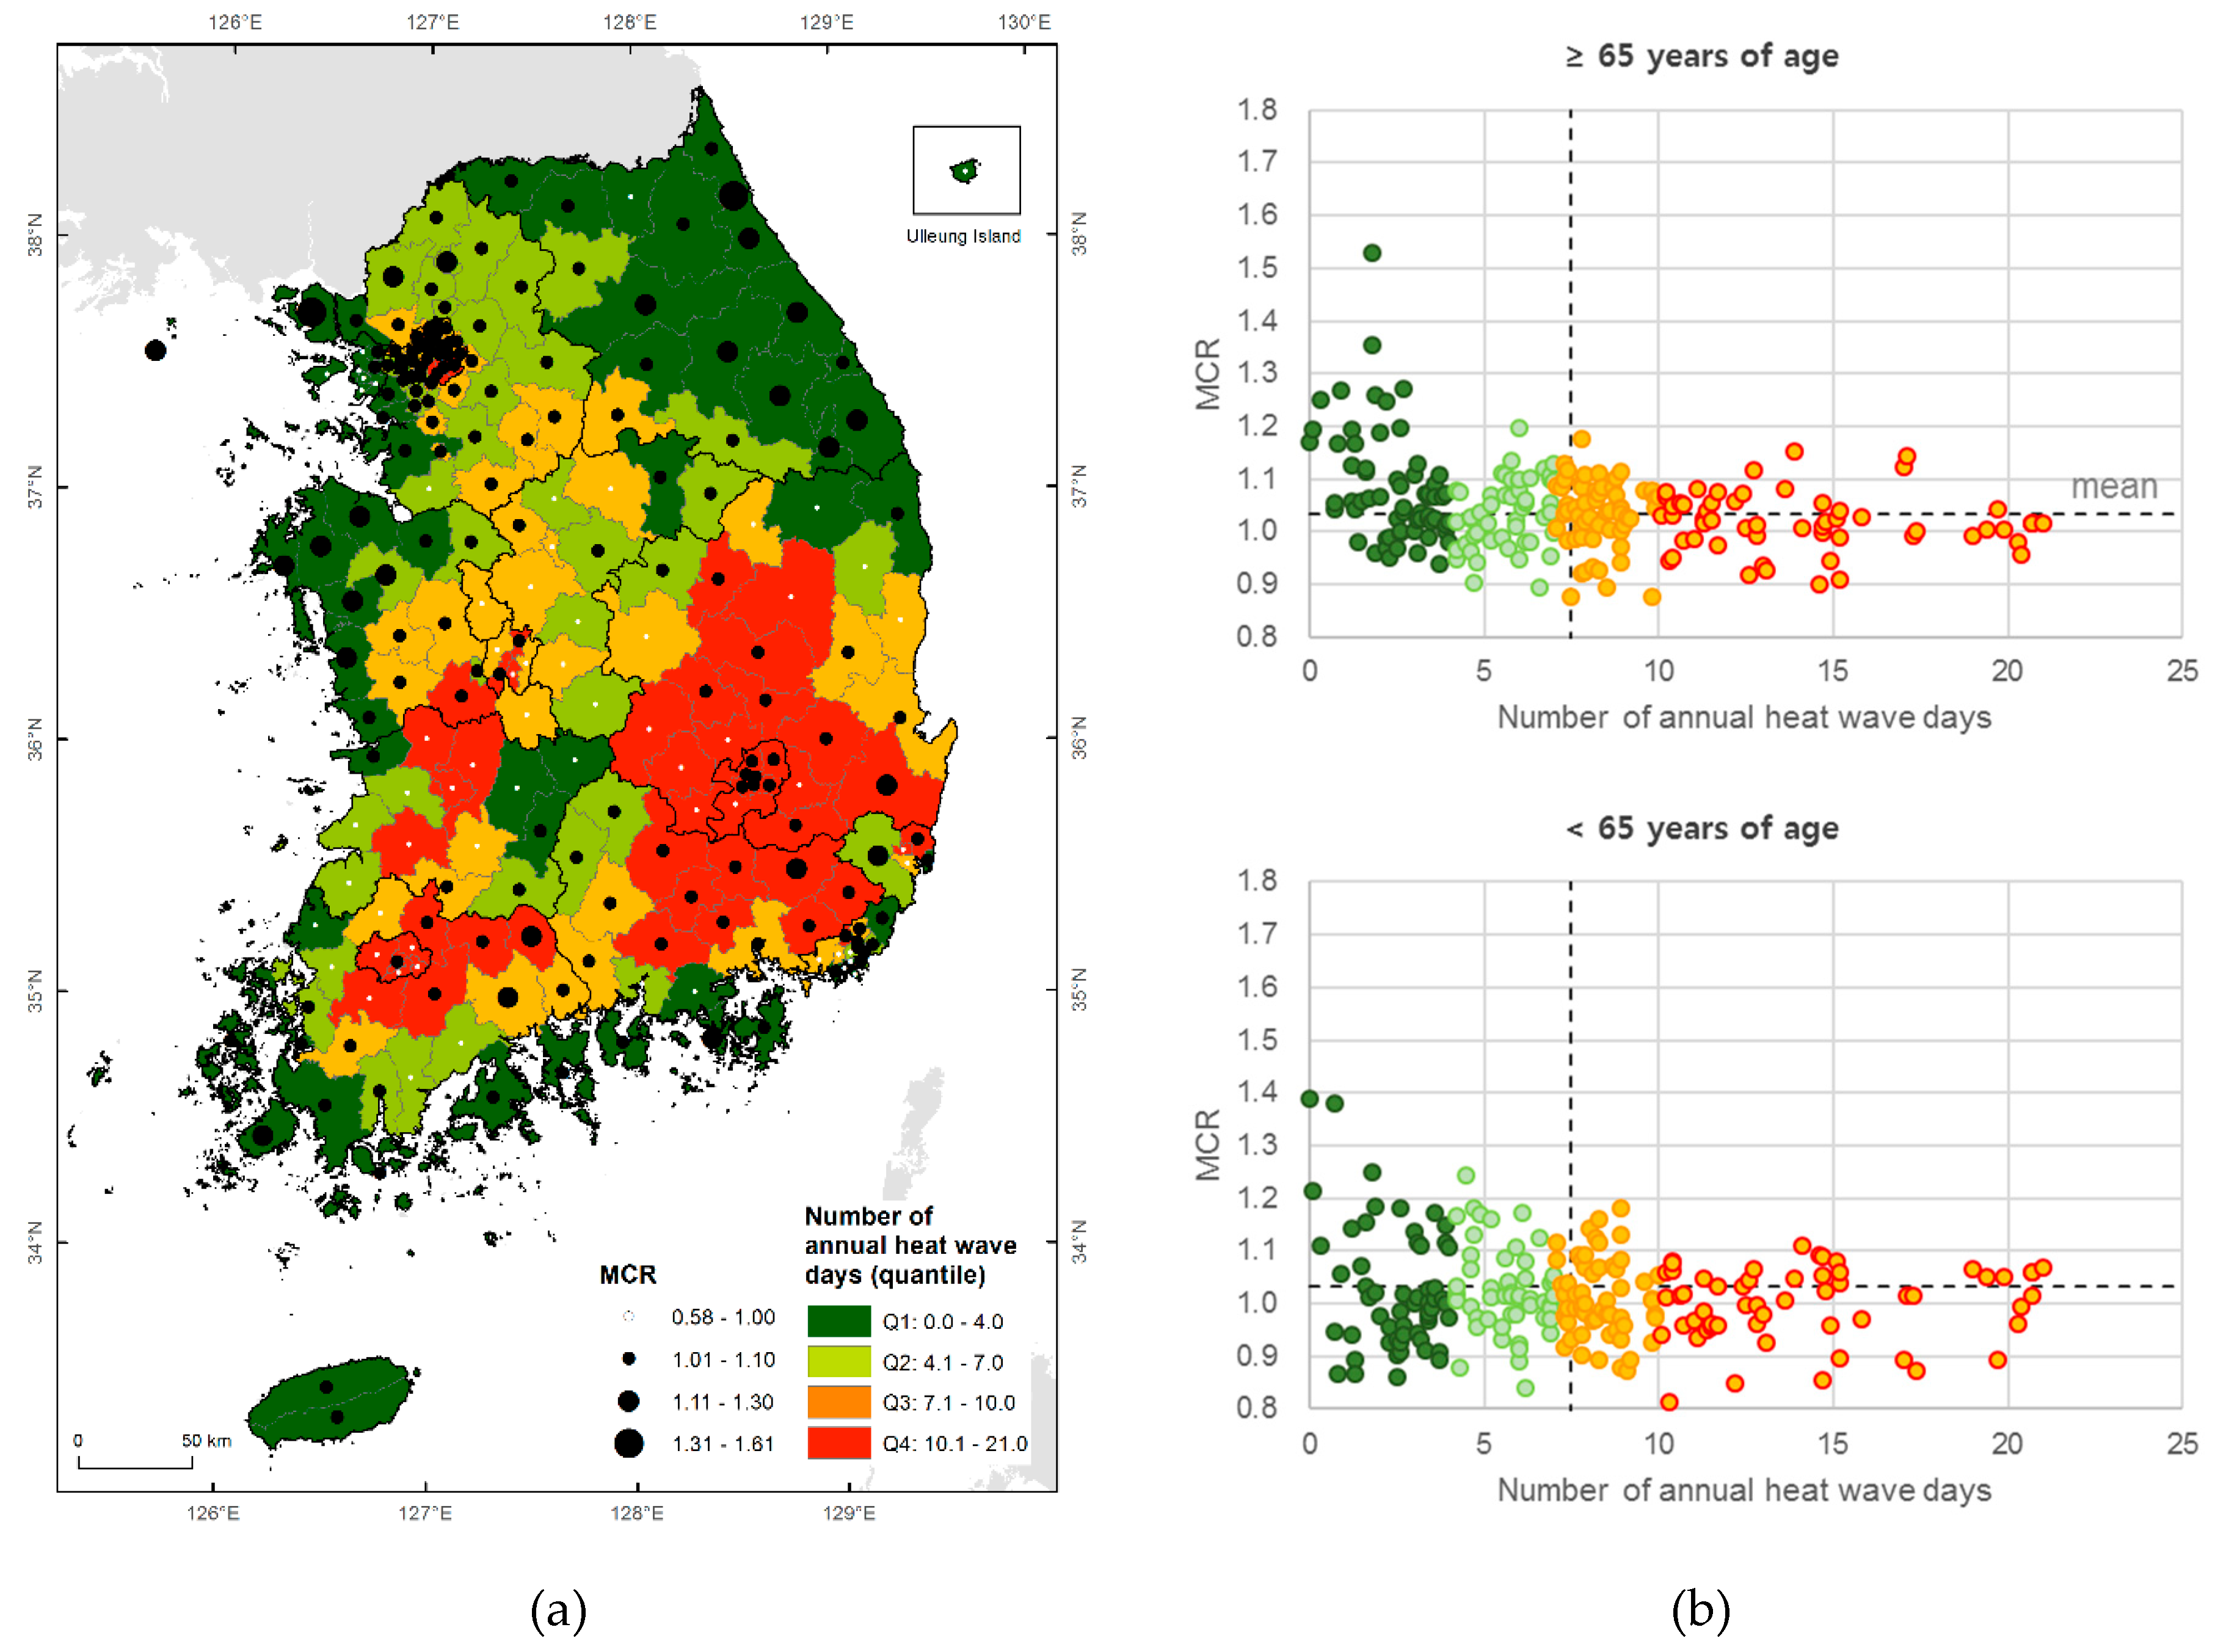
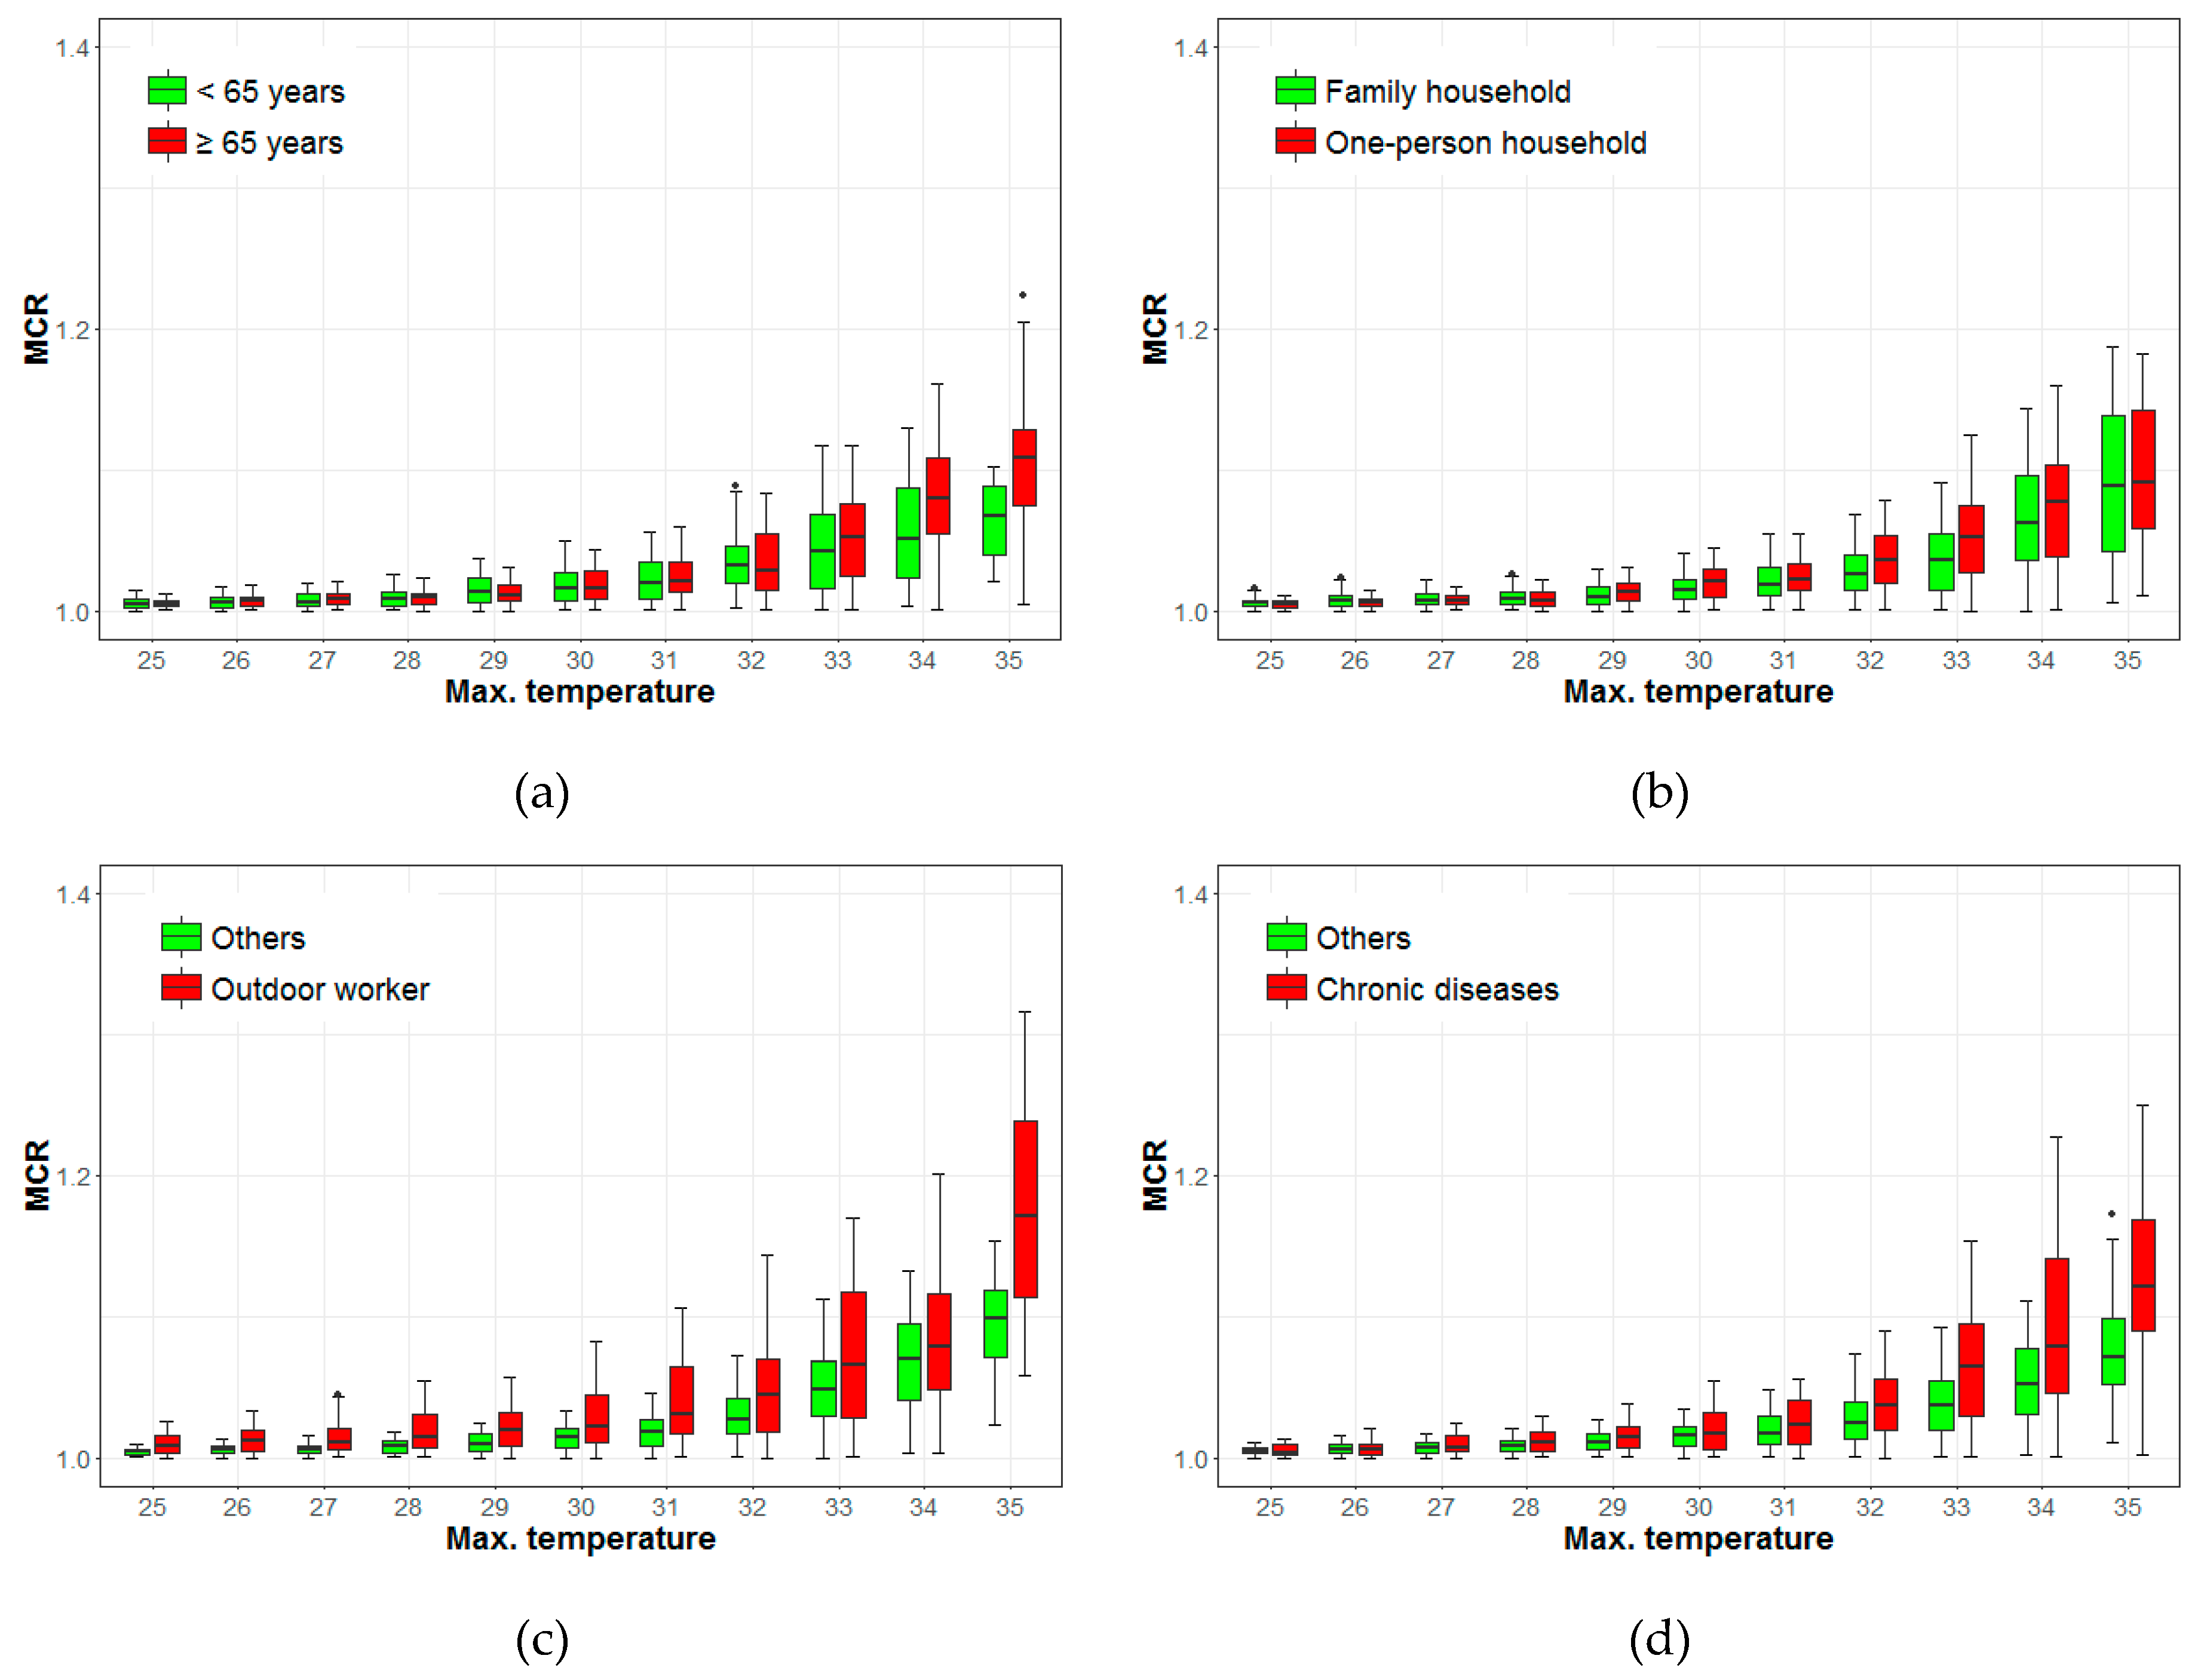
3.2. Mortality Change Rate (MCR) by Age, Occupation, Household Type, and Chronic Disease
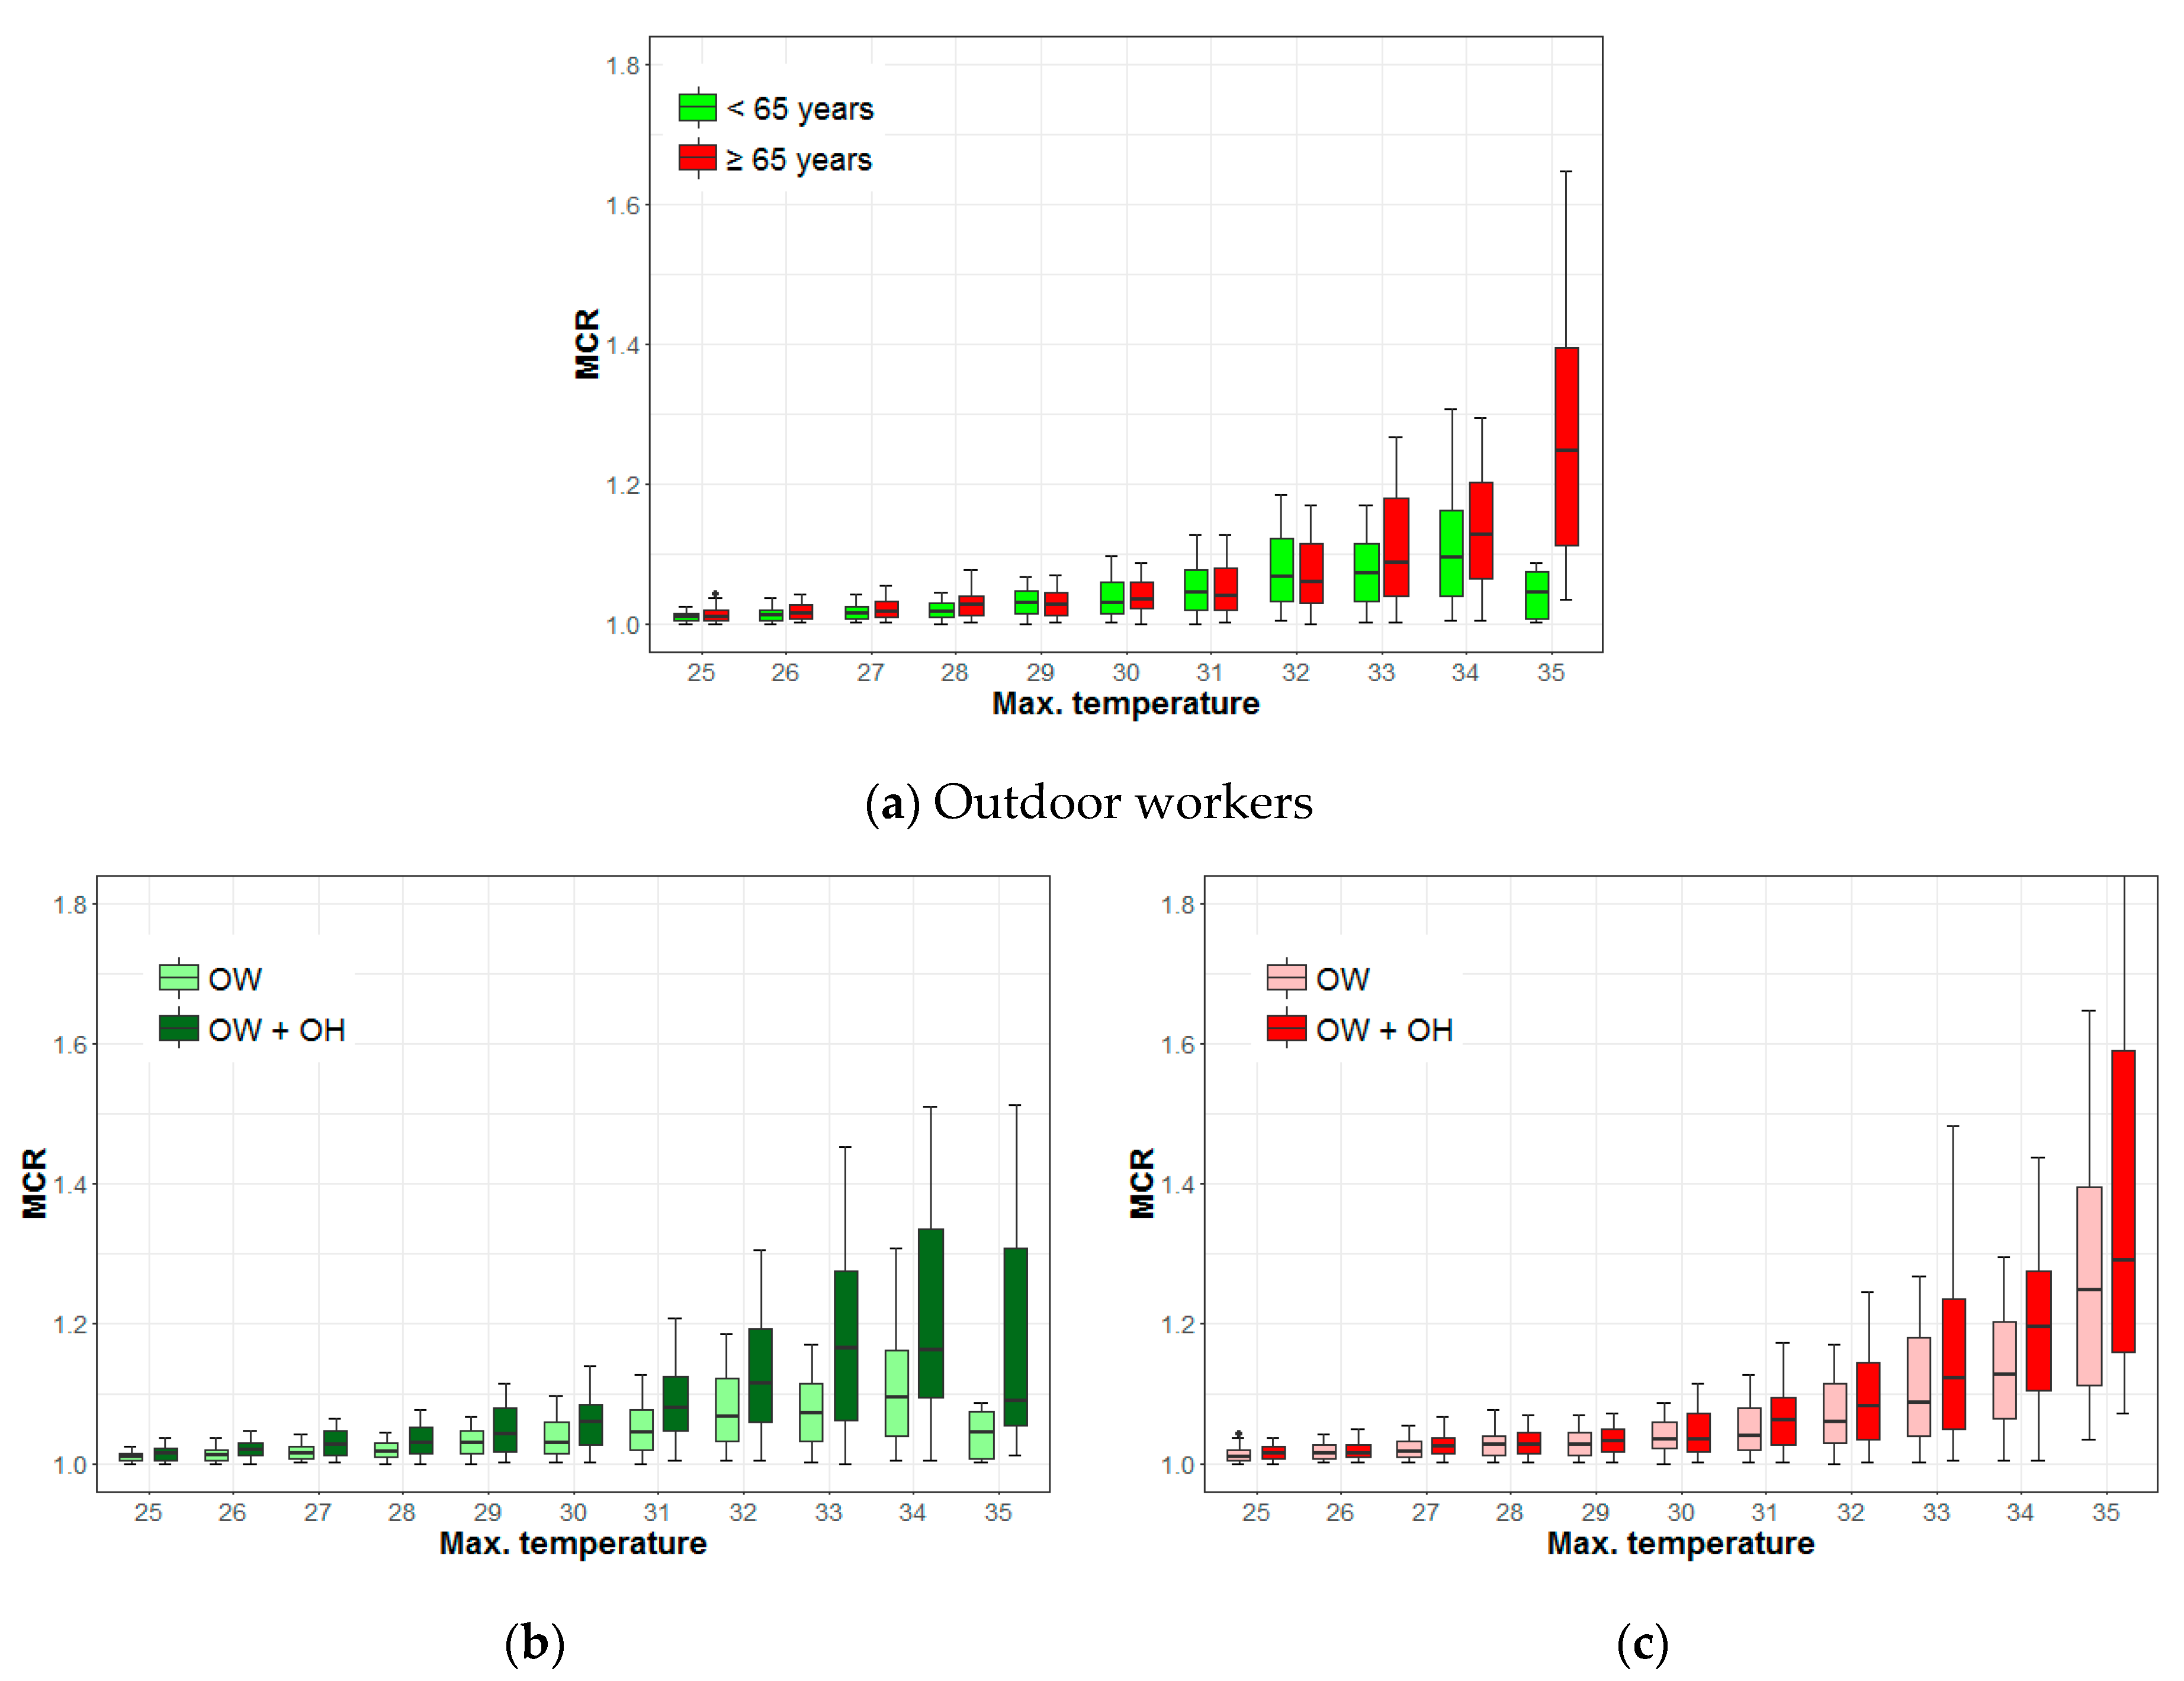
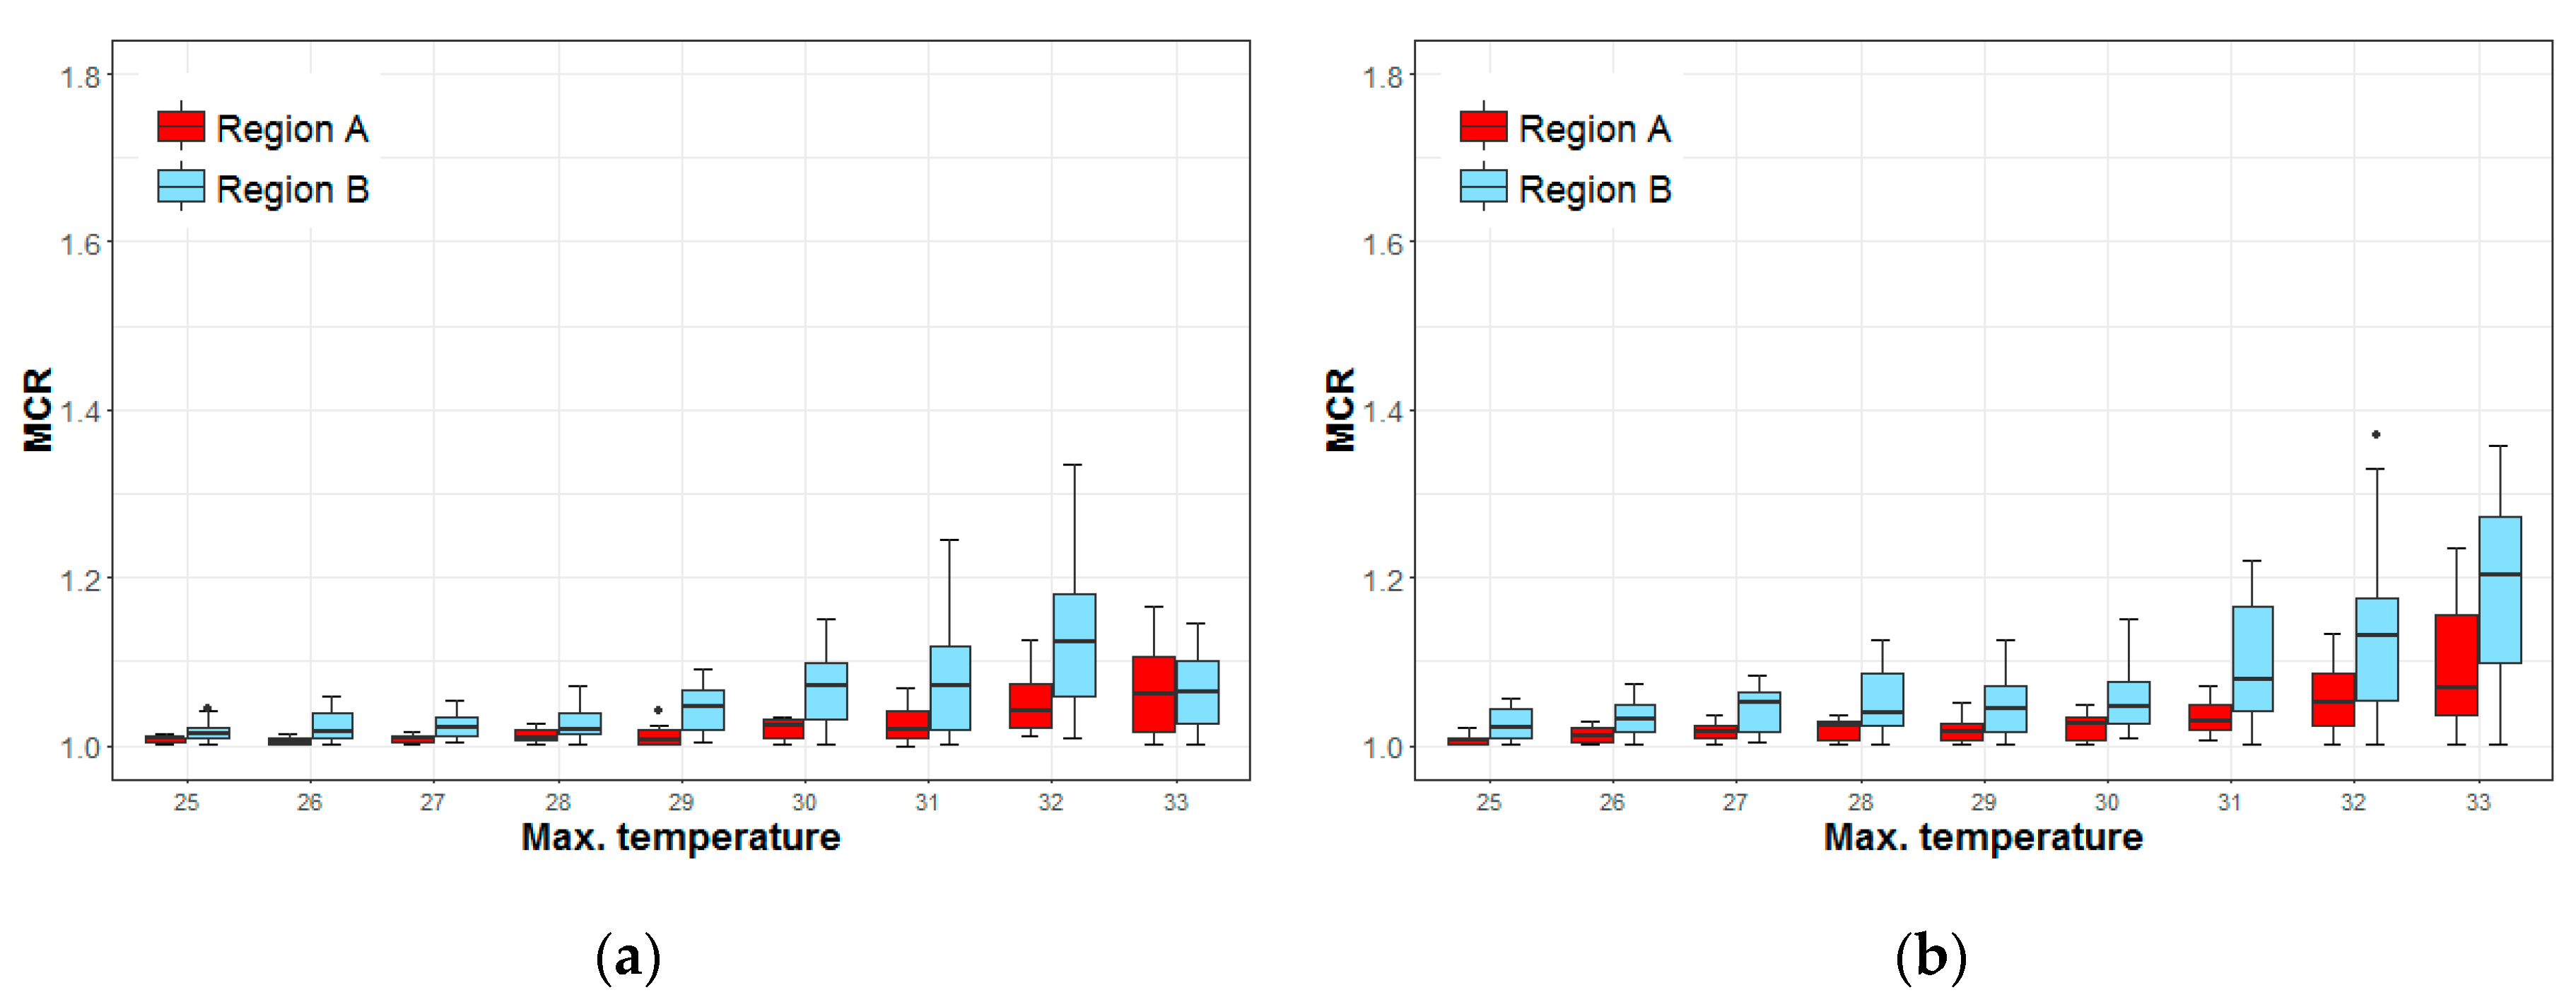
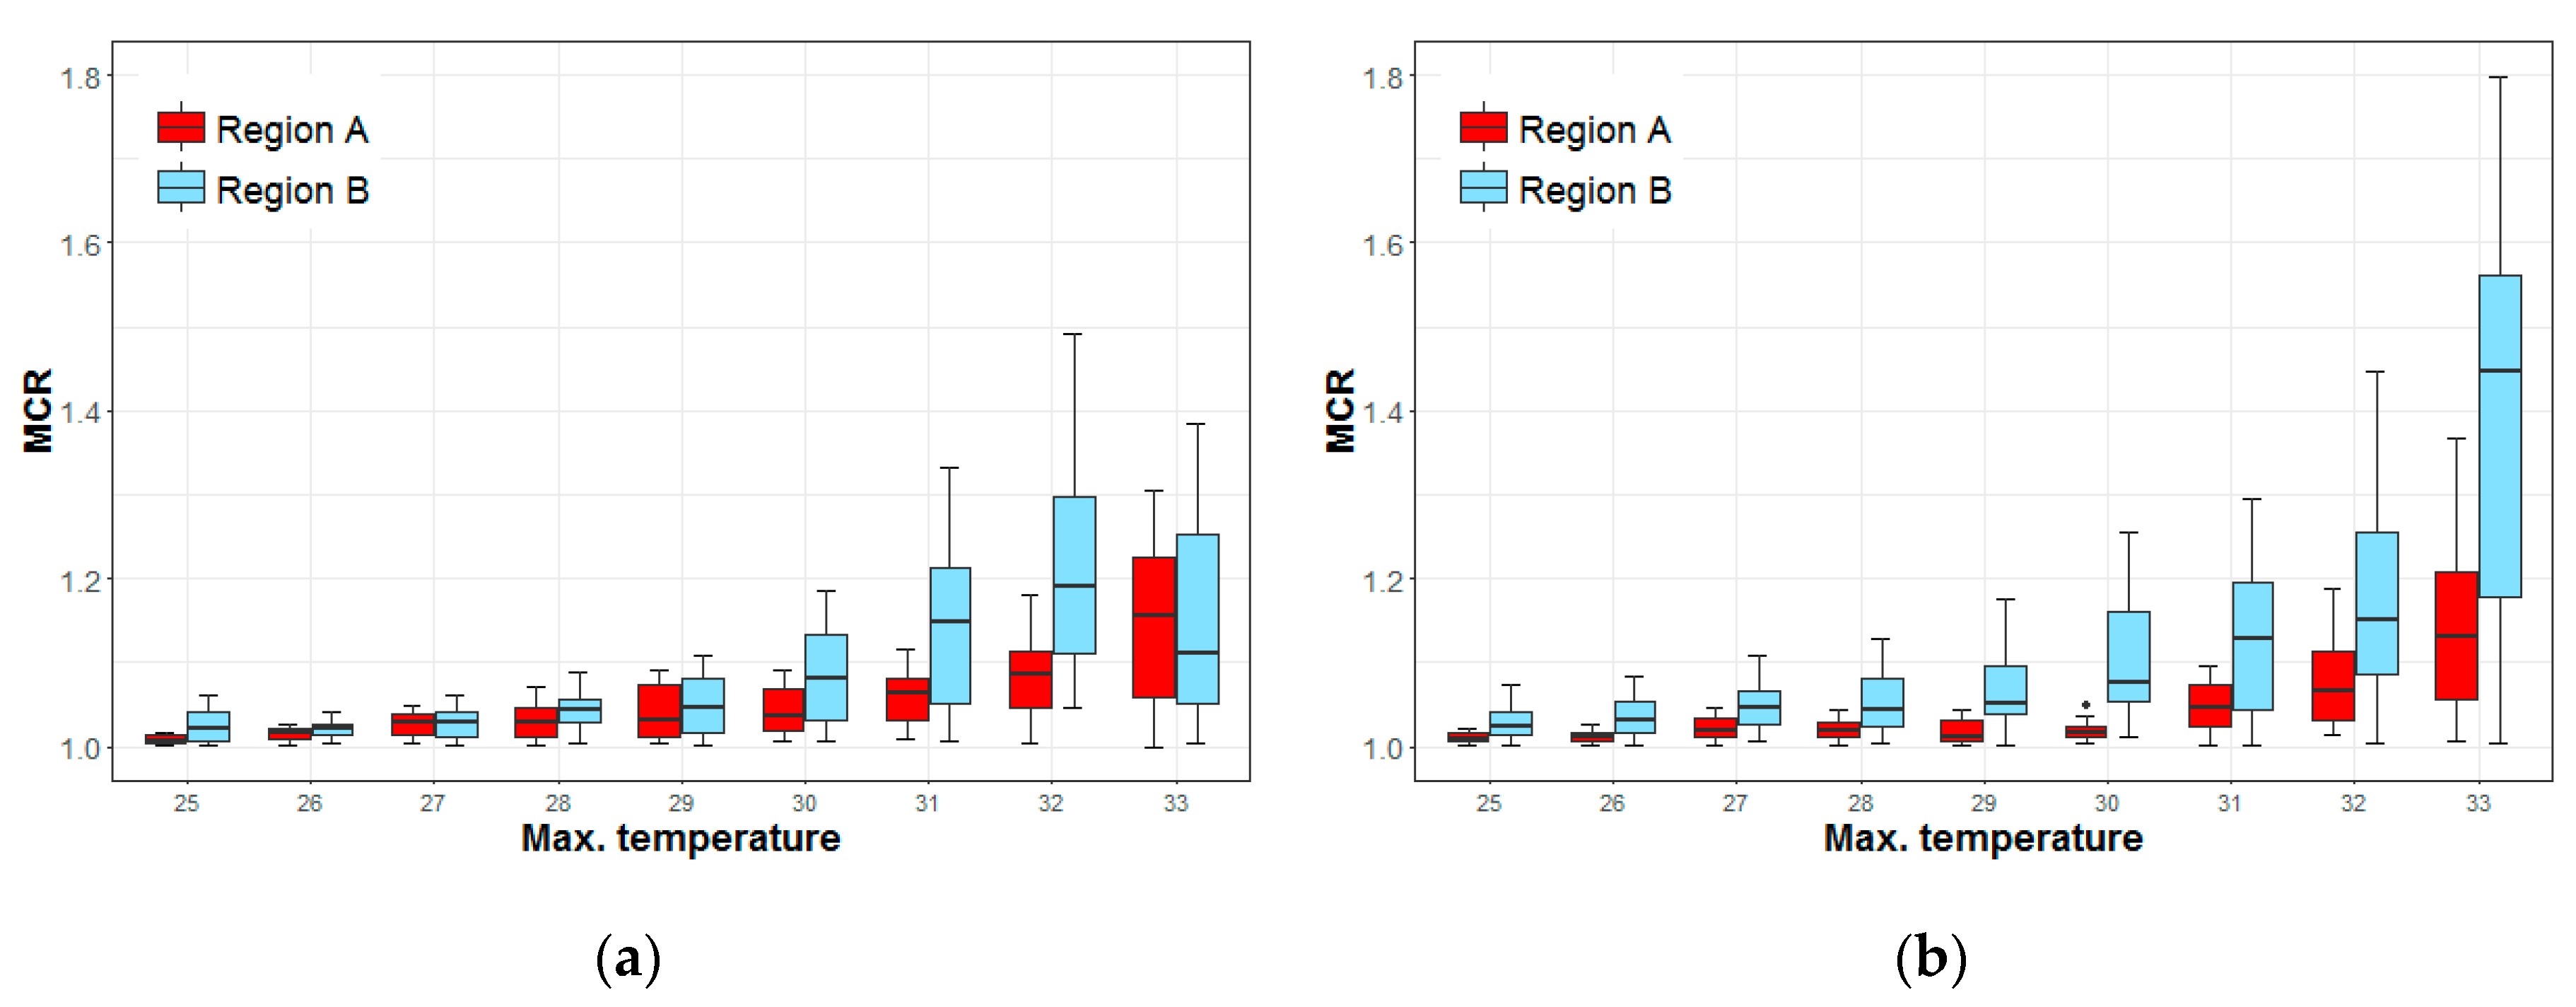
3.3. Risks of Mortality to Outdoor Workers Based on Climate
4. Discussion
5. Conclusions
Author Contributions
Funding
Conflicts of Interest
Appendix A

| Max.T. | Age (≥65 Years vs. <65 Years) | Household Type (One-Person vs. Family) | Occupation (Outdoor vs. Others) | Chronic Diseases (Chronic Diseases vs. Others) |
|---|---|---|---|---|
| 25 | −0.001 (−0.002–0.000) ** | 0.004 (0.004–0.007) *** | ||
| 26 | −0.001 (−0.002–0.000) * | 0.006 (0.004–0.009) *** | ||
| 27 | 0.002 (0.000–0.003) . | −0.001 (−0.003–0.000) . | 0.005 (0.005–0.010) *** | 0.000 (0.000–0.004) * |
| 28 | 0.007 (0.007–0.014) *** | 0.003 (0.001–0.005) ** | ||
| 29 | −0.002 (−0.005–0.000) . | 0.009 (0.007–0.014) *** | 0.004 (0.002–0.006) ** | |
| 30 | 0.006 (0.001–0.007) ** | 0.008 (0.009–0.019) *** | 0.001 (0.001–0.009) ** | |
| 31 | 0.013 (0.015–0.028) *** | 0.006 (0.002–0.010) ** | ||
| 32 | 0.009 (0.005–0.014) *** | 0.017 (0.012–0.028) *** | 0.012 (0.005–0.017) *** | |
| 33 | 0.016 (0.010–0.023) *** | 0.018 (0.011–0.034) *** | 0.028 (0.019–0.037) *** | |
| 34 | 0.028 (0.012–0.038) *** | 0.008 (0.003–0.031) * | 0.026 (0.026–0.055) *** | |
| 35 | 0.042 (0.022–0.072) ** | 0.073 (0.037–0.127) ** | 0.050 (0.012–0.086) * |
| Max.T. | ≥65 Years vs. <65 Years | One-Person and <65 Years vs. <65 Years | One-Person and ≥65 Years vs. ≥65 Years |
|---|---|---|---|
| 25 | 0.003 (0.001–0.007) ** | 0.004 (0.000–0.006) * | |
| 26 | 0.003 (0.000–0.007) . | 0.008 (0.003–0.011) *** | |
| 27 | 0.003 (0.002–0.010) ** | 0.014 (0.008–0.017) *** | 0.008 (0.002–0.011) ** |
| 28 | 0.009 (0.005–0.015) *** | 0.014 (0.009–0.020) *** | |
| 29 | 0.013 (0.009–0.026) *** | ||
| 30 | 0.029 (0.012–0.034) *** | ||
| 31 | 0.035 (0.026–0.052) *** | 0.020 (0.003–0.027) * | |
| 32 | 0.046 (0.033–0.073) *** | 0.022 (0.003–0.037) * | |
| 33 | 0.014 (0.015–0.056) ** | 0.092 (0.071–0.130) *** | 0.035 (0.014–0.078) ** |
| 34 | 0.031 (−0.004–0.057) . | 0.067 (0.058–0.142) *** | 0.069 (0.023–0.089) ** |
| 35 | 0.203 (0.127–0.316) *** | 0.045 (0.017–0.260) * | 0.042 (−0.005–0.451) . |
| Max.T. | <65 Years | ≥65 Years | <65 Years and One-Person | ≥65 Years and One-Person |
|---|---|---|---|---|
| 25 | 0.005 (0.004–0.015) ** | 0.016 (0.012–0.025) *** | 0.014 (0.007–0.027) ** | 0.014 (0.010–0.027) *** |
| 26 | 0.011 (0.007–0.029) ** | 0.020 (0.013–0.030) *** | 0.005 (0.000–0.012) . | 0.020 (0.014–0.034) *** |
| 27 | 0.013 (0.007–0.024) ** | 0.035 (0.016–0.038) *** | 0.029 (0.012–0.042) ** | |
| 28 | 0.009 (0.004–0.024) ** | 0.017 (0.020–0.048) *** | 0.014 (0.001–0.027) * | 0.024 (0.015–0.049) ** |
| 29 | 0.040 (0.018–0.048) *** | 0.028 (0.017–0.045) *** | 0.040 (0.023–0.064) *** | |
| 30 | 0.046 (0.029–0.066) *** | 0.019 (0.022–0.055) *** | 0.045 (0.016–0.072) ** | 0.059 (0.056–0.124) *** |
| 31 | 0.052 (0.023–0.074) ** | 0.050 (0.037–0.088) *** | 0.086 (0.046–0.128) *** | 0.084 (0.036–0.121) ** |
| 32 | 0.082 (0.043–0.115) *** | 0.081 (0.043–0.123) *** | 0.104 (0.081–0.209) *** | 0.084 (0.040–0.154) ** |
| 33 | 0.134 (0.051–0.147) *** | 0.316 (0.148–0.345) *** |
References
- De’ Donato, F.K.; Leone, M.; Scortichini, M.; De Sario, M.; Katsouyanni, K.; Lanki, T.; Basagaña, X.; Ballester, F.; Åström, C.; Paldy, A.; et al. Changes in the Effect of Heat on Mortality in the Last 20 Years in Nine European Cities. Results from the PHASE Project. Int. J. Environ. Res. Public Health 2015, 12, 15567–15583. [Google Scholar] [CrossRef] [PubMed]
- Beniston, M. The 2003 heat wave in Europe: A shape of things to come? An analysis based on Swiss climatological data and model simulations. Geophys. Res. Lett. 2004, 31, L02202. [Google Scholar] [CrossRef]
- 2018 European Heat Wave. Available online: https://en.wikipedia.org/wiki/2018_European_heat_wave (accessed on 30 March 2019).
- Jackson, J.E.; Yost, M.G.; Karr, C.; Fitzpatrick, C.; Lamb, B.K.; Chung, S.H.; Chen, J.; Avise, J.; Rosenblatt, R.A.; Fenske, R.A. Public health impacts of climate change in Washington State: Projected mortality risks due to heat events and air pollution. Clim. Chang. 2010, 102, 159–186. [Google Scholar] [CrossRef]
- Lim, Y.H.; Kim, H.; Hong, Y.C. Variation in mortality of ischemic and hemorrhagic strokes in relation to high temperature. Int. J. Biometeorol. 2013, 57, 145–153. [Google Scholar] [CrossRef]
- Lee, S.; Lee, H.; Myung, W.; Kim, E.J.; Kim, H. Mental disease-related emergency admissions attributable to hot temperatures. Sci. Total Environ. 2018, 616–617, 688–694. [Google Scholar] [CrossRef]
- Kim, J.; Song, K.J.; Hong, K.J.; Ro, Y.S. Trend of Outbreak of Thermal Illness Patients Based on Temperature 2002–2013 in Korea. Climate 2017, 5, 94. [Google Scholar] [CrossRef]
- Ebi, K.L.; Teisberg, T.J.; Kalkstein, L.S.; Robinson, L.; Weiher, R.F. Heat Watch/Warning Systems Save Lives: Estimated Costs and Benefits for Philadelphia 1995–98. BAMS 2004, 85, 1067–1074. [Google Scholar] [CrossRef]
- Bayentin, L.; El Adlouni, S.; Quarda, T.B.M.J.; Gosselin, P.; Doyon, B.; Chebana, F. Spatial variability of climate effects on ischemic heart disease hospitalization rates for the period 1989–2006 in Quebec, Canada. Int. J. Health Geogr. 2010, 9. [Google Scholar] [CrossRef] [PubMed]
- South Korea Hit by Longest, Most Severe Heat Wave in 2018. Available online: https://en.yna.co.kr/view/AEN20180817008200315 (accessed on 30 March 2019).
- Kyselý, J.; Kim, J. Mortality during heat waves in South Korea, 1991 to 2005: How exceptional was the 1994 heat wave? Clim. Res. 2009, 38, 105–116. [Google Scholar] [CrossRef]
- Dangerous Heat Wave Hitting U.S. over Fourth of July Weekend. Available online: https://www.cbsnews.com/news/heat-wave-fourth-of-july-weekend-2018-06-29 (accessed on 30 March 2019).
- Heatwave Kills at least 65 in Pakistan. Available online: https://edition.cnn.com/2018/05/22/asia/pakistan-heat-wave-wxc-intl/index.html (accessed on 20 August 2018).
- Earthquakes, Rains, Heatwave, Typhoon: Japan’s Brutal Summer 2018. Available online: https://www.straitstimes.com/asia/east-asia/earthquakes-rains-heatwave-typhoon-japans-brutal-summer-2018 (accessed on 8 September 2018).
- Choi, Y.; Park, J.; Lee, J. Customized Heat Prevention Plan (Korean). KEI Focus 2018, 6, 1–27. [Google Scholar]
- Son, J.Y.; Bell, M.L.; Lee, J.T. The impact of heat, cold, and heat waves on hospital admissions in eight cities in Korea. Int. J. Biometeorol. 2014, 58, 1893–1903. [Google Scholar] [CrossRef] [PubMed]
- Bai, L.; Ding, G.; Gu, S.; Bi, P.; Su, B.; Qin, D.; Xu, G.; Liu, Q. The effects of summer temperature and heat waves on heat-related illness in a coastal city of China, 2011–2013. Environ. Res. 2014, 132, 212–219. [Google Scholar] [CrossRef]
- Kim, D.W.; Deo, R.C.; Chung, J.H.; Lee, J.S. Projection of heat wave mortality related to climate change in Korea. Nat. Hazards 2016, 80, 623–637. [Google Scholar] [CrossRef]
- Kim, Y.; Joh, S. A vulnerability study of the low-income elderly in the context of high temperature and mortality in Seoul, Korea. Sci. Total Environ. 2006, 371, 82–88. [Google Scholar] [CrossRef] [PubMed]
- Chan, E.Y.Y.; Goggins, W.B.; Kim, J.J.; Griffiths, S.M. A study of intracity variation of temperature-related mortality and socioeconomic status among the Chinese population in Hong Kong. J. Epidemiol. Community Health 2012, 66, 322–327. [Google Scholar] [CrossRef]
- Schmeltz, M.; Marcotullio, P.; Himmelstein, D.U.; Woolhandler, S.; Sembajwe, G. Outcomes of hospitalizations for common illnesses associated with a comorbid heat-related illness in the United States, 2001–2010. Clim. Chang. 2016, 138, 3–4. [Google Scholar] [CrossRef]
- Kamal-Chaoui, L.; Robert, A. Competitive Cities and Climate Change; OECD: Paris, France, 2009; p. 60. [Google Scholar]
- Heo, S.; Lee, E.; Kwon, B.Y.; Lee, S.; Jo, K.H.; Kim, J. Long-term changes in the heat–mortality relationship according to heterogeneous regional climate: A time-series study in South Korea. BMJ 2016, 6, 1–10. [Google Scholar] [CrossRef] [PubMed]
- Lowe, R.; Ballester, J.; Creswick, J.; Robine, J.-M.; Herrmann, F.R.; Rodó, X. Evaluating the performance of a climate-driven mortality model during heat waves and cold spells in Europe. Int. J. Environ. Res. Public Health 2015, 12, 1279–1294. [Google Scholar] [CrossRef]
- Gómez-Martín, M.B.; Armesto-López, X.A.; Martínez-Ibarra, E. The Spanish tourist sector facing extreme climate events: A case study of domestic tourism in the heat wave of 2003. Int. J. Biometeorol. 2014, 58, 781–797. [Google Scholar] [CrossRef] [PubMed]
- Lee, J.Y.; Kim, E.; Lee, W.-S.; Chae, Y.; Kim, H. Projection of Future Mortality Due to Temperature and Population Changes under Representative Concentration Pathways and Shared Socioeconomic Pathways. Int. J. Environ. Res. Public Health 2018, 15, 822. [Google Scholar] [CrossRef] [PubMed]
- Urban, A.; Hanzlíková, H.; Kyselý, J.; Plavcová, E. Impacts of the 2015 Heat Waves on Mortality in the Czech Republic - A Comparison with Previous Heat Waves. Int. J. Environ. Res. Public Health 2017, 14, 1562. [Google Scholar] [CrossRef]
- Kendrovski, V.; Baccini, M.; Martinez, G.S.; Wolf, T.; Paunovic, E.; Menne, B. Quantifying Projected Heat Mortality Impacts under 21st-Century Warming Conditions for Selected European Countries. Int. J. Environ. Res. Public Health 2017, 14, 729. [Google Scholar] [CrossRef]
- Gao, J.; Sun, Y.; Liu, Q.; Zhou, M.; Lu, Y.; Li, L. Impact of extreme high temperature on mortality and regional level definition of heat wave: A multi-city study in China. Sci. Total Environ. 2015, 505, 535–544. [Google Scholar] [CrossRef] [PubMed]
- Microdata Integrated Service. Available online: https://mdis.kostat.go.kr (accessed on 1 November 2018).
- Meteorological Data Release Portal. Available online: https://data.kma.go.kr (accessed on 1 November 2018).
- Kenny, G.P.; Yardley, J.; Brown, C.; Sigal, R.J.; Jay, O. Heat stress in older individuals and patients with common chronic diseases. CMAJ 2010, 182, 1053–1060. [Google Scholar] [CrossRef]
- Semenza, J.C.; McCullough, J.E.; Dana Flanders, W.; McGeehin, M.A.; Lumpkin, J.R. Excess hospital admissions during the July 1995 heat wave in Chicago. AJPM 1999, 16, 269–277. [Google Scholar] [CrossRef]
- Schuman, S.H. Patterns of urban heat-wave deaths and implications for prevention: Data from New York and St. Louis during July, 1966. Environ. Res. 1972, 5, 59–75. [Google Scholar] [CrossRef]
- Knowlton, K.; Rotkin-Ellman, M.; King, G.; Margolis, H.G.; Smith, D.; Solomon, G.; Trent, R.; English, P. The 2006 California Heat Wave: Impacts on Hospitalizations and Emergency Department Visits. Environ. Health Perspect. 2009, 117, 61–67. [Google Scholar] [CrossRef]
- Zander, K.K.; Botzen, W.J.W.; Oppermann, E.; Kjellstrom, T.; Garnett, S.T. Heat stress causes substantial labour productivity loss in Australia. Nat. Clim. Chang. 2015, 5, 647. [Google Scholar] [CrossRef]
- Messeri, A.; Morabito, M.; Bonafede, M.; Bugani, M.; Levi, M.; Baldasseroni, A.; Binazzi, A.; Gozzini, B.; Orlandini, S.; Nybo, L.; et al. Heat Stress Perception among Native and Migrant Workers in Italian Industries—Case Studies from the Construction and Agricultural Sectors. Int. J. Environ. Res. Public Health 2019, 16, 1090. [Google Scholar] [CrossRef] [PubMed]
- Park, J.; Kim, Y.; Oh, I. Factors affecting heat-related diseases in outdoor workers exposed to extreme heat. Ann. Occup. Environ. Med. 2017, 29–30. [Google Scholar] [CrossRef] [PubMed]
- Yardley, J.; Sigal, R.J.; Kenny, G.P. Heat health planning: The importance of social and community factors. Glob. Environ. Chang. 2011, 21, 670–679. [Google Scholar] [CrossRef]
- Semenza, J.C.; Rubin, C.H.; Falter, K.H.; Selanikio, J.D.; Flanders, W.D.; Howe, H.L.; Wilhelm, J.L. Heat-Related Deaths during the July 1995 Heat Wave in Chicago. N. Engl. J. Med. 1996, 335, 84–90. [Google Scholar] [CrossRef]
- Klineberg, E. Dying Alone: The Social Production of Isolation. In Heat Wave, 2nd ed.; The University of Chicago Press: Chicago, IL, USA, 2015; p. 65. [Google Scholar]
- Liotta, G.; Inzerilli, M.C.; Palombi, L.; Madaro, O.; Orlando, S.; Scarcella, P.; Betti, D.; Marazzi, M.C. Social Interventions to Prevent Heat-Related Mortality in the Older Adult in Rome, Italy: A Quasi-Experimental Study. Int. J. Environ. Res. Public Health 2018, 15, 715. [Google Scholar] [CrossRef]
- Takahashi, N.; Nakao, R.; Ueda, K.; Ono, M.; Kondo, M.; Honda, Y.; Hashizume, M. Community Trial on Heat Related-Illness Prevention Behaviors and Knowledge for the Elderly. Int. J. Environ. Res. Public Health 2015, 12, 3188–3214. [Google Scholar] [CrossRef] [PubMed]
- Anderson, G.B.; Dominici, F.; Wang, Y.; McCormack, M.C.; Bell, M.L.; Peng, R.D. Heat-related emergency hospitalizations for respiratory diseases in the Medicare population. Am. J. Respir. Crit. Care Med. 2013, 187, 1098–1103. [Google Scholar] [CrossRef] [PubMed]
- Kim, H.; Heo, J.; Kim, H.; Lee, J.T. Has the impact of temperature on mortality really decreased over time? Sci. Total Environ. 2015, 512–513, 74–81. [Google Scholar] [CrossRef]
- Lin, S.; Luo, M.; Walker, R.; Liu, X.; Hwang, S.A.; Chinery, R. Extreme High Temperatures and Hospital Admissions for Respiratory and Cardiovascular Diseases. Epidemiology 2009, 20, 738–746. [Google Scholar] [CrossRef]
- Winquist, A.; Grundstein, A.; Chang, H.H.; Hess, J.; Sarnat, S.E. Warm season temperatures and emergency department visits in Atlanta, Georgia. Environ. Res. 2016, 147, 314–323. [Google Scholar] [CrossRef]
- Green, R.S.; Basu, R.; Malig, B.; Broadwin, R.; Kim, J.J.; Ostro, B. The effect of temperature on hospital admissions in nine California counties. Int. J. Public Health 2010, 55, 113–121. [Google Scholar] [CrossRef] [PubMed]
- Li, B.; Sain, S.; Mearns, L.O.; Anderson, H.A.; Kovats, S.; Ebi, K.L.; Bekkedal, M.Y.V.; Kanarek, M.S.; Patz, J.A. The impact of extreme heat on morbidity in Milwaukee, Wisconsin. Clim. Chang. 2012, 110, 959–976. [Google Scholar] [CrossRef]
- Shin, J.; Olson, R.; An, S.I. Projected heat wave characteristics over the Korean peninsula during the Twenty-First Century. Asia-Pac. J. Atmos. Sci. 2018, 54, 53–61. [Google Scholar] [CrossRef]
- Population Projection. 2019. Available online: http://kostat.go.kr/portal/korea/kor_nw/1/1/index.board?bmode=read&bSeq=&aSeq=373873&pageNo=1&rowNum=10&navCount=10&currPg=&searchInfo=srch&sTarget=title&sTxt=%EC%9D%B8%EA%B5%AC%EC%B6%94%EA%B3%84 (accessed on 30 March 2019).


| Data | Classify and Attribute | Source | |
|---|---|---|---|
| Mortality (2007–2016) | Total | All deaths except from external causes | https://mdis.kostat.go.kr |
| Ages | 65 years old or more (elderly) | ||
| Under 65 years old | |||
| Household | One-person household | ||
| Family household | |||
| Job | Outdoor worker | ||
| Other | |||
| Diseases | Chronic diseases | ||
| Other | |||
| Weather and Climate | Daily maximum temperature from AWS 1 (2007–2016) | https://data.kma.go.kr | |
| Daily maximum temperature from ASOS 2 (1997–2016) | |||
| Classes | Factors | Population |
|---|---|---|
| Total | Total deaths (excluding external causes) | 535,495 |
| Age | 65 years old or more (elderly) | 402,769 |
| Under 65 years old | 132,726 | |
| Household | One-person | 276,824 |
| Family | 258,671 | |
| Job | Outdoor | 90,266 |
| Others | 445,229 | |
| Diseases | Chronic diseases | 106,468 |
| Others | 507,621 | |
| Combinations | ≥65 years + Outdoor | 64,808 |
| <65 years + Outdoor | 25,458 | |
| ≥65 years + Outdoor + One-person | 23,628 | |
| <65 years + Outdoor + One-person | 9191 |
| Factors | 30 °C | 33 °C Warning Level-1 | 35 °C Warning Level-2 |
|---|---|---|---|
| Total deaths | 1.01 | 1.04 | 1.10 |
| Others | 1.01 | 1.05 | 1.10 |
| Outdoor workers | 1.02 | 1.05 | 1.17 |
| 65 years old or more | 1.03 | 1.09 | 1.25 |
| One-person household | 1.04 | 1.12 | 1.29 |
| A Regions (areas with higher temperatures) | 1.03 | 1.07 | |
| B Regions (areas with lower temperatures) | 1.05 | 1.20 | |
| Under 65 years old | 1.03 | 1.07 | 1.04 |
| One-person household | 1.06 | 1.16 | 1.09 |
| A Regions (areas with higher temperatures) | 1.02 | 1.06 | |
| B Regions (areas with lower temperatures) | 1.07 | 1.06 |
© 2019 by the authors. Licensee MDPI, Basel, Switzerland. This article is an open access article distributed under the terms and conditions of the Creative Commons Attribution (CC BY) license (http://creativecommons.org/licenses/by/4.0/).
Share and Cite
Park, J.; Chae, Y.; Choi, S.H. Analysis of Mortality Change Rate from Temperature in Summer by Age, Occupation, Household Type, and Chronic Diseases in 229 Korean Municipalities from 2007–2016. Int. J. Environ. Res. Public Health 2019, 16, 1561. https://doi.org/10.3390/ijerph16091561
Park J, Chae Y, Choi SH. Analysis of Mortality Change Rate from Temperature in Summer by Age, Occupation, Household Type, and Chronic Diseases in 229 Korean Municipalities from 2007–2016. International Journal of Environmental Research and Public Health. 2019; 16(9):1561. https://doi.org/10.3390/ijerph16091561
Chicago/Turabian StylePark, Jongchul, Yeora Chae, and Seo Hyung Choi. 2019. "Analysis of Mortality Change Rate from Temperature in Summer by Age, Occupation, Household Type, and Chronic Diseases in 229 Korean Municipalities from 2007–2016" International Journal of Environmental Research and Public Health 16, no. 9: 1561. https://doi.org/10.3390/ijerph16091561
APA StylePark, J., Chae, Y., & Choi, S. H. (2019). Analysis of Mortality Change Rate from Temperature in Summer by Age, Occupation, Household Type, and Chronic Diseases in 229 Korean Municipalities from 2007–2016. International Journal of Environmental Research and Public Health, 16(9), 1561. https://doi.org/10.3390/ijerph16091561