Measuring Age Discrimination at Work: Spanish Adaptation and Preliminary Validation of the Nordic Age Discrimination Scale (NADS)


Abstract
1. Introduction
Context of the Study
2. Materials and Methods
2.1. Ethics Statement
2.2. Participants
2.3. Procedure
2.4. Instruments
2.5. Data Analysis
3. Results
4. Discussion
5. Conclusions
Author Contributions
Funding
Conflicts of Interest
References
- Fisher, G.G.; Truxillo, D.M.; Finkelstein, L.M.; Wallace, L.E. Age discrimination: Potential for adverse impact and differential prediction related to age. Hum. Res. Manag. Rev. 2017, 27, 316–327. [Google Scholar] [CrossRef]
- Loichinger, E.; Weber, D. Trends in working life expectancy in Europe. J. Aging Health 2016, 7, 1194–1213. [Google Scholar] [CrossRef] [PubMed]
- Billett, S.; Dymock, D.; Johnson, G.; Martin, G. Overcoming the paradox of employers’ views about older workers. Int. J. Hum. Res. Manag. 2011, 22, 1248–1261. [Google Scholar] [CrossRef][Green Version]
- Nilsson, K.; Óstergren, P.O.; Kadefors, R.; Albin, M. Has the participation of older employees in the workforce increased? Study of the total Swedish population regarding exit from working life. Scand. J. Public Health 2016, 44, 506–516. [Google Scholar] [CrossRef]
- Van Dalen, H.P.; Henkens, K.; Schippers, J. Productivity of Older Workers: Perceptions of Employers and Employees. Popul. Dev. Rev. 2011, 36, 309–330. [Google Scholar] [CrossRef]
- Bal, A.C.; Reiss, A.E.; Rudolph, C.W.; Baltes, B.B. Examining positive and negative perceptions of older workers: A meta-analysis. J. Gerontol. Ser. B Psychol. Sci. Soc. Sci. 2011, 66, 687–698. [Google Scholar] [CrossRef]
- Harris, K.; Krygsman, S.; Waschenko, J.; Laliberte Rudman, D. Ageism and the older worker: A scoping review. Gerontology 2018, 58, e1–e14. [Google Scholar] [CrossRef]
- Bayl-Smith, P.H.; Griffin, B. Age discrimination in the workplace: Identifying as a late-career worker and its relationship with engagement and intended retirement age. J. Appl. Soc. Psychol. 2014, 44, 588–599. [Google Scholar] [CrossRef]
- Chiu, W.C.K.; Chan, A.W.; Snape, E.; Redman, T. Age stereotypes and discriminatory attitudes towards older workers: An East-West comparison. Hum. Relat. 2001, 54, 629–661. [Google Scholar] [CrossRef]
- Chou, R.J.A.; Choi, N.G. Prevalence and correlates of perceived workplace discrimination among older workers in the United States of America. Aging Soc. 2011, 31, 1051–1070. [Google Scholar] [CrossRef]
- Goldman, B.M.; Gutek, B.A.; Stein, J.H.; Lewis, K. Employment discrimination in organizations: Antecedents and consequences. J. Manag. 2006, 32, 786–830. [Google Scholar] [CrossRef]
- Sargeant, M. Age Discrimination. Ageism in Employment and Service Provision; Routledge: London, UK, 2016. [Google Scholar]
- Dordoni, P.; Argentero, P. When age stereotypes are employment barriers: A conceptual analysis and a literature review on older workers stereotypes. Aging Int. 2015, 40, 393–412. [Google Scholar] [CrossRef]
- Ng, T.W.; Feldman, D.C. Evaluating six common stereotypes about older workers with metaanalytical data. Pers. Psychol. 2012, 65, 821–858. [Google Scholar] [CrossRef]
- Posthuma, R.A.; Campion, M.A. Age stereotypes at the workplace: Common stereotypes, moderators, and future research directions. J. Manag. 2008, 35, 158–188. [Google Scholar] [CrossRef]
- Shah, P.; Kleiner, B. New developments concerning age discrimination in the workplace. Equal Opport. Int. 2006, 24, 15–23. [Google Scholar] [CrossRef]
- Wood, G.; Wilkinson, A.; Harcourt, M. Age discrimination and working life: Perspectives and contestations—A review of the contemporary literature. Int. J. Manag. Rev. 2008, 10, 424–442. [Google Scholar] [CrossRef]
- Kunze, F.; Boehm, S.A.; Bruch, H. Age diversity, age discrimination climate, and performance consequences—A cross organizational study. J. Organ. Behav. 2011, 32, 264–290. [Google Scholar] [CrossRef]
- Ainsworth, S.; Hardy, C. Mind over body: Physical and psychotherapeutic discourses and the regulation of the older worker. Hum. Relat. 2009, 62, 1199–1229. [Google Scholar] [CrossRef]
- Spedale, R. Deconstructing the ‘older worker’: Exploring the complexities of subject positioning at the intersection of multiple discourses. Organization 2019, 26, 38–54. [Google Scholar] [CrossRef]
- Butler, R. Ageism: Another form of bigotry. Gerontology 1969, 9, 243–246. [Google Scholar]
- Posthuma, R.A.; Wagstaff, M.F.; Campion, M.A. Age stereotypes and workplace age discrimination. In The Oxford Handbook of Work and Aging; Hedge, J.W., Borman, W.C., Eds.; Oxford University Press: Oxford, UK, 2012; pp. 298–312. [Google Scholar]
- Cuddy, A.; Fiske, S. Doddering but dear: Process, content, and function in stereotyping of older persons. In Ageism: Stereotyping and Prejudice against Older Persons, 2nd ed.; Nelson, T.D., Ed.; MIT Press: Cambridge, MA, USA, 2002; pp. 3–26. [Google Scholar]
- Mcmullin, J.A.; Marshall, V.W. Ageism, age relations, and garment industry work in Montreal. Gerontology 2001, 41, 111–122. [Google Scholar] [CrossRef]
- Furunes, T.; Mykletun, R.J. Age discrimination in the workplace: Validation of the Nordic Age Discrimination Scale (NADS). Scand. J. Psychol. 2010, 51, 23–30. [Google Scholar] [CrossRef]
- Nelson, T.D. Preface. In Ageism: Stereotyping and Prejudice against Older Workers; Nelson, T.D., Ed.; MIT Press: Cambridge, MA, USA, 2002. [Google Scholar]
- Alcover, C.M.; Crego, A.; Guglielmi, D.; Chiesa, R. Comparison between the Spanish and Italian early retirement models. A cluster analysis. Pers. Rev. 2012, 41, 380–412. [Google Scholar] [CrossRef][Green Version]
- Rupp, D.E.; Vodanovich, S.J.; Credé, M. The multidimensional nature of ageism: Construct validity and group differences. J. Soc. Psychol. 2005, 145, 335–362. [Google Scholar] [CrossRef]
- OECD. OECD Labour Force Statistics 2018; OECD Publishing: Paris, France, 2018. [Google Scholar]
- Avdeev, A.; Eremenko, T.; Festy, P.; Gaymu, J.; Le Bouteillec, N.; Springe, S. Populations and demographic trends of European countries, 1980–2010. Population 2011, 66, 9–129. [Google Scholar] [CrossRef]
- Robroek, S.J.W.; Schuring, M.; Croezen, S.; Stattin, M.; Burdorf, A. Poor health, unhealthy behaviors, and unfavorable work characteristics influence pathways of exit from paid employment among older workers in Europe: A four year follow-up study. Scand. J. Work Environ. Health 2013, 39, 125–133. [Google Scholar] [CrossRef]
- Van Dalen, H.P.; Henkens, K.; Schippers, J. Dealing with older workers in Europe: A comparative survey of employers’ attitudes and actions. J. Eur. Soc. Policy 2009, 19, 47–60. [Google Scholar] [CrossRef]
- Stypinska, J.; Turek, K. Hard and soft age discrimination: The dual nature of workplace discrimination. Eur. J. Aging 2017, 14, 49–61. [Google Scholar] [CrossRef]
- Palmore, E. Ageism, Negative and Positive, 2nd ed.; Springer: New York, NY, USA, 1999. [Google Scholar]
- Malinen, S.; Johnston, L. Workplace ageism: Discovering hidden bias. Exp. Aging Res. 2013, 39, 445–465. [Google Scholar] [CrossRef]
- Minichiello, V.; Browne, J.; Kendig, H. Perceptions and consequences of ageism: Views of older people. Ageing Soc. 2000, 20, 253–278. [Google Scholar] [CrossRef]
- Handy, J.; Davy, D. Gendered ageism: Older women’s experiences of employment agency practices. Asia Pac. J. Hum. Res. 2007, 45, 85–99. [Google Scholar] [CrossRef]
- Voss, P.; Wolff, J.K.; Rothermund, K. Relations between views on ageing and perceived age discrimination: A domain-specific perspective. Eur. J. Aging 2017, 14, 5–15. [Google Scholar] [CrossRef]
- Rospenda, K.M.; Richman, J.A.; Shannon, C.A. Prevalence and mental health correlates of harassment and discrimination in the workplace: Results from a national study. J. Int. Viol. 2009, 24, 819–843. [Google Scholar] [CrossRef]
- Lee, Y. JD-R model on psychological well-being and the moderating effect of job discrimination in the model: Findings from the MIDUS. Eur. J. Train. Dev. 2019. [Google Scholar] [CrossRef]
- Vogt Yuan, A.S. Perceived age discrimination and mental health. Soc. Forces 2007, 86, 291–311. [Google Scholar] [CrossRef]
- Pavalko, E.K.; Mossakowski, J.N.; Hamilton, V.J. Does perceived discrimination affect health? Longitudinal relationships between work discrimination and women’s physical and emotional health. J. Health Soc. Behav. 2003, 44, 18–33. [Google Scholar] [CrossRef]
- Sutin, A.R.; Stephan, Y.; Carretta, H.; Terracciano, A. Perceived Discrimination and Physical, Cognitive, and Emotional Health in Older Adulthood. Am. J. Geriatr. Psychiatry 2015, 23, 171–179. [Google Scholar] [CrossRef] [PubMed]
- Gaillard, M.; Desmette, D. (In) validating stereotypes about older workers influences their intentions to retire early and to learn and develop. Basic Appl. Soc. Psychol. 2010, 32, 86–98. [Google Scholar] [CrossRef]
- James, J.B.; McKechnie, S.; Swanberg, J.; Besen, E. Exploring the workplace impact of intentional/unintentional age discrimination. J. Manag. Psychol. 2013, 28, 907–927. [Google Scholar] [CrossRef]
- Griffin, B.; Bayl-Smith, P.; Hesketh, B. The Longitudinal Effects of Perceived Age Discrimination on the Job Satisfaction and Work Withdrawal of Older Employees. Work Aging Retire. 2016, 2, 415–427. [Google Scholar] [CrossRef]
- Snape, E.; Redman, T. Too Old or Too Young? The Impact of Perceived Age Discrimination. Hum. Res. Manag. J. 2003, 13, 78–89. [Google Scholar] [CrossRef]
- Redman, T.; Snape, E. The Consequences of Perceived Age Discrimination Amongst Older Police Officers: Is Social Support a Buffer? Br. J. Manag. 2006, 17, 167–175. [Google Scholar] [CrossRef]
- Hassell, B.L.; Perrewé, P.L. An examination of the relationship between older workers’ perceptions of age discrimination and employee psychological states. J. Manag. Issues 1993, 5, 109–120. [Google Scholar]
- Bowen, C.E.; Staudinger, U.M. Relationship between age and promotion orientation depends on perceived older worker stereotypes. J. Gerontol. Ser. B Psychol. Sci. Soc. Sci. 2012, 68, 59–63. [Google Scholar] [CrossRef][Green Version]
- Zaniboni, S. The Interaction Between Older Workers’ Personal Resources and Perceived Age Discrimination Affects the Desired Retirement Age and the Expected Adjustment. Work Aging Retire. 2015, 1, 266–273. [Google Scholar] [CrossRef]
- Johnson, R.W.; Neumark, D. Age discrimination, job separations, and employment status of older workers: Evidence from self-reports. J. Hum. Res. 1997, 32, 779–811. [Google Scholar] [CrossRef]
- Chou, K.-L.; Chow, N. To retire or not to retire: Is there an option for older workers in Hong Kong. Soc. Policy Adm. 2005, 39, 233–246. [Google Scholar] [CrossRef]
- Topa, G.; Moriano, J.A.; Depolo, M.; Alcover, C.M.; Moreno, A. Retirement and wealth relationships: Meta-analysis and SEM. Res. Aging 2011, 33, 501–528. [Google Scholar] [CrossRef]
- Orpen, C. The effects of perceived age discrimination on employee job satisfaction, organisational commitment and job involvement. Psychol. J. Hum. Behav. 1995, 32, 55–56. [Google Scholar]
- Rupp, D.E.; Vodanovich, S.J.; Credé, M. Age Bias in the Workplace: The Impact of Ageism and Causal Attributions. J. Appl. Soc. Psychol. 2006, 36, 1337–1364. [Google Scholar] [CrossRef]
- Marchiondo, L.A.; Gonzales, E.; Rand, S. Development and Validation of the Workplace Age Discrimination Scale. J. Bus. Psychol. 2016, 31, 493–513. [Google Scholar] [CrossRef]
- King, S.P.; Bryant, F.B. The Workplace Intergenerational Climate Scale (WICS): A self-report instrument measuring ageism in the workplace. J. Org. Behav. 2017, 38, 124–151. [Google Scholar] [CrossRef]
- World Health Organization. World Health Statistics 2017: Monitoring Health for the SDGs, Sustainable Development Goals; World Health Organization: Geneva, Switzerland, 2017. [Google Scholar]
- Instituto Nacional de Estadística. INEbase. Available online: http://www.ine.es/jaxiT3/Tabla.htm?t=1414 (accessed on 13 October 2018).
- Abellán, A.; Aceituno, P.; Pérez, J.; Ramiro, D.; Ayala, A.; Pujol, R. Un Perfil de las Personas Mayores en España, 2019. Indicadores Estadísticos Básicos [A Profile of the Elderly in Spain, 2019. Basic Statistic Indicators]; Informes Envejecimiento en red, nº 22: Madrid, Spain, 2019. [Google Scholar]
- Abellán, A.; Pujol, R. Un Perfil de las Personas Mayores en España, 2016. Indicadores Estadísticos Básicos [A Profile of the Elderly in Spain, 2016. Basic Statistic Indicators]; Informes Envejecimiento en red, nº 14: Madrid, Spain, 2016. [Google Scholar]
- Instituto Nacional de Estadística (2019). INEbase, Indicadores de Estructura de la Población [Indicators of Population Structure]. Available online: http://www.ine.es/jaxiT3/Datos.htm?t=1489 (accessed on 21 April 2019).
- Pahkin, K.; Björklund, C.; Mykletun, R.J.; Furunes, T.; Gard, G.; Lindström, K. Nordic Questionnaire for Monitoring the Age Diverse Workforce. User’s Guide for the QPSNordic-ADW; Nordic Council of Ministers: Copenhagen, Denmark, 2008. [Google Scholar]
- Fisher, G.G.; Matthews, R.A.; Gibbons, A.M. Developing and investigating the use of single-item measures in organizational research. J. Occup. Health Psychol. 2016, 21, 3–23. [Google Scholar] [CrossRef]
- Fuchs, C.; Diamantopoulos, A. Using single item measures for construct measurement in management research. Die Betriebswirtschaft. 2009, 69, 195–210. [Google Scholar]
- Alcover, C.M.; Topa, G. Work characteristics, motivational orientations, psychological work ability and job mobility intentions of older workers. PLoS ONE 2018, 13, e0195973. [Google Scholar] [CrossRef]
- Tuomi, K.; Huuhtanen, P.; Nykyri, E.; Ilmarinen, J. Promotion of work ability, the quality of work and retirement. Occup. Med. 2001, 51, 318–324. [Google Scholar] [CrossRef]
- Topa, G.; Alcover, C.M. Psychosocial factors in retirement intentions and adjustment: A multi-sample study. Career Dev. Int. 2015, 20, 384–408. [Google Scholar] [CrossRef]
- Zaniboni, S.; Sarchielli, G.; Fraccaroli, F. How are psychosocial factors related to retirement intentions? Int. J. Manpow. 2010, 31, 271–285. [Google Scholar] [CrossRef]
- Shipp, F.; Burns, G.L.; Desmul, C. Construct validity of ADHD-IN, ADHD-HI, ODD toward adults, academic and social competence dimensions with teacher ratings of Thai adolescents: Additional validity for the Child and Adolescent Disruptive Behavior Inventory. J. Psychol. Behav. Assess. 2010, 32, 557–564. [Google Scholar] [CrossRef]
- Brown, T.A. Confirmatory Factor Analysis for Applied Research; Guilford Press: New York, NY, USA, 2006. [Google Scholar]
- Truxillo, D.M.; Finkelstein, L.M.; Pytlovany, A.C.; Jenkins, J.S. Age discrimination at work: A review of the research and recommendations for the future. In The Oxford Handbook of Workplace Discrimination; Colella, A.J., King, E.B., Eds.; Oxford University Press: New York, NY, USA, 2018; pp. 119–142. [Google Scholar]
- Cadiz, D.M.; Truxillo, D.M.; Pytlovany, A.C. Ageism in the Workplace. In Oxford Research Encyclopedia of Psychology; Oxford University Press: Oxford, UK.
- Maurer, T.J.; Rafuse, N.E. Learning, not litigating: Managing employee development and avoiding claims of age discrimination. Acad. Manag. Exec. 2001, 15, 110–121. [Google Scholar] [CrossRef]
- Perron, R. The Value of Experience: Age Discrimination Against Older Workers Persists. AARP Research. Available online: https://www.aarp.org/content/dam/aarp/research/surveys_statistics/econ/2018/value-of-experience-age-discrimination-highlights.doi.10.26419-2Fres.00177.002.pdf (accessed on 22 February 2019).
- Rothenberg, J.Z.; Gardner, D.S. Protecting Older Workers: The Failure of the Age Discrimination in Employment Act of 1967. J. Sociol. Soc. Welf. 2011, 38, 9–30. [Google Scholar]
- Van den Heuvel, M.; Demerouti, E.; Schaufeli, W.B.; Bakker, A.B. Personal resources and work engagement in the face of change. In Contemporary Occupational Health Psychology: Global Perspectives on Research and Practice; Houdmont, J., Leka, S., Eds.; Wiley: Chichester, UK, 2010; pp. 124–150. [Google Scholar]
- Topa, G.; Depolo, M.; Alcover, C.M. Early Retirement: A Meta-Analysis of its Antecedent and Subsequent Correlates. Front. Psychol. 2018, 8, 2157. [Google Scholar] [CrossRef]
- Alcover, C.M.; Topa, G. Bridge employment in Spain. A possible option to postpone retirement. In Bridge Employment: A Research Handbook; Alcover, C.M., Topa, G., Parry, E., Fraccaroli, F., Depolo, M., Eds.; Routledge: London, UK, 2014; pp. 115–137. [Google Scholar]
- Pascoe, E.A.; Smart Richman, L. Perceived Discrimination and Health: A Meta-Analytic Review. Psychol. Bull. 2009, 135, 531–554. [Google Scholar] [CrossRef]
- Hansson, R.O.; Robson, S.M.; Limas, M.J. Stress and coping among older workers. Work 2011, 17, 247–256. [Google Scholar]
- Rabl, T. Age, discrimination, and achievement motives. Pers. Rev. 2010, 39, 448–467. [Google Scholar] [CrossRef]
- Kooij, D.; de Lange, A.; Jansen, P.; Dikkers, J. Older workers’ motivation to continue to work: Five meanings of age. A conceptual review. J. Manag. Psychol. 2008, 23, 364–394. [Google Scholar] [CrossRef]
- Taylor, P.; Mcloughlin, C.; Meyer, D.; Brooke, E. Everyday discrimination in the workplace, job satisfaction and psychological wellbeing: Age differences and moderating variables. Aging Soc. 2013, 33, 1105–1138. [Google Scholar] [CrossRef]
- Harada, K.; Sugisawa, H.; Sugihara, Y.; Yanagisawa, S.; Shimmei, M. Perceived age discrimination and job satisfaction among older employed men in Japan. Int. J. Aging Hum. Develop. 2018, in press. [Google Scholar] [CrossRef] [PubMed]
- Rabl, T.; Triana, M. How German employees of different ages conserve resources: Perceived age discrimination and affective organizational commitment. Int. J. Hum. Resour. Manag. 2013, 24, 3599–3612. [Google Scholar] [CrossRef]
- Macdonald, J.L.; Levy, S.R. Ageism in the Workplace: The role of psychosocial factors in predicting job satisfaction, commitment, and engagement. J. Soc. Issues. 2016, 72, 169–190. [Google Scholar] [CrossRef]
- Iweins, C.; Desmette, D.; Yzerbyt, V.; Stinglhamber, F. Ageism at work: The impact of intergenerational contact and organizational multi- age perspective. Eur. J. Work Organ. Psychol. 2013, 22, 331–346. [Google Scholar] [CrossRef]
- Donaldson, S.I.; Grant-Vallone, E.J. Understanding self-report bias in organizational behavior research. J. Bus. Psychol. 2002, 17, 245–260. [Google Scholar] [CrossRef]
- Spector, P.E. Method variance in organizational research. Truth or urban legend? Org. Res. Meth. 2006, 9, 221–232. [Google Scholar] [CrossRef]
- Alcover, C.M.; Topa, G.; Parry, E.; Fraccaroli, F.; Depolo, M. Bridge employment: Lessons learned and future prospects for research and practice. In Bridge Employment: A Research Handbook; Alcover, C.M., Topa, G., Parry, E., Fraccaroli, F., Depolo, M., Eds.; Routledge: London, UK, 2014; pp. 269–290. [Google Scholar]


| NADS Items. Spanish [English] | Total Sample |
|---|---|
| 1. Los trabajadores de edad avanzada son pasados por alto/excluidos en casos de promoción o reclutamiento interno [Elderly workers are passed over/left out in cases of promotion or internal recruitment] | 0.77 |
| 2. Los trabajadores de edad avanzada no tienen igualdad de oportunidades de formación durante el tiempo de trabajo [Elderly workers do not have equal opportunities for training during work time] | 0.77 |
| 3. Se prefiere a los trabajadores jóvenes cuando se introducen nuevos equipos, actividades o métodos de trabajo [Younger workers are preferred when new equipment, activities or working methods are introduced] | 0.80 |
| 4. Los trabajadores de edad avanzada participan menos a menudo en evaluaciones de desarrollo con sus superiores que los trabajadores más jóvenes [Elderly workers less often take part in development appraisals with their superior than younger workers] | 0.72 |
| 5. Los trabajadores de edad avanzada tienen menor incremento salarial que los más jóvenes [Elderly workers have less wage increase than younger workers] | 0.52 |
| 6. No se espera que los trabajadores de edad avanzada tomen parte en procesos de cambio y nuevos métodos de trabajo en el mismo grado que sus pares más jóvenes [Elderly workers are not expected to take part in change processes and new working methods to the same degree as their younger peers] | 0.78 |
| Eigenvalue | 3.2 |
| Explained variance | 54.1% |
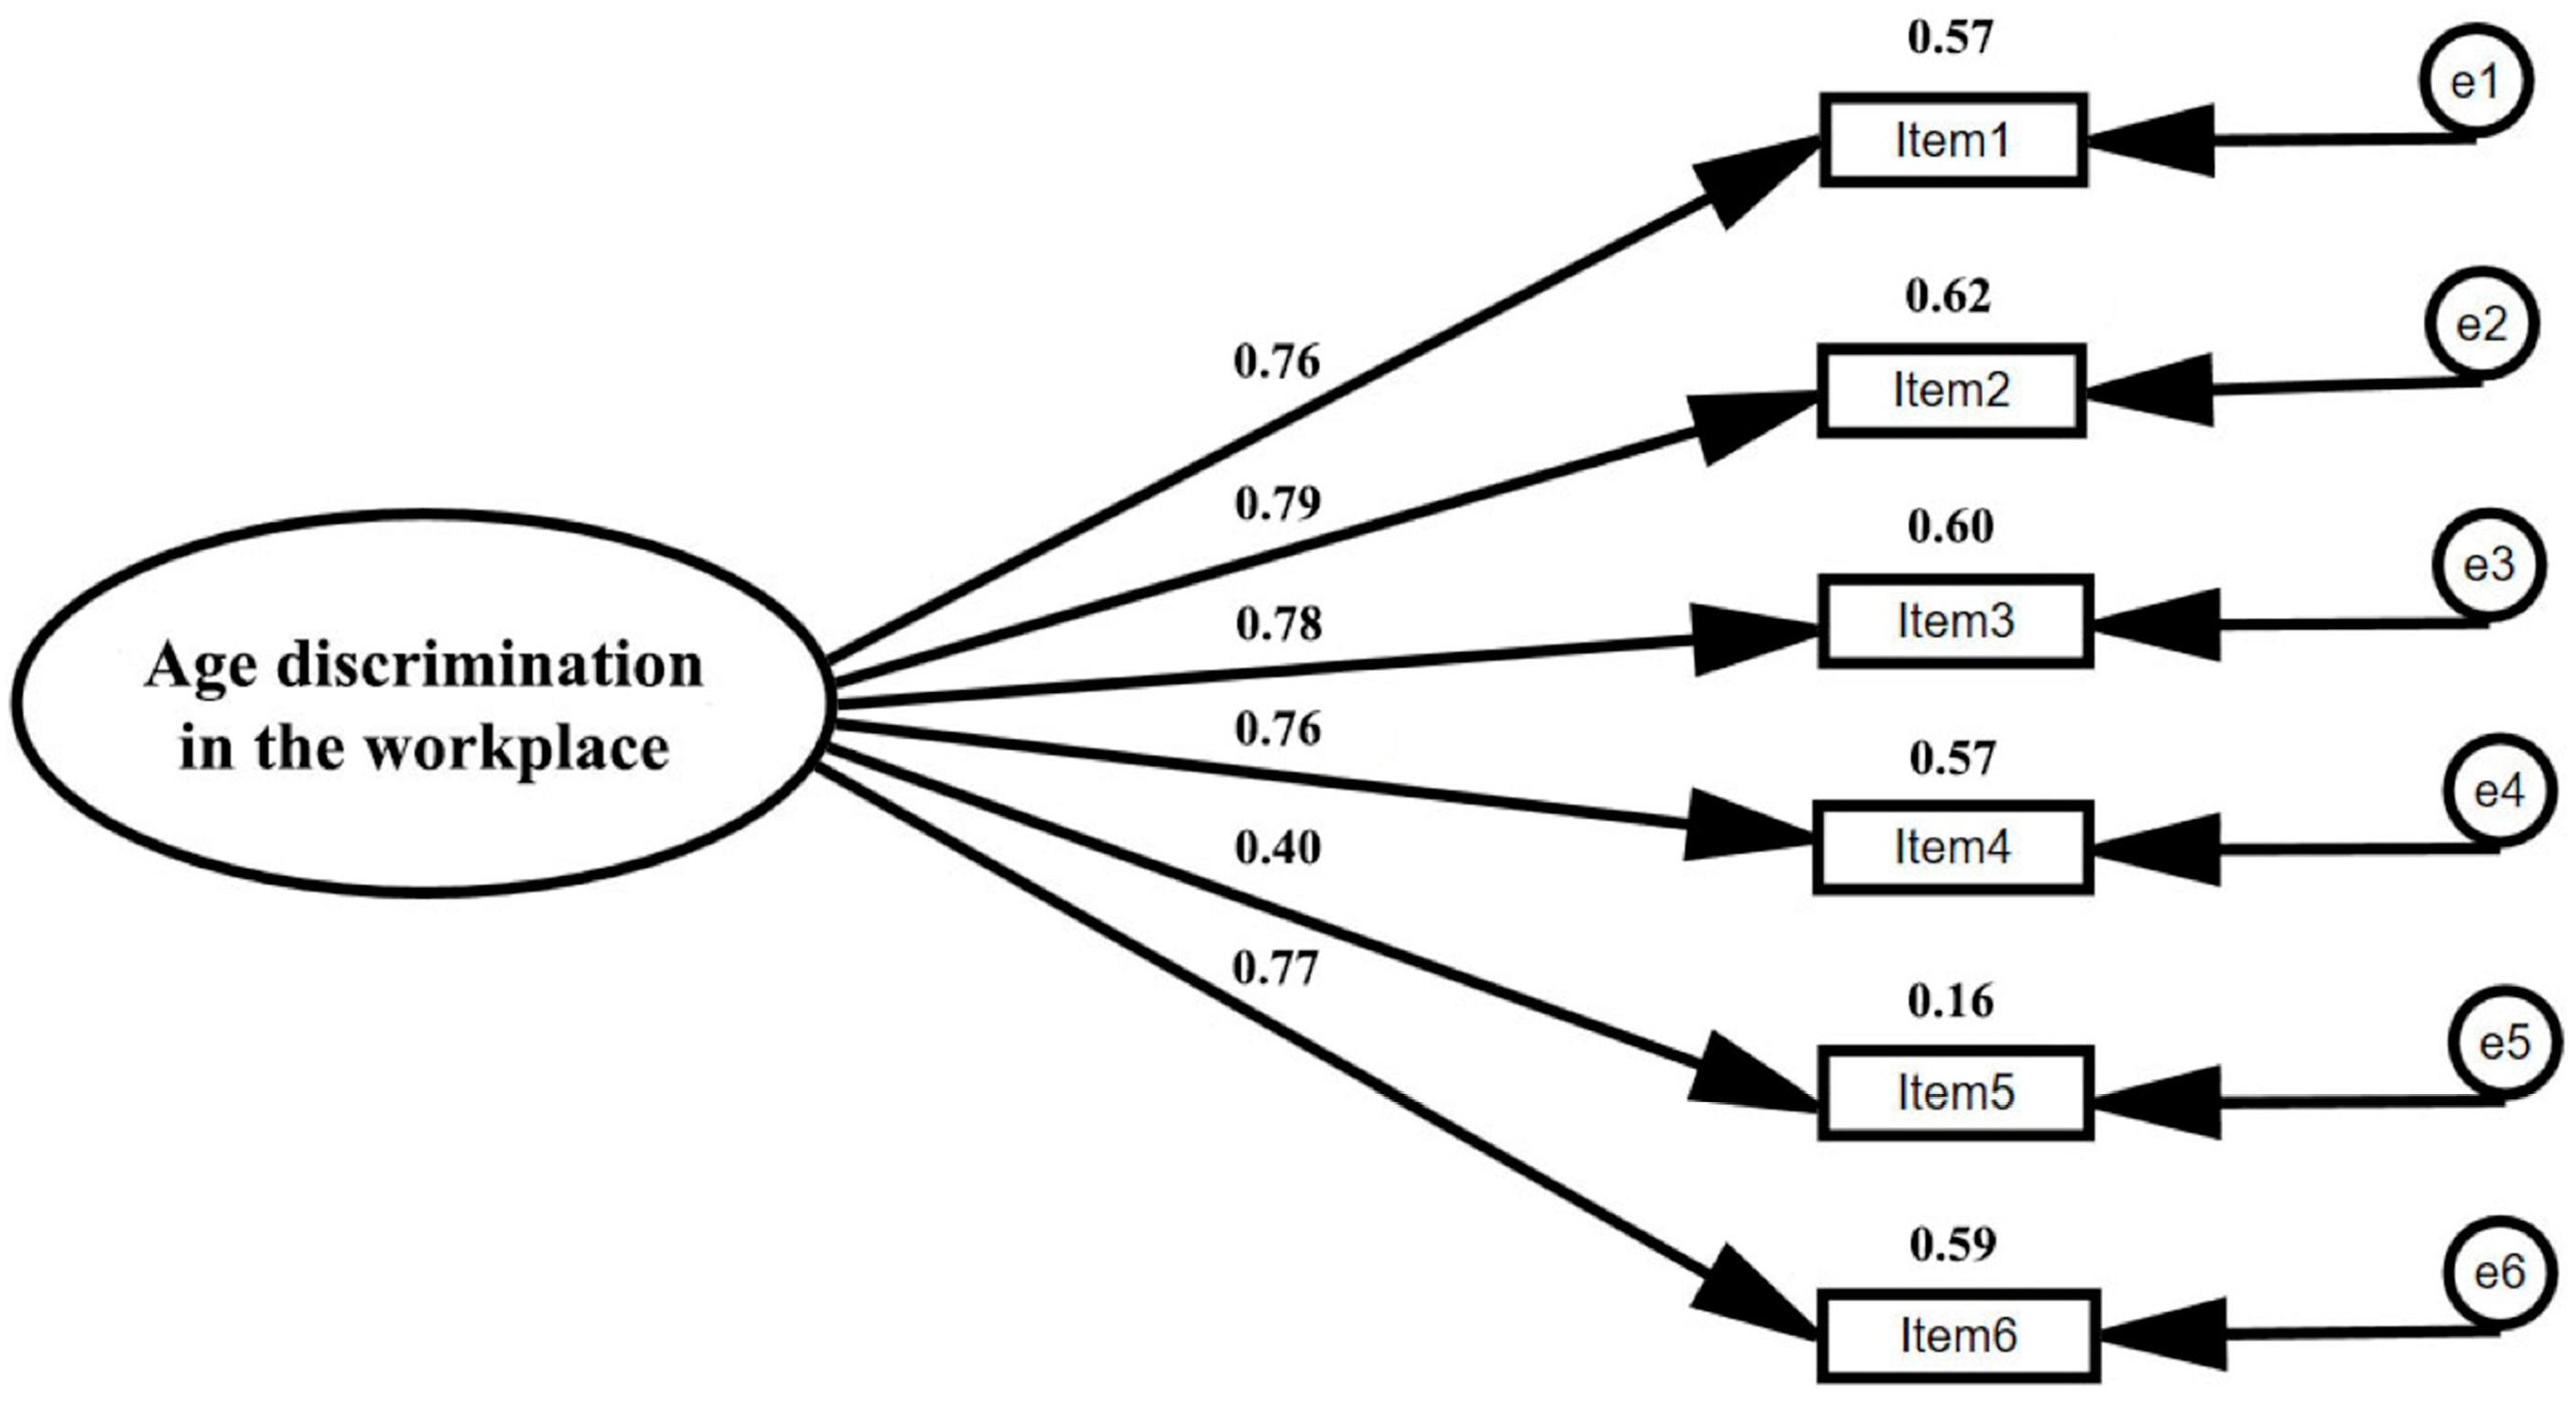
| NADS Model | χ2 | df | Ratio χ2/df | RMSEA | CFI | TLI |
|---|---|---|---|---|---|---|
| 1 factor | 15.716 | 9 | 1.746 | 0.085 | 0.974 | 0.939 |
| Variables | Mean | SD | NADS |
|---|---|---|---|
| 1. NADS | 2.37 | 1.07 | ---- |
| 2. Age inequality | 2.16 | 1.16 | 0.55 ** |
| 3. Bullying at work | 1.12 | 0.33 | 0.26 ** |
| 4. Self-efficacy | 4.43 | 0.71 | −0.22 ** |
| 5. Work ability 1 | 4.07 | 0.63 | −0.19 ** |
| 6. Work ability 2 | 8.36 | 0.140 | −0.18 ** |
| 7. Stress | 2.34 | 1.10 | 0.31 ** |
| 8. Sickness absence | 1.72 | 1.06 | 0.16 * |
| 9. Job and Life satisfaction | 3.70 | 0.71 | −0.20 ** |
| 10. Co-workers support | 3.99 | 0.88 | −0.31 ** |
| 11. Superior support12. Retirement intentions | 3.604.05 | 1.060.99 | −0.34 **0.05 |
© 2019 by the authors. Licensee MDPI, Basel, Switzerland. This article is an open access article distributed under the terms and conditions of the Creative Commons Attribution (CC BY) license (http://creativecommons.org/licenses/by/4.0/).
Share and Cite
Carral, P.; Alcover, C.-M. Measuring Age Discrimination at Work: Spanish Adaptation and Preliminary Validation of the Nordic Age Discrimination Scale (NADS). Int. J. Environ. Res. Public Health 2019, 16, 1431. https://doi.org/10.3390/ijerph16081431
Carral P, Alcover C-M. Measuring Age Discrimination at Work: Spanish Adaptation and Preliminary Validation of the Nordic Age Discrimination Scale (NADS). International Journal of Environmental Research and Public Health. 2019; 16(8):1431. https://doi.org/10.3390/ijerph16081431
Chicago/Turabian StyleCarral, Patricia, and Carlos-María Alcover. 2019. "Measuring Age Discrimination at Work: Spanish Adaptation and Preliminary Validation of the Nordic Age Discrimination Scale (NADS)" International Journal of Environmental Research and Public Health 16, no. 8: 1431. https://doi.org/10.3390/ijerph16081431
APA StyleCarral, P., & Alcover, C.-M. (2019). Measuring Age Discrimination at Work: Spanish Adaptation and Preliminary Validation of the Nordic Age Discrimination Scale (NADS). International Journal of Environmental Research and Public Health, 16(8), 1431. https://doi.org/10.3390/ijerph16081431