Real-Time Continuous Surveillance of Temperature and Flow Events Presents a Novel Monitoring Approach for Hospital and Healthcare Water Distribution Systems


Abstract
1. Introduction
2. Materials and Methods
2.1. Study Site
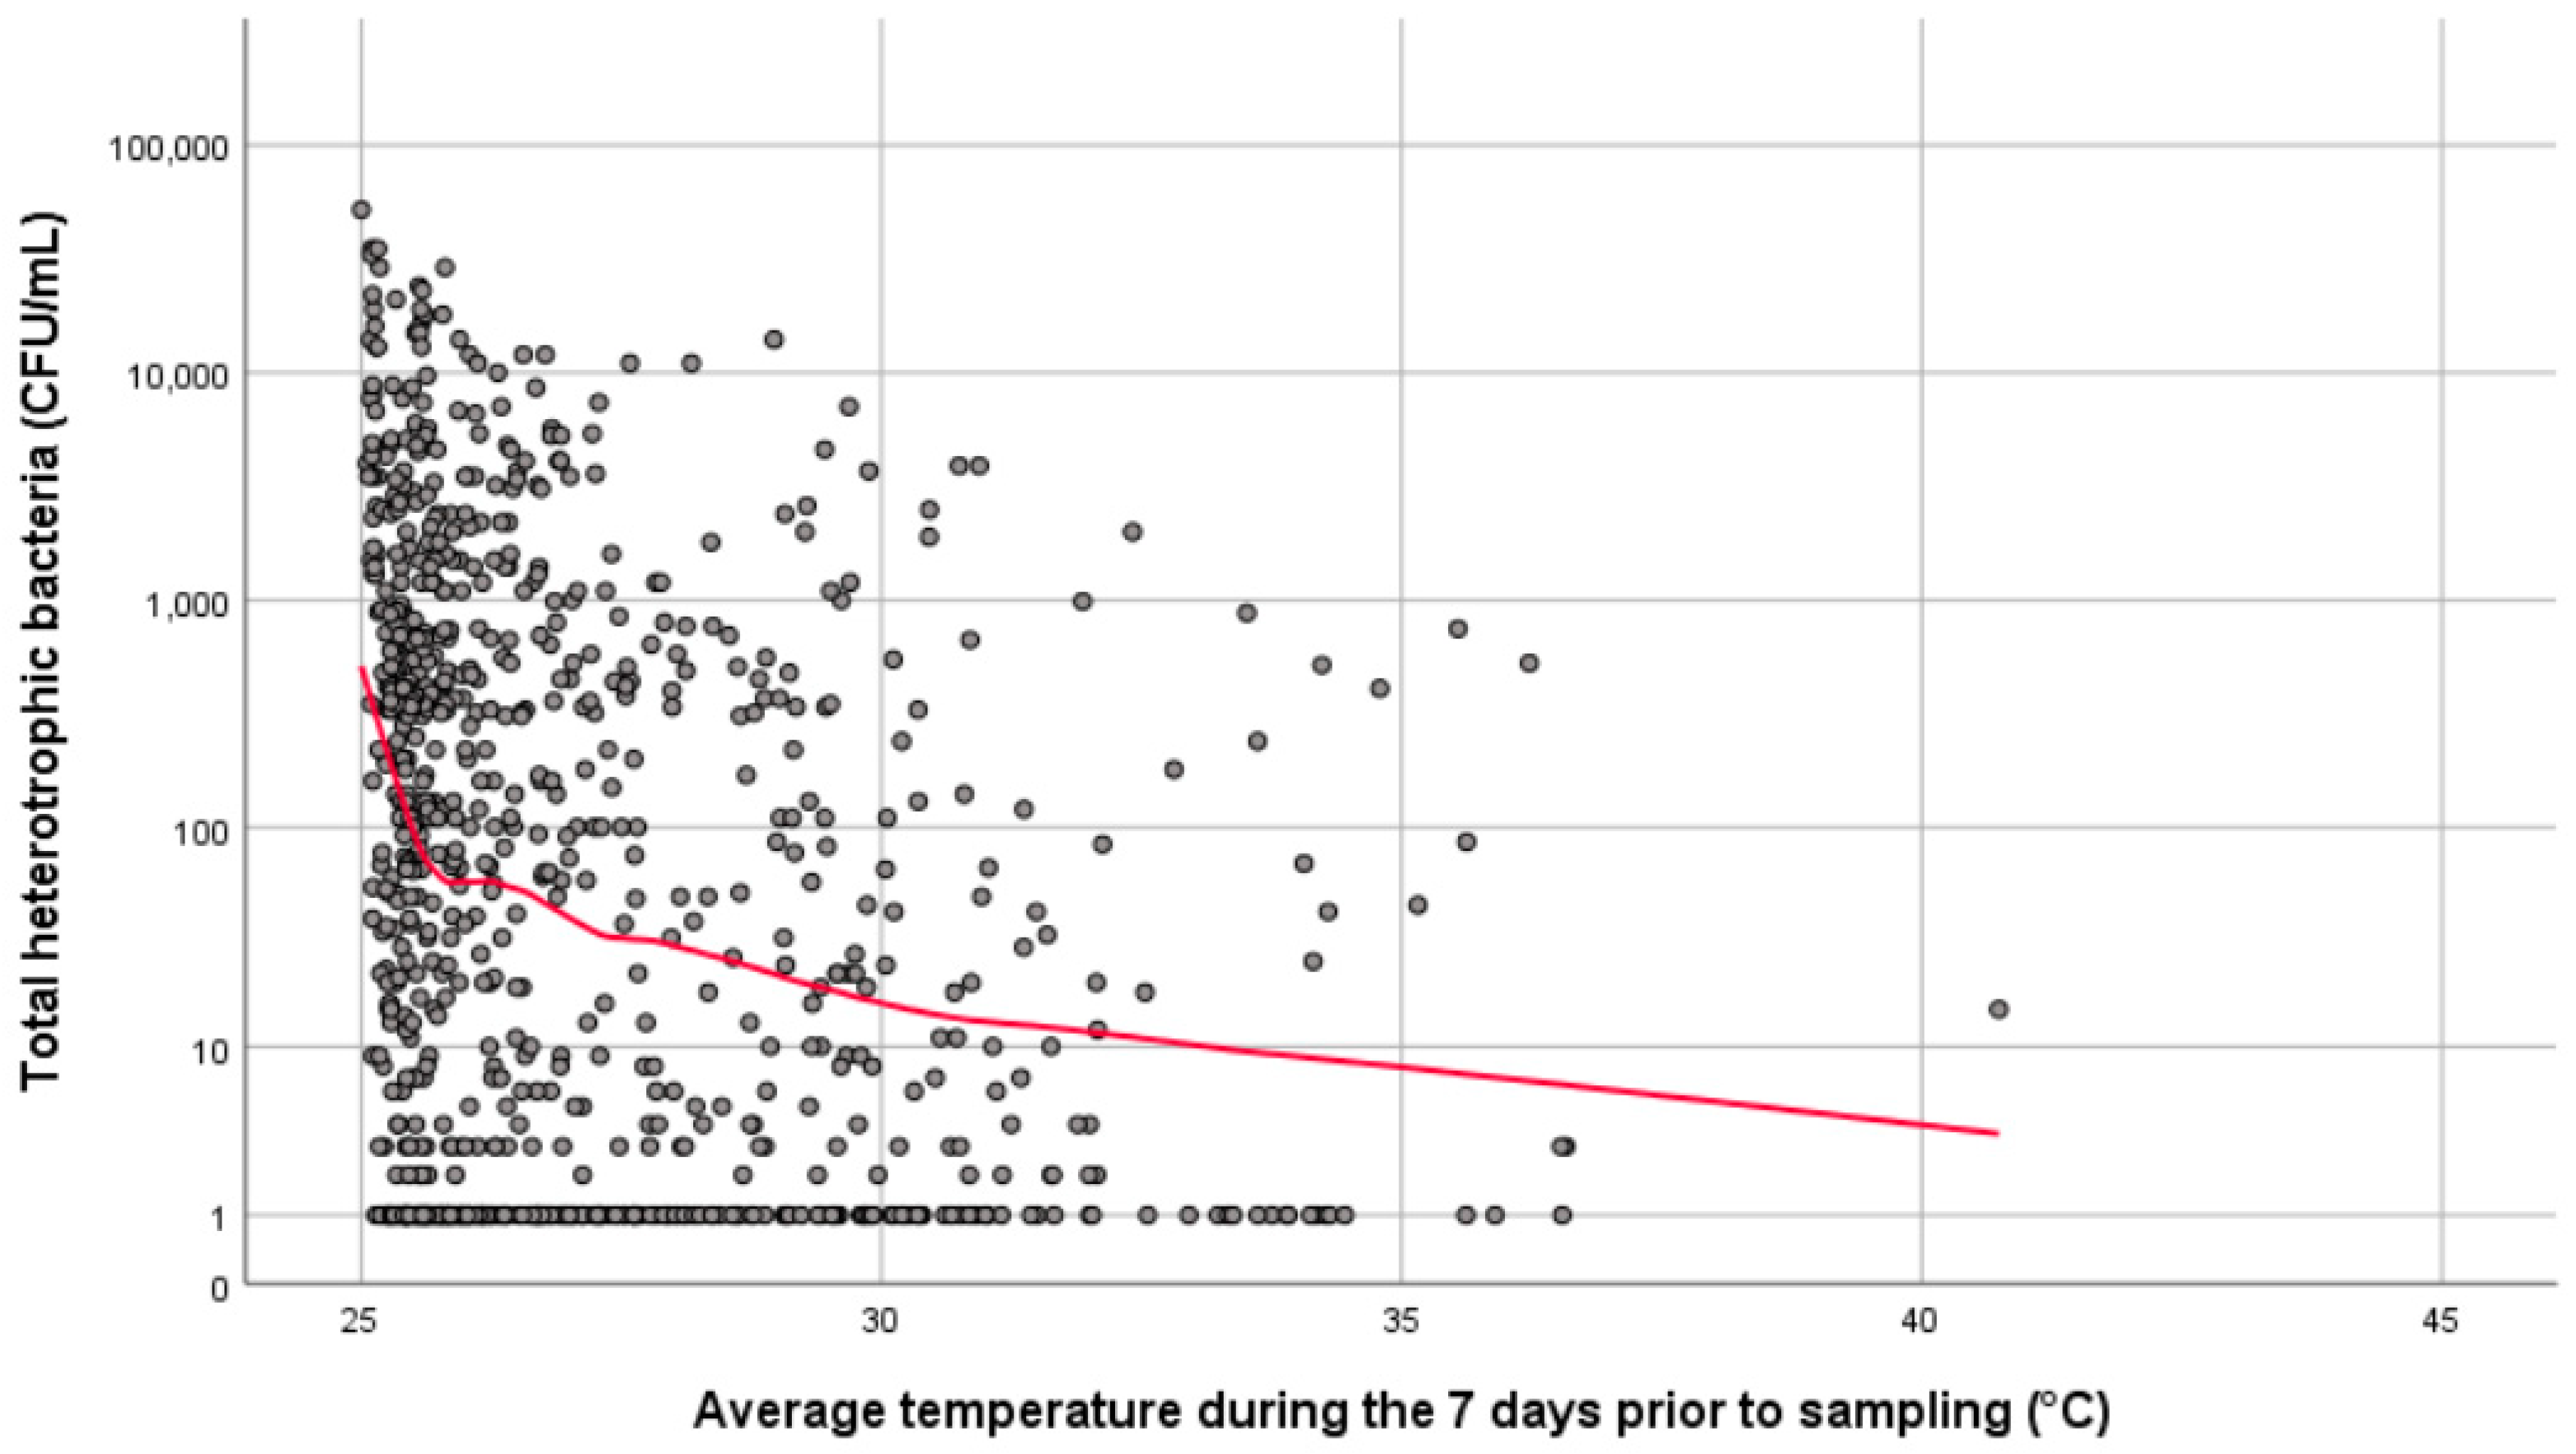
2.2. Temperature
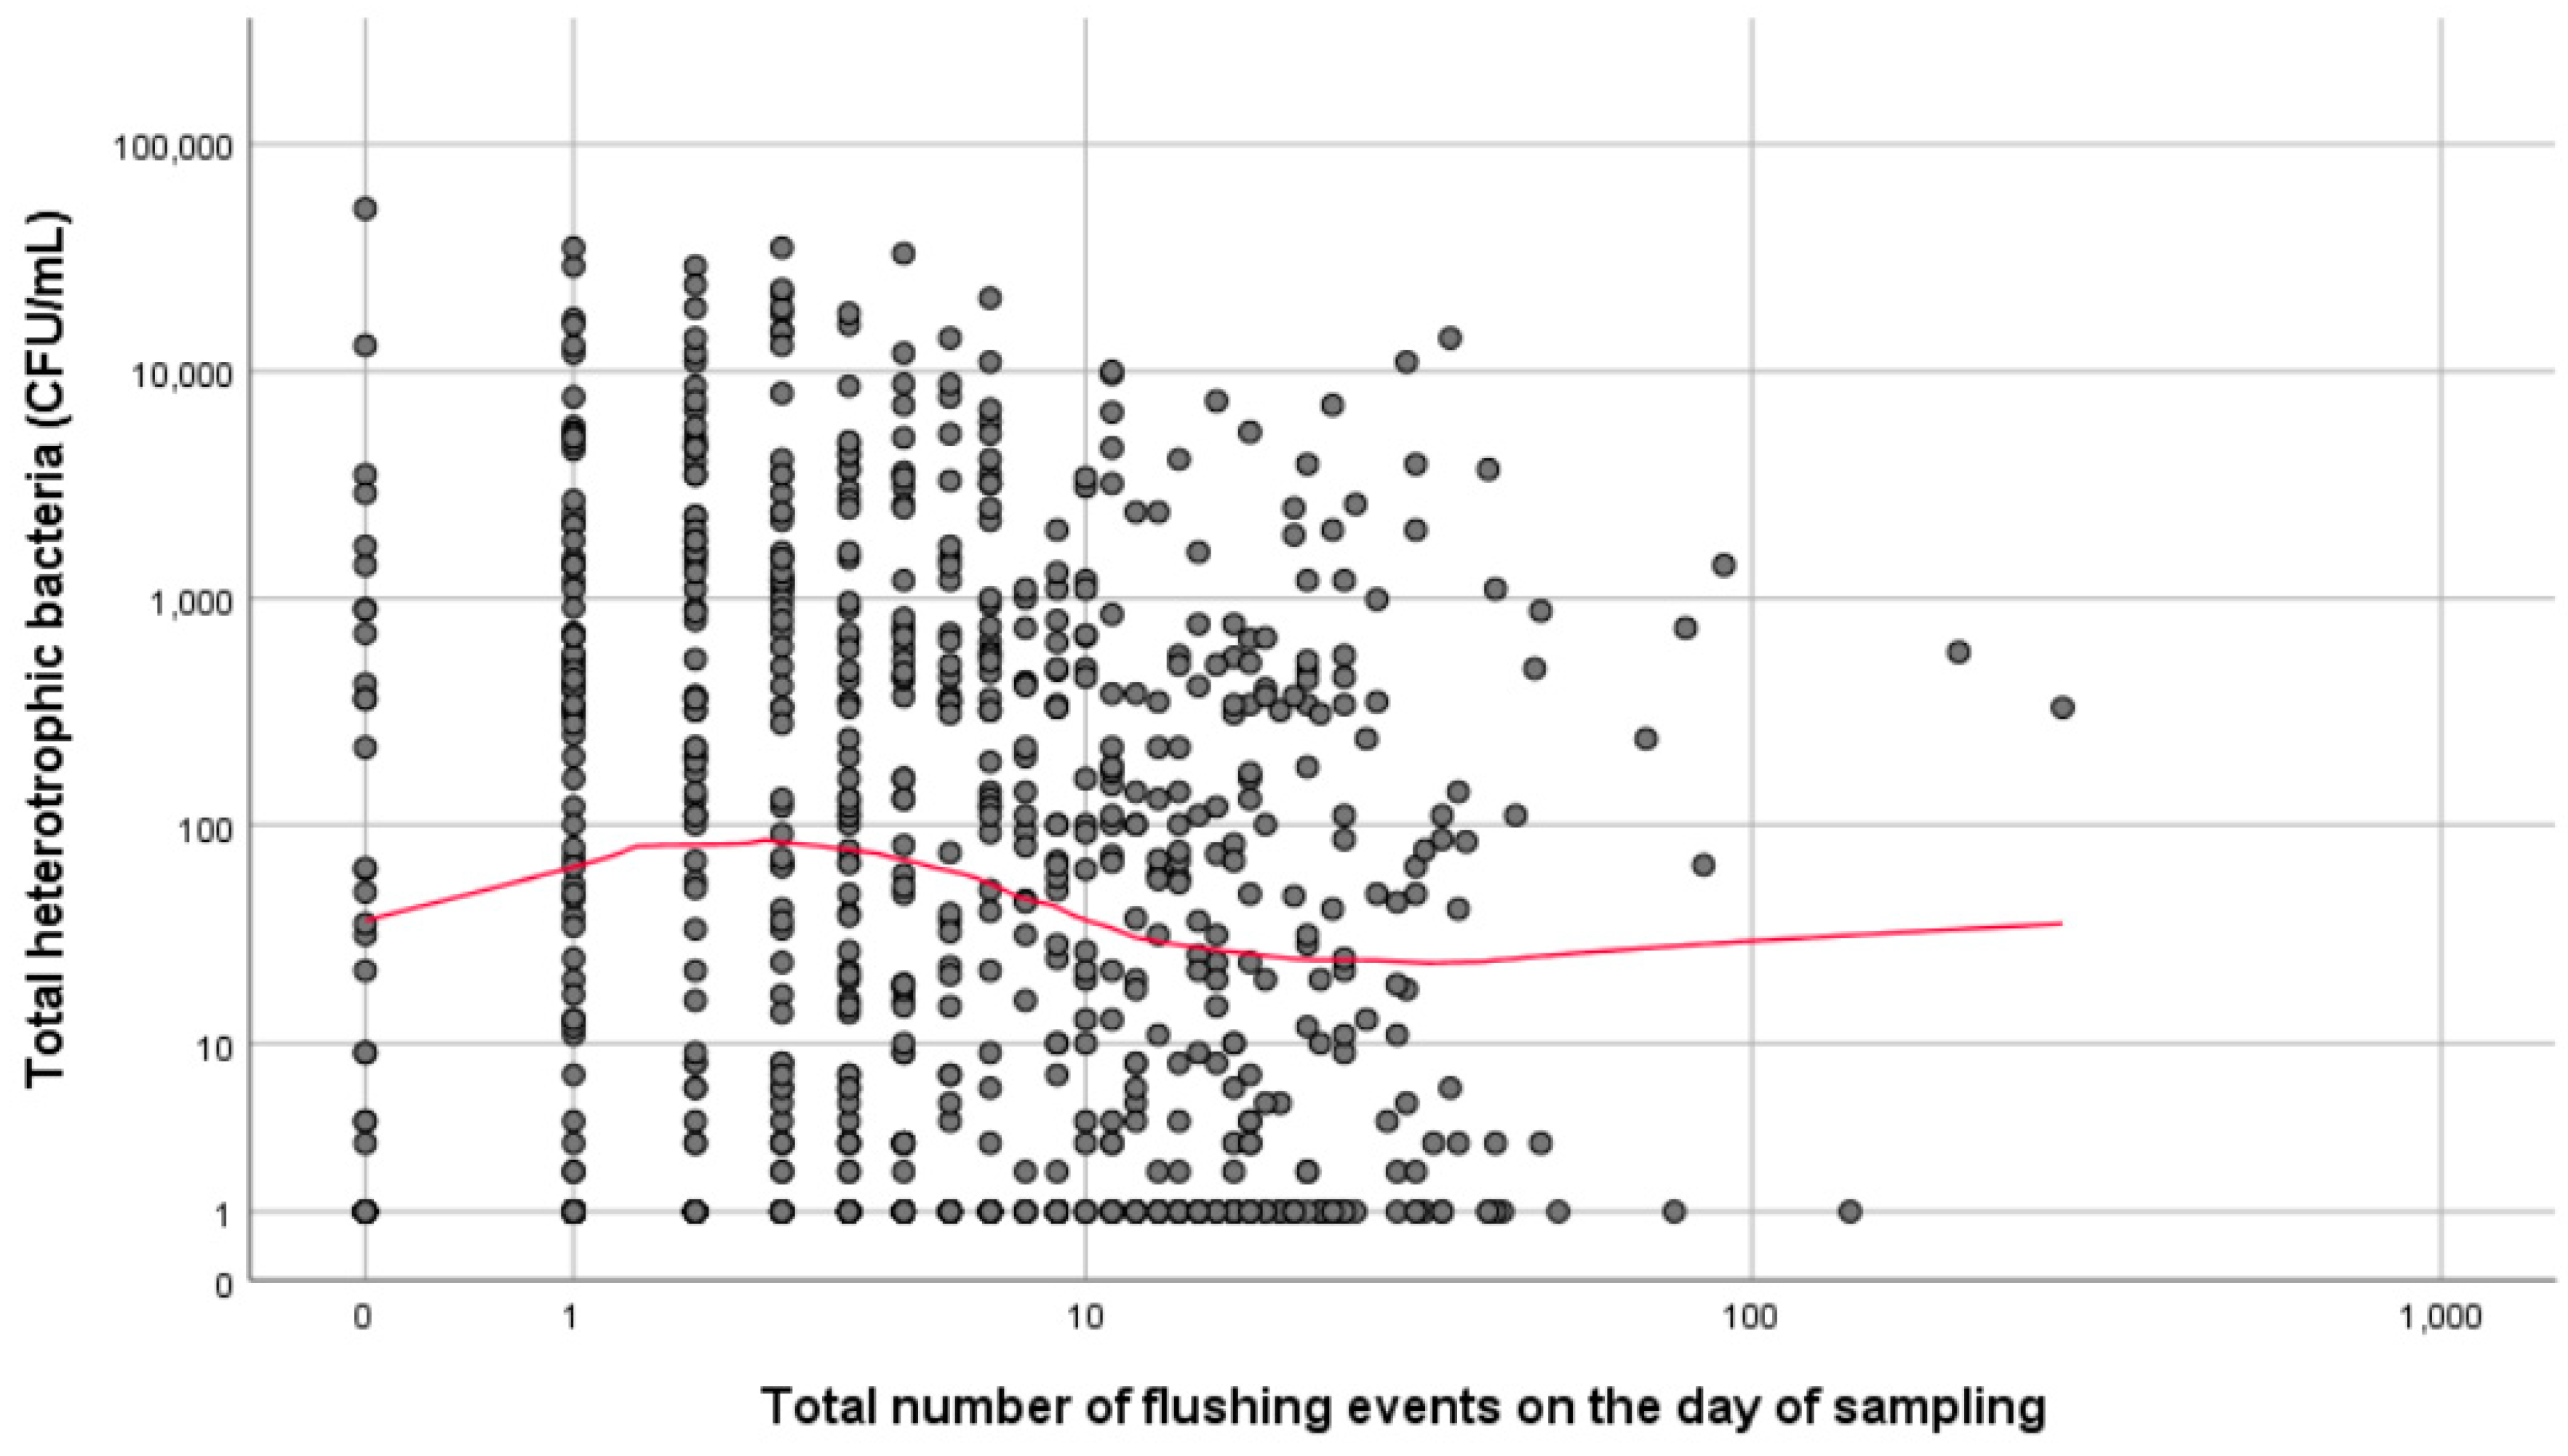
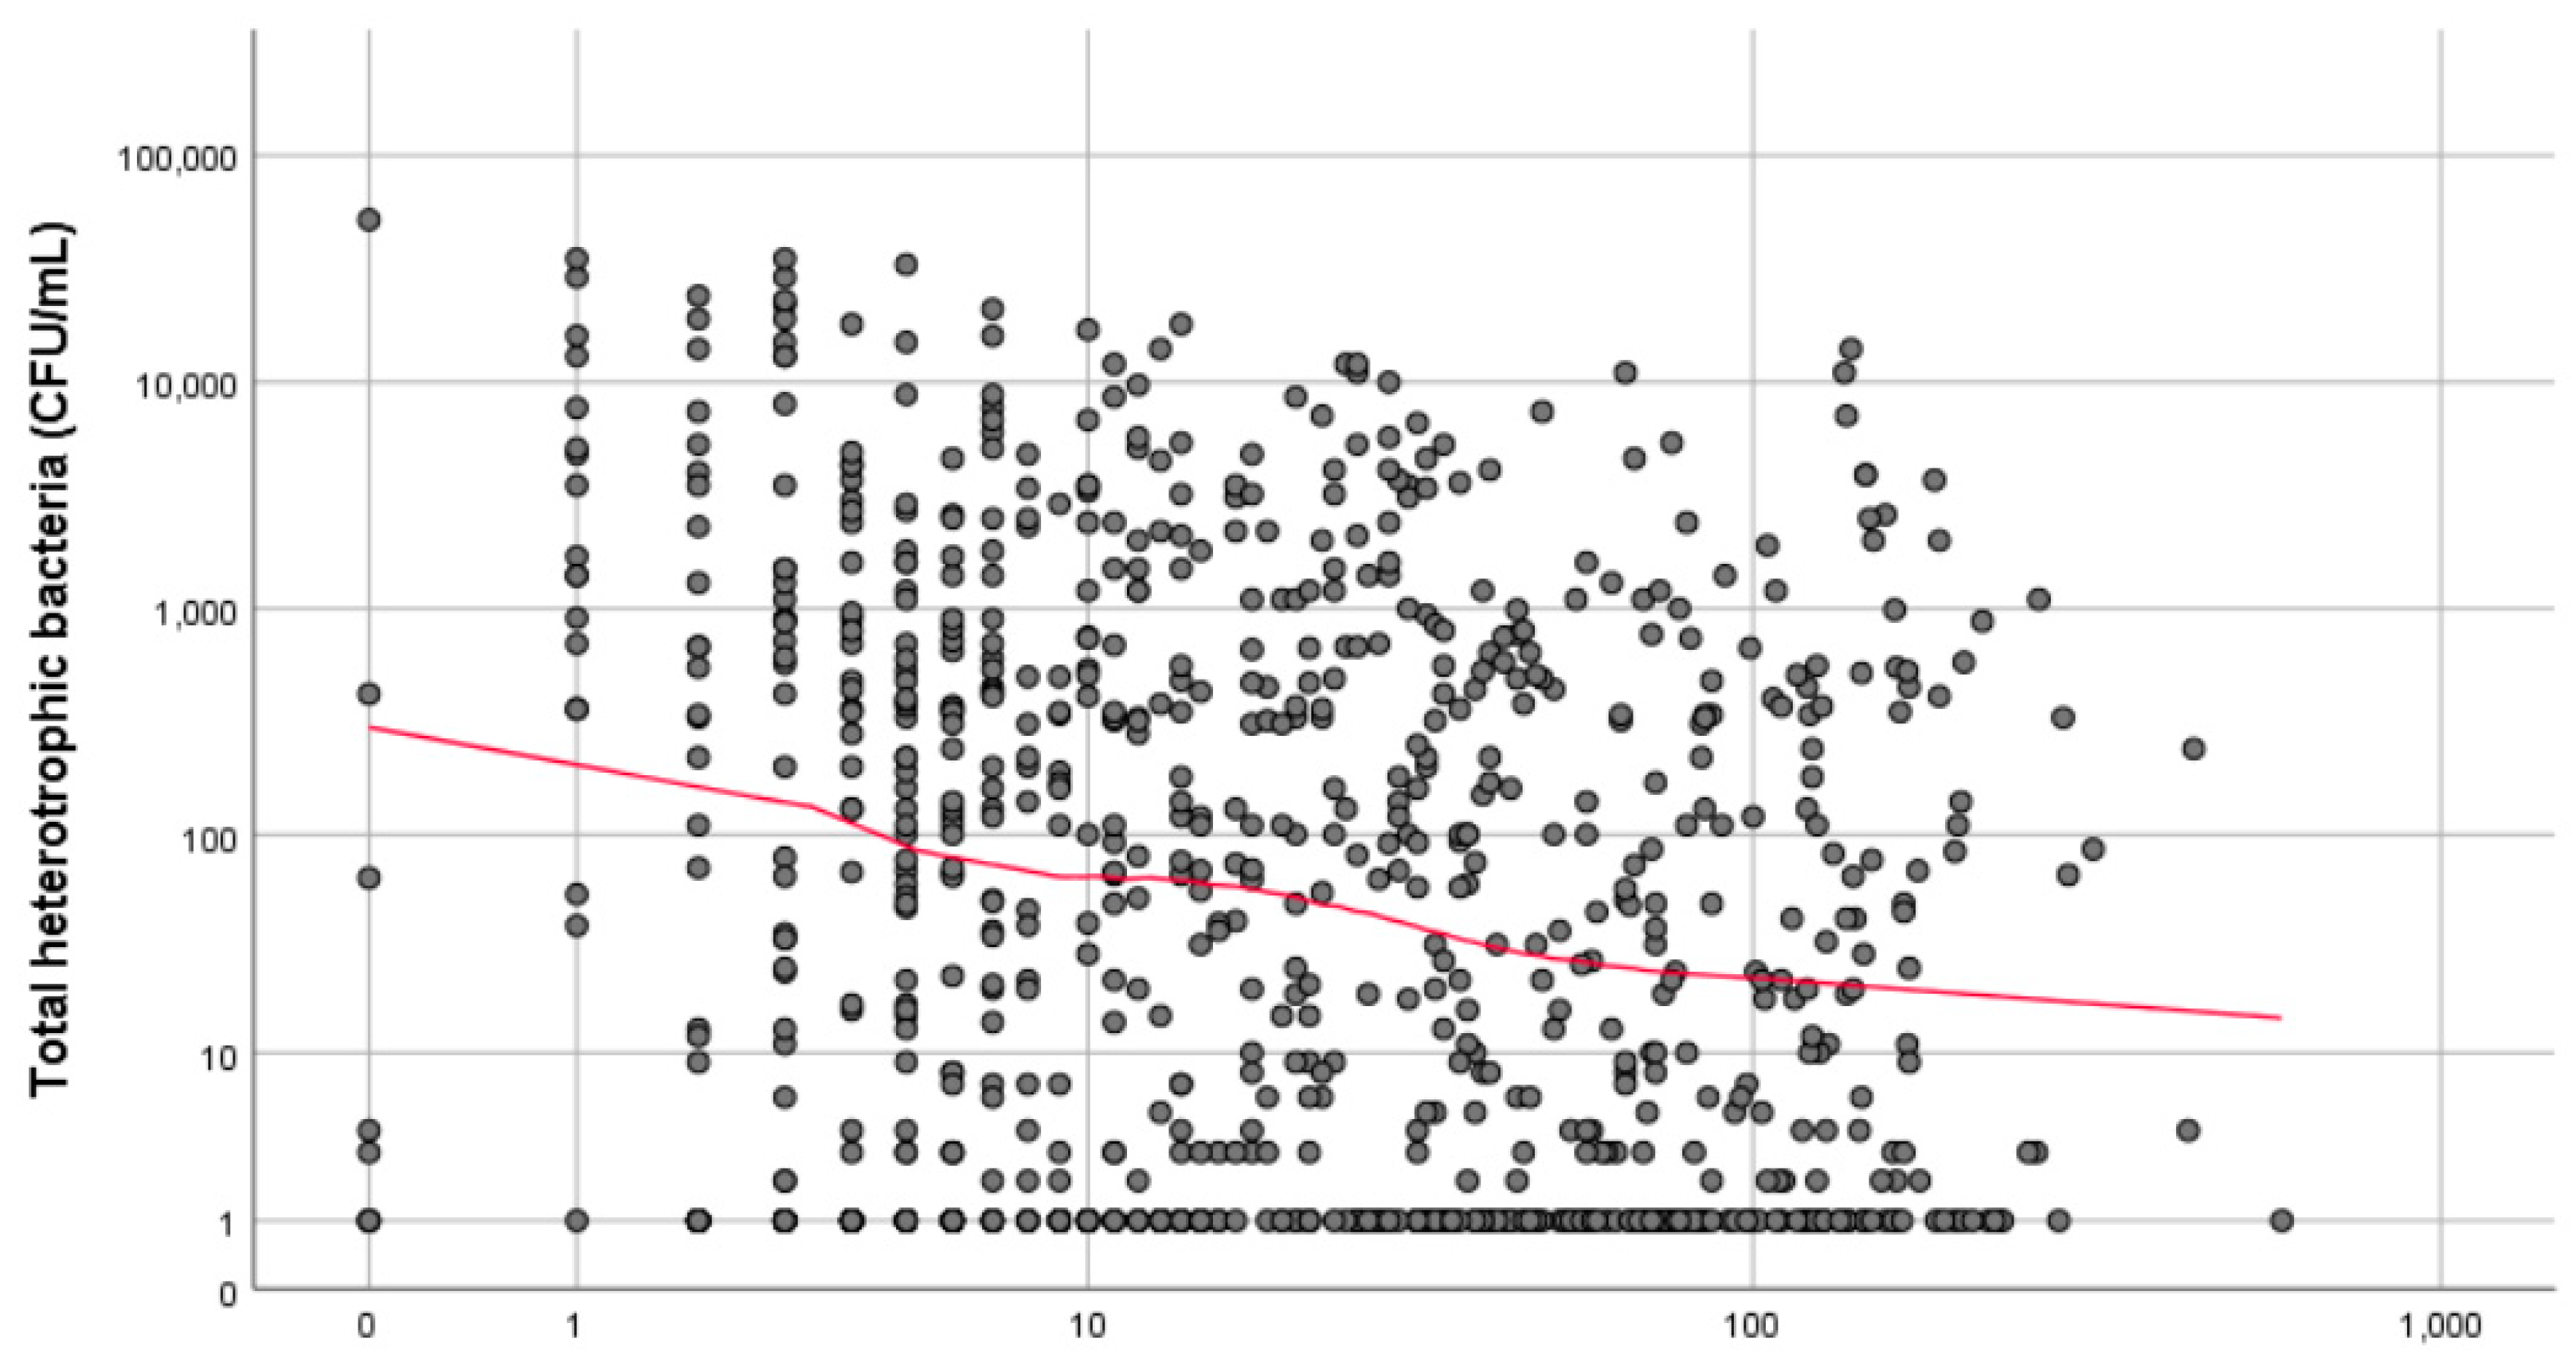
2.3. Flushing Events
- Total flushing events on day of sampling,
- Total flushing events less than 15 s duration on day of sampling,
- Total flushing events longer than 15 s on day of sampling,
- Total flushing events during the 3 days prior to sampling,
- Total flushing events during the 7 days prior to sampling.
2.4. Microbiological Sampling
2.5. Statistics
3. Results
4. Discussion
5. Conclusions
Supplementary Materials
Author Contributions
Funding
Acknowledgments
Conflicts of Interest
References
- Bentham, R.; Whiley, H. Quantitative Microbial Risk Assessment and Opportunist Waterborne Infections—Are There Too Many Gaps to Fill? Int. J. Environ. Res. Public Health 2018, 15, 1150. [Google Scholar] [CrossRef]
- Ashbolt, N. Environmental (Saprozoic) Pathogens of Engineered Water Systems: Understanding Their Ecology for Risk Assessment and Management. Pathogens 2015, 4, 390–405. [Google Scholar] [CrossRef]
- Anaissie, E.J.; Penzak, S.R.; Dignani, M.C. The hospital water supply as a source of nosocomial infections: A plea for action. Arch. Intern. Med. 2002, 162, 1483–1492. [Google Scholar] [CrossRef]
- Exner, M.; Kramer, A.; Lajoie, L.; Gebel, J.; Engelhart, S.; Hartemann, P. Prevention and control of health care–associated waterborne infections in health care facilities. Am. J. Infect. Control 2005, 33, S26–S40. [Google Scholar] [CrossRef]
- Squier, C.; Victor, L.Y.; Stout, J.E. Waterborne nosocomial infections. Curr. Infect. Dis. Rep. 2000, 2, 490–496. [Google Scholar] [CrossRef]
- Whiley, H. Legionella Risk Management and Control in Potable Water Systems: Argument for the Abolishment of Routine Testing. Int. J. Environ. Res. Public Health 2016, 14, 12. [Google Scholar] [CrossRef]
- Whiley, H.; Keegan, A.; Fallowfield, H.; Bentham, R. Detection of Legionella, L. pneumophila and Mycobacterium avium complex (MAC) along potable water distribution pipelines. Int. J. Environ. Res. Public Health 2014, 11, 7393–7495. [Google Scholar] [CrossRef]
- Lawrence, C.; Reyrolle, M.; Dubrou, S.; Forey, F.; Decludt, B.; Goulvestre, C.; Matsiota-Bernard, P.; Etienne, J.; Nauciel, C. Single clonal origin of a high proportion of Legionella pneumophila serogroup 1 isolates from patients and the environment in the area of Paris, France, over a 10-year period. J. Clin. Microbiol. 1999, 37, 2652–2655. [Google Scholar]
- Ciesielski, C.; Blaser, M.; Wang, W. Role of stagnation and obstruction of water flow in isolation of Legionella pneumophila from hospital plumbing. Appl. Environ. Microbiol. 1984, 48, 984–987. [Google Scholar]
- Flemming, H.-C.; Wingender, J. The biofilm matrix. Nat. Rev. Microbiol. 2010, 8, 623. [Google Scholar] [CrossRef]
- Percival, S.; Walker, J. Potable water and biofilms: A review of the public health implications. Biofouling 1999, 14, 99–115. [Google Scholar] [CrossRef]
- Manuel, C.; Nunes, O.; Melo, L. Unsteady state flow and stagnation in distribution systems affect the biological stability of drinking water. Biofouling 2009, 26, 129–139. [Google Scholar] [CrossRef]
- Lautenschlager, K.; Boon, N.; Wang, Y.; Egli, T.; Hammes, F. Overnight stagnation of drinking water in household taps induces microbial growth and changes in community composition. Water Res. 2010, 44, 4868–4877. [Google Scholar] [CrossRef]
- Lipphaus, P.; Hammes, F.; Kötzsch, S.; Green, J.; Gillespie, S.; Nocker, A. Microbiological tap water profile of a medium-sized building and effect of water stagnation. Environ. Technol. 2014, 35, 620–628. [Google Scholar] [CrossRef]
- Inkinen, J.; Kaunisto, T.; Pursiainen, A.; Miettinen, I.T.; Kusnetsov, J.; Riihinen, K.; Keinänen-Toivola, M.M. Drinking water quality and formation of biofilms in an office building during its first year of operation, a full scale study. Water Res. 2014, 49, 83–91. [Google Scholar] [CrossRef]
- Standards Australia. AS/NZS 3500 Plumbing and Drainagze Set; Standards Australia: Canberra, Australia, 2013. [Google Scholar]
- Bartram, J.; Chartier, Y.; Lee, J.; Pond, K.; Surman-Lee, S. Legionella and the Prevention of Legionellosis; World Health Organization: Geneva, Switzerland, 2007. [Google Scholar]
- Liu, J.-Q.; Luo, Z.-F.; Liu, K.; Zhang, Y.-F.; Peng, H.-X.; Hu, B.-L.; Ren, H.-X.; Zhou, X.-Y.; Qiu, S.-D.; He, X.-F.; et al. Effect of flushing on the detachment of biofilms attached to the walls of metal pipes in water distribution systems. J. Zhejiang Univ. Sci. A 2017, 18, 313–328. [Google Scholar] [CrossRef]
- Bargellini, A.; Marchesi, I.; Righi, E.; Ferrari, A.; Cencetti, S.; Borella, P.; Rovesti, S. Parameters predictive of Legionella contamination in hot water systems: Association with trace elements and heterotrophic plate counts. Water Res. 2011, 45, 2315–2321. [Google Scholar] [CrossRef]
- Alary, M.; Joly, J.R. Factors Contributing to the Contamination of Hospital Water Distribution Systems by Legionellae. J. Infect. Dis. 1992, 165, 565–569. [Google Scholar] [CrossRef]
- Rhoads, W.J.; Ji, P.; Pruden, A.; Edwards, M.A. Water heater temperature set point and water use patterns influence Legionella pneumophila and associated microorganisms at the tap. J. Microbiome 2015, 3, 67. [Google Scholar] [CrossRef]
- Brown, R.S.; Hussain, M. The Walkerton tragedy—Issues for water quality monitoring. Anal. J. 2003, 128, 320–322. [Google Scholar] [CrossRef]
- McCoy, W.F.; Downes, E.L.; Leonidas, L.F.; Cain, M.F.; Sherman, D.L.; Chen, K.; Devender, S.; Neville, M.J. Inaccuracy in Legionella tests of building water systems due to sample holding time. Water Res. 2012, 46, 3497–3506. [Google Scholar] [CrossRef]


| Sample Location ID | Date | Average Temperature (°C) | Number of Flushing Events | Microbiological Results (CFU/mL) | |||
|---|---|---|---|---|---|---|---|
| On the Day of Sampling | During the 7 Days Prior to Sampling | On the Day of Sampling | During 7 Days Prior to Sampling | Total Heterotrophic Bacteria | Legionella pneumophila SG1 | ||
| 58 | 15 November 2013 | 26.9 | 25.4 | 10 | 11 | 690 | 10 |
| 45 | 31 January 2014 | 29.9 | 28.2 | 31 | 136 | 11,000 | 10 |
| 45 | 26 June 2014 | 31.1 | 29 | 36 | 139 | 14,000 | 20 |
| 63 | 25 September 2014 | 28 | 26.1 | 7 | 17 | 3500 | 20 |
© 2019 by the authors. Licensee MDPI, Basel, Switzerland. This article is an open access article distributed under the terms and conditions of the Creative Commons Attribution (CC BY) license (http://creativecommons.org/licenses/by/4.0/).
Share and Cite
Whiley, H.; Hinds, J.; Xi, J.; Bentham, R. Real-Time Continuous Surveillance of Temperature and Flow Events Presents a Novel Monitoring Approach for Hospital and Healthcare Water Distribution Systems. Int. J. Environ. Res. Public Health 2019, 16, 1332. https://doi.org/10.3390/ijerph16081332
Whiley H, Hinds J, Xi J, Bentham R. Real-Time Continuous Surveillance of Temperature and Flow Events Presents a Novel Monitoring Approach for Hospital and Healthcare Water Distribution Systems. International Journal of Environmental Research and Public Health. 2019; 16(8):1332. https://doi.org/10.3390/ijerph16081332
Chicago/Turabian StyleWhiley, Harriet, Jason Hinds, James Xi, and Richard Bentham. 2019. "Real-Time Continuous Surveillance of Temperature and Flow Events Presents a Novel Monitoring Approach for Hospital and Healthcare Water Distribution Systems" International Journal of Environmental Research and Public Health 16, no. 8: 1332. https://doi.org/10.3390/ijerph16081332
APA StyleWhiley, H., Hinds, J., Xi, J., & Bentham, R. (2019). Real-Time Continuous Surveillance of Temperature and Flow Events Presents a Novel Monitoring Approach for Hospital and Healthcare Water Distribution Systems. International Journal of Environmental Research and Public Health, 16(8), 1332. https://doi.org/10.3390/ijerph16081332