Comparison of Radon and Thoron Concentration Measuring Systems Among Asian Countries

 ,
, 

 ,
,
Abstract
1. Introduction
2. Materials and Methods
2.1. Comparison Procedure
2.2. Characteristics of Participant’s Facilities
2.3. Characteristics of Devices
2.4. Evaluation Metrics
3. Results and Discussion
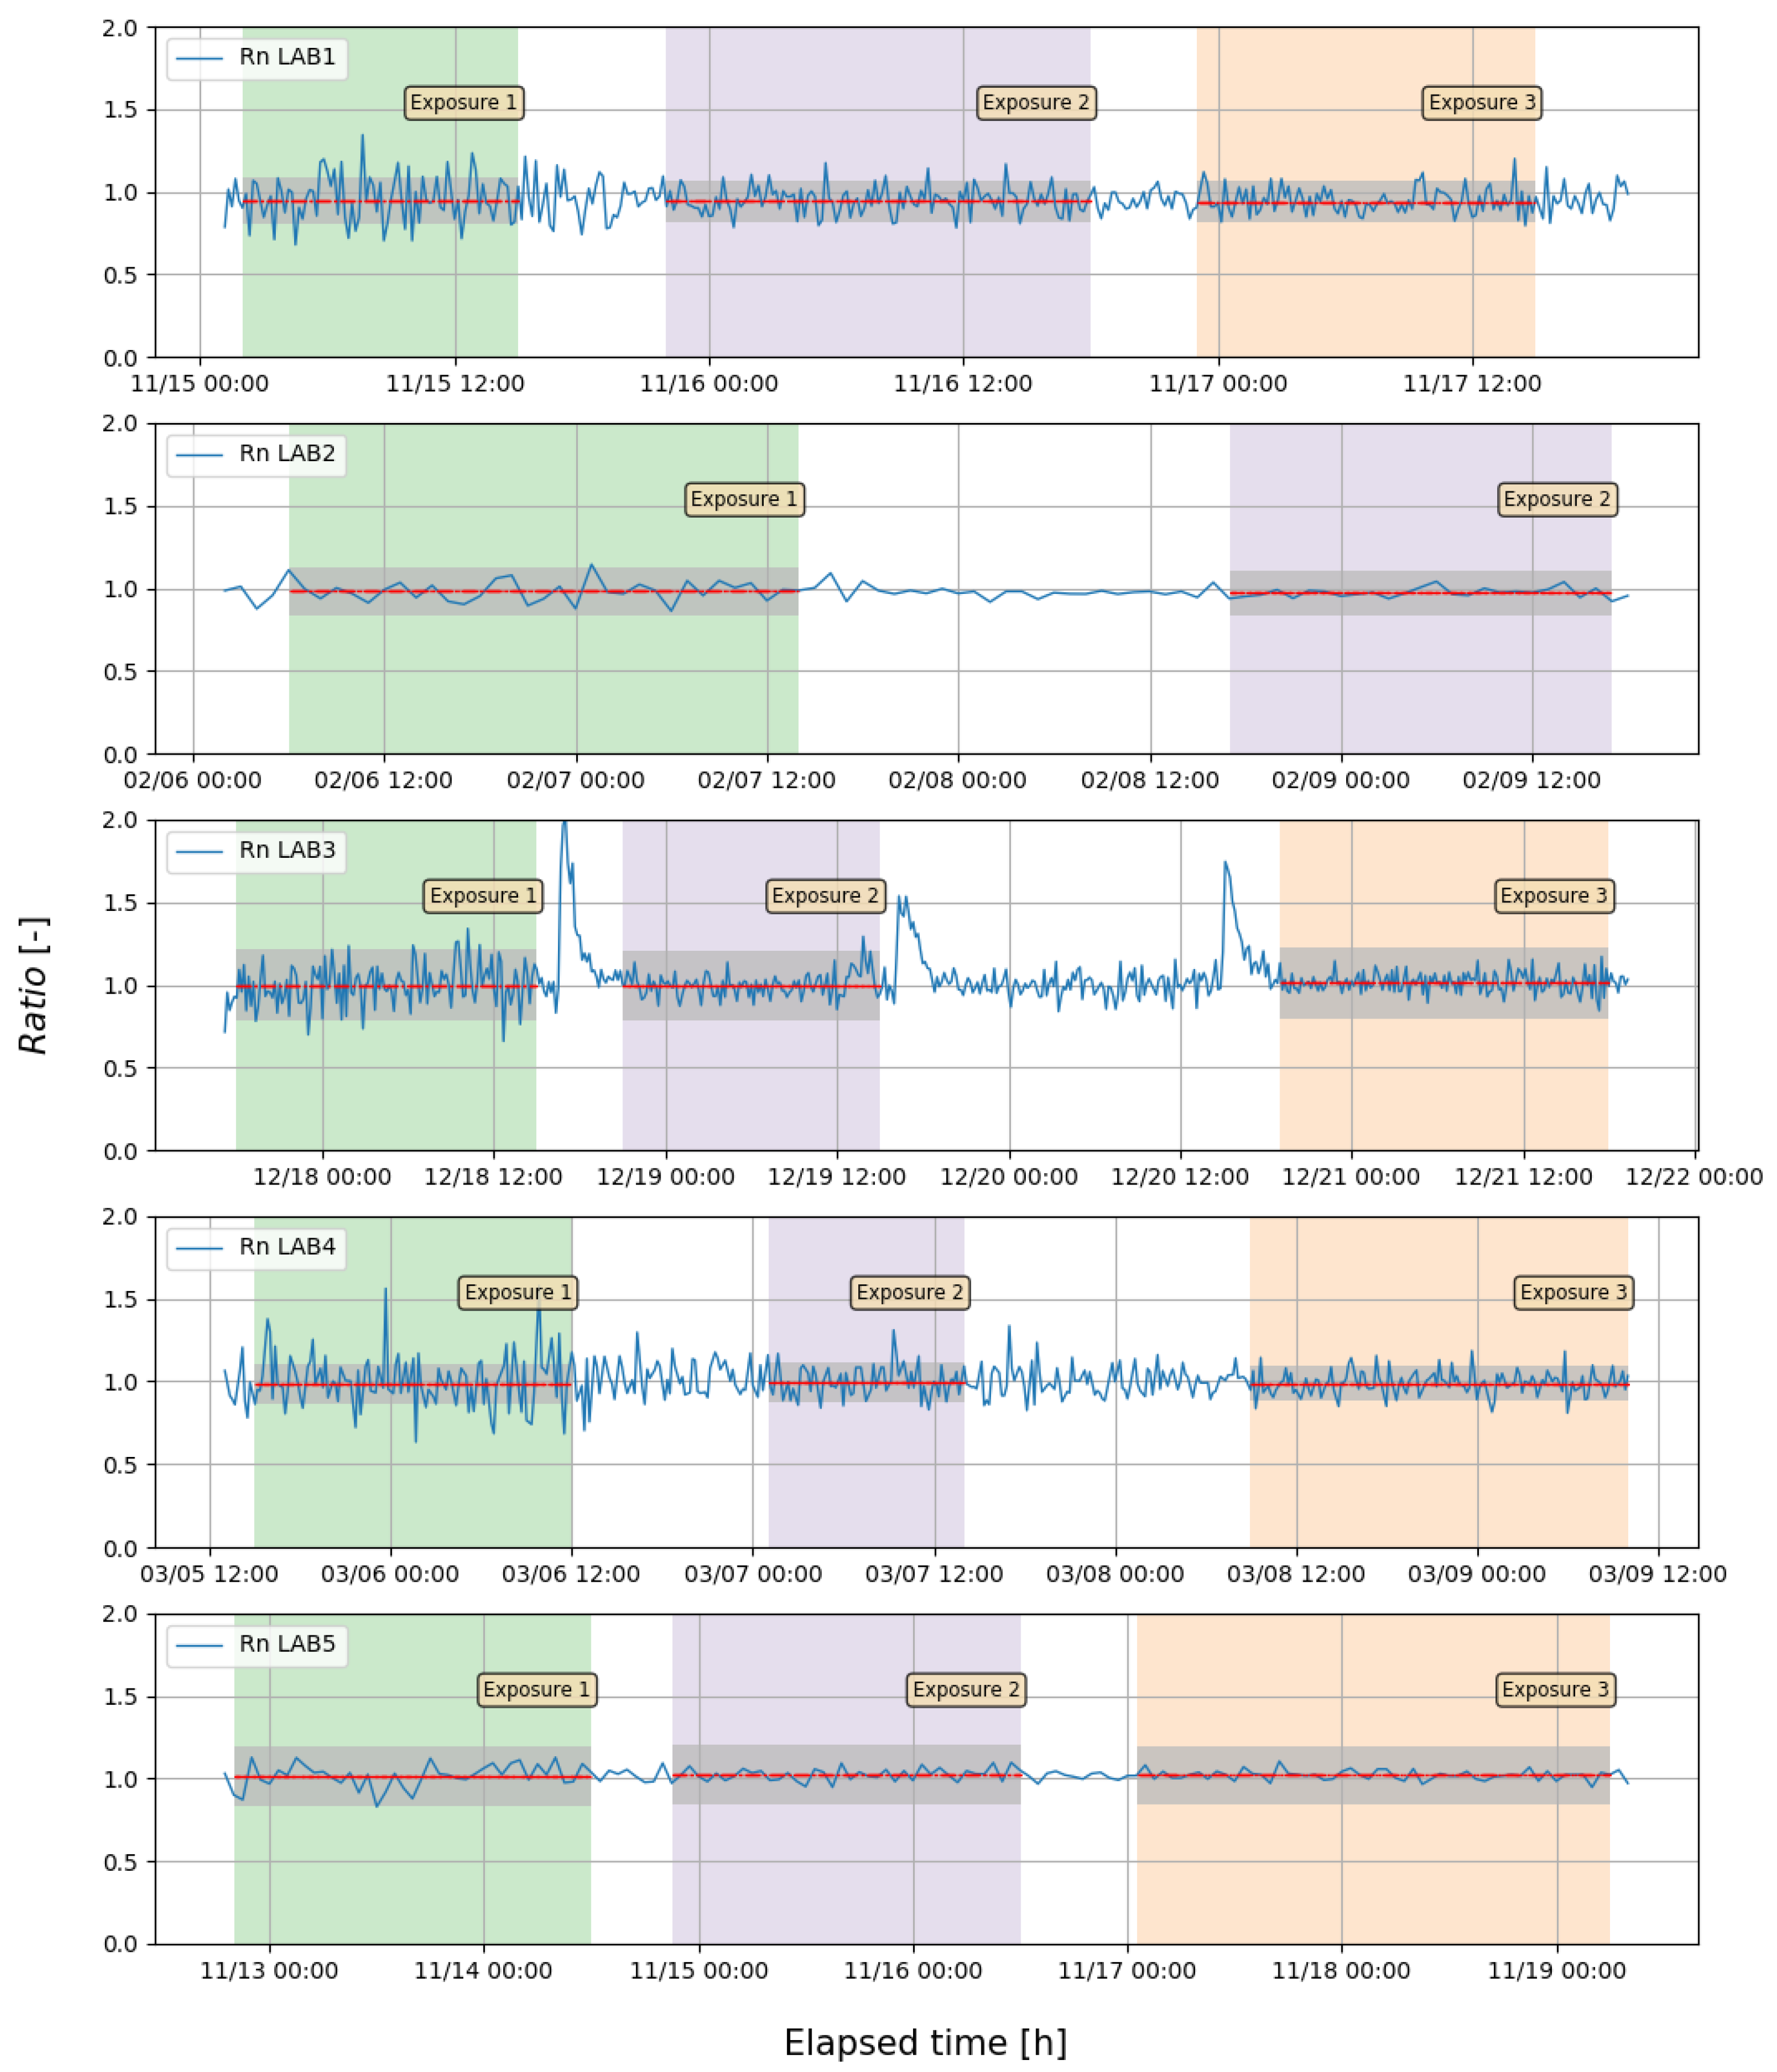
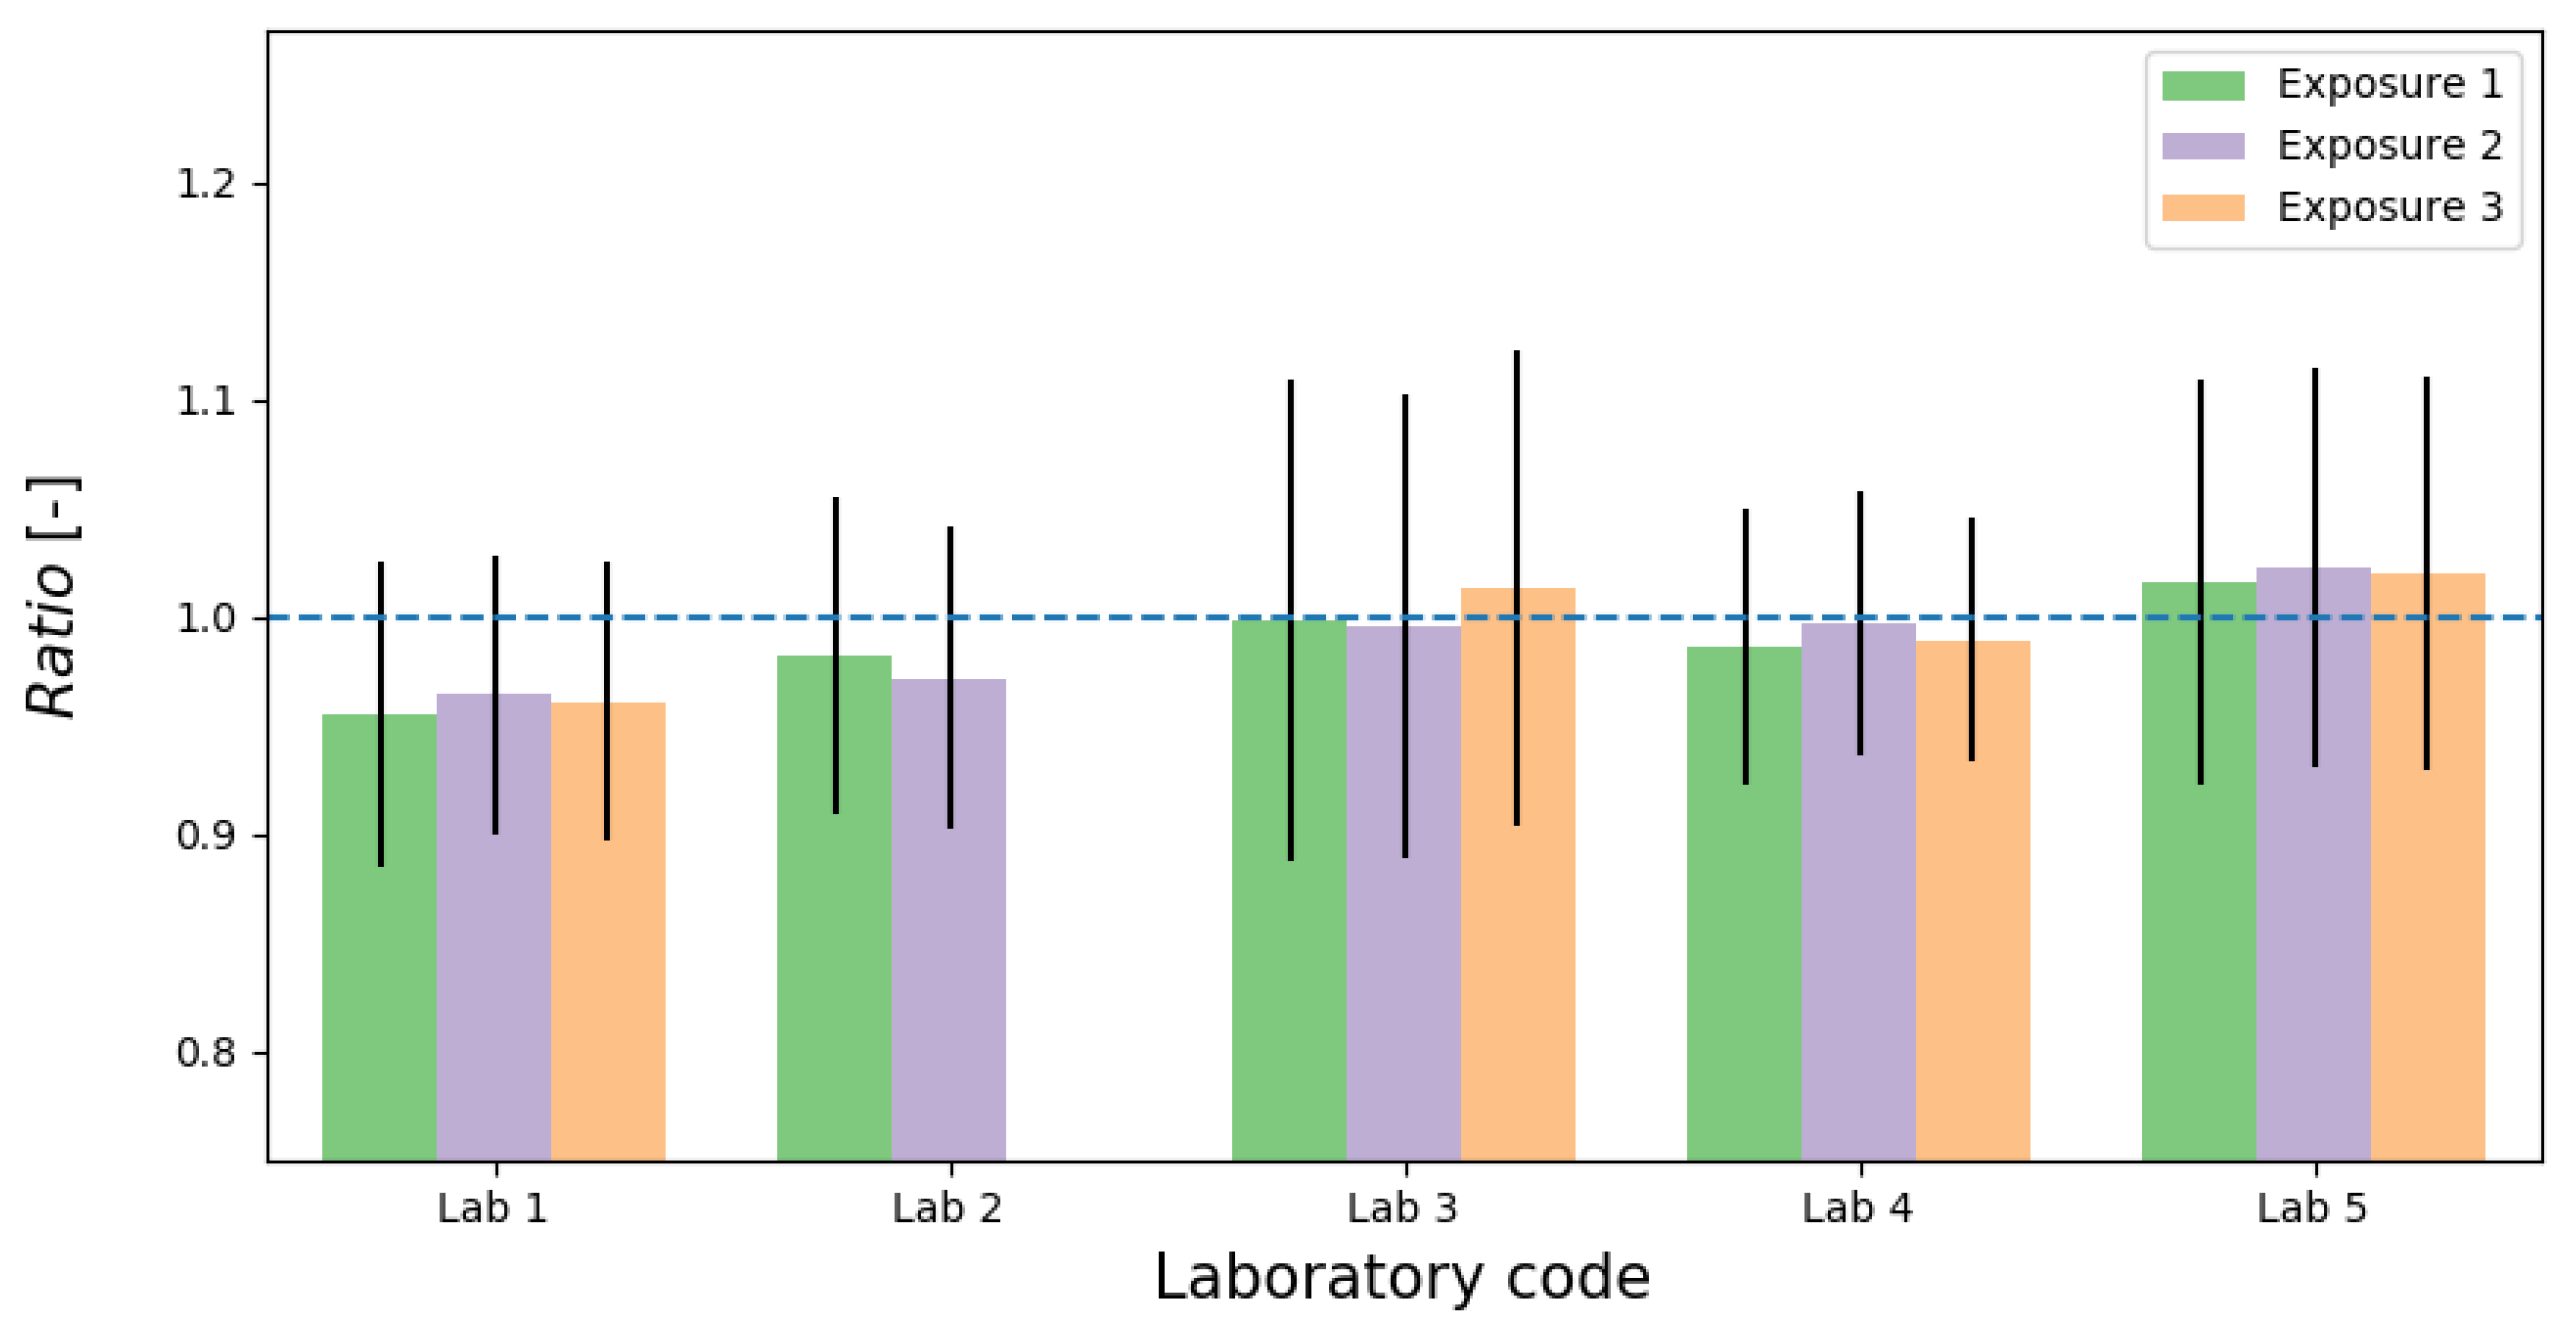
3.1. Results for Rn
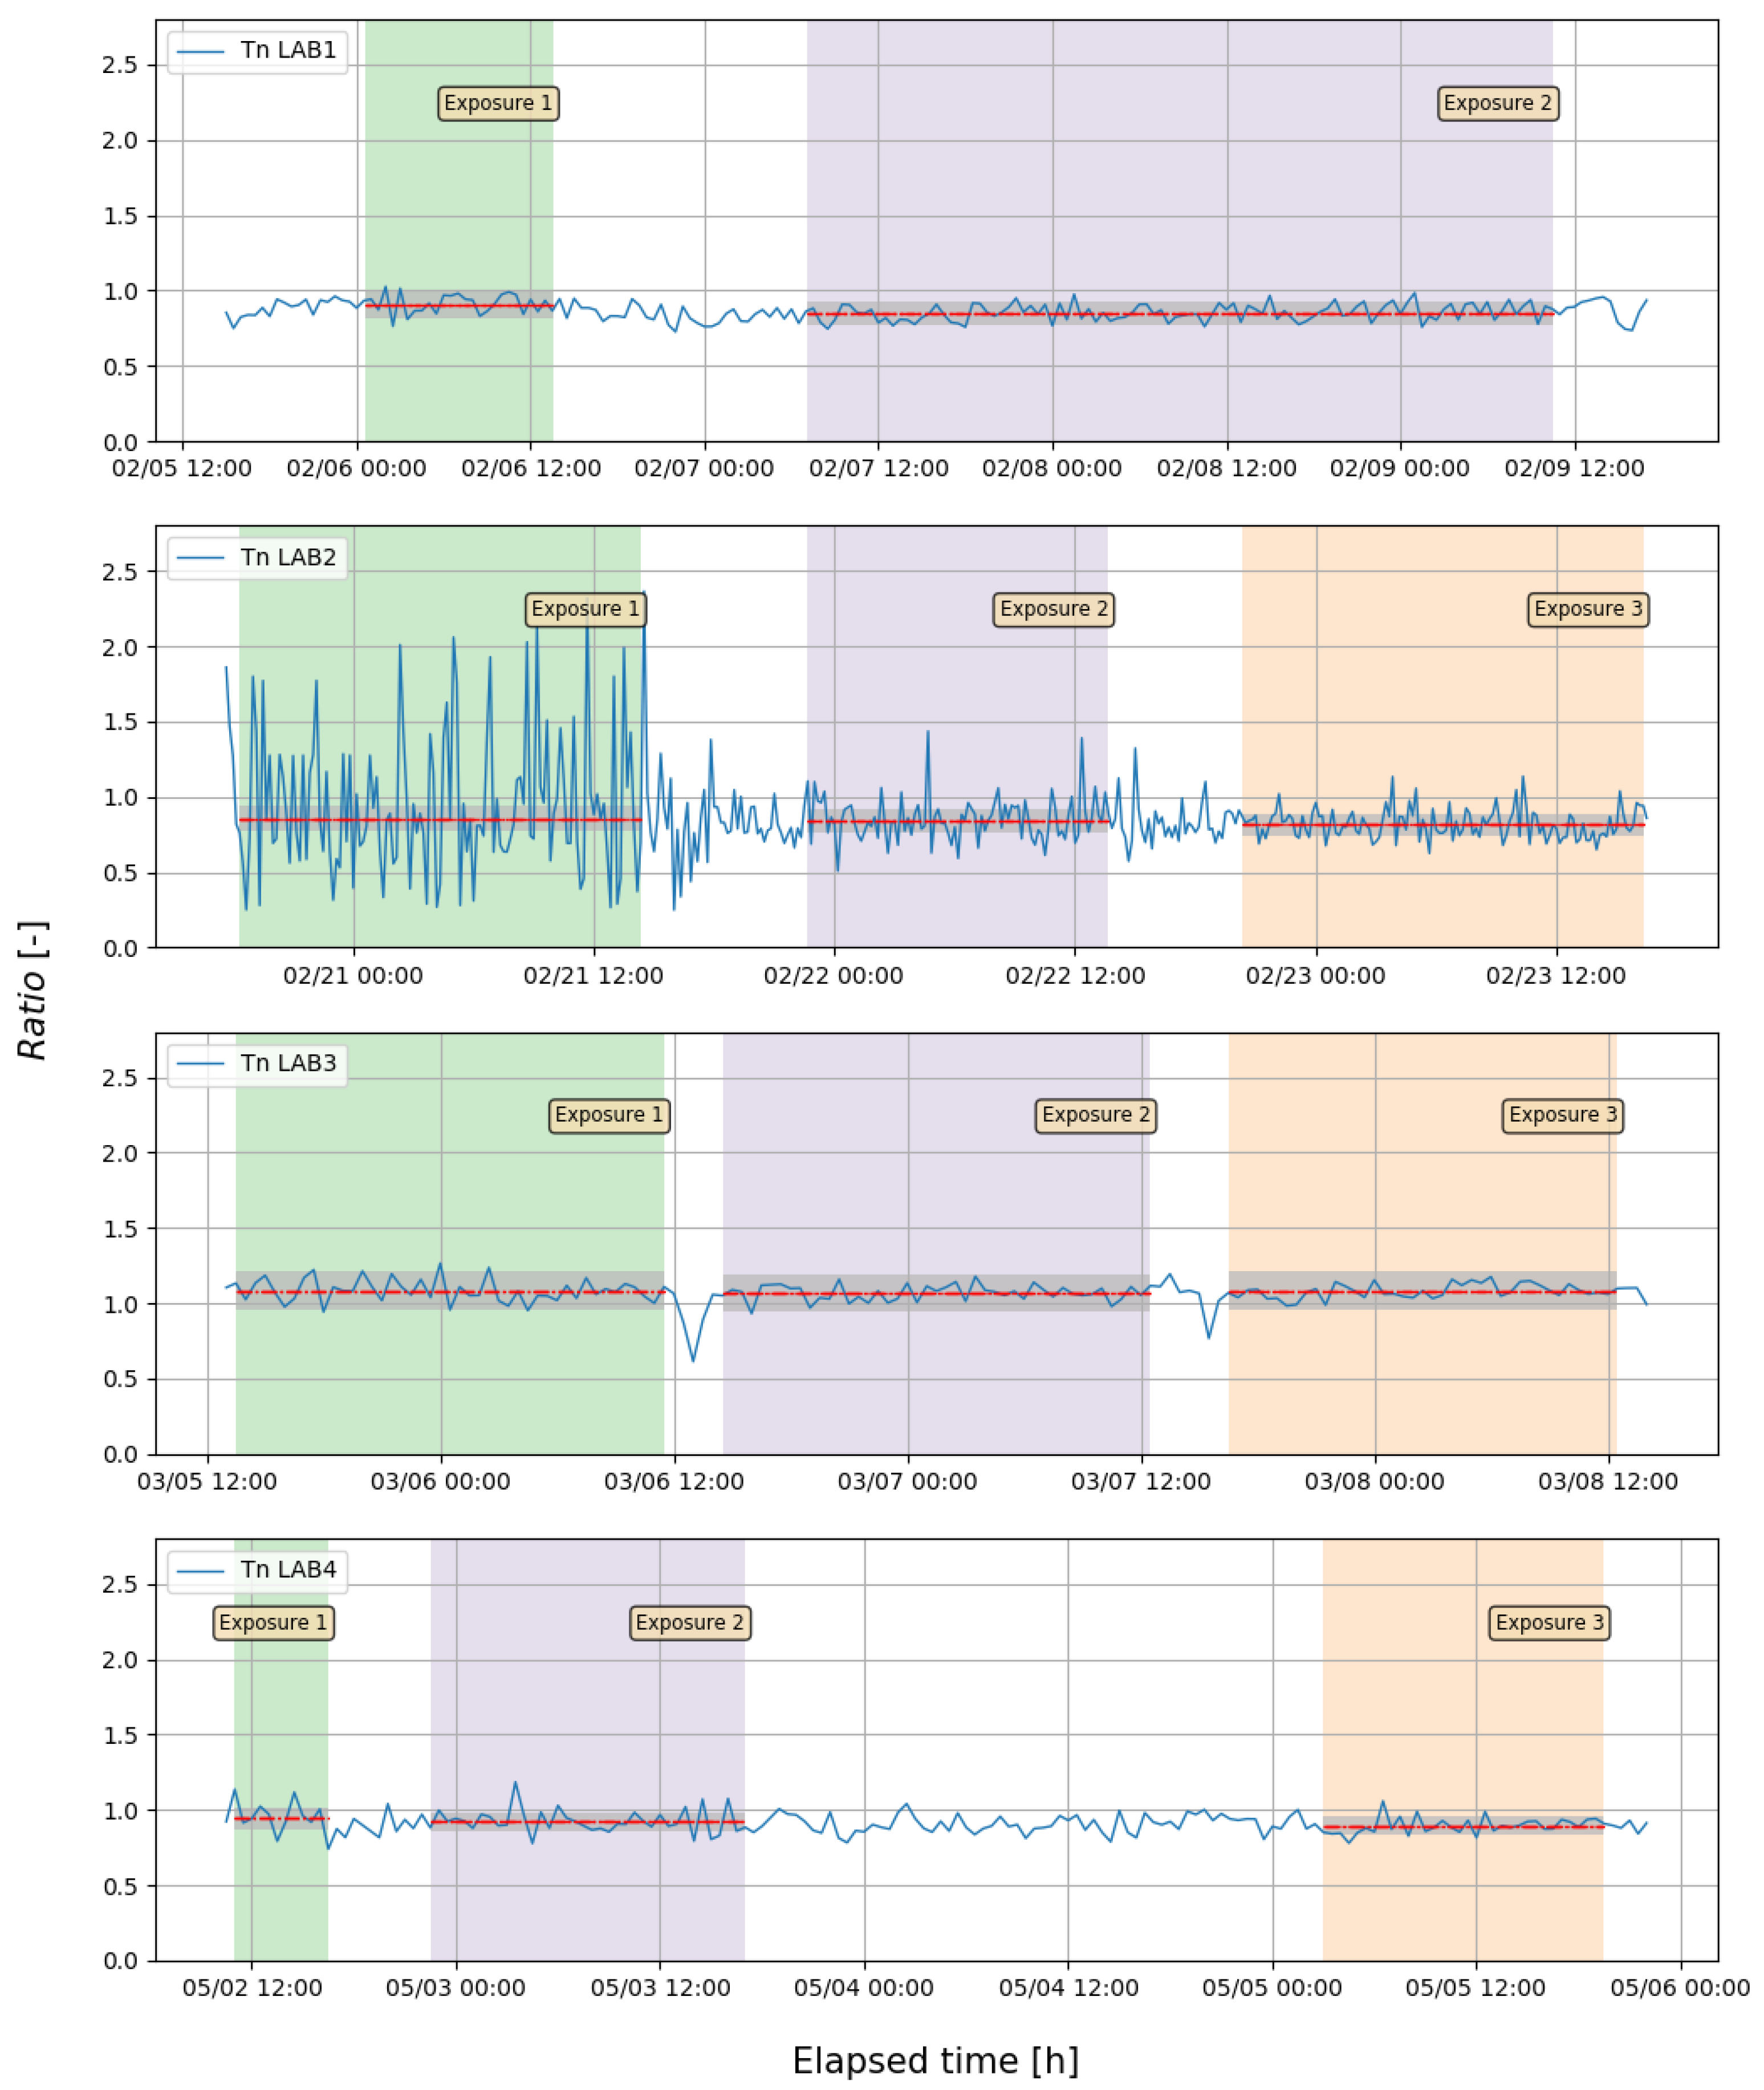
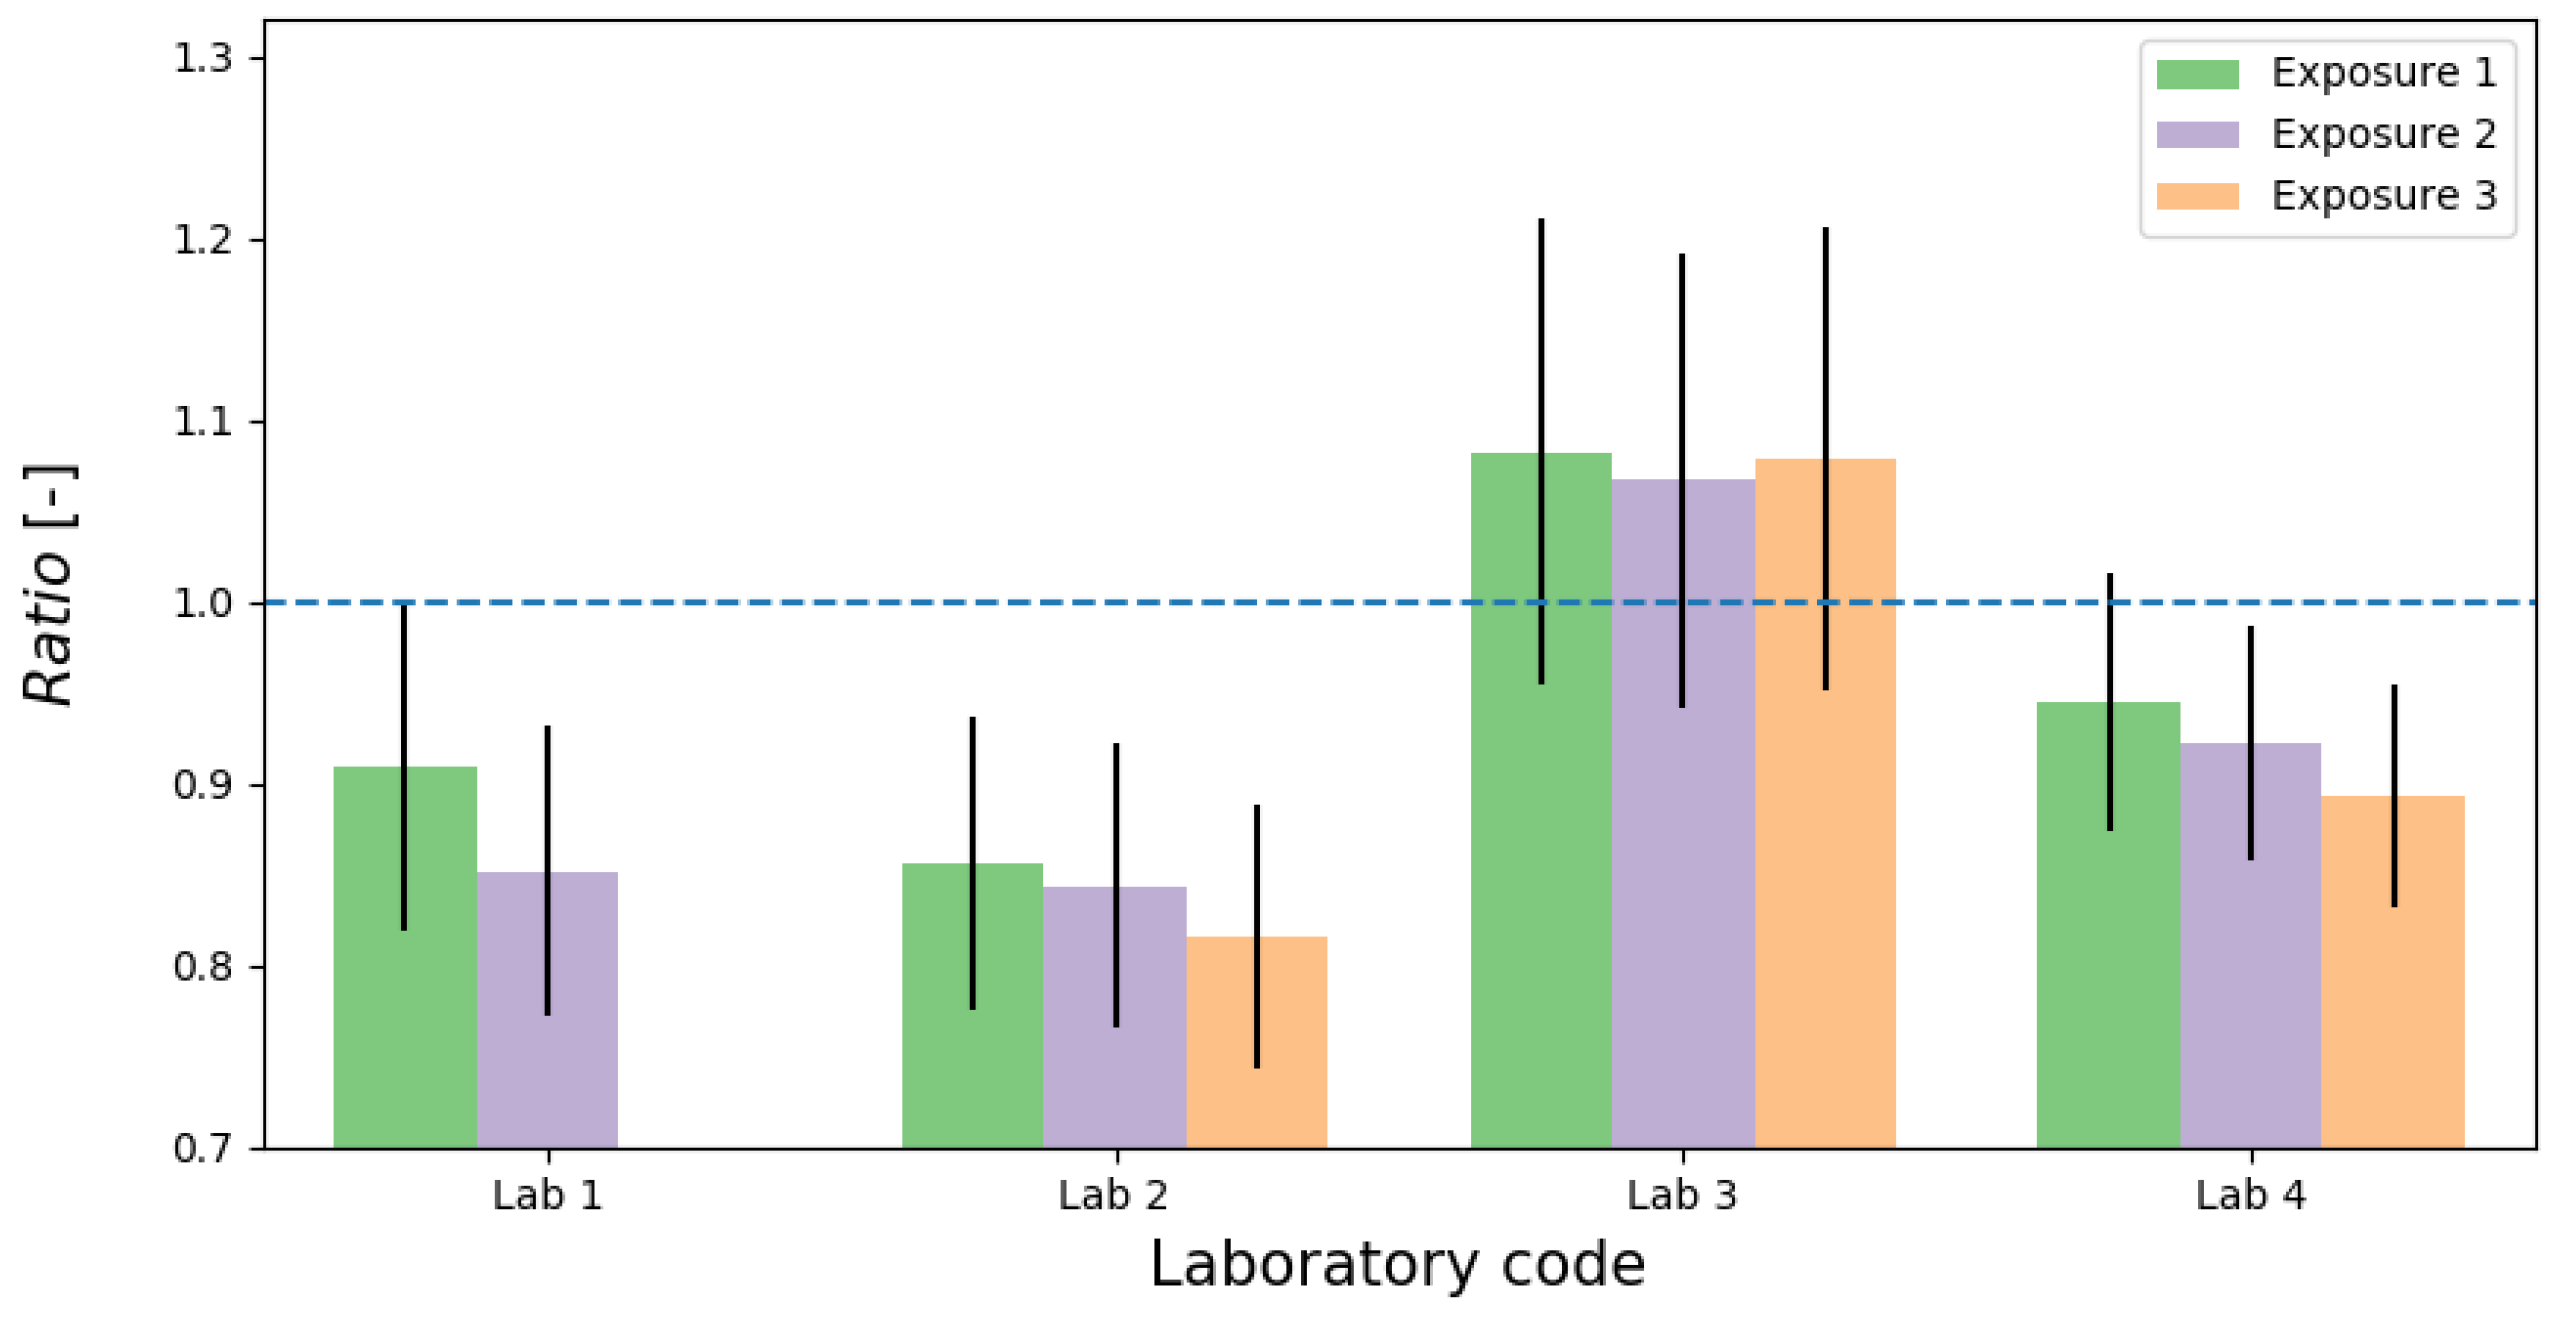
3.2. Results for Tn
3.3. Uncertainty Budget
4. Conclusions
Author Contributions
Funding
Acknowledgments
Conflicts of Interest
References
- European Council Directive 2013/59/Euratom on Basic Safety Standards for Protection against the Dangers Arising from Exposure to Ionising Radiation and Repealing Directives 89/618/Euratom, 90/641/Euratom, 96/29/Euratom, 97/43/Euratom and 2003/122/Euratom. Available online: https://eur-lex.europa.eu/eli/dir/2013/59/oj (accessed on 17 January 2014).
- DURRIDGE Company Inc. The Natural Rock Sample: User Manual. Available online: https://durridge.com/products/natural-rock-sample/ (accessed on 17 January 2018).
- Röttger, A.; Honig, A.; Schmidt, V.; Buchröder, H.; Rox, A.; Butterweck, G.; Schuler, C.; Maringer, F.J.; Jachs, P.; Edelmaier, R.; et al. Radon activity concentration-a Euromet and BIPM supplementary comparison. Appl. Radiat. Isot. 2006, 64, 1102–1107. [Google Scholar] [CrossRef] [PubMed]
- Tokonami, S.; Yang, M.; Yonehara, H.; Yamada, Y. Simple, discriminative measurement technique for radon and thoron concentrations with a single scintillation cell. Rev. Sci. Instrum. 2002, 73, 69. [Google Scholar] [CrossRef]
- Iimoto, T.; Tokonami, S.; Kurosawa, R. Estimation method for alpha particle counting efficiency for scintillation flasks. Radiat. Prot. Dosim. 1997, 72, 55–60. [Google Scholar] [CrossRef]
- Tang, F.; Zhuo, W.; Zhao, C.; Chen, B.; Xu, Y.; He, L. A theoretical study on accurate measurements of thoron with airflow-through scintillation cell method. Radiat. Prot. Dosim. 2010, 141, 448–451. [Google Scholar] [CrossRef] [PubMed]
- Beck, T.R.; Buchröder, H.; Döring, J.; Foerster, E.; Schmidt, V. The Radon Calibration Laboratory at the Federal Office for Radiation Protection (BfS). In Proceedings of the International Intercomparison Exercise on Natural Radiation Measurements under Field Conditions, Saelices el Chico, Spain, 23–27 May 2011. [Google Scholar]
- Beck, T.R.; Buchröder, H.; Schmidt, V. Performance tests for instruments measuring radon activity concentration. Appl. Radiat. Isot. 2009, 67, 876–880. [Google Scholar] [CrossRef] [PubMed]
- Tykva, R.; Sabol, J. Low-Level Environmental Radioactivity: Sources and Evaluation; CRC Press: Lancaster, PA, USA, 1995. [Google Scholar]
- Röttger, A.; Honig, A.; Linzmaier, D. Calibration of commercial radon and thoron monitors at stable activtiy concentrations. Appl. Radiat. Isot. 2014, 87, 44–47. [Google Scholar] [CrossRef] [PubMed]
- ISO. 13528:2015. Statistical Methods for Use in Proficiency Testing by Interlaboratory Comparison; Technical Report; ISO: Geneva, Switzerland, 2015. [Google Scholar]
- Janik, M.; Yonehara, H. The most recent international intercomparisons of radon and thoron monitors with the NIRS radon and thoron chambers. Radiat. Prot. Dosim. 2015, 164, 595–600. [Google Scholar] [CrossRef] [PubMed]
- Kojima, I.; Kakita, K. Comparative Study of Robustness of Statistical Methods for Laboratory Proficiency Testing. Anal. Sci. 2014, 30, 1165–1168. [Google Scholar] [CrossRef] [PubMed][Green Version]
- Daszykowski, M.; Kaczmarek, K.; Vander Heyden, Y.; Walczak, B. Robust statistics in data analysis—A review, Basic concepts. Chemom. Intell. Lab. Syst. 2007, 85, 203–219. [Google Scholar] [CrossRef]
- Lipinski, S.; Grabe, N.; Jacobs, G.; Billmann-Born, S.; Till, A.; Hasler, R.; Aden, K.; Paulsen, M.; Arlt, A.; Kraemer, L.; et al. RNAi screening identifies mediators of NOD2 signaling: Implications for spatial specificity of MDP recognition—Supporting Inofmation. Proc. Natl. Acad. Sci. USA 2012, 109, 21426–21431. [Google Scholar] [CrossRef] [PubMed]


| Institution | LAB1 | LAB2 | LAB3 | LAB4 | LAB5 |
|---|---|---|---|---|---|
| Chamber volume [Bq m] | 22.7 | 0.54 | 0.1 | 3.8 | 25 |
| Achievable Rn range[Bq m] | 500–15,000 | 340–3600 | 1000–10,000 | 370–20,000 | 500–8000 |
| Time to reach stable | |||||
| Rn condition [h] | 1 | 36 | 3.5 | 1.5 | 12 |
| Environmental parameters | |||||
| Pressure [hPa] | Ambient | Ambient | Ambient | Ambient | Ambient |
| Temperature [C] | 10–50 | Ambient | 25–30 | 6–40 | 5–30 |
| Humidity [%] | 30–90 | 10–55 | 50–60 | 10–95 | 30–90 |
| Rn traceability | |||||
| (source/institute/etc) | Factory calibration | BfS | Calibrated Rn source | National standard | BfS |
| Primary measuring | |||||
| instrument for Rn measurement | RnRMI1 | RnRMI2 | RnRMI3 | RnRMI4 | RnRMI5 |
| Operation mode | Semi-dynamic | Dynamic | Static | Dynamic | Dynamic |
| Institution | LAB1 | LAB2 | LAB3 | LAB4 |
|---|---|---|---|---|
| Chamber volume [m] | 0.15 | 0.05 | 0.22 | 0.15 |
| Achievable Tn range[Bq m] | 3500–30,000 | 1000–50,000 | 3500–12,000 | 3000–30,000 |
| Time to reach stable | ||||
| Tn condition [h] | 20 | 0.5 | 0.2 | 15 |
| Environmental parameters | ||||
| Pressure [hPa] | Ambient | Ambient | Ambient | Ambient |
| Temperature [C] | Ambient | 25–30 | 0–50 | Ambient |
| Humidity [%] | 10–60 | 50–60 | 10–95 | 20–60 |
| Tn traceability | ||||
| (source/institute/etc) | Lucas scintillation cell and Monte Carlo simulation [4,5] | Calibration Tn source | PTB and Monte Carlo simulation [6] | PTB |
| Primary measuring | ||||
| instrument for Tn measurement | TnRMI1 | TnRMI2 | TnRMI3 | TnRMI4 |
| Operation mode | Dynamic | Dynamic | Dynamic | Dynamic |
| Exposure | [Bq m] | [Bq m] | Time [h] | Temperature [C] | Relative Humidity [%] | Pressure [hPa] | Ratio [-] | RB [%] | [-] | z-Score [-] | |
|---|---|---|---|---|---|---|---|---|---|---|---|
| LAB1 | Exp1 | 734 ± 38 | 700 ± 38 | 13 | 26.0 ± 0.3 | 52.2 ± 1.7 | 996 ± 1 | 0.95 ± 0.05 | 5 | 0.6 | 0.2 |
| Exp2 | 2730 ± 136 | 2623 ± 136 | 20 | 25.9 ± 0.2 | 52.4 ± 1.6 | 996 ± 1 | 0.96 ± 0.04 | 4 | 0.6 | 0.3 | |
| Exp3 | 4837 ± 241 | 4634 ± 241 | 16 | 26.0 ± 0.2 | 52.0 ± 1.7 | 996 ± 1 | 0.96 ± 0.04 | 4 | 0.6 | 0.3 | |
| LAB2 | Exp1 | 775 ± 40 | 761 ± 40 | 32 | 22.5 ± 0.4 | 6.9 ± 0.3 | 998 ± 3 | 0.98 ± 0.04 | 2 | 0.2 | 0.5 |
| Exp2 | 2724 ± 138 | 2648 ± 139 | 24 | 22.1 ± 0.6 | 50.1 ± 1.2 | 1013 ± 2 | 0.97 ± 0.04 | 3 | 0.4 | 0.3 | |
| LAB3 | Exp1 | 526 ± 48 | 525 ± 28 | 21 | 27.3 ± 0.2 | 48.8 ± 3.7 | 1013 ± 1 | 1.00 ± 0.06 | 0 | 0 | 0 |
| Exp2 | 2810 ± 251 | 2799 ± 146 | 18 | 27.2 ± 0.2 | 53.3 ± 1.8 | 1014 ± 1 | 1.00 ± 0.06 | 0 | 0 | 0 | |
| Exp3 | 4474 ± 398 | 4534 ± 235 | 23 | 27.1 ± 0.5 | 58.6 ± 1.8 | 1010 ± 1 | 1.01 ± 0.06 | −1 | 0.1 | 0 | |
| LAB4 | Exp1 | 520 ± 15 | 513 ± 27 | 21 | 20.8 ± 0.5 | 18.9 ± 0.5 | 1022 ± 1 | 0.99 ± 0.04 | 1 | 0.2 | 0.1 |
| Exp2 | 2520 ± 65 | 2512 ± 132 | 13 | 19.6 ± 0.3 | 20.1 ± 0.3 | 1023 ± 1 | 1.00 ± 0.04 | 0 | 0.1 | 0 | |
| Exp3 | 5001 ± 114 | 4948 ± 255 | 25 | 19.0 ± 1.2 | 20.6 ± 1.2 | 1024 ± 1 | 0.99 ± 0.03 | 1 | 0.2 | 0.2 | |
| LAB5 | Exp1 | 611 ± 44 | 620 ± 33 | 40 | 24.0 ± 0.5 | 35.9 ± 1.2 | 1010 ± 1 | 1.02 ± 0.05 | −2 | 0.2 | −0.1 |
| Exp2 | 2461 ± 177 | 2518 ± 131 | 39 | 23.4 ± 0.2 | 37.7 ± 0.6 | 1019 ± 2 | 1.02 ± 0.05 | −2 | 0.3 | −0.6 | |
| Exp3 | 4803 ± 345 | 4899 ± 253 | 53 | 23.4 ± 0.1 | 37.9 ± 0.4 | 1014 ± 2 | 1.02 ± 0.05 | −2 | 0.2 | −0.7 |
| Exposure | [Bq m] | [Bq m] | Time [h] | Temperature [C] | Relative Humidity [%] | Pressure [hPa] | Ratio [-] | RB [%] | |
|---|---|---|---|---|---|---|---|---|---|
| LAB1 | Exp1 | 4489 ± 440 | 4083 ± 201 | 13 | 19.1 ± 0.3 | 8.9 ± 0.5 | 998 ± 1 | 0.91 ± 0.09 | 10 |
| Exp2 | 7247 ± 710 | 6175 ± 303 | 51.5 | 19.1 ± 0.4 | 14.3 ± 2.2 | 1008 ± 4 | 0.85 ± 0.08 | 17 | |
| LAB2 | Exp1 | 332 ± 33 | 284 ± 14 | 20 | 28.3 ± 0.1 | NA | 1008 ± 1 | 0.86 ± 0.08 | 17 |
| Exp2 | 3599 ± 353 | 3037 ± 149 | 15 | 28.4 ± 0.1 | NA | 1008 ± 1 | 0.84 ± 0.08 | 19 | |
| Exp3 | 4999 ± 490 | 4079 ± 200 | 20 | 27.6 ± 0.1 | NA | 1010 ± 2 | 0.82 ± 0.07 | 23 | |
| LAB3 | Exp1 | 3549 ± 348 | 3843 ± 189 | 22 | 20.0 ± 0.2 | 40.0 ± 0.4 | 1024 ± 3 | 1.08 ± 0.13 | −8 |
| Exp2 | 7005 ± 687 | 7477 ± 367 | 22 | 20.0 ± 0.2 | 40.0 ± 0.4 | 1021 ± 2 | 1.07 ± 0.12 | −6 | |
| Exp3 | 10190 ± 999 | 10995 ± 539 | 20 | 20.0 ± 0.2 | 40.0 ± 0.4 | 1021 ± 2 | 1.08 ± 0.13 | −7 | |
| LAB4 | Exp1 | 3151 ± 106 | 2977 ± 150 | 5.5 | 28.4 ± 0.1 | 38.7 ± 0.5 | 1008 ± 1 | 0.95 ± 0.07 | 6 |
| Exp2 | 5709 ± 164 | 5264 ± 258 | 18.5 | 26.2 ± 0.2 | 39.0 ± 0.6 | 1015 ± 2 | 0.92 ± 0.06 | 8 | |
| Exp3 | 12951 ± 371 | 11571 ± 568 | 16.5 | 27.5 ± 0.3 | 39.8 ± 0.8 | 1008 ± 1 | 0.89 ± 0.06 | 12 |
| Quantity | Value | Uncertainty (k = 2) | Contribution |
|---|---|---|---|
| 513.00 | 27.00 | 11% | |
| 3.00 | 9.00 | 0% | |
| 0.98 | 0.05 | 59% | |
| 520.00 | 15.00 | 18% | |
| 2.00 | 2.00 | 0% | |
| 1.08 | 0.02 | 12% | |
| 0.99 | 0.04 | 4% (k = 2) |
| Quantity | Value | Uncertainty (k = 2) | Contribution |
|---|---|---|---|
| 11,571 | 568 | 0% | |
| 3 | 5 | 0% | |
| 1.0 | 0.05 | 42% | |
| 12,951 | 371 | 0% | |
| 9 | 7 | 0% | |
| 2.03 | 0.12 | 58% | |
| 0.89 | 0.06 | 6% (k = 2) |
© 2019 by the authors. Licensee MDPI, Basel, Switzerland. This article is an open access article distributed under the terms and conditions of the Creative Commons Attribution (CC BY) license (http://creativecommons.org/licenses/by/4.0/).
Share and Cite
Janik, M.; Tokonami, S.; Iwaoka, K.; Karunakara, N.; Trilochana, S.; Mohan, M.P.; Kumara, S.; Yashodhara, I.; Zhuo, W.; Zhao, C.; et al. Comparison of Radon and Thoron Concentration Measuring Systems Among Asian Countries. Int. J. Environ. Res. Public Health 2019, 16, 5019. https://doi.org/10.3390/ijerph16245019
Janik M, Tokonami S, Iwaoka K, Karunakara N, Trilochana S, Mohan MP, Kumara S, Yashodhara I, Zhuo W, Zhao C, et al. Comparison of Radon and Thoron Concentration Measuring Systems Among Asian Countries. International Journal of Environmental Research and Public Health. 2019; 16(24):5019. https://doi.org/10.3390/ijerph16245019
Chicago/Turabian StyleJanik, Miroslaw, Shinji Tokonami, Kazuki Iwaoka, Naregundi Karunakara, Shetty Trilochana, Mandya Purushotham Mohan, Sudeep Kumara, Indaje Yashodhara, Weihai Zhuo, Chao Zhao, and et al. 2019. "Comparison of Radon and Thoron Concentration Measuring Systems Among Asian Countries" International Journal of Environmental Research and Public Health 16, no. 24: 5019. https://doi.org/10.3390/ijerph16245019
APA StyleJanik, M., Tokonami, S., Iwaoka, K., Karunakara, N., Trilochana, S., Mohan, M. P., Kumara, S., Yashodhara, I., Zhuo, W., Zhao, C., Tang, F., He, L., Chanyotha, S., Kranrod, C., Al-Azmi, D., & Kurihara, O. (2019). Comparison of Radon and Thoron Concentration Measuring Systems Among Asian Countries. International Journal of Environmental Research and Public Health, 16(24), 5019. https://doi.org/10.3390/ijerph16245019