Development of a Teen-Informed Coding Tool to Measure the Power of Food Advertisements

 and
and
Abstract
1. Introduction
2. Materials and Methods
2.1. Food Information Environment Audit
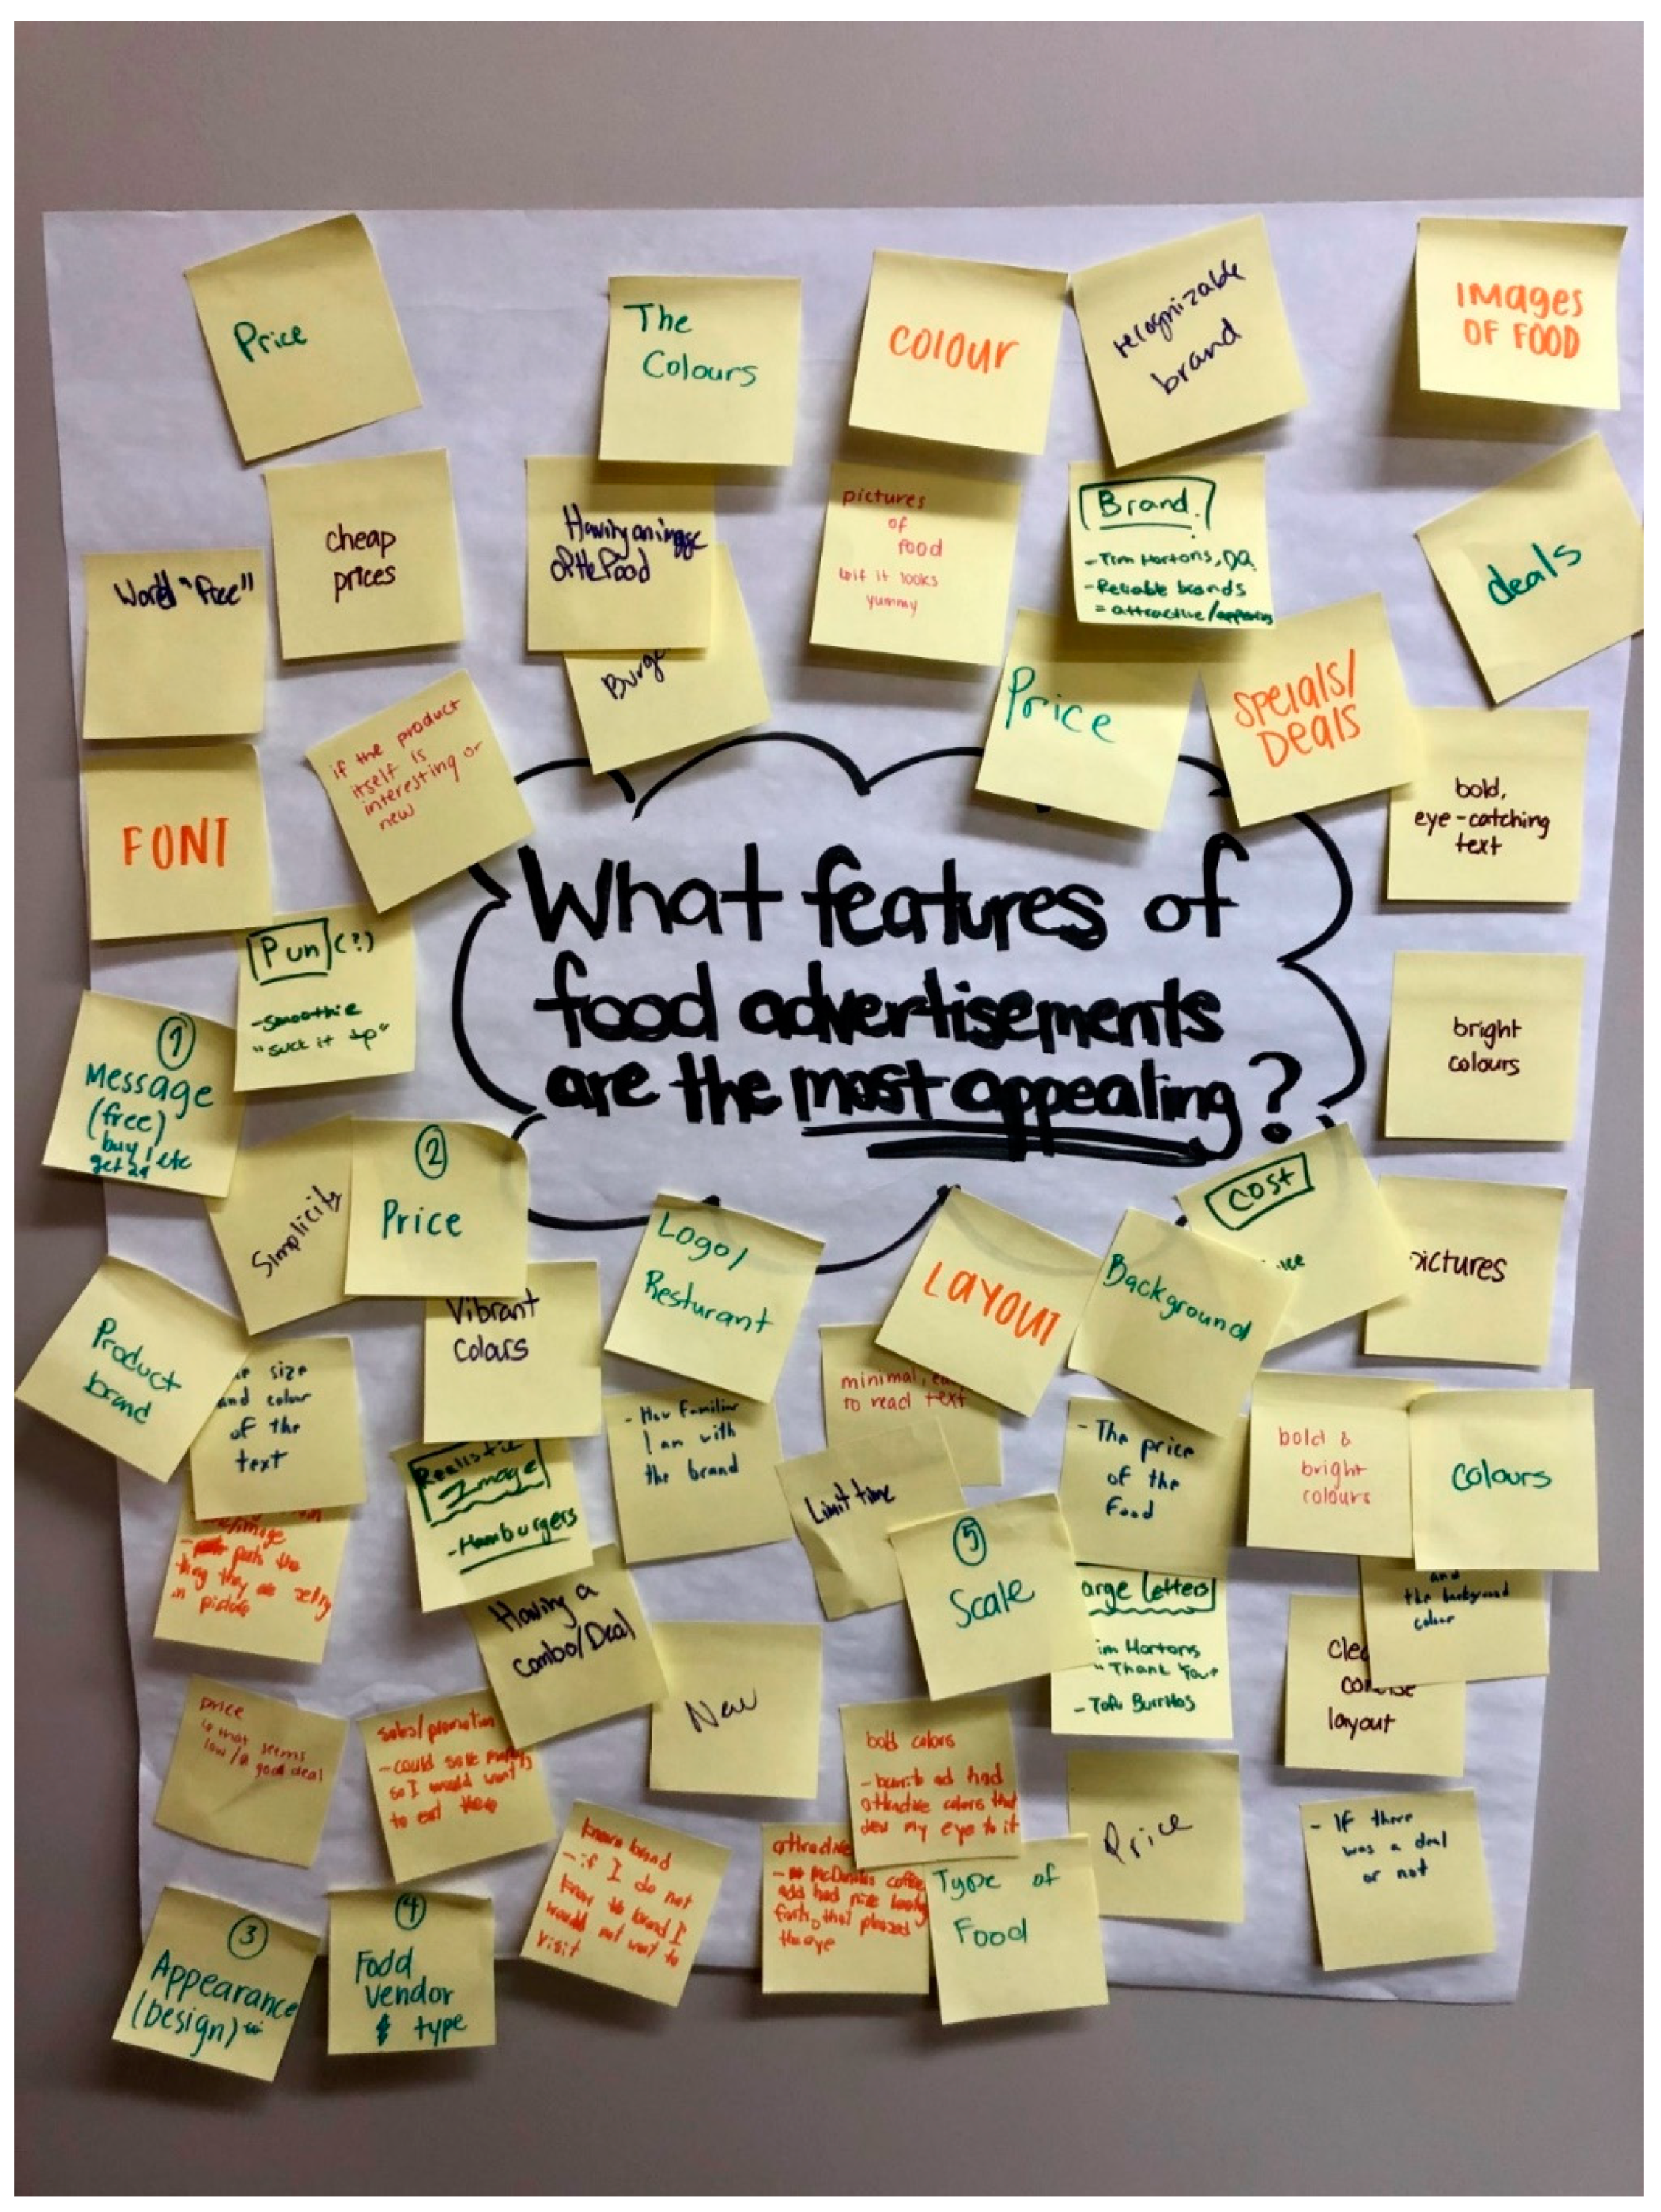
2.2. Consultations with Youth
2.2.1. Participatory Method
2.2.2. Identifying Teen-Directed Coding Criteria
2.3. Creating Teen-Developed Weights for Coding Tool Development
- (1)
- Assign each ad feature an individual rating out of 10 to describe its general level of importance. A score of 10 would indicate that the ad feature is extremely important.
- (2)
- Rank the relative importance of each ad feature by arranging them in order from 1–10. 1 represents the MOST important ad feature and 10 represents the LEAST important ad feature.
- (3)
- Distribute 100 points between the ad features, giving the most important feature(s) the greater number of points. When thinking about these ad features, please rate them according to their relative importance.
2.4. Analysis
3. Results
3.1. Teen-Directed Marketing Criteria
- Price
- Image of Food/Beverage
- Taste Description
- Sale/Deal/Special Offer
- Slogan/Description
- Logo/Company Name
- Geographic/Online Location or Directions
- Gamification (e.g., contest, game, giveaway)
- Loyalty Points/Rewards
- Character, Celebrity, or TV/Sports tie-in
3.2. Teen-Developed Weights
3.3. Teen-Informed Coding Tool
4. Discussion
5. Conclusions
Author Contributions
Funding
Acknowledgments
Conflicts of Interest
References
- Ball, G.D.C.; McCargar, L.J. Childhood obesity in Canada: A review of prevalence estimates and risk factors for cardiovascular diseases and type 2 diabetes. Can. J. Appl. Physiol. 2003, 28. [Google Scholar] [CrossRef]
- Lamichhane, A.P.; Mayer-Davis, E.J.; Puett, R.; Bottai, M.; Porter, D.E.; Liese, A.D. Associations of Built Food Environment with Dietary Intake among Youth with Diabetes. J. Nutr. Educ. Behav. 2012, 44. [Google Scholar] [CrossRef] [PubMed]
- Morenga, L.A.T.; Howatson, A.J.; Jones, R.M.; Mann, J. Dietary sugars and cardiometabolic risk: Systematic review and meta-analyses of randomized controlled trials of the effects on blood pressure and lipids. Am. J. Clin. Nutr. 2014, 100, 65–79. [Google Scholar] [CrossRef] [PubMed]
- Public Health Agency of Canada. How Healthy are Canadians? A Trend Analysis of the Health of Canadians From a Healthy Living and Chronic Disease Perspective; Public Health Agency of Canada: Ottawa, Canada, 2017; Available online: https://www.canada.ca/content/dam/phac-aspc/documents/services/publications/healthy-living/how-healthy-canadians/pub1-eng.pdf (accessed on 1 November 2019).
- Bancej, C.; Jayabalasingham, B.; Wall, R.W.; Rao, D.P.; Do, M.T.; de Groh, M.; Jayaraman, C. Evidence brief—Trends and projections of obesity among Canadians. Chronic Dis. Inj. Can. 2015, 35, 109–112. [Google Scholar] [CrossRef]
- Rao, D.P.; Kropac, E.; Do, M.T.; Roberts, K.C.; Jayaraman, G.C. Childhood overweight and obesity trends in Canada. Health Promot. Chronic Dis. Prev. Can. 2016, 36, 194–198. [Google Scholar] [CrossRef]
- NCD Risk Factor Collaboration. Worldwide trends in body-mass index, underweight, overweight, and obesity from 1975 to 2016: A pooled analysis of 2416 population-based measurement studies in 128.9 million children, adolescents, and adults. Lancet 2017, 390, 2627–2642. [Google Scholar] [CrossRef]
- Barrett, M.; Crozier, S.; Lewis, D.; Godfrey, K.; Robinson, S.; Cooper, C.; Vogel, C. Greater access to healthy food outlets in the home and school environment is associated with better dietary quality in young children. Pub. Health Nutr. 2017, 20, 3316–3325. [Google Scholar] [CrossRef]
- Dubreck, C.M.; Sadler, R.C.; Arku, G.; Seabrook, J.; Gilliland, J.A. A comparative analysis of the restaurant consumer food environment in Rochester (NY, USA) and London (ON, Canada): Assessing children’s menus by neighbourhood socio-economic characteristics. Pub. Health Nutr. 2019, 22, 1654–1666. [Google Scholar] [CrossRef]
- Engler-Stringer, R.; Le, H.; Gerrard, A.; Muhajarine, N. The community and consumer food environment and children’s diet: A systematic review. BMC Public Health 2014, 14, 522. [Google Scholar] [CrossRef]
- Vandevijvere, S.; Dominick, C.; Devi, A.; Swinburn, B. The healthy food environment policy index: Findings of an expert panel in New Zealand. Bull. World Health Org. 2015, 93, 285–360. [Google Scholar] [CrossRef]
- Minaker, L.M.; Raine, K.D. The Food Environment in Canada: The Problem, Solutions, and The Battle Ahead. Can. J. Diabetes 2013, 37, S245. [Google Scholar] [CrossRef]
- Sadler, R.C.; Clark, A.; Wilk, P.; O’Connor, C.; Gilliland, J.A. Using GPS and activity tracking to reveal the influence of adolescents’ food environment exposure on junk food purchasing. Can. J. Public Health 2016, 107, ES14–ES20. [Google Scholar] [CrossRef] [PubMed]
- Craigie, A.M.; Lake, A.A.; Kelly, S.A.; Adamson, A.J.; Mathers, J.C. Tracking of obesity-related behaviours from childhood to adulthood: A systematic review. Maturitas 2011, 70, 266–284. [Google Scholar] [CrossRef] [PubMed]
- McKeown, A.; Nelson, R. Independent decision making of adolescents regarding food choice. Int. J. Consum. Stud. 2018, 42, 469–477. [Google Scholar] [CrossRef]
- Singh, A.S.; Mulder, C.; Twisk, J.W.R.; van Mechelen, W.; Chinapaw, M.J.M. Tracking of childhood overweight into adulthood: A systematic review of the literature. Obes. Rev. 2008, 9, 474–488. [Google Scholar] [CrossRef]
- Glanz, K.; Sallis, J.F.; Saelens, B.E.; Frank, L.D. Healthy Nutrition Environments: Concepts and Measures. Am. J. Health Promot. 2005, 19, 330–333. [Google Scholar] [CrossRef]
- Kirk, S.F.; Penny, T.L.; McHugh, T.L. Characterizing the obesogenic environment: The state of the evidence with directions for future research. Obes. Rev. 2010, 11, 109–117. [Google Scholar] [CrossRef]
- Velazquez, C.E.; Daepp, M.I.G.; Black, J.L. Assessing exposure to food and beverage advertisements surrounding schools in Vancouver, BC. Health Place 2019. [Google Scholar] [CrossRef]
- Glanz, K. Measuring Food Environments: A Historical Perspective. Am. J. Prev. Med. 2009, 36, 93–98. [Google Scholar] [CrossRef]
- Bugge, A.B. Food advertising towards children and young people in Norway. Appetite 2016, 98, 12–18. [Google Scholar] [CrossRef]
- Harris, J.L.; Brownell, K.D.; Bargh, J.A. The Food Marketing Defense Model: Integrating Psychological Research to Protect Youth and Inform Public Policy. Soc. Issues Policy Rev. 2009, 3, 211–271. [Google Scholar] [CrossRef] [PubMed]
- Institute of Medicine (IOM). National academy of sciences, committee on food marketing and the diets of children and youth. In Food Marketing to Children and Youth: Threat or Opportunity? McGinnis, J.M., Gootman, J., Kraak, V.I., Eds.; Institute of Medicine of the National Academies: Washington, DC, USA, 2006. [Google Scholar]
- Sadeghirad, B.; Duhaney, T.; Motaghipisheh, S.; Campbell, N.R.C.; Johnston, B.C. Influence of unhealthy food and beverage marketing on children’s dietary intake and preference: A systematic review and meta-analysis of randomized trials. Obes. Rev. 2016, 17, 945–959. [Google Scholar] [CrossRef] [PubMed]
- Thai, C.L.; Serrano, K.J.; Yaroch, A.L.; Nebeling, L.; Oh, A. Perceptions of Food Advertising and Association with Consumption of Energy-Dense Nutrient-Poor Foods Among Adolescents in the United States: Results from a National Survey. J. Health Commun 2017, 22, 638–646. [Google Scholar] [CrossRef] [PubMed]
- Velazquez, C.E.; Black, J.; Billette, J.; Ahmadi, N.; Chapman, G.E. A Comparison of Dietary Practices at or En Route to School between Elementary and Secondary School Students in Vancouver, Canada. J. Acad. Nutr. Diet. 2015, 115, 1308–1317. [Google Scholar] [CrossRef]
- Story, M.; French, S. Food Advertising and Marketing Directed at Children and Adolescents in the US. Int. J. Behav. Nutr. Phys. Act. 2004, 1. [Google Scholar] [CrossRef]
- Kraak, V.; Pelletier, D.L. The influence of Commercialism on the Food Purchasing Behavior of Children and Teenage Youth. Fam. Econ. Nutr. Rev. 1998, 11, 15–24. [Google Scholar]
- Williams, J.; Scarborough, P.; Matthews, A.; Cowburn, G.; Foster, C.; Roberts, N.; Rayner, M. A systematic review of the influence of the retail food environment around schools on obesity-related outcomes. Obes. Rev. 2014, 15, 359–374. [Google Scholar] [CrossRef]
- Elliot, C. Knowledge needs and the ‘savvy’ child: Teenager perspectives on banning food marketing to children. Crit. Public Health 2016, 27. [Google Scholar] [CrossRef]
- Elliot, C. Food as people: Teenagers’ perspectives on food personalities and implications for healthy eating. Soc. Sci. Med. 2014, 121, 85–90. [Google Scholar] [CrossRef]
- Laska, M.N.; Hearst, M.O.; Forsyth, A.; Pasch, K.E.; Lytle, L. Neighbourhood food environments: Are they associated with adolescent dietary intake, food purchases and weight status? Public Health Nutr. 2010, 13, 1757–1763. [Google Scholar] [CrossRef]
- Cawley, J. Markets and Childhood Obesity Policy. Future Child. 2006, 16, 69–88. [Google Scholar] [CrossRef] [PubMed]
- Velazquez, C.E.; Black, J.I.; Potvin Kent, M. Food and Beverage Marketing in Schools: A Review of the Evidence. Int. J. Environ. Res. Public Health 2017, 14, 1054. [Google Scholar] [CrossRef] [PubMed]
- Hooper, M. Restricting the Marketing of Unhealthy Foods to Children in Canada: Update from Health Canada. 2018. Available online: https://interprofessional.ubc.ca/files/2018/11/Plenary_Hooper.pdf (accessed on 1 November 2019).
- Potvin Kent, M.; Martin, C.L.; Kent, E.A. Changes in the volume, power and nutritional quality of foods marketed to children on television in Canada. Obesity 2014, 22, 2053–2060. [Google Scholar] [CrossRef] [PubMed]
- Prowse, R. Food marketing to children in Canada: A settings-based scoping review on exposure, power and impact. Health Promot. Chronic Dis. Prev. Can. 2017, 37, 274–292. [Google Scholar] [CrossRef] [PubMed]
- World Health Organization (WHO). Reducing the Impact of Marketing of Foods and Non-Alcoholic Beverages on Children; World Health Organization: Geneva, Switzerland, 2019. [Google Scholar]
- World Health Organization (WHO). A Framework for Implementing the Set of Recommendations on the Marketing of Foods and Non-Alcoholic Beverages to Children; World Health Organization: Geneva, Switzerland, 2012. [Google Scholar]
- Caspi, C.E.; Sorensen, G.; Subramanian, S.V.; Kawachi, I. The local food environment and diet: A systematic review. Health Place 2012, 18, 1172–1187. [Google Scholar] [CrossRef] [PubMed]
- Kelly, B.; Flood, V.M.; Yeatman, H. Measuring Local Food Environments: An overview of available methods and measures. Health Place 2011, 17, 1284–1293. [Google Scholar] [CrossRef] [PubMed]
- Lytle, L.A.; Sokol, R.L. Measures of the food environment: A systematic review of the field, 2007–2015. Health Place 2017, 44, 18–34. [Google Scholar] [CrossRef] [PubMed]
- Minaker, L.; Shuh, A.; Olstad, D.; Engler-Stringer, R.; Black, J.; Mah, C.L. Retail food environments research in Canada: A scoping review. Can. J. Public Health 2016, 107, ES4–ES13. [Google Scholar] [CrossRef]
- Egli, V.; Zinn, C.; Mackay, L.; Donnellan, N.; Villanueva, K.; Mavoa, S.; Smith, M. Viewing obesogenic advertising in children’s neighbourhoods using Google Street View. Geogr. Res. 2019, 57, 84–97. [Google Scholar] [CrossRef]
- Herrera, A.L.; Pasch, K.E. Targeting Hispanic adolescents with outdoor food & beverage advertising around schools. Ethn. Health 2017, 23, 691–702. [Google Scholar] [CrossRef]
- Yancey, A.K.; Cole, B.J.; Brown, R.; Williams, J.D.; Hillier, A.; Kline, R.S.; McCarthy, W.J. A Cross-Sectional Prevalence Study of Ethnically Targeted and General Audience Outdoor Obesity-Related Advertising. Milbank Q. 2009, 87, 155–184. [Google Scholar] [CrossRef] [PubMed]
- Cassady, D.L.; Liaw, K.; Miller, S. Disparities in Obesity-Related Outdoor Advertising by Neighborhood Income and Race. J. Urban Health 2015, 92. [Google Scholar] [CrossRef] [PubMed]
- Kelly, B.; Cretikos, M.; Rogers, K.; King, L. The commercial food landscape: Outdoor food advertising around primary schools in Australia. Aust N. Z. J. Public Health 2008, 32, 522–528. [Google Scholar] [CrossRef] [PubMed]
- Parnell, A.; Edmunds, M.; Pierce, H.; Stoneham, M. The volume and type of unhealthy bus shelter advertising around schools in Perth, Western Australia: Results from an explorative study. Health Promot. J. Austr. 2018, 30, 88–93. [Google Scholar] [CrossRef] [PubMed]
- Elliot, C. Packaging Fun: Analyzing Supermarket Food Messages Targeted at Children. Can. J. Commun. 2012, 37, 303–318. [Google Scholar] [CrossRef]
- Potvin Kent, M.; Dubois, L.; Wanless, A. A Nutritional Comparison of Foods and Beverages Marketed to Children in Two Advertising Policy Environments. Obesity 2012, 20, 1829–1837. [Google Scholar] [CrossRef] [PubMed]
- Health Canada. Health Can Healthy Eat Strategy. 2019. Available online: https://www.canada.ca/en/services/health/campaigns/vision-healthy-canada/healthy-eating.html (accessed on 1 November 2019).
- Parliament of Canada. Bill S-228: Act. Amend Food Drugs Act. Prohibiting Food Beverage Mark. Dir. Child. 2019. Available online: https://www.parl.ca/legisInfo/BillDetails.aspx?billId=8439397&Language=E (accessed on 1 November 2019).
- Potvin Kent, M.; Pauzé, E. The Frequency and Healthfulness of Food and Beverages Advertised on Adolescents’ Preferred Web Sites in Canada. J. Adolesc. Health 2018, 63, 102–107. [Google Scholar] [CrossRef]
- Health Canada. Consultation Report: Restricting Marketing of Unhealthy Food and Beverages to Children in Canada. 2017. Available online: https://www.canada.ca/en/health-canada/services/publications/food-nutrition/restricting-marketing-to-kids-what-we-heard.html (accessed on 1 November 2019).
- Bibeau, W.S.; Saksvig, B.I.; Gittelsohn, J.; Williams, S.; Jones, L.; Young, D.R. Perceptions of the food marketing environment among African American teen girls and adults. Appetite 2012, 58, 396–399. [Google Scholar] [CrossRef]
- Lusk, J.L.; McCluskey, J. Understanding the Impacts of Food Consumer Choice and Food Policy Outcomes. Appl. Econ. Perspect. Policy 2018, 40, 5–21. [Google Scholar] [CrossRef]
- Leech, N.L.; Onwuegbuzie, A.J. A typology of mixed methods research designs. Qual Quant. 2009, 43, 265–275. [Google Scholar] [CrossRef]
- Schoonenboom, J.; Johnson, R.B. How to construct a mixed methods research design. Köln. Z. Soziol. 2017, 69, 107–131. [Google Scholar] [CrossRef] [PubMed]
- Dubreck, C.M.; Sadler, R.C.; Arku, G.; Gilliland, J.A. Examining community and consumer food environments for children: An urban-suburban-rural comparison in Southwestern Ontario. Soc. Sci. Med. 2018, 209, 33–42. [Google Scholar] [CrossRef] [PubMed]
- Arunkumar, K.; Bowman, D.D.; Coen, S.E.; El-Bagdady, M.A.; Ergler, C.R.; Gilliland, J.A.; Mahmood, A.; Paul, S. Conceptualizing Youth Participation in Children’s Health Research: Insights from a Youth-Driven Process for Developing a Youth Advisory Council. Children 2019, 6, 3. [Google Scholar] [CrossRef] [PubMed]
- Jagosh, J.; Macaulay, A.C.; Pluye, P.; Salsberg, J.; Bush, P.L.; Henderson, J.; Greenhalgh, T. Uncovering the Benefits of Participatory Research: Implications of a Realist Review for Health Research and Practice. Milbank Q. 2012, 90, 311–346. [Google Scholar] [CrossRef]
- Chang, A.; Schulz, P.J.; Schirato, T.; Hall, B.J. Implicit Messages Regarding Unhealthy Foodstuffs in Chinese Television Advertisements: Increasing the Risk of Obesity. Int. J. Environ. Res. Public Health 2018, 15, 70. [Google Scholar] [CrossRef]
- Booysen, F. An Overview and Evaluation of Composite Indices of Development. Soc. Indic. Res. 2002, 59, 115–151. [Google Scholar] [CrossRef]
- Hallgren, K.A. Computing Inter-Rater Reliability for Observational Data: An Overview and Tutorial. Tutor. Quant. Methods Psychol. 2012, 8, 23–34. [Google Scholar] [CrossRef]
- Light, R.J. Measures of response agreement for qualitative data: Some generalizations and alternatives. Psychol. Bull. 1971, 76, 365–377. [Google Scholar] [CrossRef]
- Hutchings, J.B. Food Colour And Appearance; Springer: Bedford, UK, 1994. [Google Scholar]
- Watts, A.W.; Miller, J.; Larson, N.I.; Eisenberg, M.E.; Story, M.T.; Neumark-Sztainer, D. Multicontextual correlates of adolescent sugar-sweetened beverage intake. Eat. Behav. 2018, 30, 42–48. [Google Scholar] [CrossRef]
- Boyland, E.J.; Halford, J.C.G. Television advertising and branding. Effects on eating behaviour and food preferences in children. Appetite 2013, 62, 236–241. [Google Scholar] [CrossRef]
- Harris, J.L.; Pomeranz, J.L.; Lobstein, T.; Brownell, K.D. A crisis in the marketplace: How food marketing contributes to childhood obesity and what can be done. Annu Rev. Public Health 2009, 30, 211–225. [Google Scholar] [CrossRef] [PubMed]
- Ohri-Vachaspati, P.; Isgor, Z.; Rimkus, L.; Powell, L.M.; Barker, D.C.; Chaloupka, F.J. Child-Directed Marketing Inside and on the Exterior of Fast Food Restaurants. Am. J. Prev. Med. 2015. [Google Scholar] [CrossRef] [PubMed]
- Riggsbee, K.A.; Riggsbee, J.; Vilaro, M.J.; Moret, L.; Spence, M.; Steeves, E.A.; Colby, S. More than Fast Food: Development of a Story Map to Compare Adolescent Perceptions and Observations of Their Food Environments and Related Food Behaviors. Int. J. Environ. Res. Public 2019, 16, 76. [Google Scholar] [CrossRef] [PubMed]
- Vergeer, L.; Vanderlee, L.; Potvin Kent, M.; Mulligan, C.; L’Abbé, M.R. The effectiveness of voluntary policies and commitments in restricting unhealthy food marketing to Canadian children on food company websites. Appl. Physiol. Nutr. Metab. 2018, 44, 74–82. [Google Scholar] [CrossRef] [PubMed]
- Yan, W.; Hutchinson, H. Health Canada Update: Healthy Eating Strategy. 2018. Available online: https://obrieniph.ucalgary.ca/files/iph/healthy-eating-strategy-and-planned-policy-hasan-hutchinson-and-willia.pdf (accessed on 1 November 2019).
- United Nations Children’s Fund (UNICEF). A Child Rights-Based Approach Food Mark: A Guide Policy Making; UNICEF Private Sector Engagement: Geneva, Switzerland, 2018; Available online: https://www.unicef.org/csr/files/A_Child_Rights-Based_Approach_to_Food_Marketing_Report.pdf (accessed on 1 November 2019).
- Wilson, K.; Clark, A.F.; Gilliland, J.A. Understanding child and parent perceptions of barriers influencing children’s active school travel. BMC Public Health 2018, 18, 1053. [Google Scholar] [CrossRef]


| Ad Feature | Definitions, Examples, Inclusion/Exclusion Criteria |
|---|---|
| 1. Price | The price is present if it is available for a food/beverage item(s). Any other prices indicated on an ad (e.g., non-food items), are excluded. For example, $1 trading cards with beverage purchase would not be coded as “Price”—see features 4 and 8. |
| 2. Image of Food/Beverage | The food/beverage image is present if there is a photo of a food or beverage on the ad. This does not include foods present in the logo of a vendor or brand. |
| 3. Taste Description | The taste description/sensory appeal is present on the ad if there is a word(s) describing the taste (e.g., fresh, tasty, yummy, flavour, crunchy, delicious, ooey, gooey, savory). Note: Only words pertaining to taste are included. |
| 4. Sale/Deal/Special Offer | There is a sale, deal, or special offer present if there is either: (1) a deal/discount towards a food or beverage item(s); or, (2) a limited time/special offer (e.g., limited time offer, this food is back from October–November 11th, get this summer special, seasonal offer, 2/$5, buy one get one free, reduced price, etc.). Exclusive specials on certain days of the weekday are also included (e.g., Tuesday sub of the day is lower price). Note: this is only for food/beverage items (i.e., if you get a free dilly bar with next purchase, this qualifies). However, if there is a limited time offer for a contest/giveaway that is not food or drink-specific (e.g., McDonalds Monopoly), but it also has a limited time date for the contest itself and not a specific food item, this is excluded— see feature 8. |
| 5. Slogan/Description | The slogan/description is present if there is either: (1) a general ad description; (2) slogan or catchy phrase; or (3) a food or beverage item description (e.g., my summer tastes, handmade fresh tastes better, crispy chicken and waffle fries—also see feature 3). Note: most ads will have this feature present. |
| 6. Logo/Company Name | The logo/company name is present if either the logo, company name, or food brand is included on the ad (e.g., Metro, President’s Choice, Dairy Queen, Loblaw’s). |
| 7. Geographic/Online Location | The location is present if there is either the store address, directions, or website for ordering from the vendor. This ad criterion is more relevant for coding billboards and transit shelters. When coding food vendor signage that is already located at/on the property of the food store, this feature will be coded as N/A (0), unless it specifically has other location addresses on it or directions to other addresses. Online addresses qualify for ordering food/drinks online, like a web address or ordering app for a vendor, not a link for contests/giveaways—see feature 8. |
| 8. Gamification | Gamification is present on this ad if there is a contest/game, giveaway, chance to win something (e.g., National Hockey League (NHL) trading cards, chance to win a dirt bike or trip with the purchase of certain food/beverage items). This is also likely coded as a description—see feature 5. |
| 9. Loyalty Points/Rewards Program | Loyalty points/rewards program is present only if the ad mentions collecting points towards free food or being a member of a loyalty program (e.g., Petro Points, Student Price Cards, Scene Points, President’s Choice Optimum Points, MyWay Rewards, Pita Points). This is also likely coded as a description—see feature 5. |
| 10. Character, Celebrity, or TV/Sports tie-in | Characters, celebrities, or TV/sports tie-ins are present if any of the following are present. This includes both people (e.g., a teenager) and cartoon characters on logos, including non-human characters used to promote a brand or food vendor (e.g., man on the KFC logo, Little Caesars pizza character, the slush puppy dog). Other examples that would qualify include: a person in the ad, Michael Jordan eating a burger, a photo from the Jurassic World movie, a professional chef, etc. |
| Ad Feature | Point Allocation | Rank | General Rating | ||||
|---|---|---|---|---|---|---|---|
| Mean | Order | Mean | Inverted Order | Order | Mean | Order | |
| Price | 29.11 | 1 | 1.8 | 8.20 | 1 | 7.59 | 2 |
| Image of Food/Beverage | 20.80 | 2 | 2.09 | 7.91 | 2 | 7.84 | 1 |
| Taste Description | 11.73 | 3 | 5.07 | 4.93 | 4 | 6.16 | 4 |
| Sale/Deal/Special Offer | 9.98 | 4 | 4.48 | 5.52 | 3 | 6.75 | 3 |
| Slogan/Item Description | 8.52 | 5 | 5.36 | 4.64 | 6 | 4.84 | 6 |
| Logo/Company Name | 6.93 | 6 | 5.25 | 4.75 | 5 | 5.43 | 5 |
| Location/Directions | 4.27 | 7 | 6.89 | 3.11 | 7 | 4.39 | 7 |
| Gamification | 3.84 | 8 | 7.59 | 2.41 | 9 | 4.32 | 8 |
| Loyalty/Rewards | 3.30 | 9 | 7.16 | 2.84 | 8 | 4.84 | 6 |
| Character, Celebrity, or TV/Sports tie-in | 1.52 | 10 | 9.32 | 0.68 | 10 | 2.80 | 9 |
| Ad Feature | Presence Yes(1) No (0) | Size ☐ ☐ ☐ NA (0) S (0.25) M/L (1) | Weight Totals (Presence × Size) |
|---|---|---|---|
| Price | ____ × 29.11 × | ☐ ☐ ☐ | = |
| Image of Food/Beverage | ____ × 20.80 × | ☐ ☐ ☐ | = |
| Taste Description | ____ × 11.73 × | ☐ ☐ ☐ | = |
| Sale/Deal/Special offers | ____ × 9.98 × | ☐ ☐ ☐ | = |
| Slogan/Item Description | ____ × 8.52 × | ☐ ☐ ☐ | = |
| Logo/Company Name | ____ × 6.93 × | ☐ ☐ ☐ | = |
| Directions/Location | ____ × 4.27 × | ☐ ☐ ☐ | = |
| Gamification | ____ × 3.84 × | ☐ ☐ ☐ | = |
| Loyalty Points/Rewards | ____ × 3.30 × | ☐ ☐ ☐ | = |
| Character, Celebrity or TV/Sports tie-in | ____ × 1.52 × | ☐ ☐ ☐ | = |
| Ad Power | = score/100 | ||
| Feature | Kappa | % Agreement |
|---|---|---|
| Ad Type: Billboards/Transit Shelters (n = 93 ads) | ||
| Price | 0.910 | 96.8 |
| Food/Beverage Image | 1.000 | 100.0 |
| Slogan/Description | 0.891 | 95.7 |
| Logo/Company Name | 1.000 | 100.0 |
| Location/Directions | 0.950 | 97.8 |
| Sale/Deal/Special Offer | 0.731 | 92.5 |
| Loyalty/Rewards | 1.000 | 100.0 |
| Gamification | 0.903 | 98.9 |
| Taste Description | 0.678 | 91.4 |
| Characters, Celebrities, TV, or Sports tie ins | 0.863 | 94.6 |
| Average | 0.893 | 96.8 |
| Ad Type: Outdoor Vendor Signage (n = 999 ads) | ||
| Price | 0.923 | 96.6 |
| Food/Beverage Image | 0.936 | 96.4 |
| Slogan/Description | 0.732 | 82.6 |
| Logo/Company Name | 0.884 | 92.6 |
| Location/Directions | 0.923 | 99.2 |
| Sale/Deal/Special Offer | 0.969 | 98.7 |
| Loyalty/Rewards | 0.998 | 99.8 |
| Gamification | 0.984 | 99.9 |
| Taste Description | 0.769 | 96.7 |
| Characters, Celebrities, TV or Sports tie ins | 0.980 | 99.7 |
| Average | 0.910 | 96.2 |
| Ad Feature | Presence Score | Size Score | Totals (Presence Score × Size Score) |
|---|---|---|---|
| 1. Price | 0 | 0 | 0 |
| 2. Image of Food/Beverage | 0 | 0 | 0 |
| 3. Taste Description | 0 | 0 | 0 |
| 4. Sale/Deal/Special offers | 0 | 0 | 0 |
| 5. Slogan/Description | 0 | 0 | 0 |
| 6. Logo/Company Name | 6.93 | 1 | 6.93 |
| 7. Directions/Location | 0 | 0 | 0 |
| 8. Gamification | 0 | 0 | 0 |
| 9. Loyalty Points/Rewards | 0 | 0 | 0 |
| 10. Character, Celebrity or TV/Sports tie-in | 0 | 0 | 0 |
| Total Power | 6.93 |
| Ad Feature | Presence Score | Size Score | Totals (Presence Score × Size Score) |
|---|---|---|---|
| 1. Price | 0 | 0 | 0 |
| 2. Image of Food/Beverage | 20.80 | 1 | 20.80 |
| 3. Taste Description | 0 | 0 | 0 |
| 4. Sale/Deal/Special offers | 0 | 0 | 0 |
| 5. Slogan/Description | 8.52 | 1 | 8.52 |
| 6. Logo/Company Name | 6.93 | 0.25 | 1.73 |
| 7. Directions/Location | 0 | 0 | 0 |
| 8. Gamification | 0 | 0 | 0 |
| 9. Loyalty Points/Rewards | 0 | 0 | 0 |
| 10. Character, Celebrity or TV/Sports tie-in | 0 | 0 | 0 |
| Total Power | 31.05 |
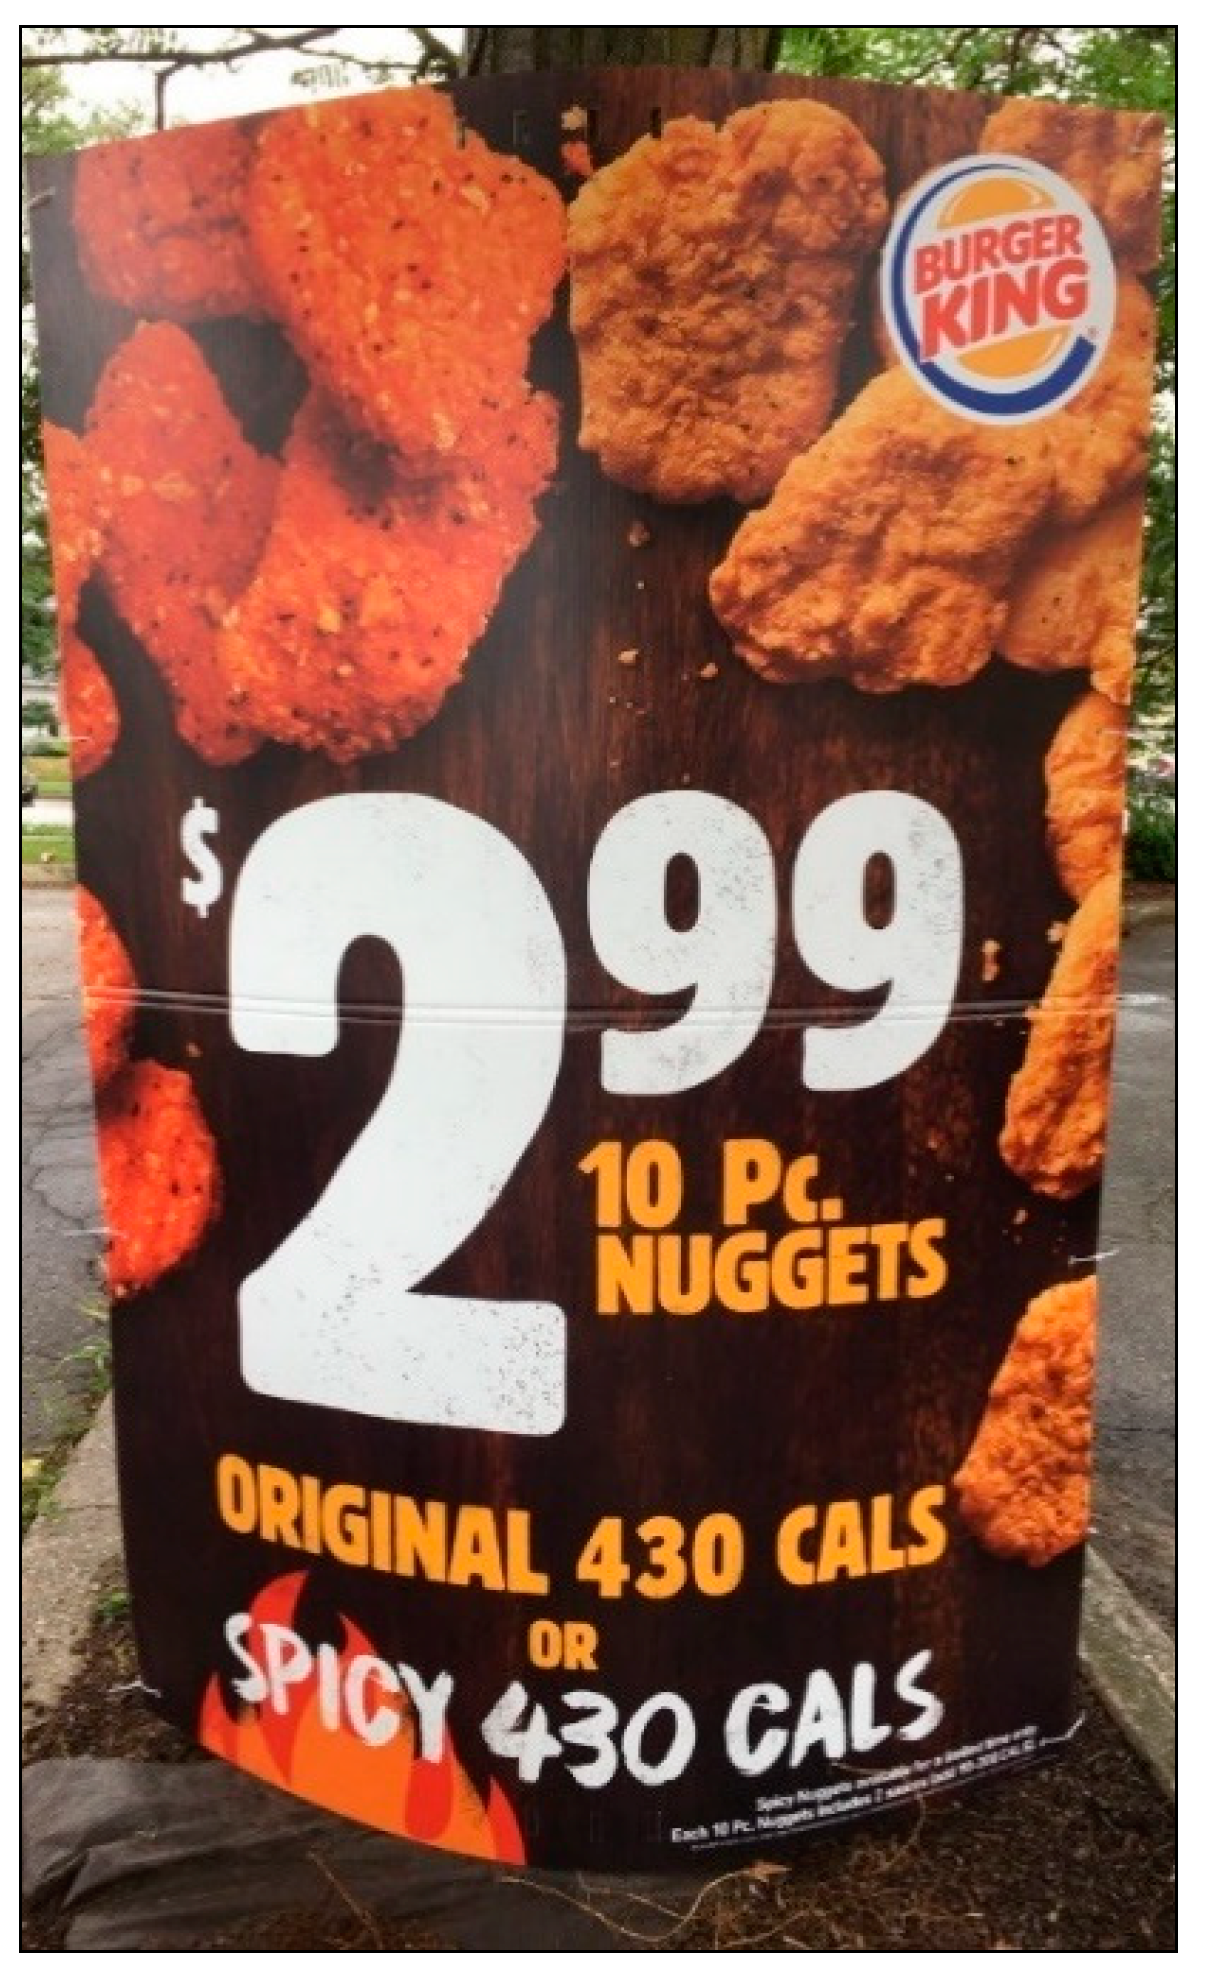
| Ad Feature | Presence Score | Size Score | Totals (Presence Score × Size Score) |
|---|---|---|---|
| 1. Price | 29.11 | 1 | 29.11 |
| 2. Image of Food/Beverage | 20.80 | 1 | 20.80 |
| 3. Taste Description | 11.73 | 0.25 | 2.93 |
| 4. Sale/Deal/Special offers | 9.98 | 0.25 | 2.50 |
| 5. Slogan/Description | 8.52 | 0.25 | 2.13 |
| 6. Logo/Company Name | 6.93 | 0.25 | 1.73 |
| 7. Directions/Location | 0 | 0 | 0 |
| 8. Gamification | 0 | 0 | 0 |
| 9. Loyalty Points/Rewards | 0 | 0 | 0 |
| 10. Character, Celebrity or TV/Sports tie-in | 0 | 0 | 0 |
| Total Power | 59.20 |
© 2019 by the authors. Licensee MDPI, Basel, Switzerland. This article is an open access article distributed under the terms and conditions of the Creative Commons Attribution (CC BY) license (http://creativecommons.org/licenses/by/4.0/).
Share and Cite
Bowman, D.D.; Minaker, L.M.; Simpson, B.J.K.; Gilliland, J.A. Development of a Teen-Informed Coding Tool to Measure the Power of Food Advertisements. Int. J. Environ. Res. Public Health 2019, 16, 4258. https://doi.org/10.3390/ijerph16214258
Bowman DD, Minaker LM, Simpson BJK, Gilliland JA. Development of a Teen-Informed Coding Tool to Measure the Power of Food Advertisements. International Journal of Environmental Research and Public Health. 2019; 16(21):4258. https://doi.org/10.3390/ijerph16214258
Chicago/Turabian StyleBowman, Drew D., Leia M. Minaker, Bonnie J. K. Simpson, and Jason A. Gilliland. 2019. "Development of a Teen-Informed Coding Tool to Measure the Power of Food Advertisements" International Journal of Environmental Research and Public Health 16, no. 21: 4258. https://doi.org/10.3390/ijerph16214258
APA StyleBowman, D. D., Minaker, L. M., Simpson, B. J. K., & Gilliland, J. A. (2019). Development of a Teen-Informed Coding Tool to Measure the Power of Food Advertisements. International Journal of Environmental Research and Public Health, 16(21), 4258. https://doi.org/10.3390/ijerph16214258