Reliability and Concurrent Validity of Global Physical Activity Questionnaire (GPAQ): A Systematic Review

 ,
, 
Abstract
1. Introduction
2. Materials and Methods
2.1. Selection Criteria
2.2. Data Reduction and Harmonization
2.3. Methodological Quality and Risk of Bias
2.4. Synthesis of Results
2.4.1. Reliability
2.4.2. Concurrent or Criterion Validity
3. Results
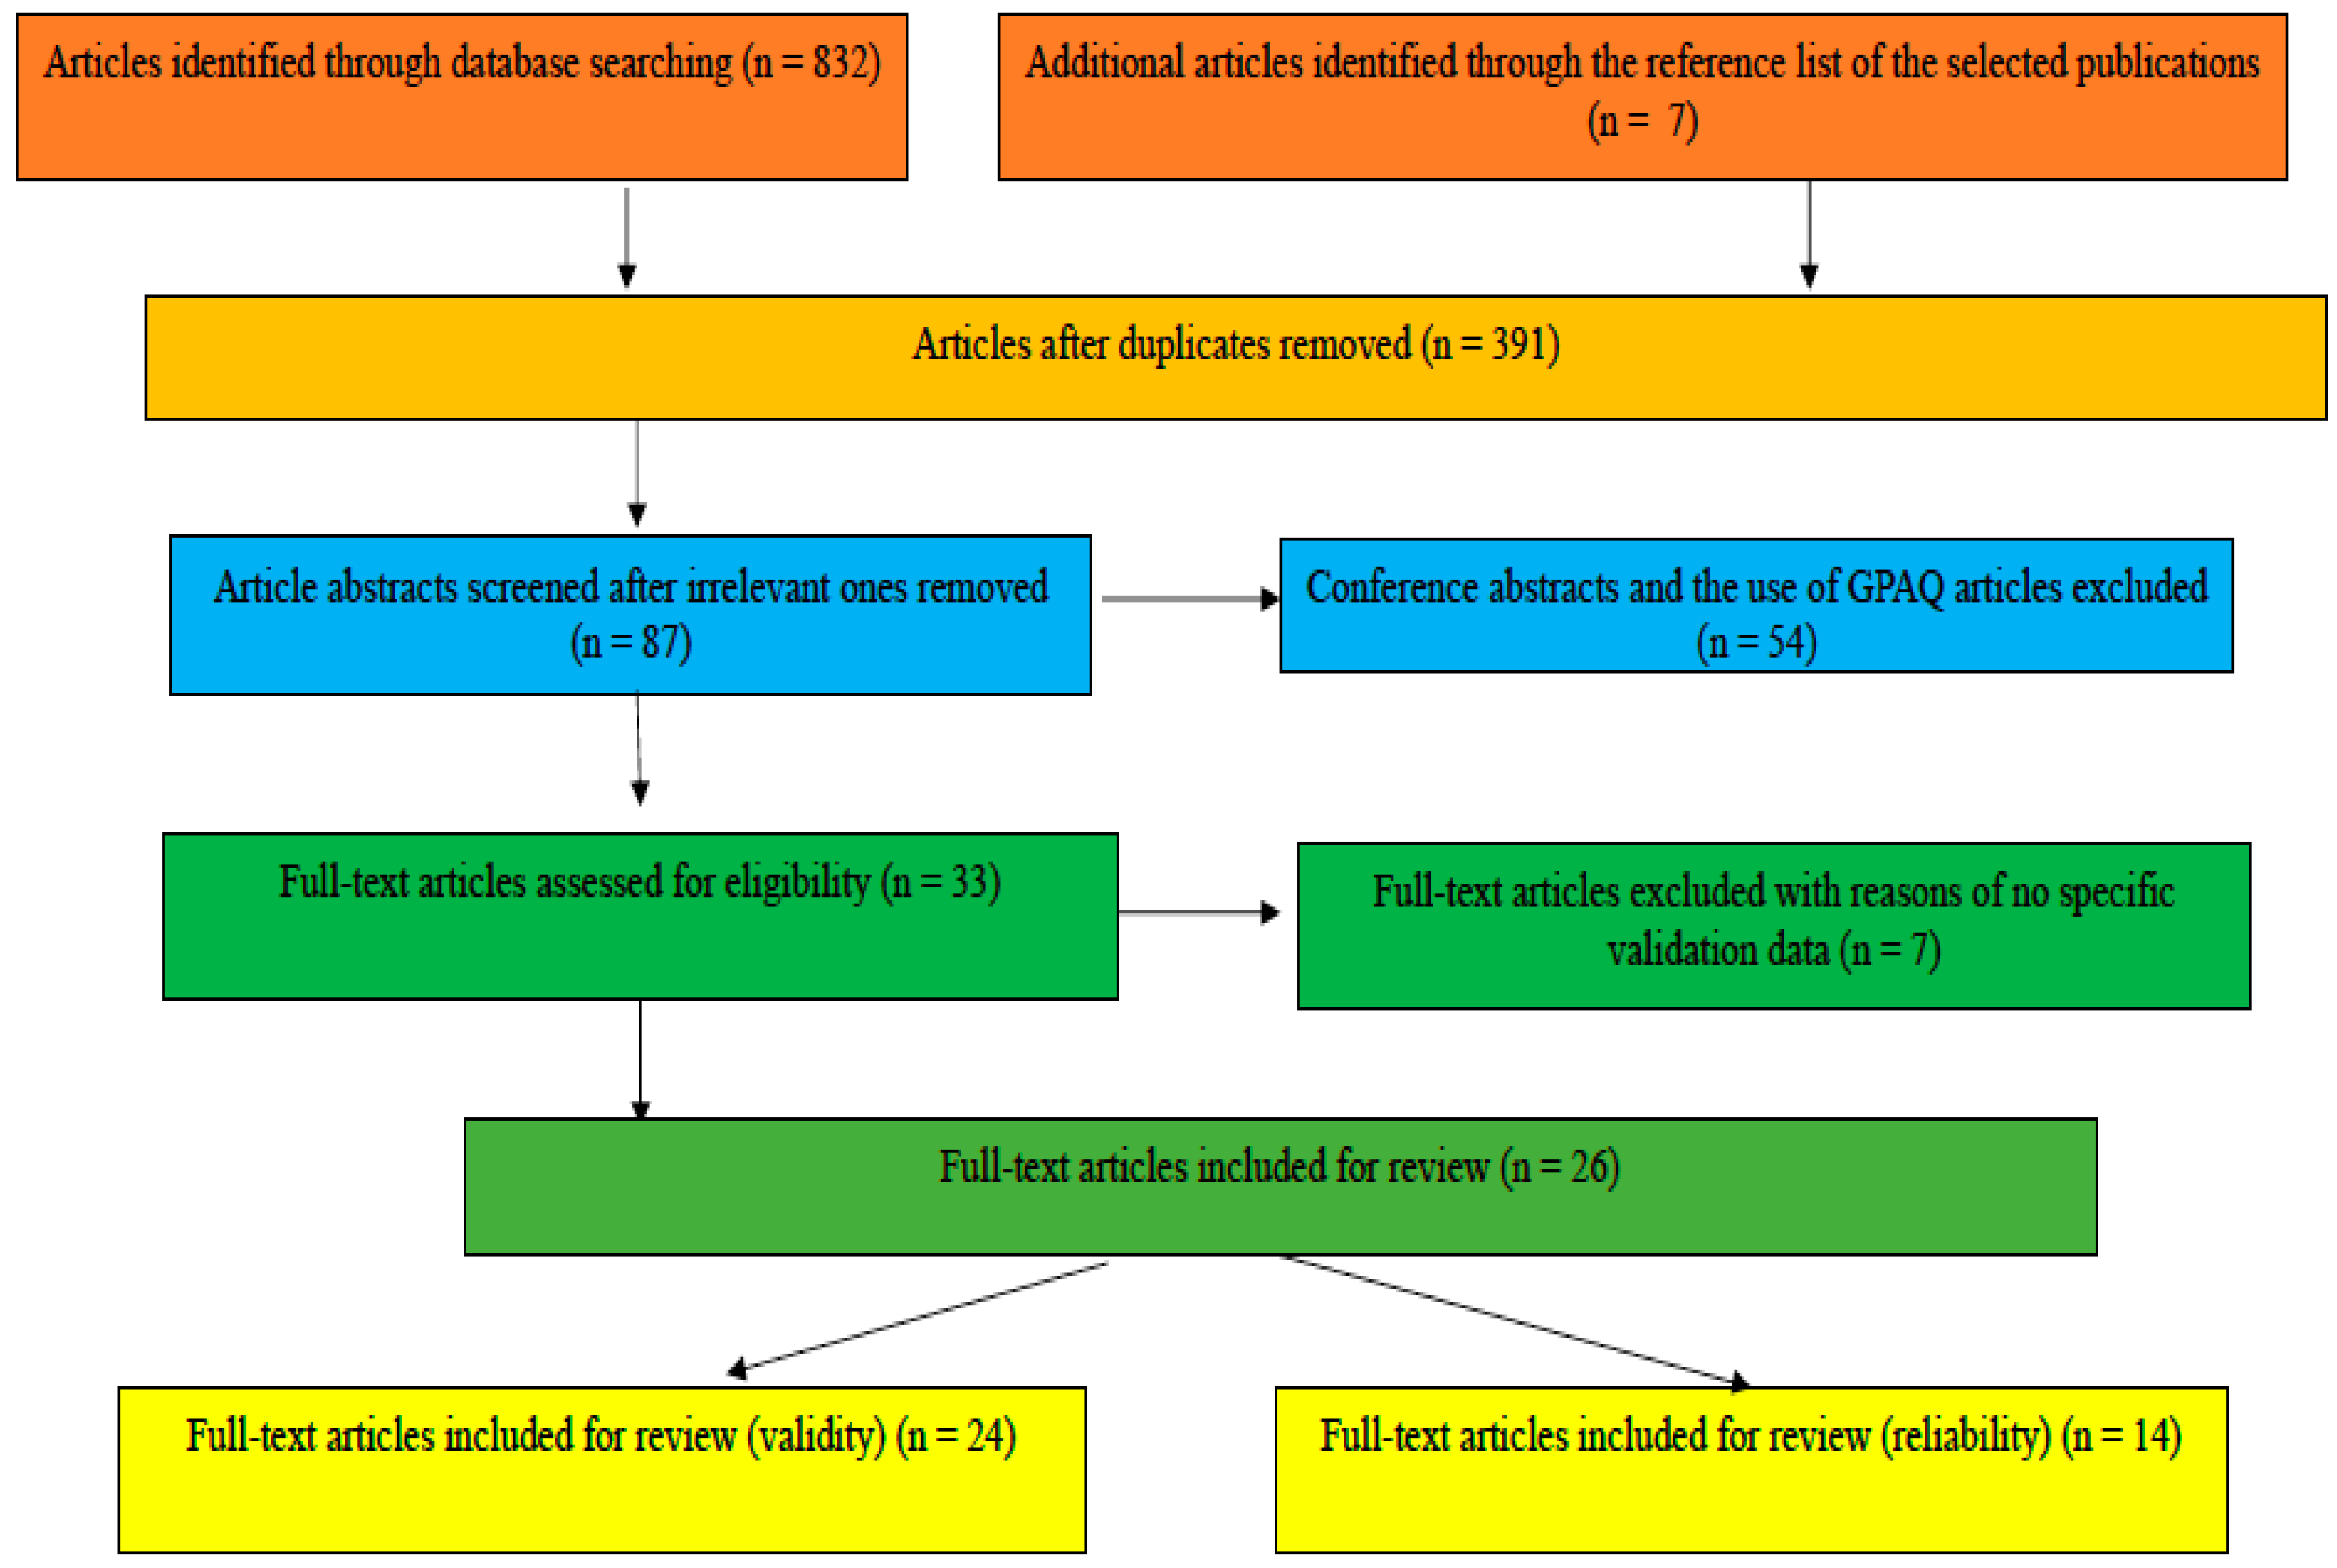
3.1. Article Selection
3.2. Methodological Quality and Risk of Bias
3.3. Concurrent Validity of GPAQ
Concurrent Validity Results
3.4. Test–Retest Reliability of GPAQ
4. Discussion
4.1. GPAQ Reliability and Validity in Adults in Free-Living Settings
4.1.1. Sample Size
4.1.2. Concurrent Validity
4.1.3. Reliability
4.2. The Lack of Revalidations in Elderly Groups and Other Continents
4.2.1. Revalidation in Various Age Groups
4.2.2. Revalidations of GPAQ in Other Continents
4.3. Limitations
5. Conclusions
Author Contributions
Funding
Conflicts of Interest
References
- Bull, F.C.; Maslin, T.S.; Armstrong, T.P. Global Physical Activity Questionnaire (GPAQ): Nine country reliability and validity study. J. Phys. Act. Health 2009, 6, 790–804. [Google Scholar] [CrossRef] [PubMed]
- Armstrong, T.; Bull, F. Development of the World Health Organization Global Physical Activity Questionnaire (GPAQ). J. Public Health 2006, 14, 66–70. [Google Scholar] [CrossRef]
- Chinapaw, M.J.M.; Mokkink, L.B.; van Poppel, M.N.M.; van Mechelen, W.; Terwee, C.B. Physical activity questionnaires for Youth: A systematic review of measurement properties. Sports Med. 2010, 40, 539–563. [Google Scholar] [CrossRef] [PubMed]
- Helmerhorst, H.J.F.; Brage, S.; Warren, J.; Besson, H.; Ekelund, U. A systematic review of reliability and objective criterion-related validity of physical activity questionnaires. Int. J. Behav. Nutr. Phys. Act. 2012, 9, 103–157. [Google Scholar] [CrossRef]
- Hidding, L.M.; Chinapaw, M.J.M.; van Poppel, M.N.M.; Mokkink, L.B.; Altenburg, T.M. An updated systematic review of childhood physical activity questionnaires. Sports Med. 2018, 48, 2797–2842. [Google Scholar] [CrossRef]
- de Courten, M. Developing a simple global physical activity questionnaire for population studies. Aust. Epidemiol. 2002, 9, 6–9. [Google Scholar]
- Chu, A.H.Y.; Ng, S.H.X.; Koh, D.; Müller-Riemenschneider, F. Domain-specific Adult Sedentary Behaviour Questionnaire (ASBQ) and the GPAQ single-item question: A reliability and validity study in an Asian population. Int. J. Environ. Res. Public Health 2018, 15, 739. [Google Scholar] [CrossRef]
- Evenson, K.R.; Goto, M.M.; Furberg, R.D. Systematic review of the validity and reliability of consumer-wearable activity trackers. Int. J. Behav. Nutr. Phys. Act. 2015, 12, 159–180. [Google Scholar] [CrossRef]
- Lingesh, G.; Khoo, S.; Mohamed, M.N.A.; Taib, N.A. Comparing physical activity levels of Malay version of the IPAQ and GPAQ with accelerometer in nurses. Int. J. Appl. Exerc. Physiol. 2016, 5, 8–17. [Google Scholar]
- Chu, A.H.Y.; Moy, F.M. Reliability and validity of the Malay International Physical Activity Questionnaire (IPAQ-M) among a Malay population in Malaysia. Asia Pac. J. Public Health 2015, 27, NP2381–NP2389. [Google Scholar] [CrossRef]
- Hu, B.; Lin, L.F.; Zhuang, M.Q.; Yuan, Z.Y.; Li, S.Y.; Yang, Y.J.; Lu, M.; Yu, S.Z.; Jin, L.; Ye, W.M.; et al. Reliability and relative validity of three physical activity questionnaires in Taizhou population of China: The Taizhou longitudinal study. Public Health 2015, 129, 1211–1217. [Google Scholar] [CrossRef] [PubMed]
- Trinh, O.T.H.; Nguyen, N.D.; van der Ploeg, H.P.; Dibley, M.J.; Bauman, A. Test-retest repeatability and relative validity of the Global Physical Activity Questionnaire in a developing country context. J. Phys. Act. Health 2009, 6, S46–S53. [Google Scholar] [CrossRef] [PubMed]
- da Silva, I.C.M.; Mielke, G.I.; Bertoldi, A.D.; Arrais, P.S.D.; Luiza, V.L.; Mengue, S.S.; Hallal, P.C. Overall and leisure-time physical activity among Brazilian adults: National survey based on the Global Physical Activity Questionnaire. J. Phys. Act. Health 2018, 15, 212–218. [Google Scholar] [CrossRef] [PubMed]
- Ranasinghe, C.D.; Ranasinghe, P.; Jayawardena, R.; Misra, A. Physical activity patterns among South-Asian adults: A systematic review. Int. J. Behav. Nutr. Phys. Act. 2013, 10, 116–126. [Google Scholar] [CrossRef] [PubMed]
- World Health Organization. Global Physical Activity Questionnaire (GPAQ) Analysis Guide. Available online: http://www.who.int/ncds/surveillance/steps/resources/GPAQ_Analysis_Guide.pdf (accessed on 4 November 2018).
- Cleland, C.L.; Hunter, R.F.; Kee, F.; Cupples, M.E.; Sallis, J.F.; Tully, M.A. Validity of the Global Physical Activity Questionnaire (GPAQ) in assessing levels and change in moderate-vigorous physical activity and sedentary behavior. BMC Public Health 2014, 14, 1255–1265. [Google Scholar] [CrossRef]
- Thompson, D.; Batterham, A.M.; Bock, S.; Robson, C.; Stokes, K. Assessment of low-to-moderate intensity physical activity thermogenesis in young adults using synchronized heart rate and accelerometry with branched-equation modeling. J. Nutr. 2006, 136, 1037–1042. [Google Scholar] [CrossRef]
- Chu, A.H.Y.; Ng, S.H.X.; Koh, D.; Müller-Riemenschneider, F. Reliability and validity of the self- and interviewer-administered versions of the Global Physical Activity Questionnaire (GPAQ). PLoS ONE 2015, 10, e0136944. [Google Scholar] [CrossRef]
- Aguilar-Farias, N.; Zamora, J.L. Is a single question of the Global Physical Activity Questionnaire (GPAQ) valid for measuring sedentary behavior in the Chilean population? J. Sports Sci. 2017, 35, 1652–1657. [Google Scholar]
- Metclif, K.; Baquero, B.; Garcia, M.L.C.; Francis, S.L.; Janz, K.F.; Laroche, H.H.; Swell, D. Calibration of the Global Physical Activity Questionnaire to accelerometry measured physical activity and sedentary behavior. BMC Public Health 2018, 18, 412–421. [Google Scholar] [CrossRef]
- Anjana, R.M.; Sudha, V.; Lakshmipriya, N.; Subhashini, S. Reliability and validity of a new physical activity questionnaire for India. Int. J. Behav. Nutr. Phys. Act. 2015, 12, 40–51. [Google Scholar] [CrossRef]
- Thuy, A.B.; Blizzard, L.; Schmidt, M.; Luc, P.H.; Magnussen, C.; Dwyer, T. Reliability and validity of the Global Physical Activity Questionnaire in Vietnam. J. Phys. Act. Health 2010, 7, 410–418. [Google Scholar] [CrossRef]
- Keating, X.; Zhou, K.; Liu, J.; Shangguan, R.; Fan, Y.; Harrison, L.H. Research on preservice physical education and preservice elementary teacher’s physical education identity: A systematic review. J. Teach. Phys. Educ. 2017, 36, 162–172. [Google Scholar] [CrossRef]
- Van Poppel, M.N.M.; Chinapaw, M.J.M.; Mokkink, L.B.; van Mechelen, W.; Terwee, C.B. Physical activity questionnaires for adults: A systematic review of measurement properties. Sports Med. 2010, 40, 565–600. [Google Scholar] [CrossRef] [PubMed]
- Moher, D.; Shamseer, L.; Clarke, M.; Ghersi, D.; Liberati, A.; Petticrew, M.; Shekelle, P.; Stewart, L.A. Preferred reporting items for systematic review and meta-analysis protocols (PRISMA-P) 2015 statement. Syst. Rev. 2015, 4, 1–9. [Google Scholar] [CrossRef] [PubMed]
- Bermejo-Cantarero, A.; Álvarez-Bueno, C.; Martinez-Vizcaino, V.; García-Hermoso, A.; Torres-Costoso, A.I.; Sánchez-López, M. Association between physical activity, sedentary behavior, and fitness with health- related quality of life in healthy children and adolescents: A protocol for a systematic review and meta-analysis. Medicine 2017, 96, 12–16. [Google Scholar] [CrossRef] [PubMed]
- Skender, S.; Ose, J.; Chang-Claude, J.; Paskow, M.; Bruhmann, B.; Siegel, E.M.; Steindorf, K.; Ulrich, C.M. Accelerometry and physical activity questionnaires—A systematic review. BMC Public Health 2016, 16, 515–524. [Google Scholar] [CrossRef] [PubMed]
- Meyers, R.M.; Bryan, J.G.; McFarland, J.M.; Weir, B.A.; Sizemore, A.E.; Xu, H.; Dharia, N.V.; Montgomery, P.G.; Cowley, G.S.; Pantel, S.; et al. Computational correction of copy number effect improves specificity of CRISPR-Cas9 essentiality screens in cancer cells. Nat. Genet. 2017, 49, 1779–1784. [Google Scholar] [CrossRef]
- National Heart, Lung, and Blood Institute. The Modified Quality Assessment Tool for Observational Cohort and Cross-Sectional Studies. Available online: https://www.nhlbi.nih.gov/health-topics/study-quality-assessment-tools (accessed on 25 June 2019).
- Mandrekar, J.N. Measures of interrater agreement. J. Thorac. Oncol. 2011, 6, 6–7. [Google Scholar] [CrossRef]
- Warner, R.M. Applied Statistics: From Bivariate through Multivariate Techniques, 2nd ed.; Sage Publications, Inc.: Thousand Oaks, CA, US, 2013. [Google Scholar]
- Hagströmer, M.; Oja, P.; Sjöström, M. The International Physical Activity Questionnaire (IPAQ): A study of concurrent and construct validity. Public Health Nutr. 2006, 9, 755–762. [Google Scholar] [CrossRef]
- Sitthipornvorakul, E.; Janwantanakul, P.; van der Beek, A.J. Correlation between pedometer and the Global Physical Activity Questionnaire on physical activity measurement in office workers. BMC Res. Notes 2014, 7, 280–285. [Google Scholar] [CrossRef]
- Mumu, S.J.; Ali, L.; Barnett, A.; Merom, D. Validity of the Global Physical Activity Questionnaire (GPAQ) in Bangladesh. BMC Public Health 2017, 17, 650–659. [Google Scholar] [CrossRef] [PubMed]
- Rivière, F.; Widad, F.Z.; Speyer, E.; Erpelding, M.L.; Escalon, H.; Vuillemin, A. Reliability and validity of the French version of the Global Physical Activity Questionnaire. J. Sport Health Sci. 2018, 7, 339–345. [Google Scholar] [CrossRef] [PubMed]
- Misra, P.; Upadhyay, R.P.; Krishnan, A.; Sharma, N. A community based study to test the reliability and validity of physical activity measurement techniques. Int. J. Prev. Med. 2014, 5, 952–959. [Google Scholar] [PubMed]
- Soo, K.L.; Wan Abdul Manan, W.M.; Wan Suriati, W.N. The Bahasa Melayu version of the Global Physical Activity Questionnaire. Asia Pac. J. Public Health 2015, 27, NP184–NP193. [Google Scholar] [CrossRef] [PubMed]
- Alkahtani, S.A. Convergent validity: Agreement between accelerometry and the Global Physical Activity Questionnaire in college-age Saudi men. BMC Res. Notes 2016, 9, 436–444. [Google Scholar] [CrossRef] [PubMed]
- Watson, E.D.; Micklesfield, L.K.; van Poppel, N.M.; Norris, S.A.; Sattler, M.C.; Dietz, P. Validity and responsiveness of the Global Physical Activity Questionnaire (GPAQ) in assessing physical activity during pregnancy. PLoS ONE 2017, 12, e0177996. [Google Scholar] [CrossRef] [PubMed]
- Ruiz-Casado, A.; Alejo, L.B.; Santos-Lozano, A.; Soria, A.; Ortega, M.J.; Pagola, I.; Fiuza-Luces, C.; Palomo, I.; Garatachea, N.; Cebolla, H.; et al. Validity of the physical activity questionnaires IPAQ-SF and GPAQ for cancer survivors: Insights from a Spanish cohort. Int. J. Sports Med. 2016, 37, 979–985. [Google Scholar] [CrossRef]
- Gorzelitz, J.; Peppard, P.E.; Malecki, K.; Gennuso, K.; Nieto, F.J.; Cadmus-Bertram, L. Predictors of discordance in self-report versus device-measured physical activity measurement. Ann. Epidemiol. 2018, 28, 427–431. [Google Scholar] [CrossRef]
- Herrmann, S.D.; Heumann, K.J.; Ananian, C.A.D.; Ainsworth, B.E. Validity and reliability of the Global Physical Activity Questionnaire (GPAQ). Meas. Phys. Educ. Exerc. Sci. 2013, 17, 221–235. [Google Scholar] [CrossRef]
- Hoos, T.; Espinoza, N.; Marshall, S.; Arredondo, E.M. Validity of the Global Physical Activity Questionnaire (GPAQ) in adult Latinas. J. Phys. Act. Health 2012, 9, 698–705. [Google Scholar] [CrossRef]
- Laeremans, M.; Dons, E.; Avila-Palencia, I.; Carrasco-Turigas, G.; Orjuela, J.P.; Anaya, E.; Brand, C.; Cole-Hunter, T.; de Nazelle, A.; Götschi, T.; et al. Physical activity and sedentary behaviour in daily life: A comparative analysis of the Global Physical Activity Questionnaire (GPAQ) and the SenseWear armband. PLoS ONE 2017, 12, e0177765. [Google Scholar] [CrossRef] [PubMed]
- Mathews, E.; Salvo, D.; Sarma, P.S.; Thankappan, K.R.; Pratt, M. Adapting and validating the Global Physical Activity Questionnaire (GPAQ) for Trivandrum, India, 2013. Prev. Chronic Dis. 2016, 13, E53–E63. [Google Scholar] [CrossRef] [PubMed]
- Lee, J.; Lee, C.; Min, J.; Kang, D.W.; Kim, J.Y.; Yang, H.I.; Park, J.; Lee, M.K.; Lee, M.; Park, I.; et al. Development of the Korean Global Physical Activity Questionnaire: Reliability and validity study. Glob. Health Promot. 2019. [Google Scholar] [CrossRef] [PubMed]
- Wanner, M.; Hartmann, C.; Pestoni, G.; Martin, B.W.; Siegrist, M.; Martin-Diener, E. Validation of the Global Physical Activity Questionnaire for self-administration in a European context. BMJ Open Sport Exerc. Med. 2017, 3, e000206. [Google Scholar] [CrossRef] [PubMed]
- Doyle, C.; Khan, A.; Burton, N. Reliability and validity of a self-administered Arabic version of the Global Physical Activity Questionnaire (GPAQ-A). J. Sports Med. Phys. Fit. 2019, 59, 1221–1228. [Google Scholar] [CrossRef]
- Hogg, R.V.; Tanis, E.; Zimmerman, D. Probability and Statistical Inference, 9th ed.; Pearson Education: London, UK, 2015. [Google Scholar]
- Marques, A.; Santos, D.A.; Hillman, C.H.; Sardinha, L.B. How does academic achievement relate to cardiorespiratory fitness, self-reported physical activity and objectively reported physical activity: A systematic review in children and adolescents aged 6–18 years. Br. J. Sports Med. 2018, 52, 1039–1049. [Google Scholar] [CrossRef]
- Lee, P.H.; Macfarlane, D.J.; Lam, T.; Stewart, S.M. Validity of the International Physical Activity Questionnaire Short Form (IPAQ-SF): A systematic review. Int. J. Behav. Nutr. Phys. Act. 2011, 8, 115–125. [Google Scholar] [CrossRef]
- Henriksen, A.; Haugen Mikalsen, M.; Woldaregay, A.Z.; Muzny, M.; Hartvigsen, G.; Hopstock, L.A.; Grimsgaard, S. Using fitness trackers and smartwatches to measure physical activity in research: Analysis of consumer wrist-worn wearables. J. Med. Internet Res. 2018, 20, e110. [Google Scholar] [CrossRef]
- Jeffries, R.M.; Inge, T.H.; Jenkins, T.M.; King, W.; Oruc, V.; Douglas, A.D.; Bray, M. Physical activity monitoring in extremely obese adolescents from the Teen-LABS study. J. Phys. Act. Health 2015, 12, 132–138. [Google Scholar] [CrossRef][Green Version]
- Eckert, K.G.; Lange, M.A. Comparison of physical activity questionnaires for the elderly with the International Classification of Functioning, Disability and Health (ICF)—An analysis of content. BMC Public Health 2015, 15, 249–259. [Google Scholar] [CrossRef]
- McAuley, E.; Konopack, J.F.; Motl, R.W.; Morris, K.S.; Doerksen, S.E.; Rosengren, K.R. Physical activity and quality of life in older adults: Influence of health status and self-efficacy. Ann. Behav. Med. 2006, 31, 99–103. [Google Scholar] [CrossRef] [PubMed]


| Initial Search: Assessment Retrieval | Database and Search Terms | Search Criteria |
|---|---|---|
| Article’s title | EBSCOhost: Validity, concurrent validity, reliability, validation, global physical activity questionnaire, and Global Physical Activity Questionnaire (GPAQ) | Peer-reviewed journal articles; written in English; analyzed/discussed the reliability and/or validity of the GPAQ; studies using the GPAQ to collect PA data were excluded; conference abstracts and papers were eliminated; articles discussing GPAQ without actual reliability and validity data were not selected; time frame was set from 2002 to September 2019. |
| PubMed: Validity, concurrent validity, reliability, validation, global physical activity questionnaire, and GPAQ | ||
| Google Scholar: Validity, concurrent validity, reliability, validation, global physical activity questionnaire, and GPAQ | ||
| Webs of Science: Validity, concurrent validity, reliability, validation, global physical activity questionnaire, and GPAQ |
| Country | First Author, Year | Research Design | ||
|---|---|---|---|---|
| Participants | Data Collection | Measures | ||
| Bangkok (Thailand) | Sitthipornvorakul et al. 2014 [32] | 320 office workers; aged 34.8 ± 6.2 years; 20% male | PA assessed by Yamax Digiwalker CW-700 pedometer for seven days and by GPAQ. | Concurrent validity: ICC for correlation between GPAQ and pedometer data. |
| Bangladesh | Mumu et al. 2017 [34] | 162 healthy adults; aged 35 ± 9 years; 54% female | Seven-day wearing AG, then answered GPAQ in a face-to-face interview. | Concurrent validity: Spearman’s rho between GPAQ and accelerometer indicators. |
| Chile | Aguilar-Farias et al. 2017 [19] | 217 adults; aged 43.77 ± 15.75 year; 42.9% male | Seven-day wearing AG; face-to-face interview GPAQ single question about sedentary behavior. | Concurrent validity (Spearman correlation) between AG and GPAQ. |
| China | Hu et al. 2015 [11] | 205 adults; aged 30–70 years; 38.54% male | Completed three questionnaires twice (Day 1 and Day 9), a PA-log for seven days. | Test–retest reliabilities: Using intra-class correlation coefficients (ICC); Relative validities: Comparing the data from PA questionnaires and PA-log. |
| France | Rivière et al. 2018 [35] | 92 adults (56.5% students; 43,5% staff in a medical school); age >18; 27.2% male | Seven-day wearing AG, complete GPAQ before and after wearing AG. | Reliability and criterion and concurrent validity of GPAQ against AG. |
| India | Misra et al. 2014 [36] | 234 participants; age 15–74 years; 49.6% male | Test–retest repeatability of GPAQ, IPAQ, and pedometer. | Spearman’s rho, ICC for validity and reliability. |
| Mathews et al. 2016 [45] | 47 adults; aged 18–64 years; 100% female | Using AG to validate the self-polished modified GPAQ. | Concurrent validity (Spearman’s rho) and ICC | |
| Korea | Lee et al. 2019 [46] | 115 for reliability (55 males and 60 females), age 19–75 years; 199 adults for validity (82 males and 117 females) | Completed GPARQ twice with seven days apart; Seven-day wearing AG, complete GPAQ after wearing AG. | Test–retest reliability and criterion-related validity (Spearman’s rho) |
| Malaysia | Lingesh et al. 2016 [9] | 43 nurses; aged 24 to 55 years (44.48 ± 8.38 years); 100% female | IPAQ and GPAQ: Measured on the eighth day, and wore SenseWear accelerometer and recorded PA logs for seven consecutive days. | PA data measured by PA logs for seven days; METs-min/week−1 was used; Pearson correlations and a Bland–Altman plot. |
| Soo et al. 2015 [37] | 100 adults; aged 20–58 years; 83% female | By comparing GPAQ-M with IPAQ-S and objectively measuring PA using a Yamax DigiWalker pedometer. | Two-week test–retest reliability: Using the Wilcoxon signed-rank analysis; concurrent validity: Spearman’s rho by comparing GPAQ-M data with IPAQ and objectively measured PA data. | |
| Saudi Arabia | Alkahtani, 2016 [38] | 62 college students; aged 19–21 years (20.0 ± 1.1 year); 100% male | Completed GPAQ twice (two weeks apart) and wore AG for seven consecutive days. | Test–retest reliability and concurrent validity of the GPAQ with AG using Spearman’s rho. |
| Singapore | Chu et al. 2015 [18] | 110 working adults and students; aged 31 (26.8–47.3); 70.9% female | Self- and interviewer-administration of GPAQ, seven days of AG. | Test–retest reliability with one-week interval; criterion validity with Spearman’s ICC. |
| Chu et al. 2018 [7] | 84 medicine faculty and staff at a university; aged 21–65 years; 69% female | Single sitting item of GPAQ using self- and interviewer-administered modes twice with seven days apart, seven days of AG. | Reliability using the Spearman’s rho and ICC; Convergent validity using Spearman’s rho. | |
| South Africa | Watson et al. 2017 [39] | 95 pregnant women, aged 29.5 ± 5.7 years | Data collected at 14–18 weeks and 29–33 weeks’ gestation; seven-day wearing AG; comparing total time in MVPA between GPAQ and AG. | Content validity, convergent validity in comparison with AG; relative validity. |
| Spain | Ruiz-Casado et al. 2016 [40] | 204 cancer survivors; aged 18–79 years; 36% male | Comparing IPAQ-SF and GPAQ with AG; AG was worn for 5 to 10 days. | Validity: Wilcoxon signed-rank was used to compare the differences between questionnaire and accelerometry data. |
| Switzerland | Wanner et al., 2017 [47] | 354 (physical activity) and 366 (sitting), age 18–83 years | Completed GPAQ on Day 1, then wore AG for seven days. | Concurrent validity (Spearman correlation) |
| The United Arab Emirates (UAE) | Doyle et al. 2019 [48] | 93 university students; | Completing GPAQ-A on two occasions (seven days apart); wearing an accelerometer for seven days. | Test–retest reliability and criterion validity |
| UK | Cleland et al. 2014 [16] | 101 adults; aged 44 ± 14 years; 54% male | Wore AG for seven days and completed GPAQ on Day 7; Repeated for a random sub-sample at three to six months later. | Wilcoxon-signed rank tests for differences in measures; Spearman’s rho coefficient for criterion validity and extent of change. |
| US | Gorzelitz et al. 2018 [41] | 347 adults; aged 50.7 ± 16.9 years; 46.7% male | Wore AG for seven days; GPAQ face-to-face interviews self-reported data. | MVPA data measured by both GPAQ and AG; MVPA converted into METs. |
| Herrmann et al. 2013 [42] | Study 1: 69 adults; aged 43.1 ± 11.4 years; 82.6% female; Study 2: 16 adults; aged 40.2 ± 12.6 years; 50% female | First study for long-term test–retest reliability with three moths apart, completed GPAQ and worn ActiGraph GT1M accelerometer for seven days; Second study for short-term test–retest reliability with 10 days apart. | ICC for reliability; weighted Cohen’s K and percent agreement for testing validity with categorical scores (IPAQ vs. GPAQ); Spearman’s rho for validity with numerical variables. | |
| Hoos et al. 2012 [43] | 72 Latinas; aged 43.01 ± 9.05 years; 58% female | Worn accelerometer for seven days at the baseline and six months later; GPAQ data collected at the same time. | GPAQ’s sensitivity to intervention change using Spearman’s rho for concurrent validity. | |
| Metcalf et al. 2018 [20] | 108 residents; aged 49.4 years (range: 19.8–68.7); 68.5% female | Seven-day wearing AG followed by a telephone interview of GPAQ. | Multivariable linear regression models using functions of the GPAQ data to predict AG measured physical activity and sedentary behavior. | |
| Vietnam | Thuy et al. 2010 [22] | 251 adults; aged 25–64 years; 50.6% female | GPAQ and IPAQ were administered face-to-face, then wore a pedometer and complete PA log for seven consecutive days. | Reliability of GPAQ and IPAQ for groups; Concurrent validity was assessed from the correlations between pedometer steps per day and IPAQ. |
| Trinh et al. 2009 [12] | 169 adults; aged 25–64 years; 48.5% male | GPAQ was administered twice in the dry and wet season two weeks apart, respectively; wore the accelerometer twice for seven days during the week before the first and last GPAQ administration. | Spearman’s rho for the repeatability of the GPAQ, weighted Cohen’s Kappa for reliability; Spearman’s rho for the criterion validity of the GPAQ. | |
| Bangladesh, Brazil, China, Ethiopia, India, Indonesia, Japan, Portugal, and South Africa | Bull et al. 2009 [1] | 2657 adults from nine countries; aged 18–75 years; 61.3% male | Ten projects were initiated in 2002–2003 through WHO headquarters and regional offices and other known networks. | Test–retest reliability of GPAQ for categorical variables using Cohen’s Kappa and Spearman’s rho for continuous variables; Concurrent validity with IPAQ and pedometer/accelerometer data using Spearman’s rho. |
| Belgium, Spain, UK | Laeremans et al. 2017 [44] | 122 adults; aged 35 ± 10 years; 45% males | Seven-day wearing SenseWear armband and complete GPAQ online on the final day; adjusted GPAQ to capture information on walking, cycling and e-biking trips separately for the travel to and from work subscale; three trials for the same data collection. | Reliability: The changes in the difference between two methods over three trials; energy expenditure and minutes spent in MVPA, MPA, VPA and sedentary behaviors; Validity: Wilcoxon signed rank-sum test, Spearman correlation coefficients, mixed-effects regression models and Bland–Altman plots. |
| Assessment Questions | Article by Author | ||||||
|---|---|---|---|---|---|---|---|
| Aguilar-Farias et al. 2017 [19] | Alkahtani 2016 [38] | Bull et al. 2009 [1] | Chu et al. 2015 [18] | Chu et al. 2018 [7] | Cleland et al. 2014 [16] | Doyle et al. 2019 [48] | |
| 1. Was the research question or objective in this paper clearly stated? | 3 | 3 | 3 | 3 | 3 | 3 | 3 |
| 2. Was the study population clearly specified and defined? | 3 | 3 | 2 | 2 | 3 | 2 | 2 |
| 3. Was the participation rate of eligible persons at least 50%? | 3 | 3 | 3 | 3 | 3 | 3 | 2 |
| 4. Were all the subjects selected or recruited from the same or similar populations (including the same time period)? Were inclusion and exclusion criteria for being in the study prespecified and applied uniformly to all participants? | 2 | 2 | 1 | 2 | 3 | 2 | 2 |
| 5. Was a sample size justification, power description, or variance and effect estimates provided? | 1 | 3 | 1 | 3 | 3 | 1 | 1 |
| 6. For the analyses in this paper, was the exposure(s) of interest measured prior to the outcome(s) being measured? | 3 | 3 | 3 | 3 | 3 | 3 | 3 |
| 7. Was the timeframe sufficient so that one could reasonably expect to see an association between exposure and outcome if it existed? | 3 | 3 | 3 | 3 | 3 | 3 | 2 |
| 8. For exposures that can vary in amount or level, did the study examine different levels of the exposure as related to the outcome (e.g., categories of exposure, or exposure measured as a continuous variable)? | 3 | 3 | 3 | 3 | 3 | 3 | 3 |
| 9. Were the exposure measures (independent variables) clearly defined, valid, reliable, and implemented consistently across all study participants? | 3 | 3 | 3 | 3 | 3 | 2.5 | 2.5 |
| 10. Was the exposure(s) assessed more than once over time? | 1 | 3 | 3 | 2.5 | 3 | 3 | 2 |
| 11. Were the outcome measures (dependent variables) clearly defined, valid, reliable, and implemented consistently across all study participants? | 2.5 | 3 | 3 | 3 | 3 | 3 | 3 |
| 12. Were the outcome assessors blinded to the exposure status of participants? | 3 | 3 | 3 | 3 | 3 | 3 | 3 |
| 13. Were key potential confounding variables measured and adjusted statistically for their impact on the relationship between exposure(s) and outcome(s)? | 2.5 | 3 | 3 | 3 | 3 | 2 | 1.5 |
| Average score | 2.5 | 2.9 | 2.6 | 2.8 | 3 | 2.6 | 2.3 |
| Gorzelitz et al. 2018 [41] | Herrmann et al. 2013 [42] | Hoos et al. 2012 [43] | Hu et al. 2015 [11] | Lee et al. 2019 [46] | Lingesh et al. 2016 [9] | Laeremans et al. 2017 [44] | |
| 1. Was the research question or objective in this paper clearly stated? | 3 | 3 | 3 | 3 | 3 | 3 | 3 |
| 2. Was the study population clearly specified and defined? | 3 | 2 | 3 | 3 | 2 | 3 | 3 |
| 3. Was the participation rate of eligible persons at least 50%? | 3 | 1 | 3 | 3 | 3 | 3 | 3 |
| 4. Were all the subjects selected or recruited from the same or similar populations (including the same time period)? Were inclusion and exclusion criteria for being in the study prespecified and applied uniformly to all participants? | 3 | 2 | 3 | 3 | 2 | 2 | 2 |
| 5. Was a sample size justification, power description, or variance and effect estimates provided? | 2 | 1 | 3 | 1 | 1 | 1.5 | 1 |
| 6. For the analyses in this paper, was the exposure(s) of interest measured prior to the outcome(s) being measured? | 3 | 2 | 3 | 3 | 3 | 3 | 3 |
| 7. Was the timeframe sufficient so that one could reasonably expect to see an association between exposure and outcome if it existed? | 3 | 3 | 3 | 3 | 3 | 3 | 3 |
| 8. For exposures that can vary in amount or level, did the study examine different levels of the exposure as related to the outcome (e.g., categories of exposure, or exposure measured as a continuous variable)? | 3 | 2 | 3 | 3 | 3 | 2 | 3 |
| 9. Were the exposure measures (independent variables) clearly defined, valid, reliable, and implemented consistently across all study participants? | 3 | 3 | 3 | 3 | 3 | 2 | 3 |
| 10. Was the exposure(s) assessed more than once over time? | 3 | 1.5 | 3 | 3 | 3 | 1 | 3 |
| 11. Were the outcome measures (dependent variables) clearly defined, valid, reliable, and implemented consistently across all study participants? | 3 | 3 | 3 | 3 | 3 | 2 | 3 |
| 12. Were the outcome assessors blinded to the exposure status of participants? | 3 | 3 | 3 | 3 | 3 | 3 | 3 |
| 13. Were key potential confounding variables measured and adjusted statistically for their impact on the relationship between exposure(s) and outcome(s)? | 3 | 1.5 | 3 | 3 | 3 | 3 | 3 |
| Average score | 2.8 | 2.2 | 3 | 2.8 | 2.7 | 2.4 | 2.8 |
| Mathews et al. 2016 [45] | Metcalf et al. 2018 [20] | Misra et al. 2014 [36] | Mumu et al. 2017 [34] | Rivière et al. 2018 [35] | Ruiz-Casado et al. 2016 [40] | Sitthipornvorakul et al. 2014 [32] | |
| 1. Was the research question or objective in this paper clearly stated? | 3 | 3 | 3 | 3 | 3 | 3 | 3 |
| 2. Was the study population clearly specified and defined? | 2 | 3 | 1 | 3 | 3 | 3 | 2 |
| 3. Was the participation rate of eligible persons at least 50%? | 2 | 3 | 3 | 3 | 3 | 3 | 1 |
| 4. Were all the subjects selected or recruited from the same or similar populations (including the same time period)? Were inclusion and exclusion criteria for being in the study prespecified and applied uniformly to all participants? | 1 | 3 | 1 | 2 | 2 | 3 | 3 |
| 5. Was a sample size justification, power description, or variance and effect estimates provided? | 1 | 1 | 1 | 1 | 1 | 1 | 1 |
| 6. For the analyses in this paper, was the exposure(s) of interest measured prior to the outcome(s) being measured? | 1 | 3 | 3 | 3 | 3 | 3 | 3 |
| 7. Was the timeframe sufficient so that one could reasonably expect to see an association between exposure and outcome if it existed? | 2 | 3 | 3 | 3 | 3 | 1.5 | 1 |
| 8. For exposures that can vary in amount or level, did the study examine different levels of the exposure as related to the outcome (e.g., categories of exposure, or exposure measured as a continuous variable)? | 2 | 3 | 2 | 3 | 3 | 3 | 1.5 |
| 9. Were the exposure measures (independent variables) clearly defined, valid, reliable, and implemented consistently across all study participants? | 2 | 3 | 3 | 3 | 3 | 3 | 2 |
| 10. Was the exposure(s) assessed more than once over time? | 1 | 3 | 3 | 1 | 3 | 1 | 2 |
| 11. Were the outcome measures (dependent variables) clearly defined, valid, reliable, and implemented consistently across all study participants? | 2.5 | 3 | 2.5 | 3 | 3 | 3 | 3 |
| 12. Were the outcome assessors blinded to the exposure status of participants? | 2 | 3 | 3 | 3 | 3 | 3 | 3 |
| 13. Were key potential confounding variables measured and adjusted statistically for their impact on the relationship between exposure(s) and outcome(s)? | 2 | 3 | 3 | 3 | 3 | 3 | 1 |
| Average score | 1.8 | 2.8 | 2.4 | 2.6 | 2.8 | 2.6 | 2.0 |
| Soo et al. 2015 [37] | Thuy et al. 2010 [22] | Trinh et al. 2009 [12] | Wanner et al. 2017 [47] | Watson et al. 2017 [39] | - | - | |
| 1. Was the research question or objective in this paper clearly stated? | 3 | 3 | 3 | 3 | 3 | ||
| 2. Was the study population clearly specified and defined? | 3 | 2 | 3 | 3 | 3 | ||
| 3. Was the participation rate of eligible persons at least 50%? | 3 | 3 | 3 | 3 | 3 | ||
| 4. Were all the subjects selected or recruited from the same or similar populations (including the same time period)? Were inclusion and exclusion criteria for being in the study prespecified and applied uniformly to all participants? | 3 | 2 | 2 | 3 | 3 | ||
| 5. Was a sample size justification, power description, or variance and effect estimates provided? | 2 | 1 | 1 | 2 | 2.5 | ||
| 6. For the analyses in this paper, was the exposure(s) of interest measured prior to the outcome(s) being measured? | 3 | 3 | 3 | 3 | 3 | ||
| 7. Was the timeframe sufficient so that one could reasonably expect to see an association between exposure and outcome if it existed? | 3 | 3 | 3 | 3 | 3 | ||
| 8. For exposures that can vary in amount or level, did the study examine different levels of the exposure as related to the outcome (e.g., categories of exposure, or exposure measured as a continuous variable)? | 3 | 3 | 3 | 3 | 3 | ||
| 9. Were the exposure measures (independent variables) clearly defined, valid, reliable, and implemented consistently across all study participants? | 3 | 2 | 3 | 3 | 3 | ||
| 10. Was the exposure(s) assessed more than once over time? | 3 | 3 | 3 | 3 | 3 | ||
| 11. Were the outcome measures (dependent variables) clearly defined, valid, reliable, and implemented consistently across all study participants? | 3 | 2.5 | 3 | 3 | 2 | ||
| 12. Were the outcome assessors blinded to the exposure status of participants? | 3 | 3 | 3 | 3 | 3 | ||
| 13. Were key potential confounding variables measured and adjusted statistically for their impact on the relationship between exposure(s) and outcome(s)? | 3 | 3 | 3 | 2 | 3 | ||
| Average score | 2.9 | 2.6 | 2.8 | 2.8 | 2.8 | ||
| Country | Studies | Methodological Weaknesses |
|---|---|---|
| Bangkok (Thailand) | Sitthipornvorakul et al. 2014 [32] | The Yamax Digiwalker CW-700 pedometer was removed when immersing the body in water; participants who had four instead of seven daily measurements were also included in the study; PA intensities were classified using pedometer steps; there is a lack of information on whether the pedometer data were collected during a typical week when GPAQ data were measured. |
| Bangladesh | Mumu et al. 2017 [34] | Water-based activities were excluded, resulting in underestimates of PA by the accelerometer; participants who wore the accelerometer for ≥3 days were also included; there is a lack of information on whether the accelerometer data were collected during a typical week when GPAQ data were measured. |
| Chile | Aguilar-Farias et al. 2017 [19] | The accelerometer data were not measured during a typical week when GPAQ data were measured. |
| China | Hu et al. 2015 [11] | Self-reported PA log data were used as the criterion-referenced standards for GPAQ data; there is a lack of information on whether the accelerometer data were collected during a typical week when GPAQ data were measured. |
| France | Rivière et al. 2018 [35] | Less than 100 participants were recruited. |
| India | Misra et al. 2014 [36] | Pedometers was used as the criterion-referenced standard. |
| Mathews et al. 2016 [45] | Less than 100 participants were recruited (n = 47 women); total PA was not measured; there is a lack of information on whether the accelerometer data were collected during a typical week when GPAQ data were measured | |
| Korea | Lee et al. 2019 [46] | There is a lack of information on whether the accelerometer data were collected during a typical week when GPAQ data were measured |
| Malaysia | Lingesh et al. 2016 [9] | Less than 100 participants were recruited (n = 43 females only); there is a lack of information on whether the accelerometer data were collected during a typical week when GPAQ data were measured. |
| Soo et al. 2015 [37] | Pedometers were used as the criterion-referenced standard; average pedometer steps were compared to GPAQ min. data; there is a lack of information on whether the pedometer data were collected during a typical week when GPAQ data were measured. | |
| Saudi Arabia | Alkahtani, 2016 [38] | Only 62 male participants were recruited; those who wore an accelerometer for ≥4 days were included; there is a lack of information on whether the accelerometer data were collected during a typical week when GPAQ data were measured. |
| Singapore | Chu et al. 2015 [10] | There is a lack of information on whether the accelerometer data were collected during a typical week when GPAQ data were measured. |
| Chu et al. 2018 [7] | Only 78 participants were involved in the study with 69.0% of females; there is a lack of information on whether the accelerometer data were collected during a typical week when GPAQ data were measured. | |
| South Africa | Watson et al. 2017 [39] | 95 pregnant women were recruited; there is a lack of information on whether the accelerometer data were collected during a typical week when GPAQ data were measured. |
| Spain | Ruiz-Casado et al. 2016 [40] | There is a lack of information on whether the accelerometer data were collected during a typical week when GPAQ data were measured. |
| Switzerland | Wanner et al. 2017 [47] | There is a lack of information on whether the accelerometer data were collected during a typical week when GPAQ data were measured. |
| UAE | Doyle et al. 2019 [48] | Less than 100 participants were recruited (n = 93 for reliability study, n = 43 for concurrent validity study); there is a lack of information on whether the accelerometer data were collected during a typical week when GPAQ data were measured. |
| UK | Cleland et al. 2014 [16] | There is a lack of information on whether the accelerometer data were collected during a typical week when GPAQ data were measured. |
| US | Gorzelitz et al. 2018 [41] | There is a lack of information on whether the accelerometer data were collected during a typical week when GPAQ data were measured. |
| Herrmann et al. 2013 [42] | Only 68 participants were included; there is a lack of information on whether the accelerometer data were collected during a typical week when GPAQ data were measured. | |
| Hoos et al. 2012 [43] | Less than 100 participants (n = 72) were included; there is a lack of information on whether the accelerometer data were collected during a typical week when GPAQ data were measured. | |
| Metclif et al. 2018 [20] | There is a lack of information on whether the accelerometer data were collected during a typical week when GPAQ data were measured. | |
| Vietnam | Thuy et al. 2010 [22] | Accelerometer data were not collected during a typical week. |
| Trinh et al. 2009 [12] | Accelerometer data were not collected during a typical week. | |
| Bangladesh, Brazil, China, Ethiopia, India, Indonesia, Japan, Portugal, and South Africa | Bull et al. 2009 [1] | Accelerometer or pedometer data were not collected during a typical week. |
| Belgium, Spain, UK | Laeremans et al. 2017 [44] | Accelerometer data were not collected during a typical week. |
| Country (1st Author, Year) | Sample Size | GPAQ Measures | ||||||
|---|---|---|---|---|---|---|---|---|
| Sitting | MPA | VPA | MVPA | Work | Transport | Leisure | ||
| Bangladesh (Mumu et al. 2017 [34]) | 162 healthy adults, age = 35 ± 69 years | r = 0.23 ** | r = 0.18 *, 0.24 * (CPM), 0.28 ** (step) | |||||
| 65 from urban | r = 0.07 | r= 0.46 **, 0.55 ** (CPM), 0.63 ** (step) | r = 0.38 **, 0.50 ** (CPM), 0.55 ** (step) | r = 0.49 **, 0.46 ** (CPM), 0.52 ** (step) | r = 0.26 *, 0.29 * (CPM), 0.41 ** (step) | |||
| 97 from rural areas | r = 0.38 ** | r = 0.0001, −0.01 (CPM), 0.05 (step) | r = −0.03, 0.02 (CPM), 0.07 (step) | r = −0.20 *, −0.23 * (CPM), −0.13 (step) | r = 0.02, −0.05 (CPM), −0.12 (step) | |||
| 70 men | r = −0.10, 0.04 (CPM), 0.05 (step) | |||||||
| 85 women | r = 0.42 **, 0.46 ** (CPM), 0.49 ** (step) | |||||||
| 93 (≤35 years) | r = 0.31 *, 0.32 ** (CPM), 0.34 ** (step) | |||||||
| 62 (>35 years) | r = −0.03, 0.10 (CPM), 0.19 (step) | |||||||
| 30 illiterates | r = 0.27, 0.35 (CPM), 0.22 (step) | |||||||
| 37 primary school | r = 0.23, 0.20 (CPM), 0.38 * (step) | |||||||
| 61 high school | r = −0.01, 0.01 (CPM), 05 (step) | |||||||
| Chile (Aguilar-Farias et al. 2017 [19]) | 217, age = 43.77 ± 15.75 years | r = 0.23 ***(1-min), 0.26 *** (5-min), 0.26 *** (10-min); LoA = −768.9 to 181.2 (1-min), −200.4 to 137.1 (5-min), −539.5 to 387.3 (10-min); Poor in classifying sedentary behavior into tertiels for 1-, 5- and 10-min bouts: Agreement = 43.5%, 46.0%, 42.2%; k = 0.18, 0.19, 0.13; and quartiles: Agreement = 31.3%, 32.7%, 31.3%; k = 0.08, 0.10, 0.08 | ||||||
| ≥ 45 and < 45 years (n: N/A) | r = 0.38 *** (≥45); 0.10 (<45) | |||||||
| 93 men and 124 women | r = 0.23 * (men); 0.21 * (women) | |||||||
| 66 (≥12 years of education) and 151(<12 years) | r = 0.13 (≥12 years); 0.27 * (<12 years) | |||||||
| Mostly standing work and balanced standing and sitting work (n not provided) | r = 0.26 *** (balanced standing and sitting); −0.02 (mostly standing) | |||||||
| France (Rivière et al. 2018 [35]) | 92 students and staff in a medical school, age >18 years | r = 0.42 **; LoA = 90.1 to 412.3 min/week | r = 0.10 | r = 0.38 **; LoA = 286.5 to 601.3 min/week | ||||
| Korea (Lee et al. 2019 [46]) | 199 adults, 82 males and 117 females | r = 0.18 ** | r = 0.33 ** | r = 0.10 | r = 0.34 ** | |||
| 170 adults age 19–64 | r = 0.19 * | r = 0.37 ** | r = 0.09 | r = 0.36 ** | ||||
| 29 elders age >64 | r = 0.08 | r = 0.33 | r = −0.02 * | r = 0.38 * | ||||
| India (Misra et al. 2014 [36]) | 116 males and 118 females; age 15–65 years; | r = 0.29 ** | r = 0.36 * (step); r = 0.31 * (male, step), 0.40 * (female, step) | |||||
| India (Mathews et al. 2016 [45]) | 47 women, age 18–64 years | r = 0.69 (non-bouted), 0.60 (10-min bouts); ICC = 0.78 (non-bouted), 0.55 (10-min bouts) | ||||||
| Malaysia (Lingesh et al. 2016 [9]) | 43 female nurses aged 24 to 55 years (mean: 44.48 ± 8.38) | r = −0.11 | ||||||
| Saudi Arabia (Alkahtani, 2016 [38]) | 62 male college students, aged 19–21 years old | r = 0.08 | r = 0.24 | r = 0.32 ** | r = 0.32 * | |||
| Singapore (Chu et al. 2015 [10]) | 110 working adults and students | r = 0.36 *** (total), 0.20 (10-min bouts); LoA = −115.0 to 121.0 (total); −88.7 to 148.1 (10-min bouts) | r = 0.45 *** (total), 0.39 *** (10-min bouts); LoA = −46.2 to 99.9 (total), 46.5 to 102.1 (10-min bouts) (10-min bouts) | r = 0.39 *** (total), 0.37 *** (10-min bouts); LoA = −138.7 to 210.4 (total), −84.8 to 199.8 (10-min bouts) | ||||
| 52 self-administrated | r = 0.28 * (total), 0.29 * (10-min bouts) | r = 0.35 * (total), 0.38 ** (10-min bouts) | r = 0.32 * (total), 0.30 * (10-min bouts) | |||||
| 56 interview-administrated | r = 0.44 *** (total), 0.42 *** (10-min bouts) | r = 0.43 *** (total), 0.52 *** (10-min bouts) | r = 0.44 *** (total), 0.46 *** (10-min bouts) | |||||
| Singapore (Chu et al. 2018 [7]) | 84 medicine faculty and staff, aged 21–65 years | r = 0.28 * | 84 medicine faculty and staff, aged 21–65 years | |||||
| 37 self-administrated and 41 interview-administrated | r = 0.46 * (self), 0.12 (interview) | |||||||
| South Africa (Watson et al. 2017 [39]) | 95 pregnant women at 14–18 and 29–33 weeks’ gestation, age = 29.5 ± 5.7 years | ICC = 0.08 (14–18 weeks), 0.01 (29–33 weeks); poor agreement in categorizing active/inactive participants, k = 0.11 (14–18 weeks), −0.02 (29–33 weeks) | ICC = 0.05 (14–18 weeks), −0.05 (29–33 weeks); poor agreement in classifying PA to quartiles, k = 0.09 (14–18 weeks), −0.03 (29–33 weeks) | |||||
| Spain (Ruiz-Casado et al. 2016 [40]) | 204 cancer survivors aged 18–79 years | r = 0.17 *; LoA = −4400 to 425 | r = −0.03; LoA = −911 to 1395 | r = 0.73 ***; LoA = −60 to 75 | ||||
| UAE (Doyle et al. 2019 [48]) | 43 Arabic speaking university students | r = −0.02 | r = 0.23 | |||||
| UK (Cleland et al. 2014 [16]) | 95 participants, age = 44 ± 14 years; 44 females, 51 males | r = 0.187 ***; low extent of change over 3–6 months, r = −0.024 *; r = 0.378 * (women), −0.053 (men) | r = 0.484 ***; moderate extent of change over 3–6 months, r = 0.52 *; r = 0.434 * (women), 0.496 ** (men) | |||||
| Switzerland (Wanner et al., 2017 [47]) | 354 (physical activity) and 366 (sitting), age 18–83 years | r = 0.47 *** | r = 0.16 ** | r = 0.46 *** | r = 0.22 (CPM) ***, 0.25 *** (steps); 0.11 * (min/week) | r = −0.13 * | r = 0.15 ** | |
| USA (Gorzelitz et al. 2018 [41]) | 347 (age >18), 162 (46.7%) male | MVPA Discordance between GAPQ and accelerometer data varied by sex, education level and marital status | ||||||
| USA (Herrmann et al. 2013 [42]) | 54, age = 43.1 ± 11.4 years) | r = 0.12 | r = 0.36 ** | r = 0.39 ** | r = 0.26 * | |||
| USA (Hoos et al. 2012 [43]) Vietnam (Trinh et al. 2009 [12]) | 72 Latinas, aged 18–65 years (mean = 43.01 ± 9.05 years) | r = 0.28 (pre), 0.25 (post) | r = 0.04 (pre), 0.04 (post) | r = 0.42 ** (pre), 0.24 (post) | r = 0.14 (pre), −0.06 (post) | r = −0.17 (pre, MVPA), −0.15 (pre, MPA), 0.03 (pre, VPA): r = −0.21 (post MVPA), −0.10 (post, MPA), −0.19 (post, VPA) | r = 0.24 ** (pre, MPA); r = 0.04 (post, MPA) | |
| 169 aged 25–64 years (44.7 ± 11.1 years) | r = 0.23 (dry season), 0.32(wet season) | r = 0.18 (dry), 0.10 (wet) | r = −0.04 (dry), 0.03 (wet) | r = 0.20 (dry, MVPA), 0.09 (wet, MVPA); r = 0.34 (dry, total counts), 0.20 (wet, total counts) | ||||
| Belgium, Spain, UK (Laeremans et al. 2017 [44]) | 122 adults (41 Belgium, 41 Spain, 40 UK); 45% males, age: 35 ± 10 years | r = 0.12 (0.09–0.24 **) | r = 0.33 (0.11−0.34 **) | r = 0.64 (0.59 ***–0.69 **) | r = 0.65 (0.55 ***–0.64 ***) | |||
| Country (1st Author, Year) | Sample Size | GPAQ Measures | ||
|---|---|---|---|---|
| Sitting Time | Steps/Day | MVPA | ||
| Bangkok (Sitthipornvorakul et al. 2014 [32]) | 320 office workers | r = 0.08 | ||
| By age: 77 (20–29 years), 115 (30–39 years), and 88 (over 40 years) | r = 0.27 * (20–29 years), −0.01 (30–39 years), 0.09 (40+ years) a | |||
| Malaysia (Soo et al. 2015 [37]) | 100 aged 20–58 years | r = 0.265 * | ||
| Vietnam (Thuy et al. 2010 [22]) | 120 men and 118 women; by work pattern: 146 with stable and 92 with unstable work patterns; | Men with table job: r = 0.42, unstable job: r = 0.22; Women with stable job: r = 0.33, unstable job: r = 0.16 | ||
| Bangladesh, Brazil, China, Ethiopia, India, Indonesia, Japan, Portugal, and South Africa (Bull et al. 2009 [1]) | 2657 male and female adults from 9 countries; n = 1951 for criterion validity | r = −0.20 **, ranging from 0 (Japan) to −0.37 (Taiwan, China) | r = 0.31 ** (excluding China, Brazil, Portugal, South Africa), ranging from 0.06 (Bangladesh) to 0.35 (India) | |
| 980 males and 971 females; 1077 with fewer than 13-year education and 298 with more than 13-year education | Similar criterion validity between genders and between low and high education level. | |||
| 976 from urban areas and 819 from rural areas | r = 0.23(urban), 0.43(rural) | |||
| 406 underweight, 932 healthy weight, and 262 overweight/obese | r = 0.52 (underweight), 0.34 (healthy BMI), 0.08 (overweight/obese) | |||
| Country (1st Author, Year) | Sample Size | Criterion Measures | GPAQ Measures | |||
|---|---|---|---|---|---|---|
| Sitting | MPA | VPA | MVPA | |||
| China (Hu et al. 2015 [11]) | 205 aged 30–70 years, 38.54% of males | PA log | r = 0.52 ** | r = 0.47 **; 0.43 ** (MPA excluding walking) | r = 0.41 ** | r = 0.51 ** |
| India (Misra et al. 2014 [36]) | 262 aged 15–65 years, 116 males (49.6%) | IPAQ | r = 0.999 *** | r = 0.894 *** | r = 0.934 *** | r = 0.939 *** |
| Malaysia (Lingesh et al. 2016 [9]) | 43 female nurses aged 24 to 55 years (44.48 ± 8.38 years) | PA Log | r = −0.015 | |||
| IPAQ | r = 0.214 | |||||
| Malaysia (Soo et al. 2015 [37]) | 100 aged 20–58 years | IPAQ | r = 0.447 *** | r = 0.459 *** | r = 0.466 *** | r = 0.309 ** |
| Vietnam (Thuy et al. 2010 [22]) | 251 (120 men and 118 women) | PA Log | r = 0.49 (men), −0.05 (women) | |||
| IPAQ | r = 0.39 (men), 0.18 (women) | |||||
| By work pattern: 146 with stable and 92 with unstable work patterns | PA Log | r = 0.31 (stable) | ||||
| IPAQ | r = 0.32 (stable) | |||||
| Bangladesh, Brazil, China, Ethiopia, India, Indonesia, Japan, Portugal, and South Africa (Bull et al. 2009 [1]) | 2657 male and female adults from nine countries; n = 1951 for criterion validity | IPAQ | r = 0.65 **; poor agreement in categorizing inactive time, agreement = 85.2%, k = 0.22 | r = 0.45 ** | r = 0.57 ** | r = 0.54 ** |
| Country (Author, Year) | Sample Size | Days Apart | Reliability Results | ||||||
|---|---|---|---|---|---|---|---|---|---|
| Overall PA | MET | Work | Transport | Recreation | Sitting | ||||
| China (Hu et al. 2015 [11]) | 205 participants, 38.54% of males, aged 30–70 years | 9 | r = 0.81 | r = 0.80 | |||||
| France (Rivière et al. 2018 [35]) | 92 students and staff in a medical school, age >18 | 7 | r = 0.58 | r = 0.67 | Vigorous: r = 0.94; moderate: r = 0.37 | r = 0.80 | |||
| India (Misra et al. 2014 [36]) | 262 subjects, 116 (49.6% male), age 15–65 years | 3 | r = 0.67 | r = 0.68 | Vigorous: r = 0.81; moderate: r = 0.37 | r = 0.72 | r = 0.43 | ||
| Korea (Lee et al. 2019 [46]) | 115 adults, aged 19–65 years, 48% male | 7 | r = 0.47 | r = 0.27–0.47 | r = 0.53 −0.70 | r = 0.65 | |||
| Malaysia (Soo et al. 2015 [37]) | 100 adults aged 20–58 years old | 14 | z = −0.450, p = 0.653 | Vigorous: z = −0.093, p = 0.926; moderate: z = −0.733, p = 0.464 | Vigorous-intensity: z = 0.445, p = 0.656; moderate- intensity: z = −3.515, p < 0.001 | z = −3.272, p = 0.001 | |||
| Saudi Arabia (Alkahtani, 2016 [38]) | 62 male college students, aged 19–21 years old | 14 | Vigorous: r = 0.78; Moderate: r = 0.44 | r = 0.70 | |||||
| Singapore (Chu et al. 2015 [18]) | 110 working adults and students | 7 | MVPA: r = 0.54 | Vigorous: r = 0.59; Moderate: r = 0.37 | r = 0.47 | Vigorous: r = 0.73; moderate: r = 0.60 | |||
| Singapore (Chu et al. 2018 [7]) | 84 medicine faculty and staff at a university; aged 21–65 years | 7 | Self-administered group | MVPA: r = 0.63 | Moderate: r = 0. 55; vigorous: r = 0.71 | r = 0.47 | Moderate: r = 0.46; vigorous: r = 0.86 | ||
| Interview-administered group | MVPA: r = 0.61 | Moderate: r = 0.41 | r = 0.73 | Moderate: r = 0.59; vigorous: r = 0.82 | |||||
| All | MVPA: r = 0.63 | Moderate: r = 0.48; vigorous: r = 0.71 | r = 0.60 | Moderate: r = 0.53; vigorous: r = 0.83 | |||||
| UAE (Doyle et al. 2019 [48]) | 227 Arabic speaking university students, aged 18–32, 59.1% women | 7 | Moderate to vigorous: r = 0.78; Moderate: r = 0.73; Vigorous: r = 0.62 | r = 0.44 | |||||
| US (Herrmann et al. 2013 [42]) | Study 1: 69 and 54 adults three months apart; | Short term (10) | r = 0.89 | Moderate: r = 0.87 | r = 0.83 | Moderate: r = 0.96; vigorous: r = 0.90 | r = 0.92 | ||
| Study 2: 16 adults; aged 18–65 years | Long terms (3 months) | r = 0.82 | Moderate: r = 0.68; vigorous: r = 0.74 | r = 0.54 | Moderate: r = 0.53; vigorous: r = 0.74 | r = 0.83 | |||
| Vietnam (Thuy et al. 2010 [22]) | randomly selected 251 adults | 21 | Male | r = 0.32 | r = 0.28 | r = 0.18 | r = 0.20 | ||
| Female | r = 0.13 | r = 0.22 | r = 0.24 | r = 0.31 | |||||
| Vietnam (Trinh et al. 2009 [12]) | 169 adults aged 25–64 years | 14 | r = 0.69 | Moderate: r = 0.63; vigorous: r = 0.62 | Moderate: r = 0.64 | Moderate: r = 0.74; vigorous: r = 0.50 | r = 0.69 | ||
| Long term (two months) | r = 0.55 | Moderate: r = 0.47; vigorous: r = 0.68 | Moderate: r = 0.55 | Moderate: r = 0.32; vigorous: r = 0.37 | r = 0.50 | ||||
| Bangladesh, Brazil, China, Ethiopia, India, Indonesia, Japan, Portugal, and South Africa (Bull et al. 2009 [1]) | 2657 male and female adults from nine countries. | 3–7 | Bangladesh | Moderate: r = 0.57; vigorous: r = 0.72; total: r = 0.58 | r = 0.57 | Moderate: r = 0.31 | |||
| Shanghai, China | Moderate: r = 0.99; vigorous: r = 0.92; total: r = 0.99 | r = 0.98 | Moderate: r = 1.00; vigorous: r = 1.00; total: r = 1.00 | ||||||
| Taiwan, China | Moderate: r = 0.40; vigorous: r = 0.48; total: r = 0.53 | r = 0.54 | Moderate: r = 0.50; vigorous: r = 0.49; total: r = 0.52 | ||||||
| Ethiopia | Moderate: r = 0.50; vigorous: r = 0.64; total: r = 0.56 | r = 0.53 | Moderate: r = 0.52; vigorous: r = 0.46; total: r = 0.73 | ||||||
| Indonesia | Moderate: r = 0.78; vigorous: r = 0.68; total: r = 0.80 | r = 0.70 | Moderate: r = 0.45; vigorous: r = 0.61; total: r = 0.52 | ||||||
| Japan | Moderate: r = 0.85; vigorous: r = 0.88; total: r = 0.83 | r = 0.90 | Moderate: r = 0.83; vigorous: r = 0.89; total: r = 0.88 | ||||||
| South Africa | Moderate: r = 0.75; vigorous: r = 0.69; total: r = 0.76 | r = 0.75 | Moderate: r = 0.77; vigorous: r = 0.71; total: r = 0.71 | ||||||
© 2019 by the authors. Licensee MDPI, Basel, Switzerland. This article is an open access article distributed under the terms and conditions of the Creative Commons Attribution (CC BY) license (http://creativecommons.org/licenses/by/4.0/).
Share and Cite
Keating, X.D.; Zhou, K.; Liu, X.; Hodges, M.; Liu, J.; Guan, J.; Phelps, A.; Castro-Piñero, J. Reliability and Concurrent Validity of Global Physical Activity Questionnaire (GPAQ): A Systematic Review. Int. J. Environ. Res. Public Health 2019, 16, 4128. https://doi.org/10.3390/ijerph16214128
Keating XD, Zhou K, Liu X, Hodges M, Liu J, Guan J, Phelps A, Castro-Piñero J. Reliability and Concurrent Validity of Global Physical Activity Questionnaire (GPAQ): A Systematic Review. International Journal of Environmental Research and Public Health. 2019; 16(21):4128. https://doi.org/10.3390/ijerph16214128
Chicago/Turabian StyleKeating, Xiaofen D., Ke Zhou, Xiaolu Liu, Michael Hodges, Jingwen Liu, Jianmin Guan, Ashley Phelps, and Jose Castro-Piñero. 2019. "Reliability and Concurrent Validity of Global Physical Activity Questionnaire (GPAQ): A Systematic Review" International Journal of Environmental Research and Public Health 16, no. 21: 4128. https://doi.org/10.3390/ijerph16214128
APA StyleKeating, X. D., Zhou, K., Liu, X., Hodges, M., Liu, J., Guan, J., Phelps, A., & Castro-Piñero, J. (2019). Reliability and Concurrent Validity of Global Physical Activity Questionnaire (GPAQ): A Systematic Review. International Journal of Environmental Research and Public Health, 16(21), 4128. https://doi.org/10.3390/ijerph16214128