Article

Stable H-O Isotopic Composition and Water Quality Assessment of Surface Water and Groundwater: A Case Study in the Dabie Mountains, Central China

1
Institute of Earth Sciences, China University of Geosciences, Beijing 100083, China
2
Institute of Hydrogeology and Environmental Geology, Chinese Academy of Geological Sciences, Shijiazhuang 050061, China
*
Author to whom correspondence should be addressed.
Int. J. Environ. Res. Public Health 2019, 16(21), 4076; https://doi.org/10.3390/ijerph16214076
Submission received: 18 July 2019 / Revised: 16 October 2019 / Accepted: 18 October 2019 / Published: 23 October 2019

Abstract

:
In order to understand the water cycle and assess the water quality for irrigation purposes in the Upper Pi River Basin (UPRB), which is the northern slope of the Dabie Mountains, 68 surface water and groundwater samples were collected and analyzed for H-O isotopes and hydrochemistry during the high-flow season in 2017 and 2018. The results show that ranges of hydrogen and oxygen isotopic composition (δ2H: −68.8‰ to −40.8‰, δ18O: −10.05‰ to −5.05‰) are controlled by the medium latitude and high altitude of the UPRB. Among different types of water, the δ2H and δ18O values can be ordered as follows: reservoir water < spring water ≈ river water < pond water. The water of the upstream medium and small reservoir is enriched with lighter isotopes that is likely related to more exchange with rainwater and less residence time; however, large reservoirs are similar to the upstream river and spring in terms of the H-O isotopic composition. Hydro-chemical facies are dominated by the Ca-HCO3 type in the UPRB, which reflects fresh recharged water from rainfall, and few samples are of the Ca-Cl type that is caused by intensive evaporation. The water quality for irrigation purposes was also evaluated. According to the Wilcox diagram, United States Salinity Laboratory (USSL) diagram, magnesium hazard, and Kelly’s ratio, all water samples have been considered suitable for irrigation water.

Graphical Abstract

1. Introduction

In mountainous areas, climate change and human activities can have a thorough impact on the water cycle, such as increased precipitation, evapotranspiration, and the consumption of surface water and groundwater [1,2,3]. Furthermore, these changes in the meteoric water can influence biogeochemical cycles through water flow [4]. To better forecast potential changes in the climate and ecological system, an understanding of the hydrological behavior is required [5,6]. The Pi River originates in the Dabie Mountains, Central China, and the Upper Pi River basin (UPRB) frequently exhibits extreme precipitation owing to complex terrain and climate change [7]. Rainstorm-induced mountain flooding causes huge economic losses and threatens human life in this region. The main sources of the river water generally include recent precipitation and groundwater recharge [8]. However, catchment-based studies of surface water and groundwater in the UPRB are less numerous, despite the fact that it is significantly important for reducing the risk of flooding disasters and understanding the impacts of climate change on the water cycle. On the other hand, the Pi River is the main water source for a 7750 km2 irrigation area and about 13 million people [9], and four large reservoirs in the UPRB are important water conservancy facilities for ensuring that there is enough water for drinking, domestic, agricultural, and industrial purposes. Therefore, monitoring of the water quality in the UPRB is important.
Stable isotopes (δ2H, δ18O) in meteoric water are able to trace the water source and understand hydrological processes and the water cycle [10,11,12]. Variation in the stable isotopic composition of river water may be able to identify source water dynamics, because the isotopic composition of the river water is mainly connected to local precipitation [8,13], temperature [14], and snowmelt/groundwater recharge [15,16]. On the other hand, the stable isotopic composition of river water can reflect the important influence of anthropogenic processes like damming and water storage [17]. In order to improve understanding of the water cycle in terrestrial systems, δ2H and δ18O are monitored to analyze isoscapes (i.e., the spatial-temporal isotope distribution) across the world [18,19,20]. In the 1970s, the Global Network of Isotopes in Precipitation (GNIP), initiated by the International Atomic Energy Agency (IAEA) and the World Meteorological Organization (WMO), focused on an observation network of stable hydrogen and oxygen isotope data of precipitation [21]. In the 2000s, to complement the GNIP, IAEA launched the Global Network of Isotopes in Rivers (GNIR), which collects isotope data of surface water around the world [13]. On a local scale, seasonal isotopic patterns within river water can reflect changes in the mean elevation of a river’s source water [22]. The method of δ2H and δ18O based on the Rayleigh distillation equation and mass conservation is used to quantify the evaporation and recharging of a river [23]. Moreover, the deuterium excess calculation demonstrates that land use has an important impact on the hydrologic cycle in a watershed [24]. On the other hand, the temporal distribution of stable oxygen isotopes in the Changjiang river water indicates the time lag of river water responding to meteoric precipitation, and is the result of increasing trapping and water regulation effects of numerous dams [25]. These surveys have indeed proven the values of stable hydrogen and oxygen isotopes in hydrological studies. As a result, the stable H and O isotope technique is a potentially powerful tool for the monitoring of eco-hydrological systems [26].
To investigate the hydrological processes in the UPRB, including the precipitation, the interaction between surface water and groundwater, and the evaporation, we examine the spatial variation of the stable hydrogen and oxygen isotopic composition of surface water and groundwater in the high-flow season. Additionally, we assess the water quality for irrigation purposes based on the hydrochemistry of surface and groundwater in the UPRB. The results of this study are expected to provide more evidence on the water environment and quality assessment for irrigation purposes in the UPRB, which can present reasonable strategies for water management in the locality.

2. Materials and Methods

2.1. Background of the Study Area
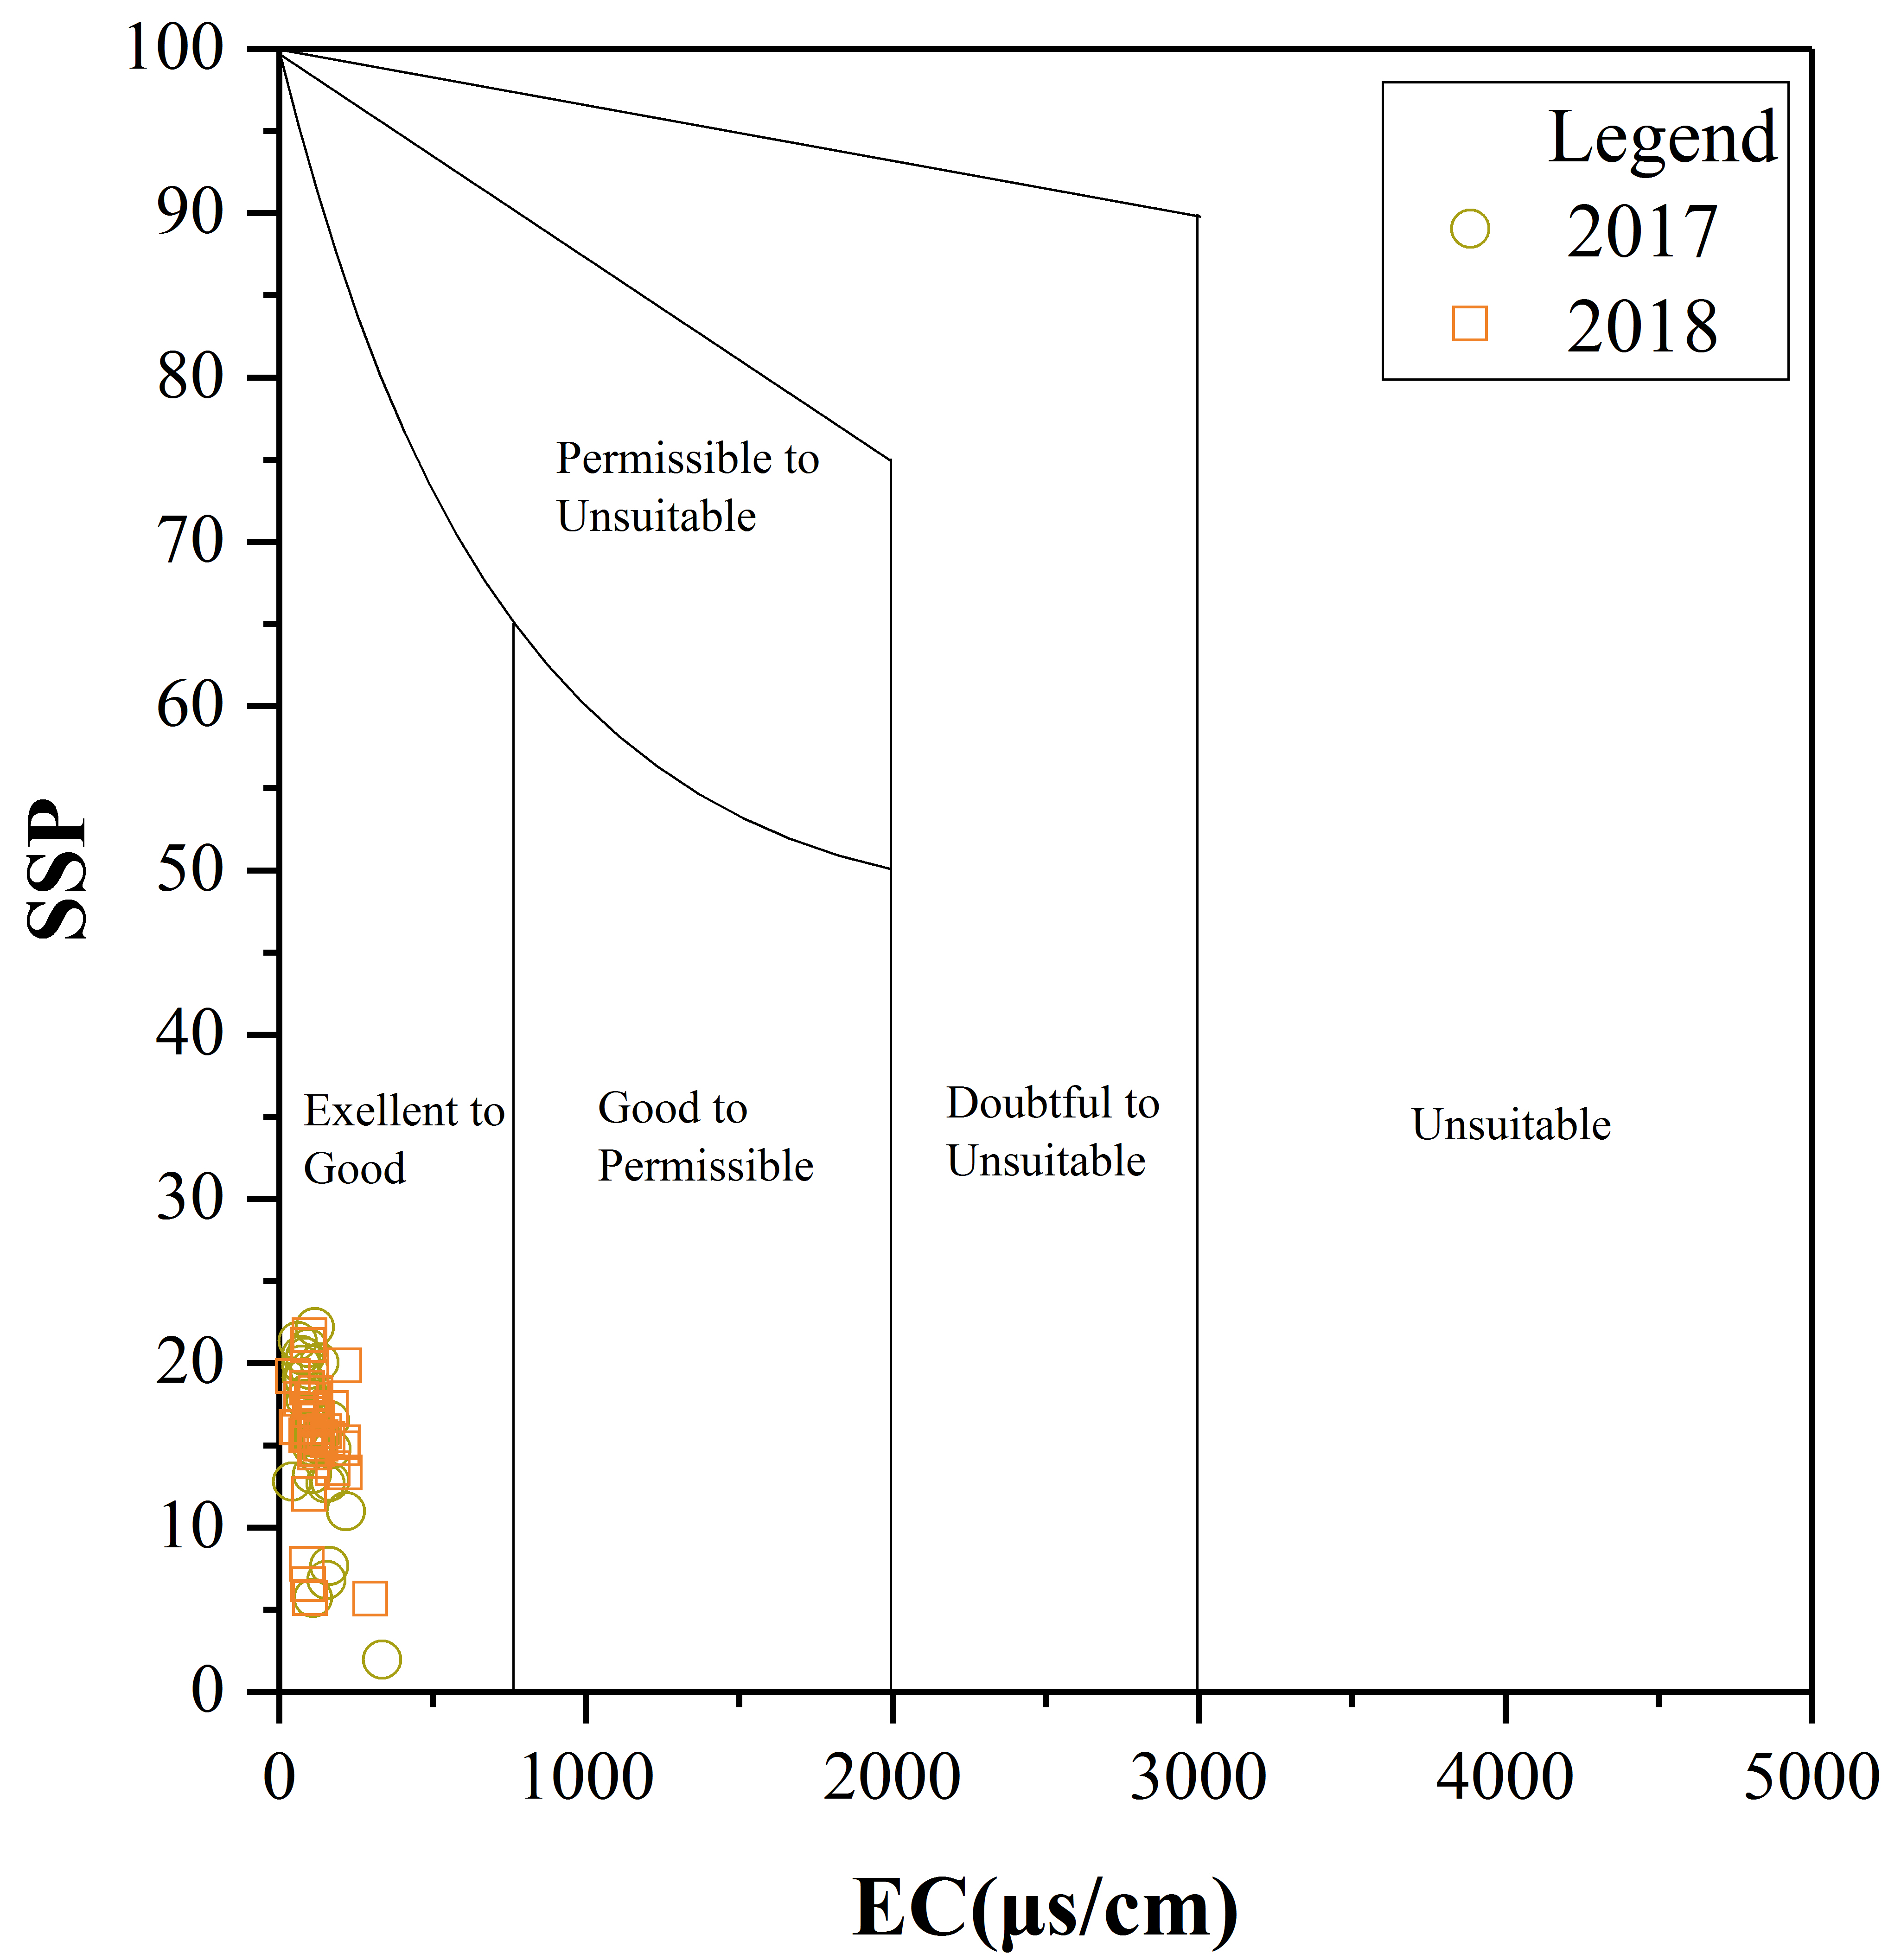
2.1.1. Location

The study area is situated in Anhui Province, Central China (115°66′~116°53′ E, 30°95′~31°65′ N), and covers a surface area of approximately 4350 km2 (Figure 1a). It is located on the northern slope of the Dabie Mountains, with a maximum altitude of 1750 m. The altitude is higher in the southwest and generally decreases northeastward. The main types of land uses are forest (65%), grassland (27%), farmland (6%), and water area (1%) [27]. Two rivers, the East Pi River and West Pi River, flow northeastward through the study area, and they are the headwaters of the Pi River, a southern branch of the Huaihe River (Figure 1b). During flood events, a peak discharge of up to 5600 m3/s has been recorded at the Hengpaitou hydrologic station [28], where the West Pi River and East Pi River join the main stream of the Pi River.

2.1.2. Climate

This region is located in the transitional zone between the abundant rainfall area of Southern China and the arid area of Northern China [7]. The predominant climate is semi-humid monsoon conditions. Coupled with undulating terrain and relatively high altitude, rainstorms and flooding events frequently occur in this area in the high-flow season (from June to October). From 1968 to 2018, the mean annual air temperature was 15.5 °C, and the mean minimum and maximum air temperature was 11.4 °C and 21.0 °C, respectively [29]. The annual rainfall is around 730–2010 mm, of which 67% occurs during the period from June to September [30].

2.1.3. Reservoirs

In the study area, there are four large reservoirs (storage capacity > 0.1 km3), which are an important water source for approximately 13 million people: Mozitan Reservoir, Bailianya Reservoir, Foziling Reservoir, and Xianghongdian Reservoir. Among them, Mozitan Reservoir, Bailianya Reservoir, and Foziling Reservoir are situated in the East Pi River, and Xianghongdian Reservoir is situated in the West Pi River. The construction of large reservoirs is conducted with the aim of providing multiple benefits, including a water supply and flood control, in the study area [31]. Besides, there are many small and middle reservoirs, such as the Banjiezhuizi Reservoir in the lower reaches of the East Pi River.

2.2. Sampling Processes

Two series of water were sampled in the high-flow season (October 2017 and September 2018, respectively). During each sampling period, 29 surface water samples and 5 groundwater samples were collected, including 17 river water samples, 9 reservoir water samples, 3 pond water samples, and 5 spring water samples (Figure 1b). The water sampled from the river, reservoir, and pond was generally taken from the bank at a sampling depth of ca. 50 cm. The groundwater was collected from creeks where mountain springs flow out. Before sampling in the field, the high density polyethylene (HDPE) bottles were cleaned using detergent, and were then totally soaked in deionized water for six hours and finally dried out in an electric oven. At the sampling sites, we used a multiparameter instrument (Pro Plus, YSI Inc./Xylem Inc., Yellow Springs, OH, USA) to determine the total dissolved solid (TDS) and electrical conductivity (EC), and we used GPS to record the longitude, latitude, and altitude. In the field, every water sample was filtered using a 0.22 μm cellulose acetate membrane syringe filter and transferred to a pre-cleaned PET (polyethylene terephthalate) bottle. Next, the sample bottle was sealed using Parafilm ® M film and stored in a refrigerator at about 4 °C.

2.3. Major Cations and Anions

Concentrations of major cations (Na+, K+, Ca2+, and Mg2+) were measured by ICP-OES (ICAP 6300, Thermo Scientific Inc., Rochester, NY, USA) with a precision of ±3% at the Institute of Hydrogeology and Environmental Geology, Chinese Academy of Geological Sciences. Volumetric titration with Disodium Ethylene diamine tetra acetate (EDTA, 0.01N) with an analytical error of <2% was used to analyze SO42−. The titration method was employed to analyze Cl and HCO3. An ultraviolet-visible (UV-VIS) spectrophotometer (UV-1780, Shimadzu, Japan) was used to analyze NO3. The charge balance error was calculated to validate the quality of major ion analysis, which was within ±5%.

2.4. Isotope Analysis

The analysis for δ2H and δ18O was conducted at the Institute of Geographic Sciences and Natural Resources Research, Chinese Academy of Sciences, and the equipment included Triple-Isotopic Water Analyzers (Model TIWA-45-EP, Los Gatos Research Inc., San Jose, CA, USA) with laser spectroscopy techniques. In order to monitor the data quality, one isotopic standard was measured for every three samples. Each sample/standard was analyzed six times, and the first two results were discarded for avoiding memory effects. The final result of each sample/standard was the average of the last four results. The measurement results of hydrogen and oxygen isotopes were expressed as follows:
δ2H (‰) = [(2H/1H)sample/(2H/1H)standard − 1] × 103
δ18O (‰) = [(18O/16O)sample/(18O/16O)standard − 1] × 103
The isotope data are reported in per mill (‰) relative to the standard Vienna Standard Mean Ocean Water (V-SMOW), and the measurement precision was ±0.5‰ (1σ) for δ2H and ±0.1‰ (1σ) for δ18O.

3. Results and Discussion

3.1. Stable H-O Isotopic Geochemistry

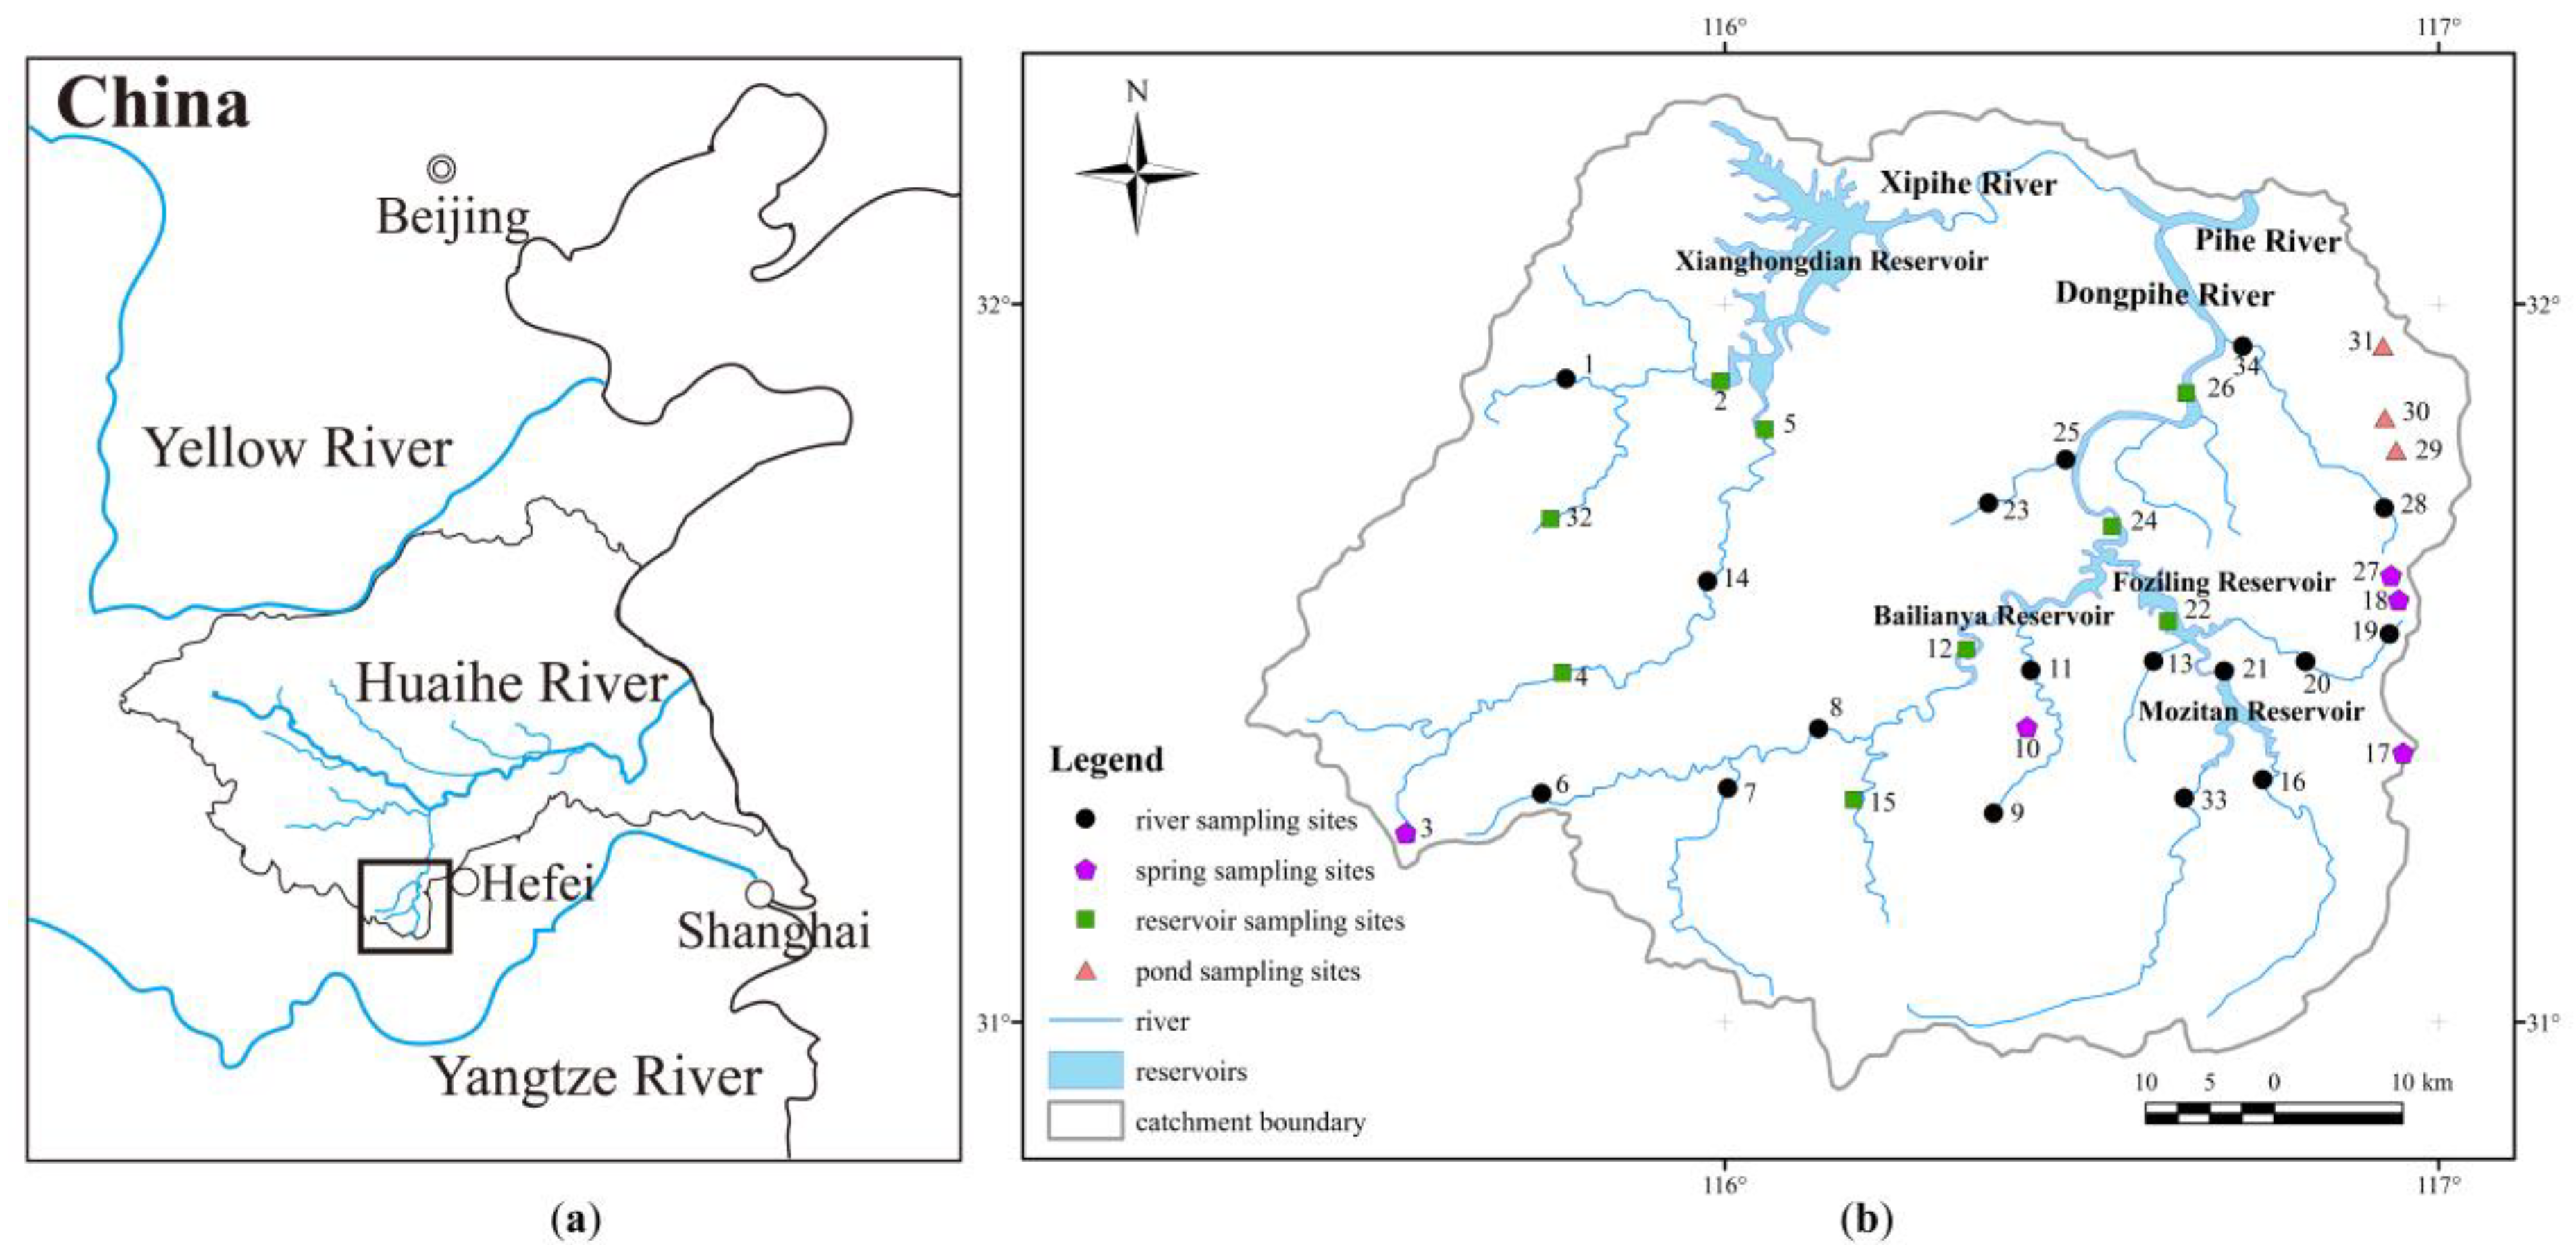
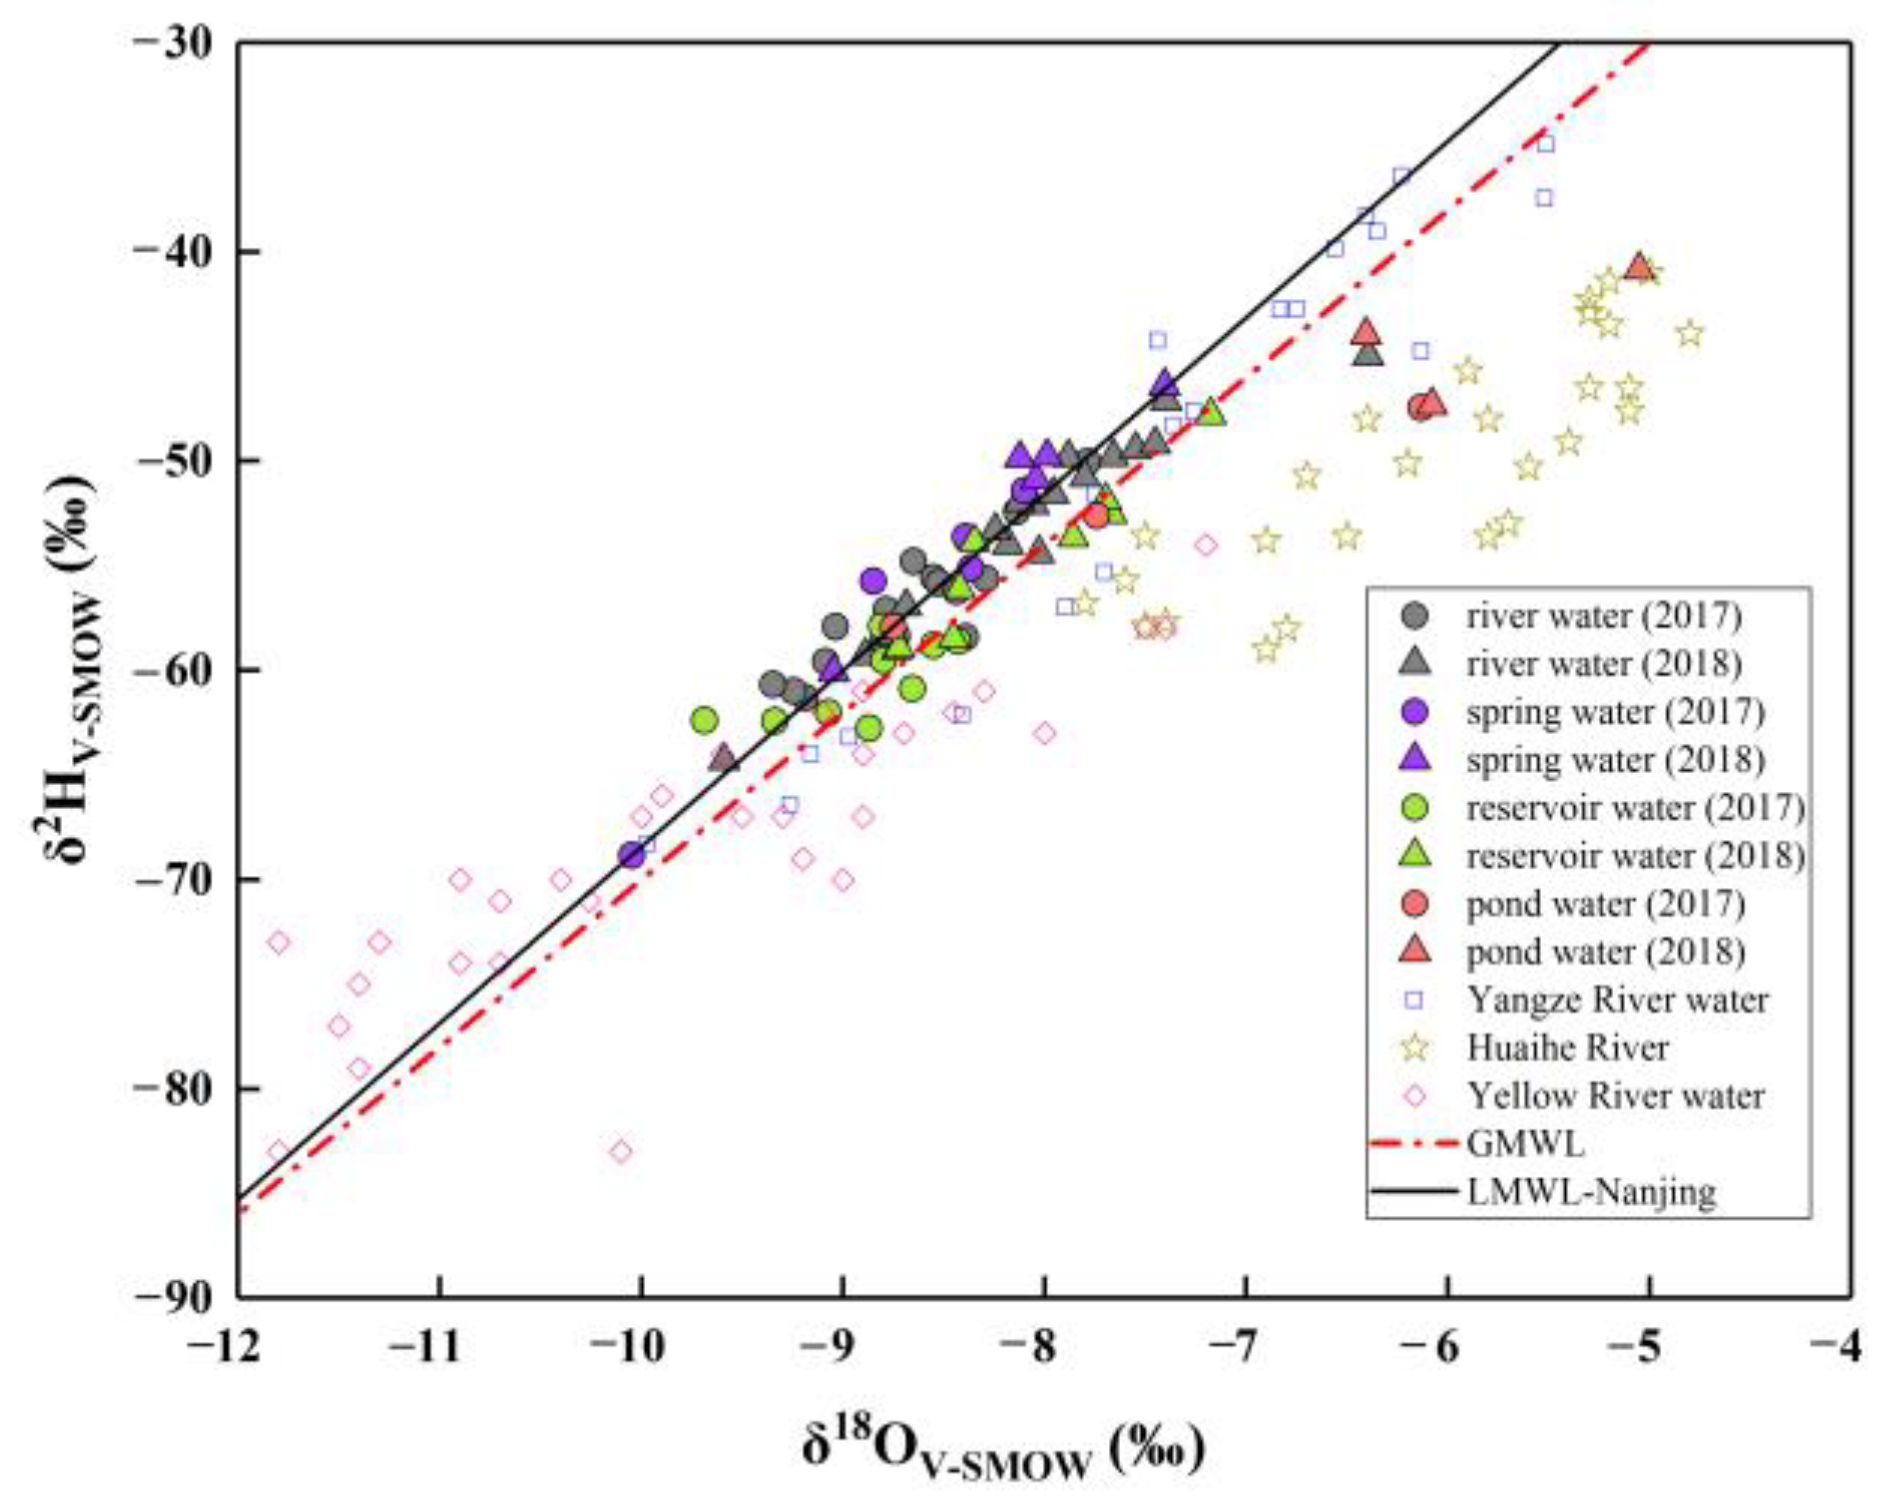
3.1.1. Hydrogen and Oxygen Isotopic Composition

In general, the δ2H and δ18O values can be ordered as follows: reservoir water < spring water ≈ river water < pond water (Figure 2 and Table 1). The distribution of δ2H and δ18O in different water bodies was similar in 2017 and 2018, although the water samples were more enriched with 2H and 18O in 2018. It is possible that more isotopic fractionation occurred in September 2018 due to a warmer and drier environment, i.e., a higher temperature and lower humidity (Table 2). However, the standard deviation of all water samples between 2017 and 2018 was only 6.7% for δ2H and 8.2% for δ18O. Hence, the deviation was considered acceptable.
The relation between δ2H and δ18O of water samples with the Global Meteoric Water Line (GMWL: Equation (3)) [32] and Local Meteoric Water Line of Nanjing (LMWL-Nanjing: Equation (4) [21]) is presented in Figure 2.
δ2H = 8 × δ18O + 10
δ2H = 8.43 (±0.18) × δ18O + 15.89 (±1.54) (n = 58, r2 = 0.98, regression type: PWLSR)
LMWL-Nanjing was obtained from the Global Network of Isotope in Precipitation (GNIP) [21] and was collected from Nanjing City, which is only 250 km away from the study area.
It can be seen from Figure 3 that most of the water samples in the study area lie on or fall near the GMWL and LMWL-Nanjing, except for several pond water samples in the plain area. Meanwhile, in Figure 3, water samples in the UPRB are located in a region where the time-series isotopic composition of the Yangtze River water (Datong station) [33] and spatiotemporal-series isotopic composition of the Yellow River [34] partly coincide. On the other hand, we have also displayed the stable isotope data in the Huaihe River, where the UPRB is the headwater area of the sub-basin. Nevertheless, Huaihe River water samples significantly deviate from the GMWL, the LMWL-Nanjing, and the points of the UPRB. This phenomenon is because most samples in the Huaihe River were collected from the plain or swale. In other words, water bodies in the low-elevation area show larger isotopic fractionation than those in the mountainous environment, which is related to kinetic fractionation that occurs during the evaporation processes.
Differences in the isotopic composition suggest that it is responsible for different hydrological processes. The statistical δ2H and δ18O values of different types of water sample are shown in Table 3. For river water, overall, the mean values in 2017 show no significant deviation from those in 2018; however, the δ2H and δ18O of the river water exhibit a wider range in 2018 than in 2017. The mean values of δ2H and δ18O are similar for spring water and river water, both in 2017 and 2018. Compared with river water and spring water, reservoir water is more enriched with 1H and 16O, and its δ2H and δ18O ranges are narrower. Among the nine reservoir water samples, five samples were collected from medium and small reservoirs (No. 4, 5, 15, 26, and 32), and the other four were collected from large reservoirs (No. 2, 12, 22, and 24). For the reservoir water sampled from the upstream area of the large reservoir (including No. 12, because it is in the mouth area where the river water flow in), δ2H and δ18O are lower, for which the average of δ2H is −62.1‰ in 2017 and −56.1‰ in 2018; for the remaining reservoir water (i.e., No. 2, 22, 24, and 26), the average of δ2H is −58.7‰ in 2017 and −52.9‰ in 2018. Apparently, the isotopic composition of the former is lighter than that of the latter. The δ2H and δ18O of pond water are obviously higher than those of river water, spring water, and reservoir water.
Therefore, the samples were divided into three groups, according to the stable isotopic composition: the water in medium and small reservoirs, the pond water, and the remaining water. The pond water is most enriched with heavy isotopes, which indicates that it is likely related to significant evaporation. On the contrary, the water in medium and small reservoirs is mostly enriched with light isotopes, which is probably due to rapid recharging from rainwater. On the other hand, similar values for river water and spring water prove that the two are consistent in terms of hydrological behavior, and the slightly heavier isotopic composition of river and spring water demonstrates higher evaporation than the water in medium and small reservoirs. Moreover, large reservoirs mainly receive water from rivers. Therefore, the water in large reservoirs is similar to river and spring water in terms of stable isotopes.

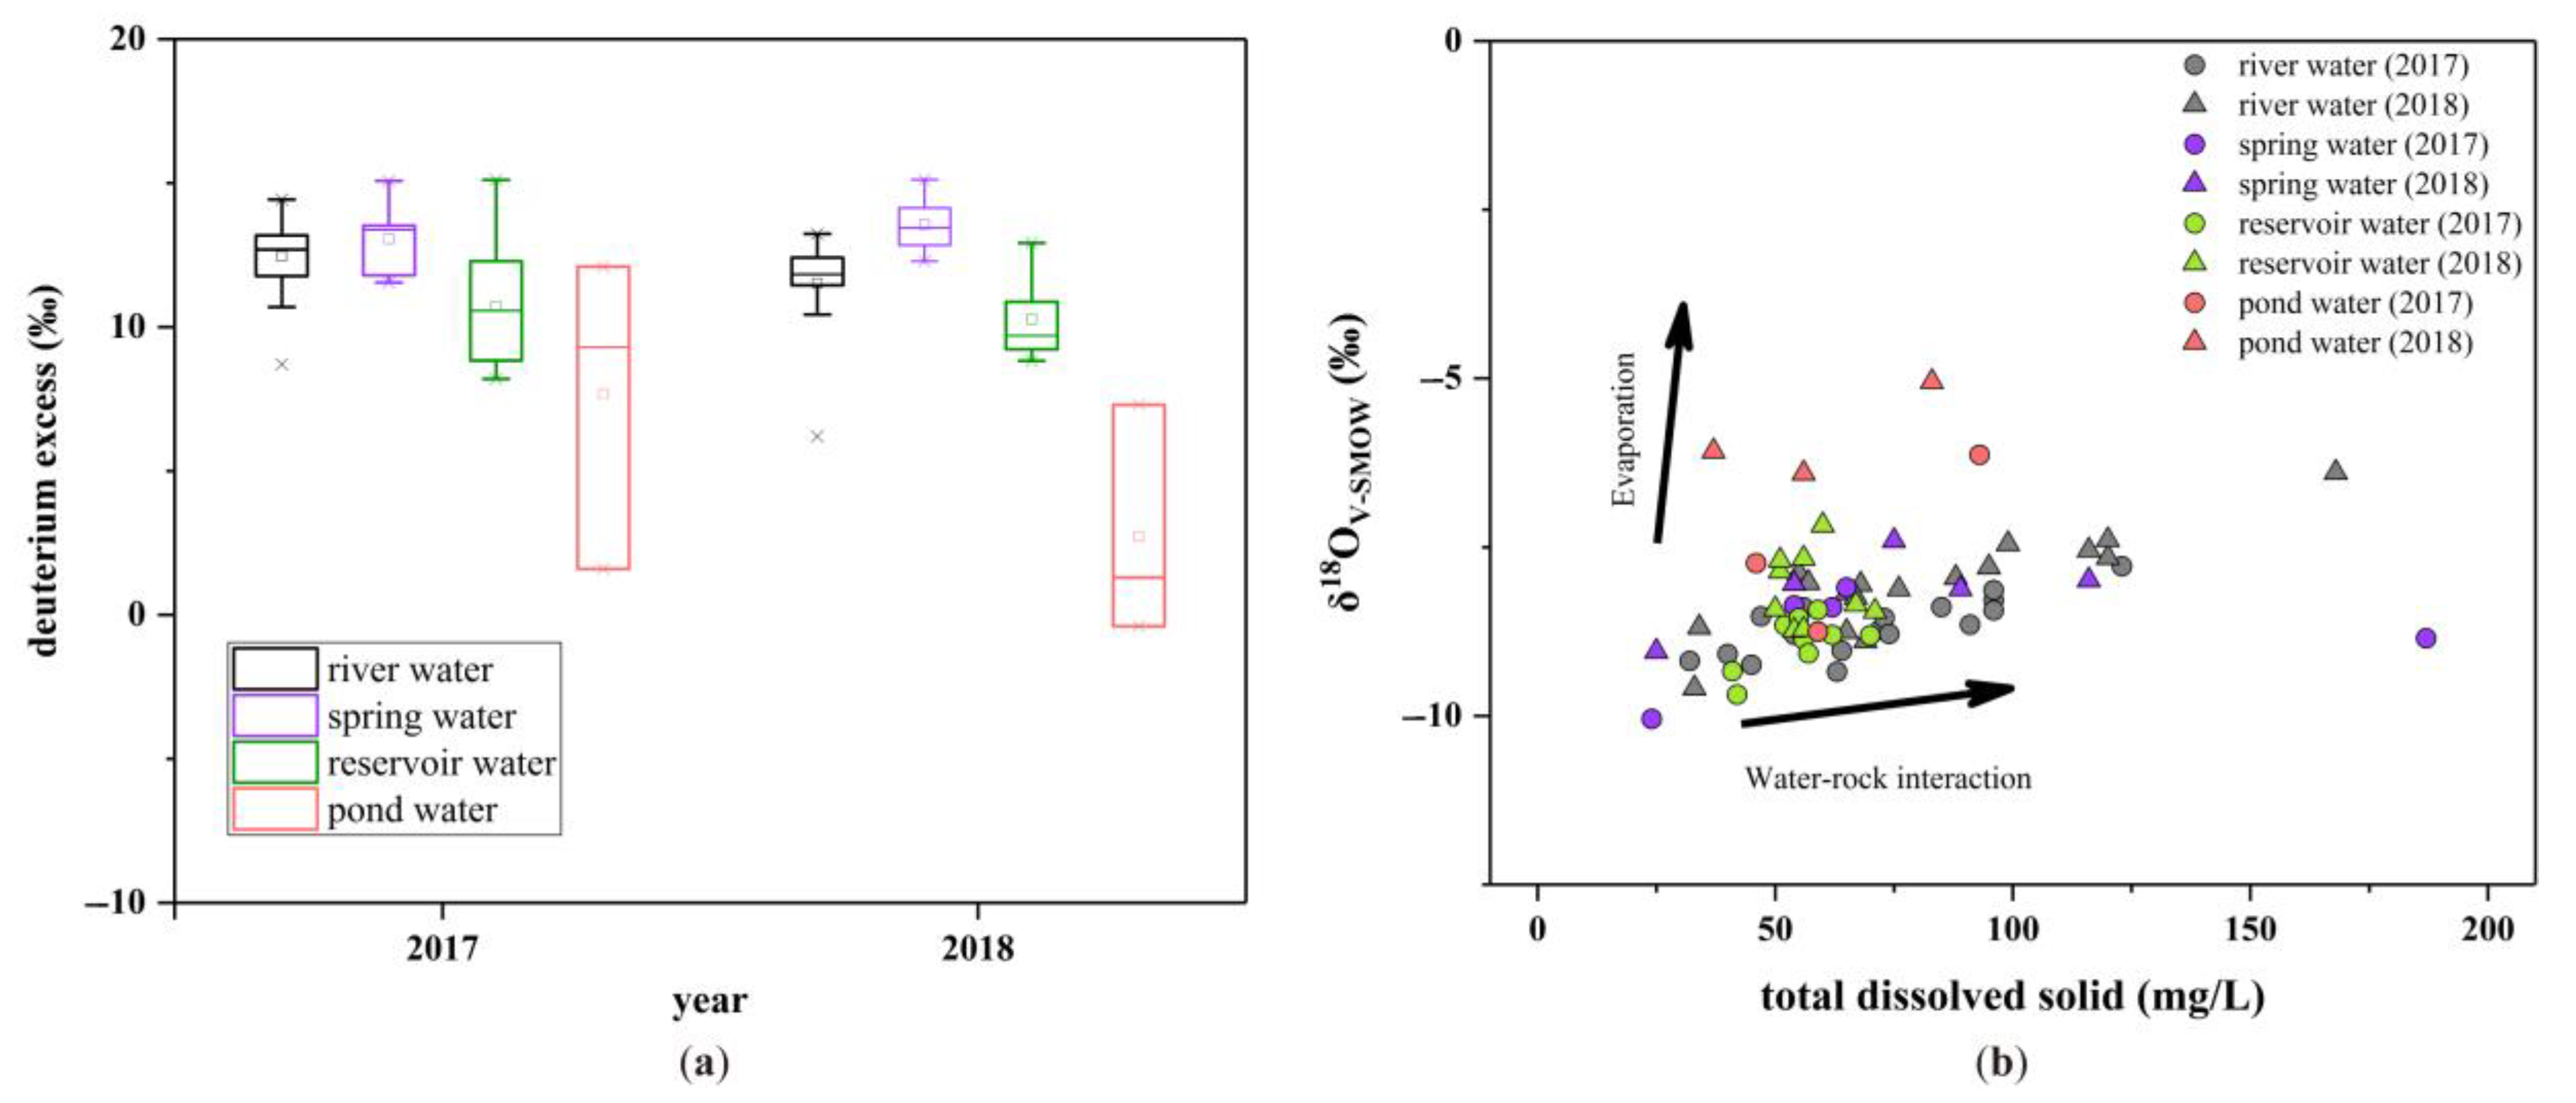
3.1.2. Impact of Water–Rock Interaction and Evaporation

Deuterium excess (d-excess), defined as d-excess = δ2H − 8 × δ18O [35], is a dual isotope index and has been widely applied to precipitation and continental water studies [36,37,38]. The global average d-excess of meteoric water is 10‰ [32]. However, the d-excess of surface water and groundwater is influenced by the moisture source of local precipitation, evaporation, water–rock interaction, and recharging processes [11,17,39]. In the study area, overall, the d-excess values can be ordered as follows: spring water > river water > reservoir water > pond water (Figure 4a). The sequences for 2017 and 2018 are the same, which indicates that the hydrological process has not been influenced by extreme events. However, the variability in d-excess values of different water bodies was higher in 2017.
With a total surface area of only 4350 km2, the moisture source is not regarded as the main factor in the variation of d-excess of different types of water. To discriminate between water–rock interaction and evaporation processes, the scatterplots of TDS versus δ18O of different water bodies are illustrated in Figure 4b, and distinction is obvious among the four water bodies. It is clear that river water and spring water have higher TDS values, and pond water has higher δ18O values. Chemical weathering in water–rock interaction can increase the TDS in water [40]. Combined with a subtropical climate and siliceous-predominant rock in the study area, the humid and warm environment contributes to chemical weathering, and subsequently, the dissolved matter is carried by flowing water. Therefore, river water and spring water have higher TDS values than other water in the study area. However, large reservoirs mainly receive rainwater and river drainage from high-elevation areas, and the semi-closed water bodies, such as the pond, exchange less substances with the environment relative to the river. Hence, reservoir water and pond water have lower TDS values. In addition, due to the wider surface area of the reservoir and pond, the water experiences more intensive evaporation and had higher δ18O values, especially in the pond. In sum, river water and spring water are significantly affected by water–rock interactions, while pond water experiences more evaporation.

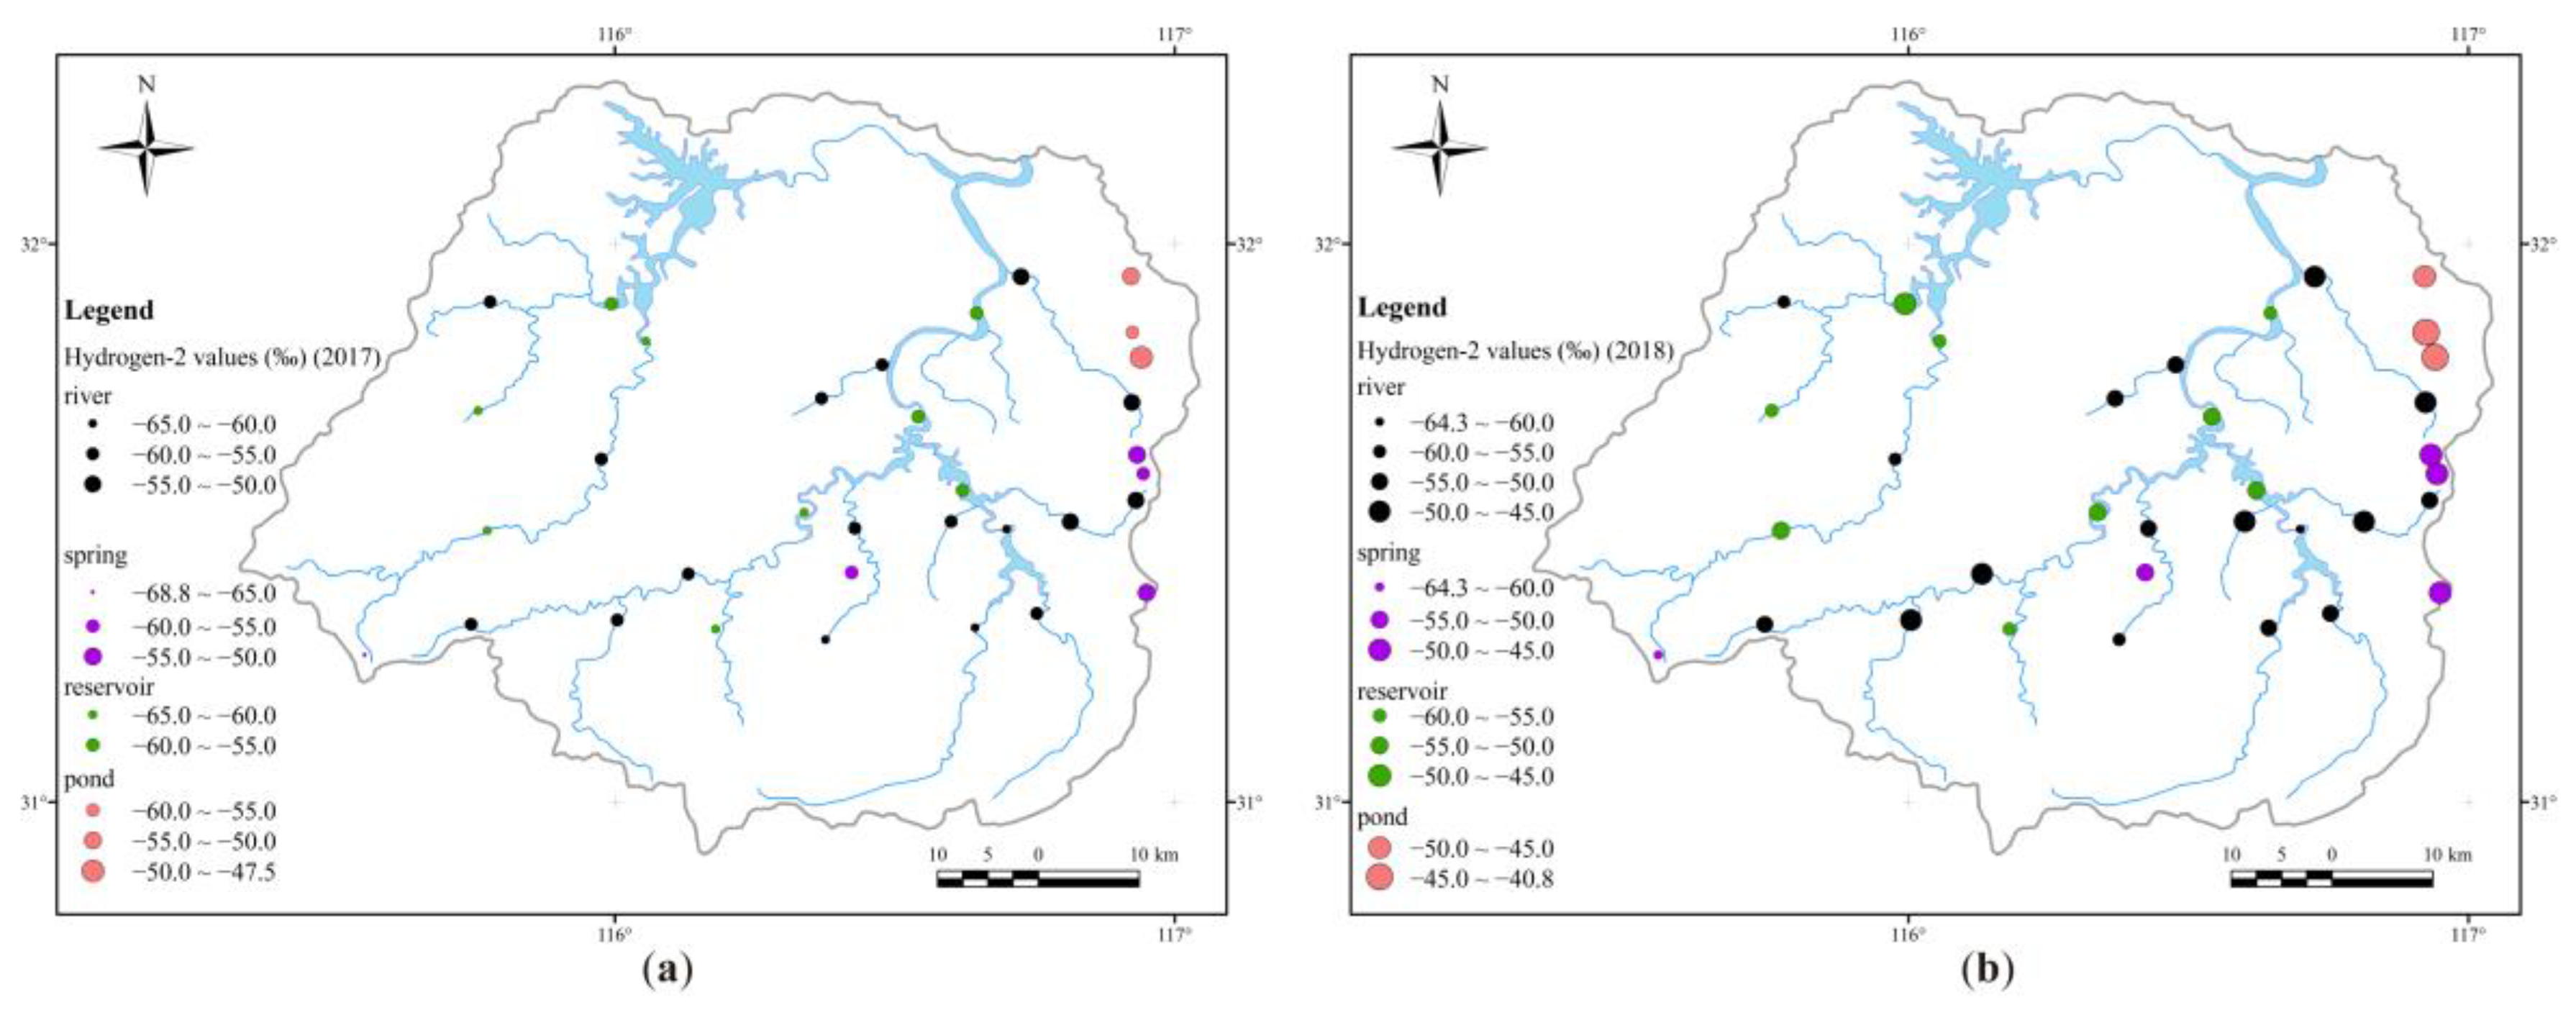
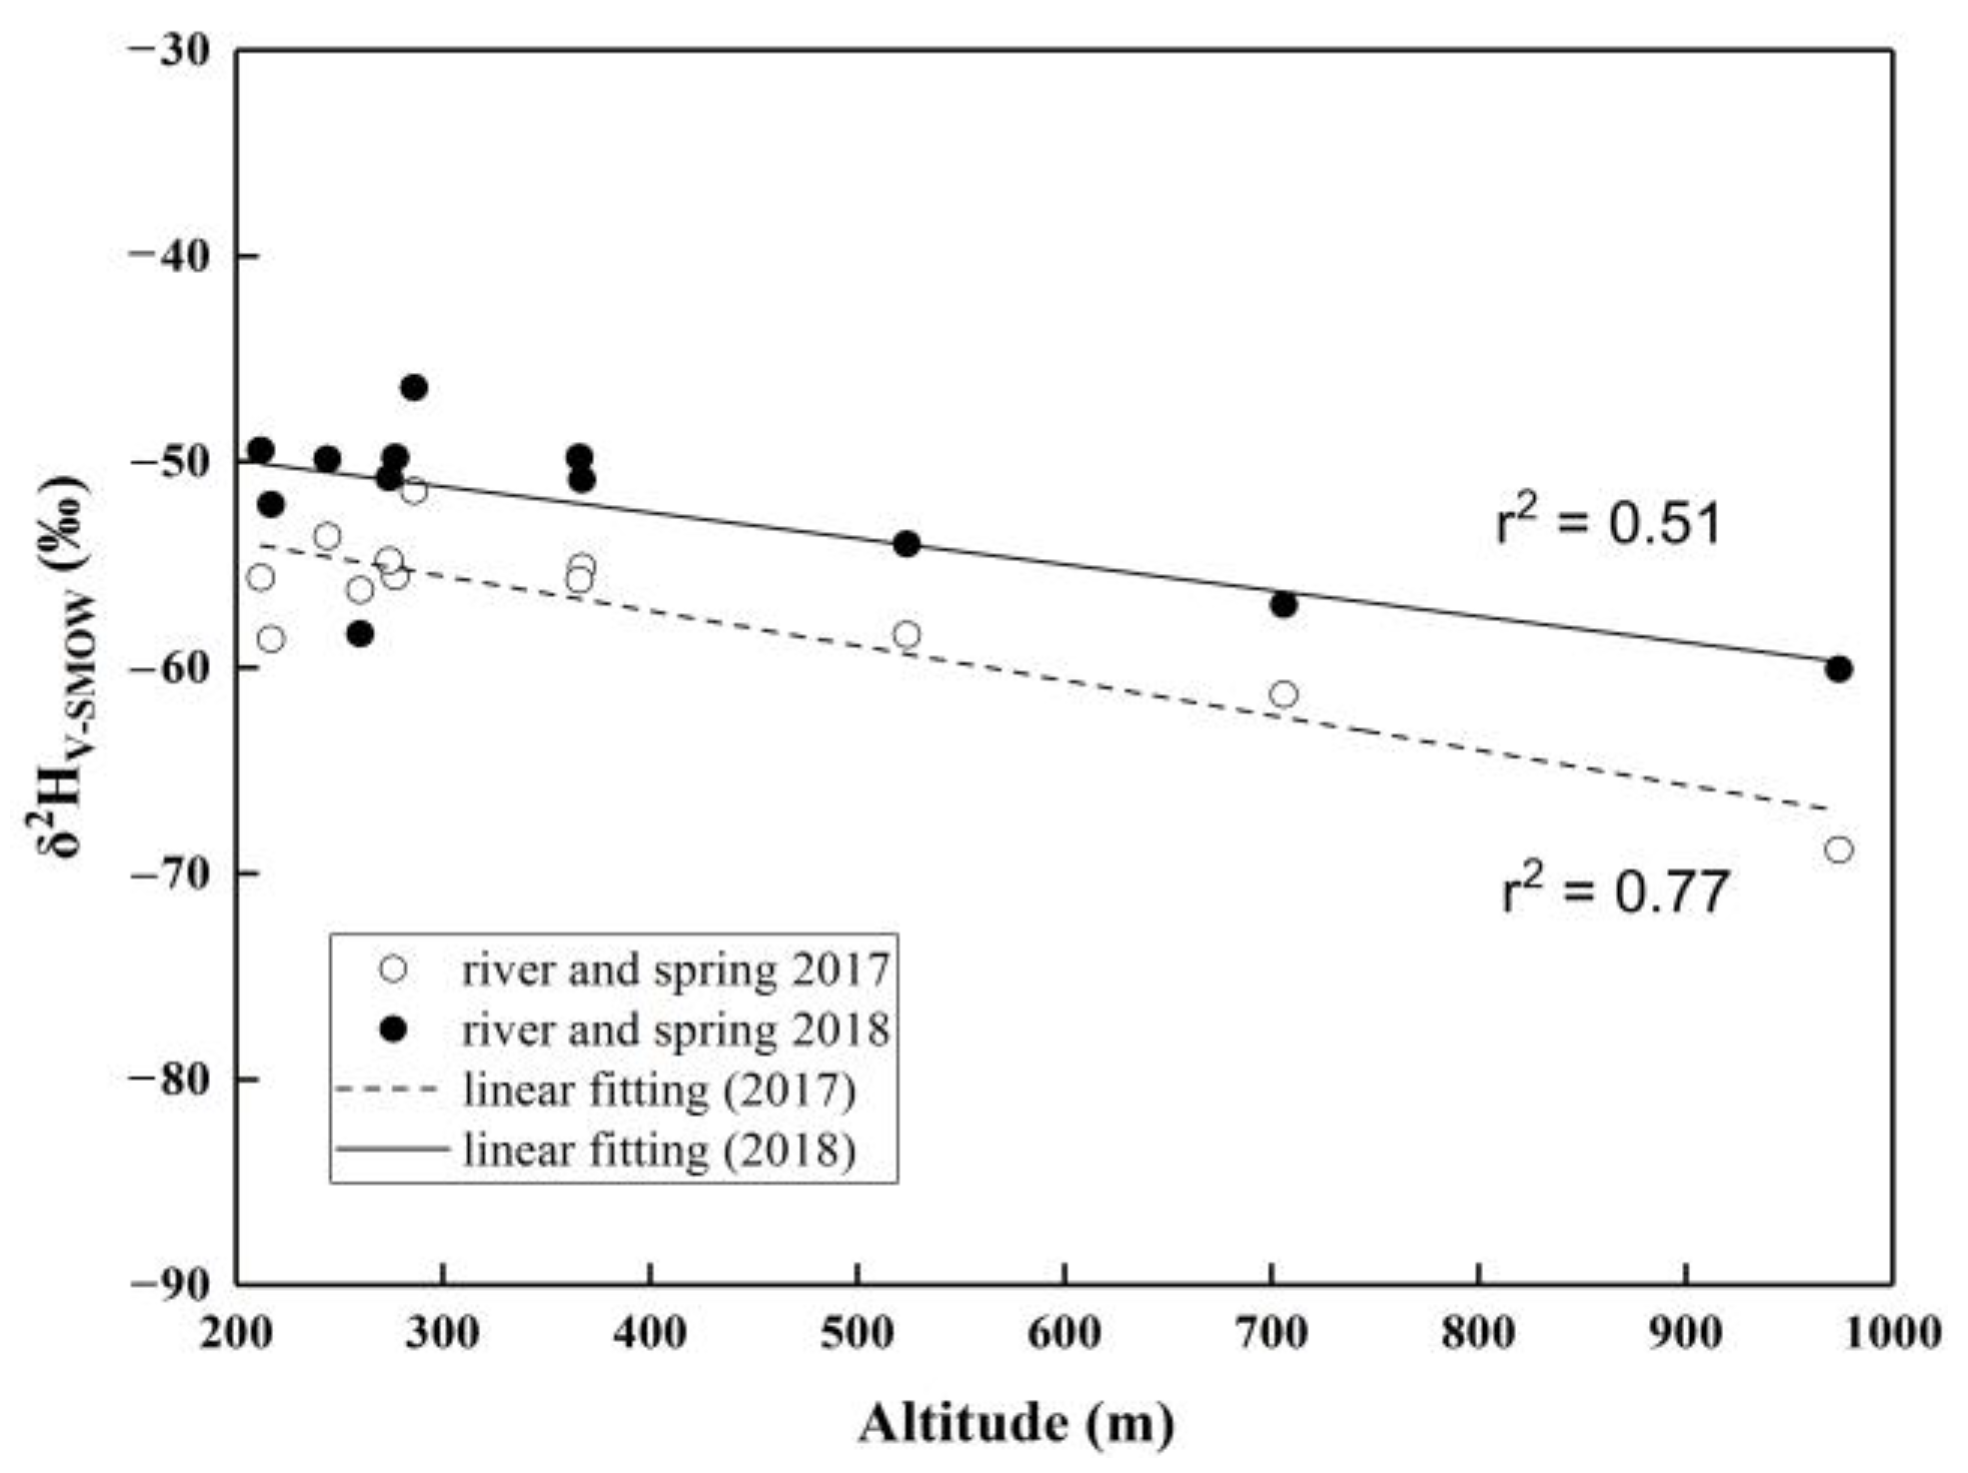
3.1.3. Isotopic Distribution in the Upper Pi River Basin

Figure 5 shows the spatial variation of δ2H values in different water samples in the UPRB. The δ18O values show a similar distribution to δ2H values, so we have only illustrated the distribution of hydrogen isotopes. Spatially, the hydrogen-18 isotope shows greater enrichment in the east and is more depleted in the west. This is probably due to the relatively lower altitude in the East Pi River basin. In other words, in the low altitude area, the air temperature is higher and humidity is lower, which causes higher evaporation at the water’s surface and contributes to the heavier stable hydrogen and oxygen isotopic composition. On the other hand, in the eastern part of the basin, the average δ2H value (−53.6‰ in 2017 and −48.7‰ in 2018) of the three spring water samples (No. 17, 18, and 27) is close to that (−53.6‰ in 2017 and −49.0‰ in 2018) of the upper stream samples (No. 19, 20, and 28), which proves that the two frequently transformed. According to the similarly higher δ2H and δ18O values, the eastern part of Foziling Reservoir is mainly influenced by the Shiyang Stream (No. 11) and the Bailianya Reservoir (No. 12) instead of the drainage from bottom water in the Mozitan Reservoir (No. 21) (Figure 5), which has lower δ2H and δ18O values that may be caused by thermal stratification in the long water residence time [41].
The “altitude effect” reflects the linear relationship between the change in the isotopic composition of precipitation and change in elevation in the mountainous area. In high-elevation areas, the “altitude effect” of the stable hydrogen and oxygen isotopic composition in precipitation can be directly reflected by river water [42]. Subsequently, in the catchment which is mainly recharged by precipitation, surface water also shows a corresponding relationship between the isotopic composition and altitude. In terms of the negative correlation between the isotopic composition and altitude, river water and spring water located at an elevation above 200 m were selected to examine the “altitude effect” that is caused by rainfall (Figure 6). Reservoir water and pond water were removed, because too much evaporation causes isotopic fractionation. A glance at Figure 6 reveals the good linear fitting between δ2H and the altitude of river water and spring water in the mountainous area, and the negative correlation indicates that the river and spring are dependent on rainfall, especially in the area with an elevation of more than 300 m. The relationships between δ2H and altitude (A) in October 2017 (Equation (5)) and September 2018 (Equation (6)) are as follows:
δ2H (‰) = −0.0169A − 50.4737 (r2 = 0.77)
δ2H (‰) = −0.0126A − 47.4177 (r2 = 0.51)
This means that the hydrogen isotopic composition of river water and spring water decreases linearly with increasing elevation by at least 1.26‰/100 m in the UPRB at an elevation above 200 m. Moreover, this degree of decreasing δ2H may be intensified with a decreasing temperature and increasing humidify and rainfall amount.

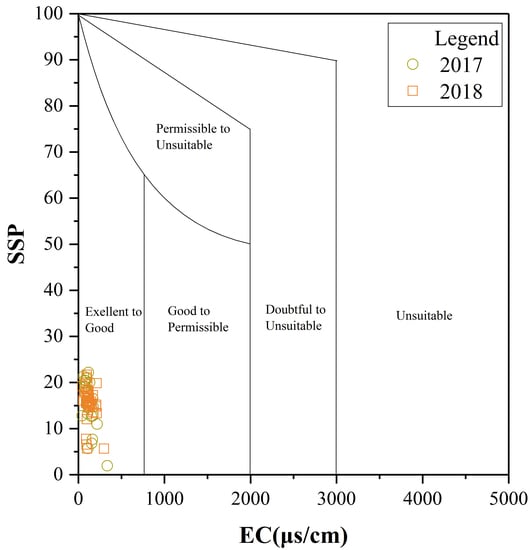
3.2. Assessment of Water Quality for Irrigation Purposes

The study area has abundant water resources, including four large reservoirs and two main rivers, which are the main suppliers for the Pihe irrigation area of 7750 km2 and drinking purposes for about 13 million people [9]. Therefore, it is significant to assess the water quality of surface water and groundwater in the Upper Pi River Basin.

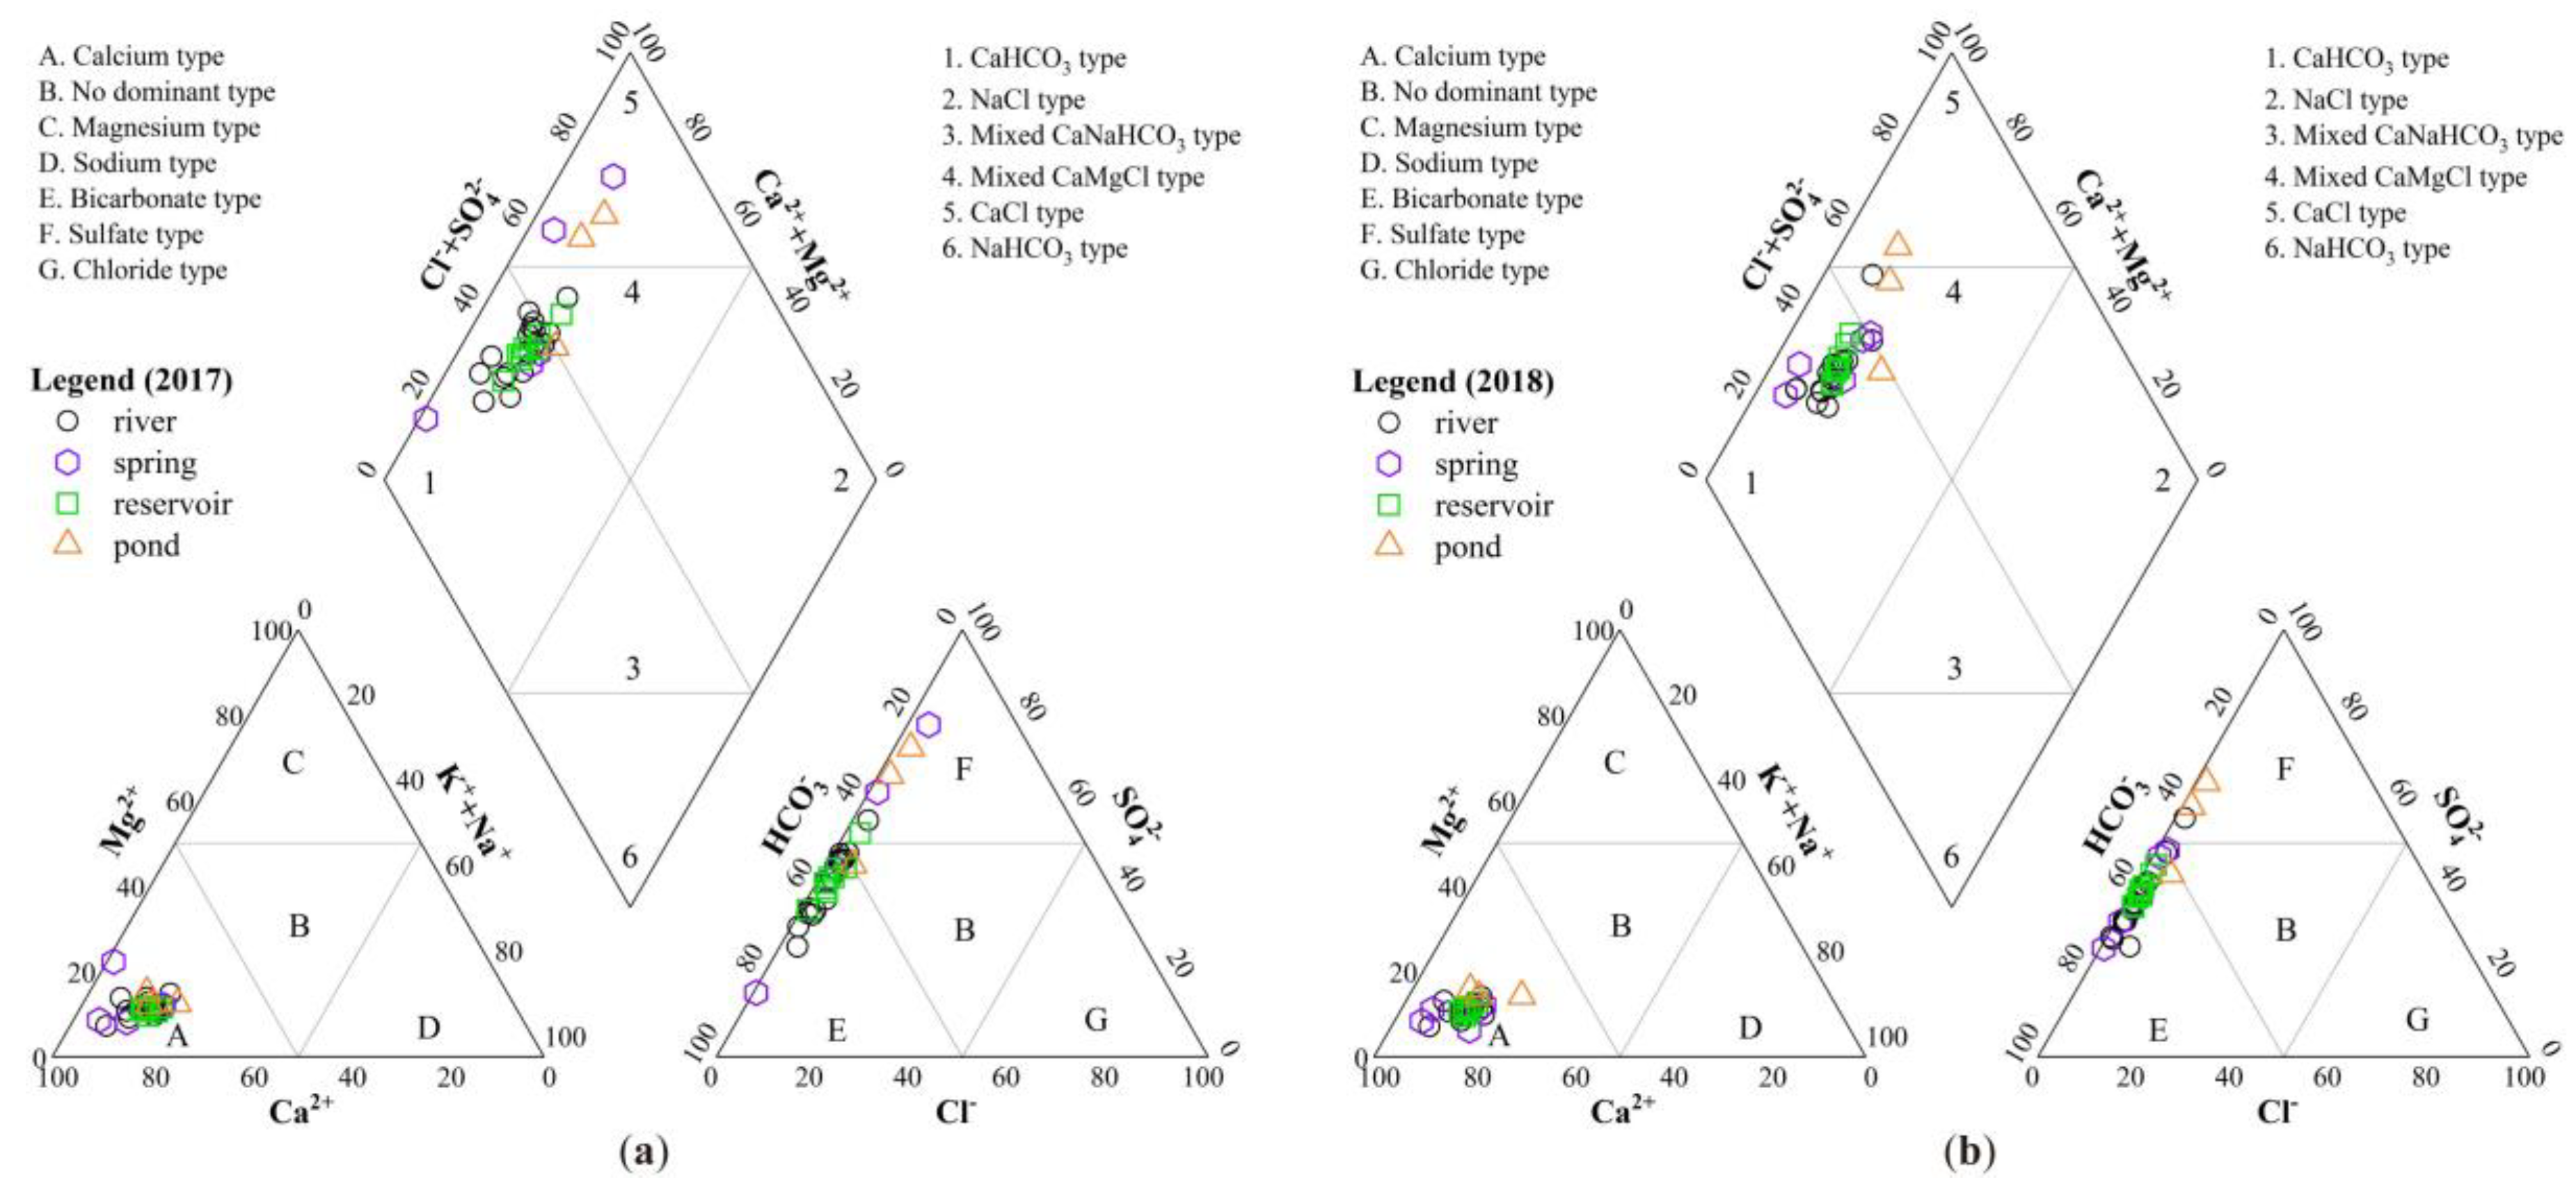
3.2.1. Hydro-Chemical Classification

The hydrochemistry of surface water and groundwater is the main factor that determines its suitability for irrigation [43,44]. Different compositions of ions can be used to identify potential hydro-chemical origins based on standard Piper plots [45]. Therefore, the spatial variation of hydro-chemical classification is useful for understanding the relationship and evolution of surface and groundwater [46].
The Piper diagram of surface water and groundwater in 2017 and 2018 was drawn by Origin 9.0 software (Figure 7a,b). Most water samples fall in the Ca-HCO3 type (zone 1), reflecting rainwater as the main recharging source. Only several samples fall in the Ca-Cl type (zone 5) and Ca-Mg-Cl type (zone 4). The results suggest that Ca-HCO3 is the dominant hydro-chemical facies for surface water and groundwater in the Upper Pi River Basin. Besides, the appearance of Ca-Cl hydro-chemical facies shows more marked salinization in the pond, which is likely caused by intensive evaporation.

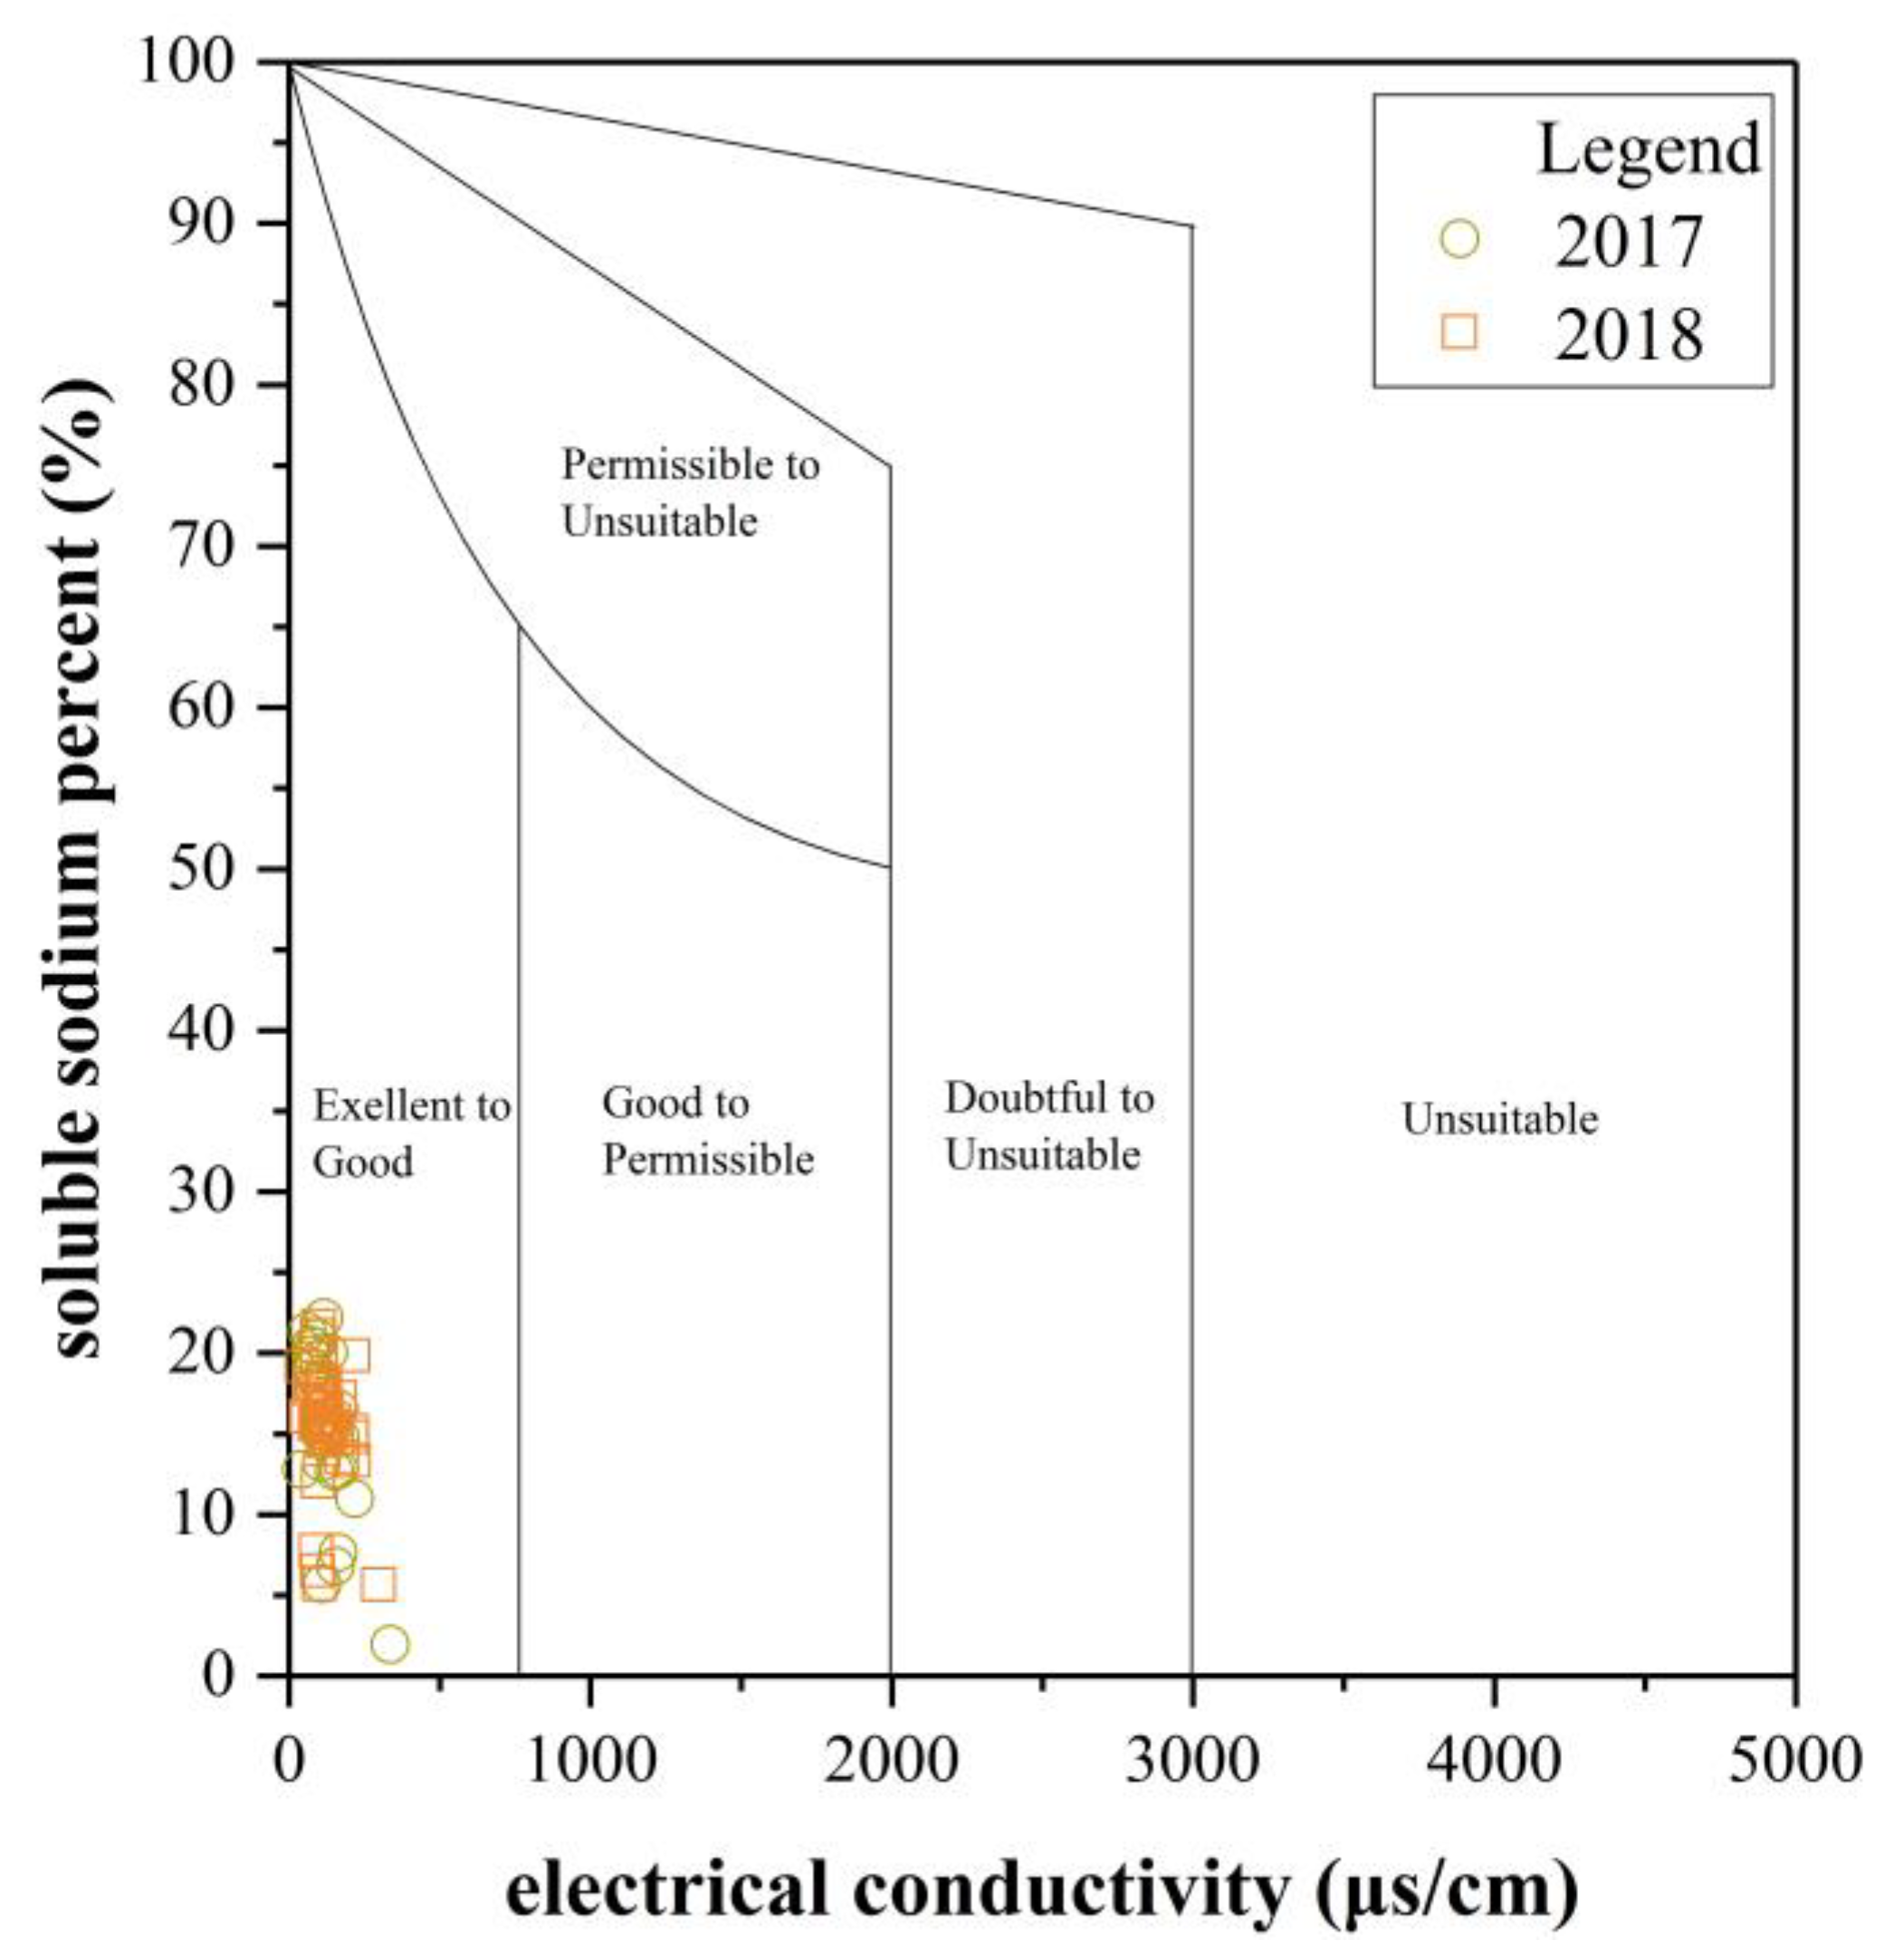
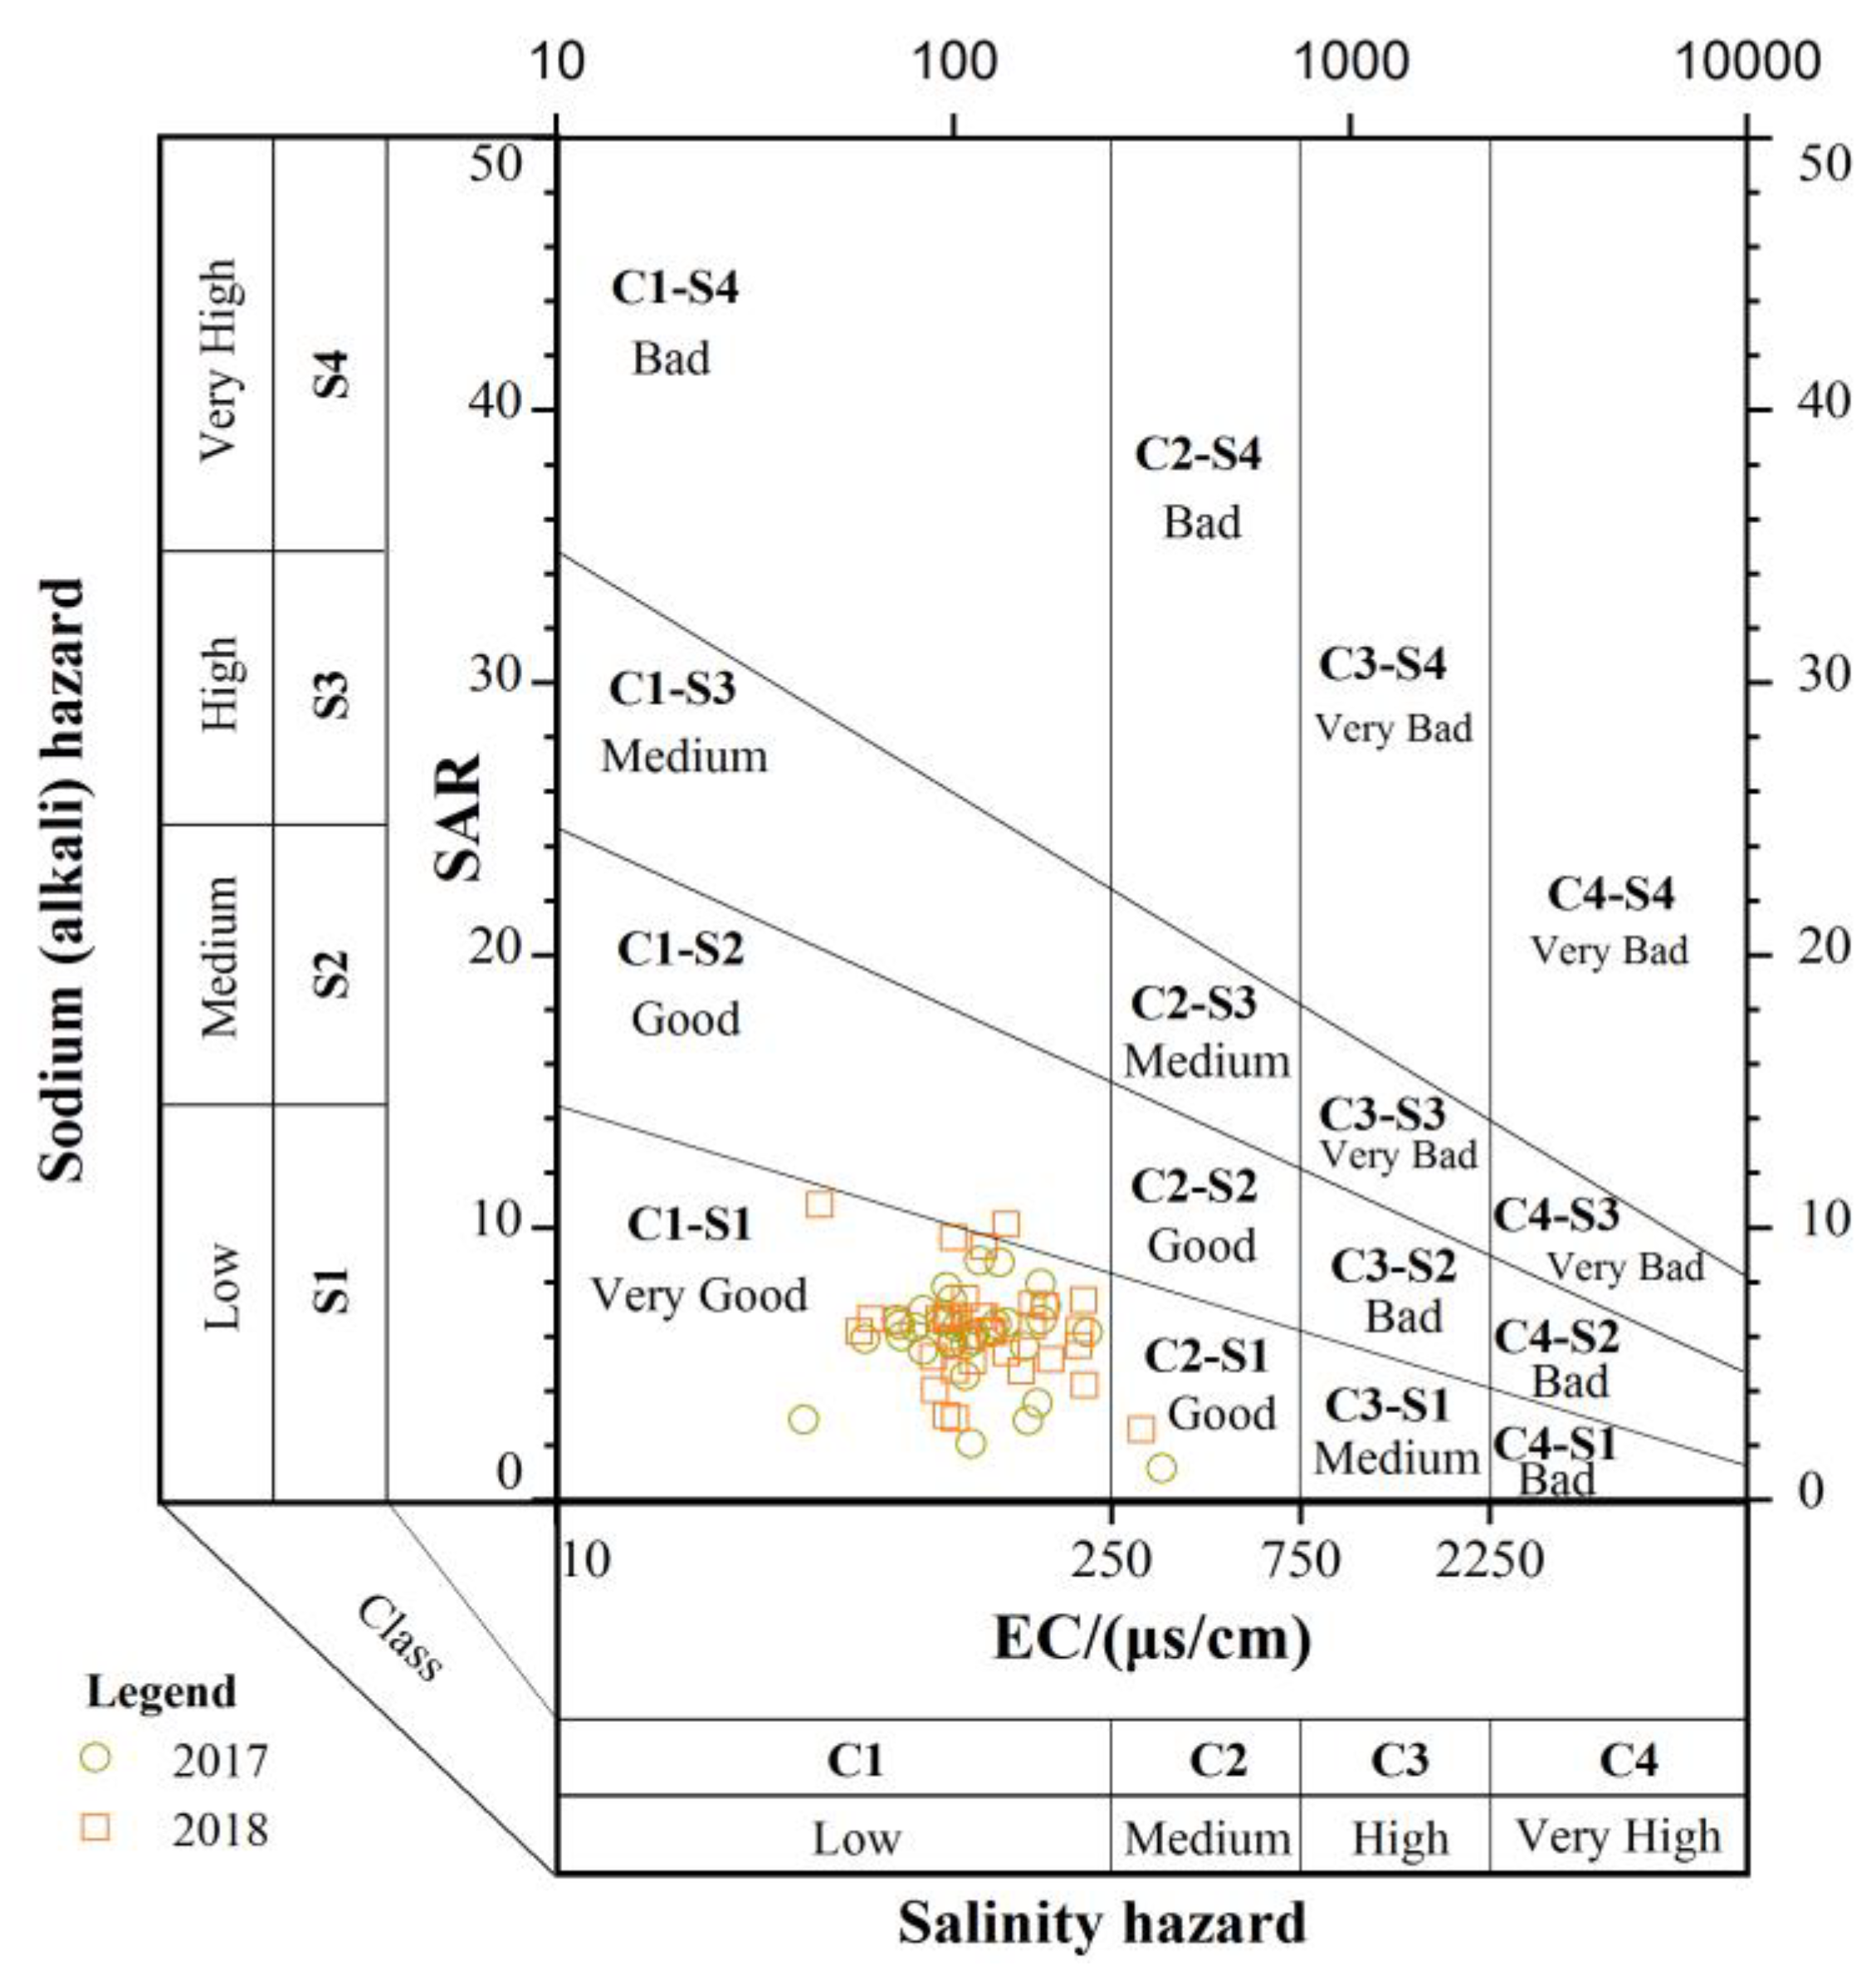
3.2.2. Water Quality Assessment

To examine the water quality and its suitability for irrigation purposes [47,48,49], several salinity indices, including the soluble sodium percentage (SSP), sodium absorption ratio (SAR), magnesium hazard (MH), and Kelly’s ratio (KR), were calculated:
SSP = Na+ × 100/[Ca2+ + Mg2+ + Na+ + K+]
SAR = Na+/[(Ca2+ + Mg2+)/2]0.5
MH = Mg2+ × 100/(Ca2+ + Mg2+)
KR = Na+/(Ca2+ + Mg2+)
where all ions are expressed in the milliequivalent per liter (meq/L). The EC values and computed value of Na%, SAR, MH, and KR in the UPRB are presented in Table 4.
The soluble sodium percent (SSP) is a common parameter used to assess water’s suitability for irrigational purposes [50], denoted as Equation (7). The sodium in the water can displace the calcium and magnesium in the soil, causing a decrease in the ability of the soil to form stable aggregates and a loss of the soil structure. Irrigation water with a high sodium percentage can reduce the permeability of the soil, which consequently decreases the internal drainage of the soil and eventually affects plant growth [51]. Values of SSP < 50 indicate that water is suitable for irrigation, while SSP > 50 is considered unsafe for irrigation [50]. In the UPRB, SSP values of surface water and groundwater samples range from 1.95 to 22.18. Furthermore, according to the Wilcox diagram (Figure 8), all samples lie in the excellent to good zone.
Additionally, because the sodium concentration can reduce the soil permeability and soil structure, the sodium adsorption ratio (SAR) is used to evaluate the suitability of water for use in agricultural irrigation [52]. Hence, a United States Salinity Laboratory (USSL) diagram (Figure 9) was employed to classify irrigation water. The EC value of the X-axis represents the salinity hazard, and the SAR value of the Y-axis represents the sodium (alkali) hazard. Based on the EC, irrigation water can be classified into four categories (EC < 250 μs/cm: Low-salinity water; 250 < EC < 750 μs/cm: Medium-salinity water; 750 < EC < 2250 μs/cm: High-salinity water; EC > 2250 μs/cm: Very high salinity water). Furthermore, a USSL diagram based on SAR can be divided into four categories. In this study, the USSL diagram shows that most water samples are found within the range of the very good category, except for three samples, which fall in the good category. Therefore, surface water and groundwater in the UPRB are suitable for use as irrigation water.
Calcium and magnesium maintain a state of equilibrium in most water. However, a high magnesium content makes soil become more alkaline, which has an adverse effect on the crop yield. Accordingly, a ratio, namely the index of magnesium hazard, was developed [54,55]. An MH value of less than 50 is considered suitable for irrigation. In the UPRB, all of the samples collected showed an MH ratio < 50% (suitable for irrigation).
Kelly’s ratio (KR) is another important indicator for the evaluation of water for agricultural suitability proposed in [56]. A Kelly’s ratio value greater than 1 indicates an excess level of sodium in water, while a value lower than 1 for Kelly’s ratio is considered suitable for irrigation [57]. In this research, all water samples fall in the suitable range for irrigation purposes (KR < 1).

3.3. Instructions for Local Water Management

In this study, the ultimate aim was to provide reasonable water management strategies in the UPRB. The isotope results show that the river and spring water are directly derived from rainfall and are frequently transformed, especially in the area at an elevation of above 300 m. However, large reservoirs are constructed in the area below 150 m, which mainly receives water from the rivers. Therefore, for more effective flood protection, hydrological monitoring of the rivers should be conducted in the area with an elevation of 300 m. Additionally, the research demonstrates that river, spring, reservoir water, and rainfall are closely interconnected, and these water sources are suitable for irrigation purposes. However, the river and spring water are obviously affected by water–rock interactions. Therefore, in the next step, geology-based hydrological studies in the UPRB will be beneficial for examining the source of heavy metals and harmful elements in the surface water and groundwater. Considering transformation between river water and spring water, the prevention of pollution in river water can ensure sustainability of the groundwater supply, especially in the upstream areas.

4. Conclusions

In the Upper Pi River basin (UPRB), surface water and groundwater are mainly recharged by rainwater in the high-flow season, which refers to the abundant rainfall resource in the mountainous area. Overall, the spatial distribution of hydrogen and oxygen isotopes reflects the separation of different water bodies. Medium and small reservoir water has the lowest δ2H and δ18O values, spring water is similar to river water in terms of the H-O isotopic composition, pond water has the heaviest isotopic composition, and H-O isotopic data of large reservoir water shows the mixing of river/spring water and rainwater. Furthermore, the similar isotopic composition and TDS proves that river water and spring water are rapidly transformed in upstream areas, and are obviously affected by water–rock interactions. Moreover, the good linear relationship between δ2H and the altitude of river water and spring water indicates that they are strongly dependent on direct recharging from rainfall in mountainous areas with an elevation of more than 300 m. The water in large reservoirs mixes with surface water, groundwater, and rainwater, whereas the water of medium and small reservoirs is dominated by rainwater. Pond water is evaporated clearly according to stable isotopes and hydro-chemical facies, which show impacts of human activities on the water cycle. Hence, the stable hydrogen and oxygen isotopes have demonstrated the potential to trace the water cycle in the UPRB. On the other hand, water quality diagrams, including the Wilcox diagram and USSL diagram, and other indices demonstrate that surface water and groundwater in the UPRB are considered suitable for irrigation water. In sum, water is rapidly transformed among the rainfall, rivers, springs, and medium and small reservoirs, whereas large reservoirs can increase the resident time of the water and matters. Investigating the H-O isotopic variability of surface water and groundwater in the UPRB could help in better understanding the materials cycle in the riverine studies in the future.

Author Contributions

Conceptualization, K.Y. and G.H.; methodology, K.Y.; validation, K.Y., and G.H.; formal analysis, K.Y.; investigation, K.Y., C.S., and P.Z.; resources, C.S. and P.Z.; data curation, K.Y. and P.Z.; writing—original draft preparation, K.Y.; writing—review and editing, K.Y. and G.H.; visualization, K.Y.; supervision, G.H.; project administration, G.H. and C.S.; funding acquisition, G.H. and C.S.

Funding

This research was funded by National Natural Science Foundation of China, grant number 41325010 and 41877398.

Acknowledgments

We thank Chen Zhang, Zhenxiong Li, Hui Wang, and Guangpu Dou from China University of Geosciences (Beijing) for invaluable support in sampling.

Conflicts of Interest

The authors declare no conflicts of interest.

References

  1. Buytaert, W.; Celleri, R.; De Bievre, B.; Cisneros, F.; Wyseure, G.; Deckers, J.; Hofstede, R. Human impact on the hydrology of the Andean paramos. Earth Sci. Rev. 2006, 79, 53–72. [Google Scholar] [CrossRef]
  2. Zeng, J.; Yue, F.-J.; Wang, Z.-J.; Wu, Q.; Qin, C.-Q.; Li, S.-L. Quantifying depression trapping effect on rainwater chemical composition during the rainy season in karst agricultural area, southwestern China. Atmos. Environ. 2019, 218, 116998. [Google Scholar] [CrossRef]
  3. Han, G.; Song, Z.; Tang, Y.; Wu, Q.; Wang, Z. Ca and Sr isotope compositions of rainwater from Guiyang city, Southwest China: Implication for the sources of atmospheric aerosols and their seasonal variations. Atmos. Environ. 2019, 214. [Google Scholar] [CrossRef]
  4. Kalbus, E.; Reinstorf, F.; Schirmer, M. Measuring methods for groundwater-surface water interactions: A review. Hydrol. Earth Syst. Sci. 2006, 10, 873–887. [Google Scholar] [CrossRef]
  5. Correa, A.; Breuer, L.; Crespo, P.; Celleri, R.; Feyen, J.; Birkel, C.; Silva, C.; Windhorst, D. Spatially distributed hydro-chemical data with temporally high-resolution is needed to adequately assess the hydrological functioning of headwater catchments. Sci. Total Environ. 2019, 651, 1613–1626. [Google Scholar] [CrossRef]
  6. Han, G.; Tang, Y.; Wu, Q.; Liu, M.; Wang, Z. Assessing Contamination Sources by Using Sulfur and Oxygen Isotopes of Sulfate Ions in Xijiang River Basin, Southwest China. J. Environ. Qual. 2019, 48, 1507–1516. [Google Scholar] [CrossRef]
  7. Xia, J.; She, D.; Zhang, Y.; Du, H. Spatio-temporal trend and statistical distribution of extreme precipitation events in Huaihe River Basin during 1960–2009. J. Geogr. Sci. 2012, 22, 195–208. [Google Scholar] [CrossRef]
  8. Ogrinc, N.; Kanduc, T.; Stichler, W.; Vreca, P. Spatial and seasonal variations in delta O-18 and delta D values in the River Sava in Slovenia. J. Hydrol. 2008, 359, 303–312. [Google Scholar] [CrossRef]
  9. Wang, X.; Liu, G.; Huang, R. The health risk level of water quality in the centralized drinking water sources of the River Pihe irrigation district. Acta Sci. Circumstantiae 2014, 34, 781–787. [Google Scholar]
  10. Han, G.; Lv, P.; Tang, Y.; Song, Z. Spatial and temporal variation of H and O isotopic compositions of the Xijiang River system, Southwest China. Isot. Environ. Health Stud. 2018, 54, 137–146. [Google Scholar] [CrossRef]
  11. Yang, K.; Han, G.; Liu, M.; Li, X.; Liu, J.; Zhang, Q. Spatial and Seasonal Variation of O and H Isotopes in the Jiulong River, Southeast China. Water 2018, 10, 1677. [Google Scholar] [CrossRef]
  12. Cao, X.; Wu, P.; Zhou, S.; Han, Z.; Tu, H.; Zhang, S. Seasonal variability of oxygen and hydrogen isotopes in a wetland system of the Yunnan-Guizhou Plateau, southwest China: A quantitative assessment of groundwater inflow fluxes. Hydrol. J. 2018, 26, 215–231. [Google Scholar] [CrossRef]
  13. Halder, J.; Terzer, S.; Wassenaar, L.I.; Araguas-Araguas, L.J.; Aggarwal, P.K. The Global Network of Isotopes in Rivers (GNIR): Integration of water isotopes in watershed observation and riverine research. Hydrol. Earth Syst. Sci. 2015, 19, 3419–3431. [Google Scholar] [CrossRef]
  14. Vystavna, Y.; Diadin, D.; Huneau, F. Defining a stable water isotope framework for isotope hydrology application in a large trans-boundary watershed (Russian Federation/Ukraine). Isot. Environ. Health Stud. 2018, 54, 147–167. [Google Scholar] [CrossRef] [PubMed]
  15. Wang, Y.; Chen, Y.; Li, W. Temporal and spatial variation of water stable isotopes (O-18 and H-2) in the Kaidu River basin, Northwestern China. Hydrol. Process. 2014, 28, 653–661. [Google Scholar] [CrossRef]
  16. Kumar, A.; Sanyal, P.; Agrawal, S. Spatial distribution of delta O-18 values of water in the Ganga river basin: Insight into the hydrological processes. J. Hydrol. 2019, 571, 225–234. [Google Scholar] [CrossRef]
  17. Duc Anh, T.; Minh Thi Nguyet, L.; Quynh Thi Phuong, L. Use of stable isotopes to understand run-off generation processes in the Red River Delta. Hydrol. Process. 2017, 31, 3827–3843. [Google Scholar] [CrossRef]
  18. Kendall, C.; Coplen, T.B. Distribution of oxygen-18 and deuterium in river waters across the United States. Hydrol. Process. 2001, 15, 1363–1393. [Google Scholar] [CrossRef]
  19. Rank, D.; Wyhlidal, S.; Schott, K.; Weigand, S.; Oblin, A. Temporal and spatial distribution of isotopes in river water in Central Europe: 50 years experience with the Austrian network of isotopes in rivers. Isot. Environ. Health Stud. 2018, 54, 115–136. [Google Scholar] [CrossRef]
  20. Zhang, L.; Yuan, R.; Song, X.; Xia, J. Spatial variation of stable isotopic composition in surface waters of the Huai River basin, China and the regional hydrological implication. Hydrol. Res. 2018, 49, 1452–1466. [Google Scholar] [CrossRef]
  21. IAEA/WMO. Global Network of Isotopes in Precipitation. Available online: http://www-naweb.iaea.org/napc/ih/IHS_resources_gnip.html (accessed on 22 May 2019).
  22. Brooks, J.R.; Wigington, P.J., Jr.; Phillips, D.L.; Comeleo, R.; Coulombe, R. Willamette River Basin surface water isoscape (delta O-18 and delta H-2): Temporal changes of source water within the river. Ecosphere 2012, 3. [Google Scholar] [CrossRef]
  23. Zhao, X.; Li, F. Isotope evidence for quantifying river evaporation and recharge processes in the lower reaches of the Yellow River. Environ. Earth Sci. 2017, 76. [Google Scholar] [CrossRef]
  24. Hu, Y.; Liu, Z.; Zhao, M.; Zeng, Q.; Zeng, C.; Chen, B.; Chen, C.; He, H.; Cai, X.; Ou, Y.; et al. Using deuterium excess, precipitation and runoff data to determine evaporation and transpiration: A case study from the Shawan Test Site, Puding, Guizhou, China. Geochim. Cosmochim. Acta 2018, 242, 21–33. [Google Scholar] [CrossRef]
  25. Li, C.; Yang, S.; Lian, E.; Yang, C.; Deng, K.; Liu, Z. Damming effect on the Changjiang (Yangtze River) river water cycle based on stable hydrogen and oxygen isotopic records. J. Geochem. Explor. 2016, 165, 125–133. [Google Scholar] [CrossRef]
  26. Bowen, G.J.; Kennedy, C.D.; Liu, Z.; Stalker, J. Water balance model for mean annual hydrogen and oxygen isotope distributions in surface waters of the contiguous United States. J. Geophys. Res.-Biogeosci. 2011, 116. [Google Scholar] [CrossRef] [Green Version]
  27. Su, J.; Lv, S.; Li, M.; Ma, X. Research on the Impacts of LUCC on Runoff of Basin above Hengpaitou. China Rural Water Hydropower 2014, 10, 43–48. [Google Scholar]
  28. Ye, J.; Li, Z.; Liu, J.; Yang, Z. Identification of early meteorological risk warning indicators for flash flood disasters. Torrential Rain Disasters 2016, 35, 25–30. [Google Scholar]
  29. NMIC. China Meteorological Data Service Centre. Available online: http://data.cma.cn (accessed on 20 May 2019).
  30. Wang, S.; Wu, R.; Xie, W.; Lu, Y. Rainstorm-Induced Mountain Flood Disaster Risk Zoning Based on FloodArea Inundation Model Taking Pihe River Valley as A Case. Progress. Inquisitiones De Mutat. Clim. 2016, 12, 432–441. [Google Scholar]
  31. Jager, H.I.; Smith, B.T. Sustainable reservoir operation: Can we generate hydropower and preserve ecosystem values? River Res. Appl. 2008, 24, 340–352. [Google Scholar] [CrossRef]
  32. Craig, H. Isotopic Variations in Meteoric Waters. Science 1961, 133, 1702–1703. [Google Scholar] [CrossRef]
  33. IAEA. Global Network of Isotopes in Rivers. Available online: http://www-naweb.iaea.org/napc/ih/IHS_resources_gnir.html (accessed on 22 May 2019).
  34. Su, X.; Lin, X.; Liao, Z.; Wang, J. Variation of isotopes in the Yellow River along the flow path and its affecting factors. Geochimica 2003, 32, 349–357. [Google Scholar]
  35. Dansgaard, W. Stable isotopes in precipitation. Tellus 1964, 16, 436–468. [Google Scholar] [CrossRef]
  36. Meredith, K.T.; Hollins, S.E.; Hughes, C.E.; Cendon, D.I.; Hankin, S.; Stone, D.J.M. Temporal variation in stable isotopes (O-18 and H-2) and major ion concentrations within the Darling River between Bourke and Wilcannia due to variable flows, saline groundwater influx and evaporation. J. Hydrol. 2009, 378, 313–324. [Google Scholar] [CrossRef]
  37. Araguas-Araguas, L.; Froehlich, K.; Rozanski, K. Stable isotope composition of precipitation over southeast Asia. J. Geophys. Res.-Atmos. 1998, 103, 28721–28742. [Google Scholar] [CrossRef]
  38. Laonamsai, J.; Putthividhya, A. Preliminary Assessment of Groundwater and Surface Water Characteristics in the Upper Chao Phraya River Basin Land Using a Stable Isotope Fingerprinting Technique; ASCE: Reston, VA, USA, 2016. [Google Scholar]
  39. Nguyen Le, D.; Heidbuechel, I.; Meyer, H.; Merz, B.; Apel, H. What controls the stable isotope composition of precipitation in the Mekong Delta? A model-based statistical approach. Hydrol. Earth Syst. Sci. 2018, 22, 1239–1262. [Google Scholar] [CrossRef] [Green Version]
  40. Zhang, J.; Huang, W.W.; Letolle, R.; Jusserand, C. Major-Element Chemistry of the Huanghe (Yellow-River), China-Weathering Processes and Chemical Fluxes. J. Hydrol. 1995, 168, 173–203. [Google Scholar] [CrossRef]
  41. Wang, B.; Zhang, H.; Liang, X.; Li, X.; Wang, F. Cumulative effects of cascade dams on river water cycle: Evidence from hydrogen and oxygen isotopes. J. Hydrol. 2019, 568, 604–610. [Google Scholar] [CrossRef]
  42. Jodar, J.; Custodio, E.; Javier Lamban, L.; Martos-Rosillo, S.; Herrera-Lameli, C.; Sapriza-Azuri, G. Vertical variation in the amplitude of the seasonal isotopic content of rainfall as a tool to jointly estimate the groundwater recharge zone and transit times in the Ordesa and Monte Perdido National Park aquifer system, north-eastern Spain. Sci. Total Environ. 2016, 573, 505–517. [Google Scholar] [CrossRef] [Green Version]
  43. Zhai, Y.; Zhao, X.; Teng, Y.; Li, X.; Zhang, J.; Wu, J.; Zuo, R. Groundwater nitrate pollution and human health risk assessment by using HHRA model in an agricultural area, NE China. Ecotoxicol. Environ. Saf. 2017, 137, 130–142. [Google Scholar] [CrossRef]
  44. Zhang, B.; Song, X.; Zhang, Y.; Han, D.; Tang, C.; Yang, L.; Wang, Z.-L. The relationship between and evolution of surface water and groundwater in Songnen Plain, Northeast China. Environ. Earth Sci. 2015, 73, 8333–8343. [Google Scholar] [CrossRef]
  45. Piper, M. A graphic procedure in the geochemical interpretation of water-analyses. EOS Trans. Am. Geophys. Union 1944, 25, 914–928. [Google Scholar] [CrossRef]
  46. Dinka, M.O. Hydrochemical composition and origin of surface water and groundwater in the Matahara area, Ethiopia. Inland Waters 2017, 7, 297–304. [Google Scholar] [CrossRef]
  47. Alavi, N.; Nozari, V.; Mazloumzadeh, S.M.; Nezamabadi-pour, H. Irrigation water quality evaluation using adaptive network-based fuzzy inference system. Paddy Water Environ. 2010, 8, 259–266. [Google Scholar] [CrossRef]
  48. Talib, M.A.; Tang, Z.; Shahab, A.; Siddique, J.; Faheem, M.; Fatima, M. Hydrogeochemical Characterization and Suitability Assessment of Groundwater: A Case Study in Central Sindh, Pakistan. Int. J. Environ. Res. Public Health 2019, 16, 886. [Google Scholar] [CrossRef]
  49. Vincy, M.V.; Brilliant, R.; Pradeepkumar, A.P. Hydrochemical characterization and quality assessment of groundwater for drinking and irrigation purposes: A case study of Meenachil River Basin, Western Ghats, Kerala, India. Environ. Monit. Assess. 2015, 187. [Google Scholar] [CrossRef]
  50. Wilcox, L.V. Classification and Use of Irrigation Waters; Department of Agriculture: Washington, DC, USA, 1955.
  51. Amiri, V.; Sohrabi, N.; Dadgar, M.A. Evaluation of groundwater chemistry and its suitability for drinking and agricultural uses in the Lenjanat plain, central Iran. Environ. Earth Sci. 2015, 74, 6163–6176. [Google Scholar] [CrossRef]
  52. Todd, D.K. Groundwater Hydrology, 2nd ed.; Wiley: New York, NY, USA, 1980. [Google Scholar]
  53. U.S.S.L. Diagnosis and Improvement of Saline and Alkali Soils; Agriculture Department, U.S.: Washington, DC, USA, 1954; p. 160.
  54. Paliwal, K.V.; Heine, R.W. Irrigation with Saline Water. Q. Rev. Biol. 1972, 198. [Google Scholar]
  55. Szabolcs, I. The influence of irrigation water of high sodium-carbonate content on soils. Agrokémia Talajt. 1964, 13, 237–246. [Google Scholar]
  56. Kelley, P.W. USE of Saline Irrigation Water. Soil Sci. 1963, 95, 385–391. [Google Scholar] [CrossRef]
  57. Bouderbala, A. Assessment of Groundwater Quality and its Suitability for Agricultural Uses in the Nador Plain, North of Algeria. Water Qual. Expo. Health 2015, 7, 445–457. [Google Scholar] [CrossRef]
Figure 1. (a) Location of the Upper Pi River basin (UPRB) and (b) water sampling sites.
Ijerph 16 04076 g001
Figure 2. Box diagrams of (a) δ2H and (b) δ18O values in different water bodies.
Ijerph 16 04076 g002
Figure 3. Scatterplots of δ2H and δ18O in the UPRB, the Yangtze River [33], the Huaihe River [20], and the Yellow River [34], and the correlation with the Global Meteoric Water Line (GWML) [32] and Local Meteoric Water Line of Nanjing (LMWL-Nanjing) [21].
Ijerph 16 04076 g003
Figure 4. (a) Deuterium excess (d-excess) values of different types of water samples in the study area. (b) Total dissolved solid (TDS) versus δ18O of water samples.
Ijerph 16 04076 g004
Figure 5. Spatial distribution of δ2H values in the Upper Pi River basin in (a) 2017 and (b) 2018.
Ijerph 16 04076 g005
Figure 6. Correlation between δ2H and altitude (above 200 m) of river water and spring water.
Ijerph 16 04076 g006
Figure 7. The piper diagram of the surface water and groundwater in (a) 2017 and (b) 2018.
Ijerph 16 04076 g007
Figure 8. Wilcox diagram for evaluating the suitability of water for irrigation [50].
Ijerph 16 04076 g008
Figure 9. United States Salinity Laboratory (USSL) diagram for the classification of irrigation water (after the United States Salinity Laboratory [53]).
Ijerph 16 04076 g009
Table 1. Locations and isotopic compositions of river, spring, reservoir, and pond water samples.
Water TypesNo.StreamLog. °ELat. °NAlt. mδ2Hδ18Od-Excessδ2Hδ18Od-Excess
20172018
River water1Xipi115.8931.45146−58.4−8.7311.5−59.3−8.8911.8
6Manshuim115.8731.16524−58.4−8.398.7−54.0−8.1811.5
7Wugui116.0031.16277−55.6−8.5512.8−49.8−7.6611.5
8Manshui116.0731.20212−55.6−8.2910.7−49.4−7.5510.9
9Shiyangm116.1931.15706−61.3−9.1912.2−56.9−8.6912.6
11Shiyang116.2131.24217−58.6−8.8011.8−52.1−8.0512.3
13 116.3031.25154−55.8−8.5312.4−49.8−7.8813.2
14Maotan115.9931.31260−56.2−8.4411.3−58.3−8.7511.7
16Qingtan116.3831.17192−59.6−9.0913.1−53.3−8.2412.6
19Saozhou116.4731.27274−54.8−8.6514.4−50.8−7.8011.6
21 116.3531.24123−61.0−9.2413.0−64.3−9.5912.4
20Saozhou116.4131.25174−53.7−8.3913.4−49.2−7.4510.4
23Kongjia116.1831.36125−57.9−9.0414.4−51.9−8.1213.1
25Kongjia116.2431.3994−57.1−8.7913.2−51.6−7.9512.1
28Danjiamiao116.4631.36132−52.4−8.1412.7−47.1−7.4012.0
33Huangwei116.3231.16198−60.7−9.3514.1−54.4−8.039.8
34Xiongjia116.3631.4748−50.0−7.7912.2−45.0−6.406.2
Spring water3 115.78 31.13 974−68.8−10.0511.5−60.1−9.0512.3
10 116.21 31.21 367−55.1−8.3611.8−50.9−8.0413.4
17 116.48 31.19 286−51.4−8.1013.4−46.4−7.4112.8
18 116.47 31.29 366−55.7−8.8515.1−49.8−7.9914.1
27 116.47 31.31 244−53.6−8.3913.5−49.9−8.1215.1
Reservoir water2Xianghongdian116.00 31.45 122−58.6−8.438.8−47.8−7.189.6
4 115.8931.24391−60.9−8.668.4−53.9−8.3512.9
5 116.0331.41190−62.8−8.878.2−59.0−8.7310.8
12Baiyunya116.1731.26202−62.0−9.0710.6−52.5−7.678.8
15 116.0931.15376−62.4−9.3412.3−56.1−8.4211.3
22Foziling116.3131.28127−58.8−8.559.6−53.6−7.869.2
24Foziling116.2731.34129−59.5−8.8010.9−51.9−7.709.7
26Banjiezhuizi116.3231.4460−57.9−8.8112.6−58.5−8.459.2
32 115.8831.35263−62.4−9.6915.1−58.9−8.7210.9
Pond water29 116.4731.40133−47.5−6.131.6−40.8−5.05−0.4
30 116.4631.42147−57.9−8.7512.1−44.0−6.417.3
31 116.4631.47113−52.6−7.749.3−47.3−6.081.3
* Log.: longitude; Lat.: latitude; Alt.: altitude; d-excess: deuterium excess.
Table 2. Temperature, humidity, and rainfall in Huoshan, the UPRB [29].
Max. TMin. TAvg. TAvg. HMonthly RainfallRainfall Days
°C°C°C%mmDays
October 201720.012.415.588.8180.216
September 201828.119.523.083.3128.214
* Max. T: mean of the maximum air temperature; Min. T: mean of the minimum air temperature; Avg. T: average air temperature; Avg. H: average relative humidity.
Table 3. Maximum, minimum, and average values of different types of water.
Water Types δ2Hδ18Oδ2Hδ18O
20172018
River waterMin.−61.3−9.35−64.3−9.59
Max.−50.0−7.79−45.0−6.40
Avg.−56.9−8.67−52.8−8.04
Spring waterMin.−68.8−10.05−60.1−9.05
Max.−51.4−8.10−46.4−7.41
Avg.−56.9−8.75−51.4−8.12
Reservoir waterMin.−62.8−9.69−59.0−8.73
Max.−57.9−8.43−47.8−7.18
Avg.−60.6−8.91−54.7−8.12
Pond waterMin.−57.9−8.75−47.3−6.41
Max.−47.5−6.13−40.8−5.05
Avg.−52.7−7.54−44.0−5.85
* Max.: maximum value; Min.: minimum value; Avg.: average value.
Table 4. Electrical conductivity (EC), Na%, sodium absorption ratio (SAR), magnesium hazard (MH), and Kelly’s ratio (KR) values of water samples in the UPRB.
Water TypesNo.EC (μs/cm)Na%SARMHKREC (μs/cm)Na%SARMHKR
20172018
River water112815.55 6.47 12.82 0.20 12414.72 6.23 13.61 0.19
69919.58 7.36 13.14 0.26 11716.08 6.75 13.24 0.22
713120.03 8.74 13.94 0.27 21319.84 7.33 16.52 0.27
816616.52 7.93 13.08 0.21 20815.14 6.25 11.42 0.19
96021.34 5.93 11.60 0.29 6216.06 6.64 12.82 0.21
119618.11 6.59 13.63 0.24 11217.75 5.11 13.78 0.25
138420.38 6.98 17.73 0.28 9815.71 6.79 14.36 0.21
1417114.75 7.14 15.86 0.19 11614.55 6.73 12.66 0.19
167220.50 6.62 12.33 0.29 12018.18 6.75 11.13 0.24
191546.80 2.94 14.86 0.08 17017.24 7.12 10.91 0.23
218019.04 6.35 13.12 0.26 5816.09 6.18 12.57 0.21
2015112.68 5.65 11.99 0.15 17613.59 5.17 13.70 0.18
2311316.06 6.09 14.76 0.21 13615.47 5.42 11.85 0.20
2513615.55 6.53 13.37 0.20 15815.35 6.40 11.98 0.20
281637.64 3.56 7.83 0.09 21413.33 4.22 17.91 0.17
3311115.83 6.03 12.70 0.20 1015.67 2.98 11.90 0.06
3421810.97 6.17 10.36 0.14 2985.65 2.58 8.82 0.06
Spring water34212.78 2.94 9.15 0.16 4619.19 10.83 12.41 0.26
109620.90 7.83 14.22 0.29 966.52 3.11 14.18 0.08
1711622.18 8.79 14.50 0.31 13615.06 10.13 9.71 0.20
183351.95 1.18 22.57 0.02 20714.78 5.69 12.70 0.19
271115.70 2.08 9.09 0.06 15815.28 7.18 18.40 0.24
Reservoir water210714.92 5.69 12.39 0.19 10717.75 7.41 11.98 0.24
49318.18 6.59 11.24 0.24 11916.88 9.29 12.99 0.22
510015.66 5.81 13.67 0.21 9621.08 6.67 11.98 0.30
1210216.63 6.33 13.16 0.22 9912.02 5.97 11.76 0.15
157319.89 6.43 12.62 0.27 907.75 4.03 7.73 0.09
229915.66 5.71 12.75 0.20 9218.49 6.65 12.11 0.25
2411215.18 5.85 12.46 0.20 8915.59 5.26 12.97 0.20
2612415.07 6.17 12.69 0.19 12616.65 6.16 14.86 0.22
327419.09 6.02 13.76 0.27 10021.69 9.62 14.54 0.30
Pond water2916712.79 6.61 15.40 0.19 14815.84 4.73 16.52 0.21
3010713.23 4.55 17.04 0.17 10117.13 4.76 7.40 0.24
318417.81 5.49 14.06 0.24 7217.82 6.62 12.82 0.24

