Article

Health Risk Assessment of Inorganic Mercury and Methylmercury via Rice Consumption in the Urban City of Guiyang, Southwest China

1
College of Resources and Environmental Engineering, Guizhou University, Guiyang 550003, China
2
School of Chemistry and Material Science, Guizhou Normal University, Guiyang 550001, China
3
Key Laboratory for Information System of Mountainous Area and Protection of Ecological Environment of Guizhou Province, Guizhou Normal University, Guiyang 550001, China
*
Authors to whom correspondence should be addressed.
Int. J. Environ. Res. Public Health 2019, 16(2), 216; https://doi.org/10.3390/ijerph16020216
Submission received: 29 November 2018 / Revised: 29 December 2018 / Accepted: 8 January 2019 / Published: 14 January 2019
(This article belongs to the Section Environmental Health)

Abstract

:
Rice consumption is the main methylmercury (MeHg) exposure route for residents in mercury (Hg) mining areas. However, there is limited studies on mercury in commercial rice, which has high liquidity and can be directly consumed by urban residents. This study measured the total Hg (THg) and MeHg concentrations in 146 rice samples purchased from the markets in Guiyang city, southwest China, and both the inorganic Hg (IHg) and MeHg estimated daily intakes (EDIs) and hazard quotients (HQs) were calculated according to rice consumption. The THg concentrations in all rice samples (range: 0.97 to 13.10 μg·kg−1; mean: 3.88 μg·kg−1) were lower than the Chinese national standard (20 μg·kg−1). The average MeHg concentration in rice was 1.16 μg·kg−1. The total HQs (THQs) ranged from 0.0106 to 0.1048, with a mean of 0.0462, which was far lower than 1. This result suggests that there were low Hg exposure levels through consumption of commercial rice in residents of Guiyang.

1. Introduction

Mercury (Hg), one of the most toxic heavy metal pollutants, has been a public concern since the recognition of Minamata disease in 1956. Both inorganic and organic Hg exist in the environment. Inorganic Hg (IHg) is much less toxic than methylmercury (MeHg) to humans [1], and the absorption rate of IHg in food by the human, which is about 8% [1,2,3,4], also much less than that of MeHg (95%) [5,6]. MeHg is the most toxic organic form of organic Hg; MeHg can cross the blood-brain barrier and through placenta in humans after entering the body, causing permanent damage to the central nervous system [1,7]. The Minamata Convention, formulated by the United Nations Environment Programme, came into effect on August 16, 2017, which aimed at controlling and reducing mercury emissions globally. Fish consumption is considered to be the primary route of human MeHg exposure [6,8]; however, recent studies have reported that rice consumption is the main MeHg exposure pathway for local residents in Hg mining regions due to elevated MeHg concentrations [2,5,9,10].
As a staple food, rice constitutes 20 percent of the total food energy intake of the world’s population [11]. In Asia, the energy from rice and its by-products contributes to over 70% of residents’ daily dietary intake [12]. Studies have found that rice that grown in Hg mining areas can accumulate high concentrations of MeHg in grain, and concentrations of MeHg as high as 174 μg·kg−1 were recorded in brown rice, approximately 2–3 orders of magnitude higher than that in the edible parts of other crops [9,13].
Within the last decade, studies of Hg rice exposure have mainly concentrated on Hg-polluted areas, particularly at abandoned Hg mining regions in Guizhou Province, southwest China. Horvat et al. [13] first confirmed the high contamination of rice with Hg (highest concentration: 569 μg·kg−1 for THg; 145 μg·kg−1 for MeHg) in the Wanshan Hg mine in Guihou Province. Feng et al. [5] first reported a significant correlation between the estimated rice MeHg intake and hair MeHg levels in the Wanshan Hg mining region, suggesting that rice consumption was the main pathway of MeHg exposure for local populations. Recently, Li et al. [14] reported that Hg exposure via rice consumption in the Wanshan region was comparable to that via a fish diet.
With China’s rapid economic development, populations living in urbanized areas have increased quickly, and their food diets are mainly commercial rice from local markets. To date, however, few studies have been conducted on rice Hg, especially on rice MeHg in rice the markets, which is directly consumed by urban residents. Shi et al. [15] investigated THg (mean: 23 μg·kg−1, range: 6.3–39.3 μg·kg−1) and MeHg (mean: 4.7 μg·kg−1, range: 1.9–10.5 μg·kg−1) concentrations in 25 rice samples from 15 provinces in China. Qian et al. [16] thoroughly investigated THg (mean: 5.8 μg·kg−1, range: 0.02–31 μg·kg−1) concentrations in 712 samples from Chinese markets. Li et al. [17] investigated THg (mean: 10.1 μg·kg−1, range: 0.86–47.2 μg·kg−1) and MeHg (mean: 2.47 μg·kg−1, range: 0.13–18.2 μg·kg−1) concentrations in 284 rice samples from the markets of 7 provinces in China. Huang et al. [18] studied rice Hg (mean: 5 μg·kg−1, range: <5–88 μg·kg−1) from markets in Zhejiang province. Nearly all the studies existed rice Hg pollution, exceeding maximum value of 20 μg·kg−1 recommended by the Ministry of Public Health of China [19]. Although many studies on Hg exposure via rice consumption have been conducted in Guizhou province, which is the largest Hg producing province in China, little attention has been paid to Hg exposure via consumption of commercial rice from markets.
Therefore, Guiyang was selected as the study area, and market rice from Guiyang was collected. The purpose of this study was to assess the health risks of both inorganic Hg (IHg) and MeHg exposure in association with the consumption of commercial rice from markets in Guiyang City, the capital city of Guizhou Province. We aimed to examine and calculate (1) the concentrations of THg and MeHg in commercial rice; (2) the estimated values of the daily intakes (EDIs) of MeHg and inorganic mercury (IHg) via rice consumption; and (3) the hazard quotients (HQs) and total hazard quotients (THQs). The results will provide a better understanding of the MeHg and IHg exposure risks via consumption of commercial rice in Guiyang City, southwest China.

2. Methods and Materials

2.1. Study Area

Guiyang (106°07′ E–107°17′ E; 26°11′ N–26°55′ N) is the capital of Guizhou Province, southwest China, with an altitude of approximately 1100 meters. The annual mean temperature is 15.3 °C. The annual average relative humidity is 77%. The annual mean rainfall is 1129.5 mm. Guiyang City has a population of approximately 4.8 million, whose staple food is rice. In 2016, the output of rice in Guiyang was 17,810 tons, accounting for about 40% of the total output of cereal crops. And the per capita consumption of rice is 61.53 kg·year−1 (169 g·d−1), occupying approximately 58% of the total food consumption.

2.2. Sample Collection and Preparation

A total of 146 white rice samples (84 brands) were purchased from markets in Guiyang from July 22 to August 22 in 2017. The samples covered both Chinese domestic (n = 137) and imported rice (n = 9, from Cambodia, Vietnam and Thailand). According to the package information, rice samples were briefly categorized into two main subspecies—Japonica and Indica. All of the rice samples collected from the markets were transported to the laboratory, rinsed with ultrapure water, freeze-dried, ground with a grinder (IKA-A11, IKA, Staufen, Germany), and stored in plastic bags for analysis.

2.3. Analytical Methods

For THg analysis, approximately 0.5 g dry rice samples were weighed and were then digested at 95 °C in a water bath with a fresh mixture of HNO3 and H2SO4 (4:1, v/v). The THg concentrations in rice samples were determined by BrCl oxidation, SnCl2 reduction, purging, gold amalgamation, and cold vapour atomic fluorescence spectrometry (CVAFS) detection following Method 1631e [20].
For MeHg analysis, approximately 0.5 g of dry rice samples were weighed for digestion using 25% KOH-methanol/solvent extraction at 80 °C in a water bath. During extraction, acidification was needed after digestion of the rice sample. Then, MeHg in rice samples was extracted with dichloromethane and back-extracted into water. Finally, the concentration of MeHg was measured by gas chromatography (GC)-CVAFS according to Method 1630 [21]. IHg was obtained by the difference between THg and MeHg.

2.4. Quality Assurance and Quality Control

The standard reference materials (GBW(E)100359 for THg; TORT-2 for MeHg), duplicates, and method blanks were used for data quality control. The rice samples were measured in three replicates. The recoveries of THg and MeHg in the certified reference material ranged from 93% to 110% and from 90% to 115%, respectively. The detection limits for THg and MeHg were 0.013 μg·kg−1 and 0.003 μg·kg−1, respectively.
All acids, so as HNO3, H2SO4 and HCl (Sinopharm, Shanghai, China) used in the analysis were ultra-pure grade, and all other reagents, like KOH, were of an analytically pure grade. The CH2Cl2 (Tedia, Fairfield, OH, USA) was Chromatographic pure grade. The Hg concentrations was mensurated by the Tekran 2500 (Tekran Inc., Toronto, ON, Canada). The Brooks Rand Model III (Brooks Rand, Seattle, WA, USA) was used to measure the MeHg concentrations. The water used in the analysis was double-deionized water (DDW). All of the glassware was soaked in nitric acid for more than 24 h and washed with DDW.

2.5. Assessment of Human Health Risk

The estimated daily intakes (EDI) of MeHg and IHg were calculated based on the concentrations of MeHg and IHg in milled rice and rice consumed per capita according to Equation (1). The non-cancer health hazard was estimated by employing hazard quotient (HQ) Equations (2) and (3). The health risk of Hg exposure through rice consumption was estimated according to the total hazard quotient (THQ), which was calculated by Equation (4):
EDI = ( E F × E D × C × IR × 10 3 ) / ( bw × T A )
HQ MeHg = EDI / RfD
HQ IHg = EDI / PTWI
THQ = HQ MeHg + HQ IHg
EDI is given in micrograms per kilogram of body weight per day (μg·kg−1·d−1); bw (body weight) is the average weight of the adult population. EF is the exposure frequency (365 days/year); ED is the exposure duration (70 years) and equal to the average lifetime; TA is the average exposure time for non-carcinogens (365 days/year × number of exposure years, assuming 70 years in this study) [16,22]; C are the IHg and MeHg concentrations in milled rice (μg·kg−1); IR is the daily intake rate of rice; HQ is the hazard quotient; RfD is the reference dose for the substance; PTWI is the provisional tolerable weekly intake of inorganic mercury; and THQ is the total hazard quotient. In this study, bw is 60 kg [9]; IR is 169 g·d−1 [23]. RfD is 0.1 μg·kg−1·d−1 [1], indicating the maximum dose of the compound (μg·kg−1·d−1) below which there is no known hazard of health effects. The PTWI is 0.57 μg·kg−1·d−1 (equal to 4 μg·kg−1·week−1) [24,25]. HQ and THQ were used to estimate the non-cancer health hazard. When the value is >1, it indicates a potential health risk due to Hg exposure from rice consumption. If the value is <1, it is assumed to be safe according to the risk of non-carcinogenic effects. If the HQ exceeds one, there is a chance that non-carcinogenic effects may occur, with a probability which tends to increase as the value of HQ increases [26].

2.6. Statistical Analysis

Statistical analysis of THg and MeHg in rice was performed using Excel 2016 (Microsoft, Redmond, WA, USA), Origin 8.0 (Originlab, Northampton, MA, USA) and SPSS 22.0 (IBM, Armonk, NY, USA). Pearson correlation was employed to study the correlation coefficients. Independent-sample t tests were performed to indicate the significance of the average values of THg and MeHg in rice.

3. Results and Discussion

3.1. THg and MeHg in Rice

3.1.1. Whole Market Samples

The THg concentrations in all rice samples ranged from 0.97 to 13.1 μg·kg−1, with a mean of 3.88 μg·kg−1. The THg concentrations in this study were lower than the maximum value of 20 μg·kg−1 recommended by the Ministry of Public Health of China [19].
Compared with the previously reported Hg values in rice from Chinese markets, the average value of 3.88 μg·kg−1 (n = 146) in rice from Guiyang market that we found was slightly lower than that reported data for THg in rice in China. In Zhoushan Island, the mean THg concentration was 9 μg·kg−1 (n = 6) [26]. Qian et al. [16] reported that the THg concentrations ranged from <0.02 to 31 μg·kg−1, with a mean of 5.8 μg·kg−1 (n = 712), in rice from markets in 20 provinces. In Jiangsu province, the THg concentrations ranged from 1.0 to 13 μg·kg−1, with a mean of 5.7 μg·kg−1 (n = 23) [27]. Li et al. [17] reported that the rice concentration from 7 provinces ranged from 0.86 to 47.2 μg·kg−1, with a mean of 10.1 μg·kg−1. Huang et al. [18] reported a mean THg concentration of 5 μg·kg−1 (n = 224) in rice from Zhejiang province. Interestingly, there is a decreasing trend of Hg in rice from markets.
For MeHg, the concentration varied from 0.069 to 2.68 μg·kg−1, with a mean of 1.16 μg·kg−1. The proportions of MeHg to THg were found to be high, reaching up to 76%, with a mean of 32.96%. Compared with the reported MeHg values in rice from nationwide markets, our results were low. Shi et al. [15] reported that the MeHg concentrations of rice from 15 provinces ranged from 1.9 to 10.5 μg·kg−1, with an average of 4.7 μg·kg−1. Li et al. [17] reported that the MeHg concentrations of rice (n = 284) from 7 provinces ranged from 0.13 to 18.2 μg·kg−1, with a mean of 2.47 μg·kg−1. In Changshun, for instance, the average MeHg concentration in rice was 2.5 μg·kg−1 (0.80–4.3μg·kg−1) [5], in Huaxi it was 2.9 μg·kg−1 (1.8–4.5 μg·kg−1) [28], and in Leigong it was 2.1 μg·kg−1 [10].
Our results for both THg and MeHg were comparable or slightly lower than results reported from markets abroad (Figure 1). Batista et al. [29] reported that the THg concentrations of 44 rice samples in Brazilian market varied from 0.3 to 13.4 μg·kg−1, representing most brands in the whole country. The THg and MeHg concentrations of rice samples collected from the supermarkets of Kampong city in Cambodia were in the range of 6.16–11.7 μg·kg−1 (a mean of 8.14 μg·kg−1) and 1.17–1.96 μg·kg−1 (a mean of 1.44 μg·kg−1) [30], respectively. Recently, Brombach et al. [31] reported that the THg and MeHg concentrations of 87 rice samples purchased in supermarkets in the United Kingdom, Germany and Switzerland were 3.04 ± 2.7 μg·kg−1 and 1.91 ± 1.07 μg·kg−1, respectively.

3.1.2. Variations in Brands

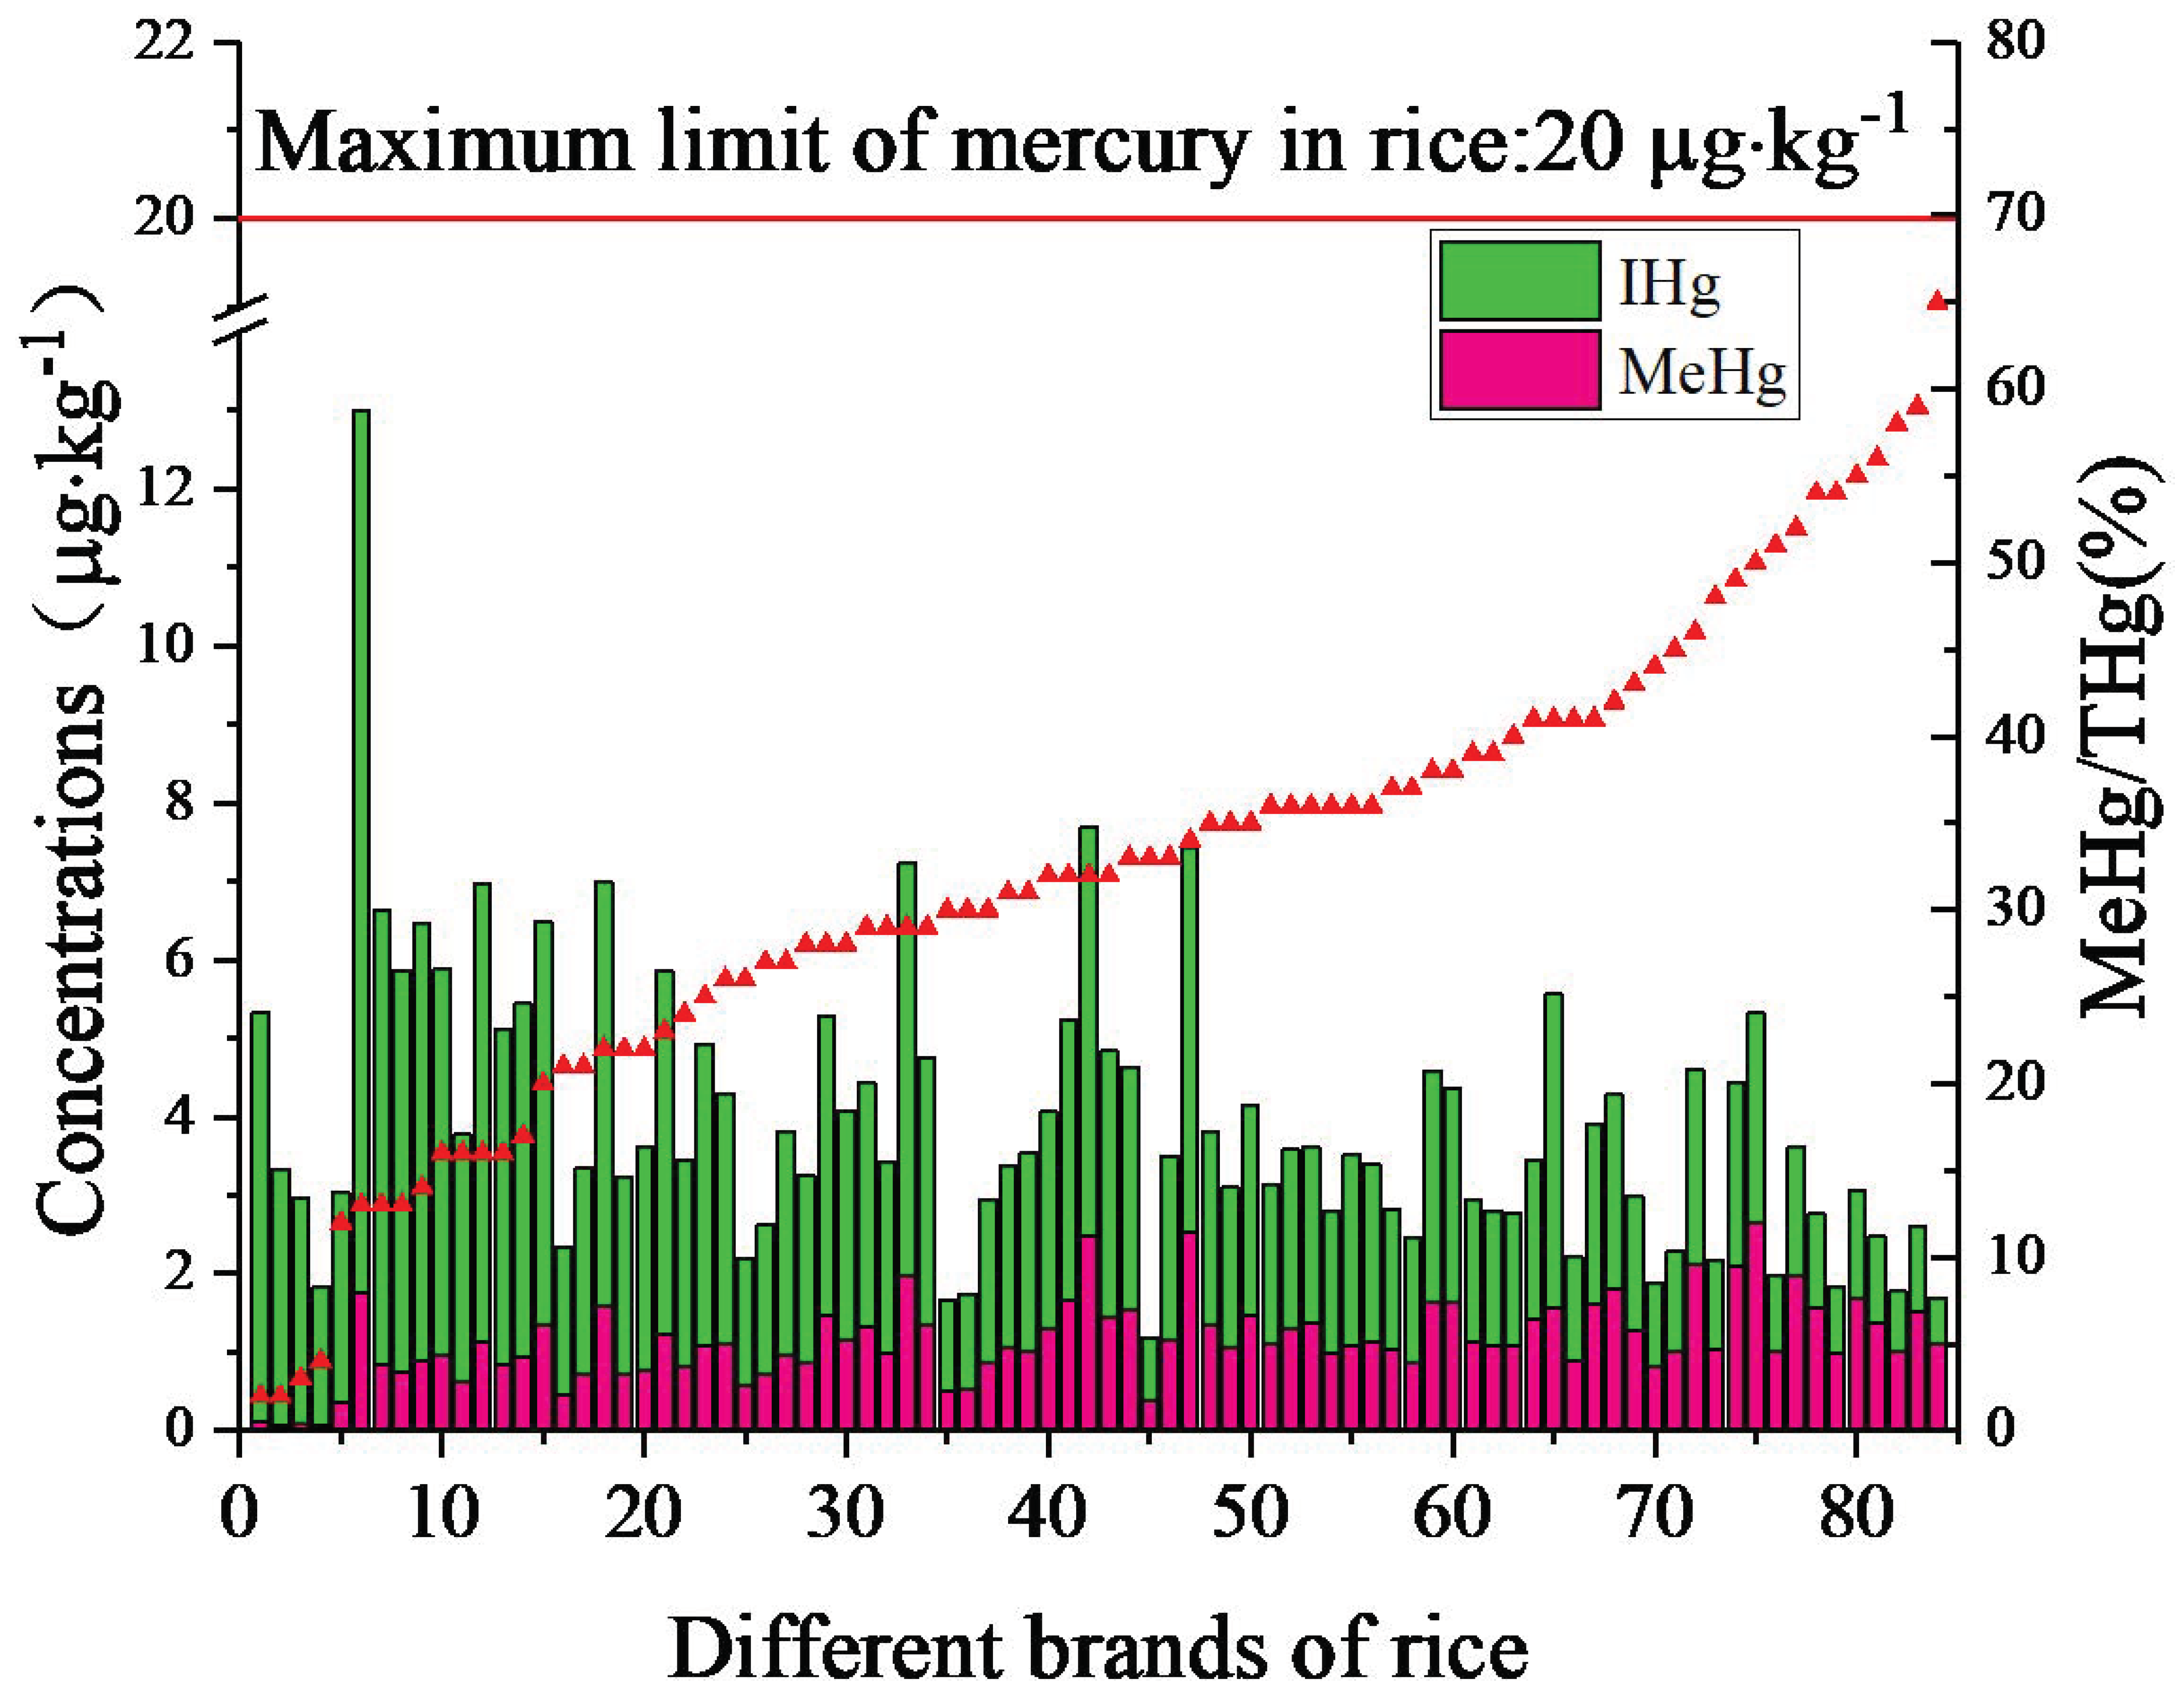
The THg concentrations in rice of all different brands exhibited a wide range of 1.17–13 μg·kg−1 (Figure 2). The top ten brands with high THg concentrations were Hubeiruandingyoumi (HBRD), Taiguoxiangmi (TGXM), Hubeiruanxiangmi (HBRX), Tianfeng (TF), Huangjiadaochang (HJDC), Beiwangguo (BWG), Xingli (XL), Longyuan (LY), Tianxiaxian (TXX), and Shinong (SN), with the highest value of 13 μg·kg−1 recorded in HBRD. By contrast, the brands of Meinanxiang (MNX), Pingbazhuyexiangmi (PBZY), Baofa (BF), Xiangnalan (XNL), Tianxiaan (TXA), Yuyepai (YYP), Weipanwang (WPW), Daijiaxiang (DJX), Shudaoxiang (SDX) and Yongzhize (YZZ) exhibited the lowest THg concentrations, less than 2.5 μg·kg−1. The lowest value of 1.17 μg·kg−1 was observed in MNX, which was approximately one order of magnitude lower than the highest value of HBRD.
The MeHg concentrations in the samples ranged from 0.07–2.64 μg·kg−1. The top ten brands with high MeHg concentrations were HBDM, HBRX, TGXM, Yuchuliang (YCL), Jingxiong (JX), Jinyuanbao (JYB), TF, Mangyegu (MYG), HBRD and Tianqu (TQ). The highest value of 2.64 μg·kg−1 was found in the HBDM brand, and YYP exhibited the lowest value of 0.07 μg·kg−1, which was approximately 35 times lower than the highest value. Among the brands, 53 brands exceeded 1 μg·kg−1, with only 8 brands, YYP, Fengxin (FX), Mengxiang (MX), Qianlvchun (QLC), Lvhui (LH), MNX, Qianhui (QH) and Pingbazhuyexiangmi (PBZY), showing values of MeHg less than 0.5 μg·kg−1.

3.1.3. Variations in Types

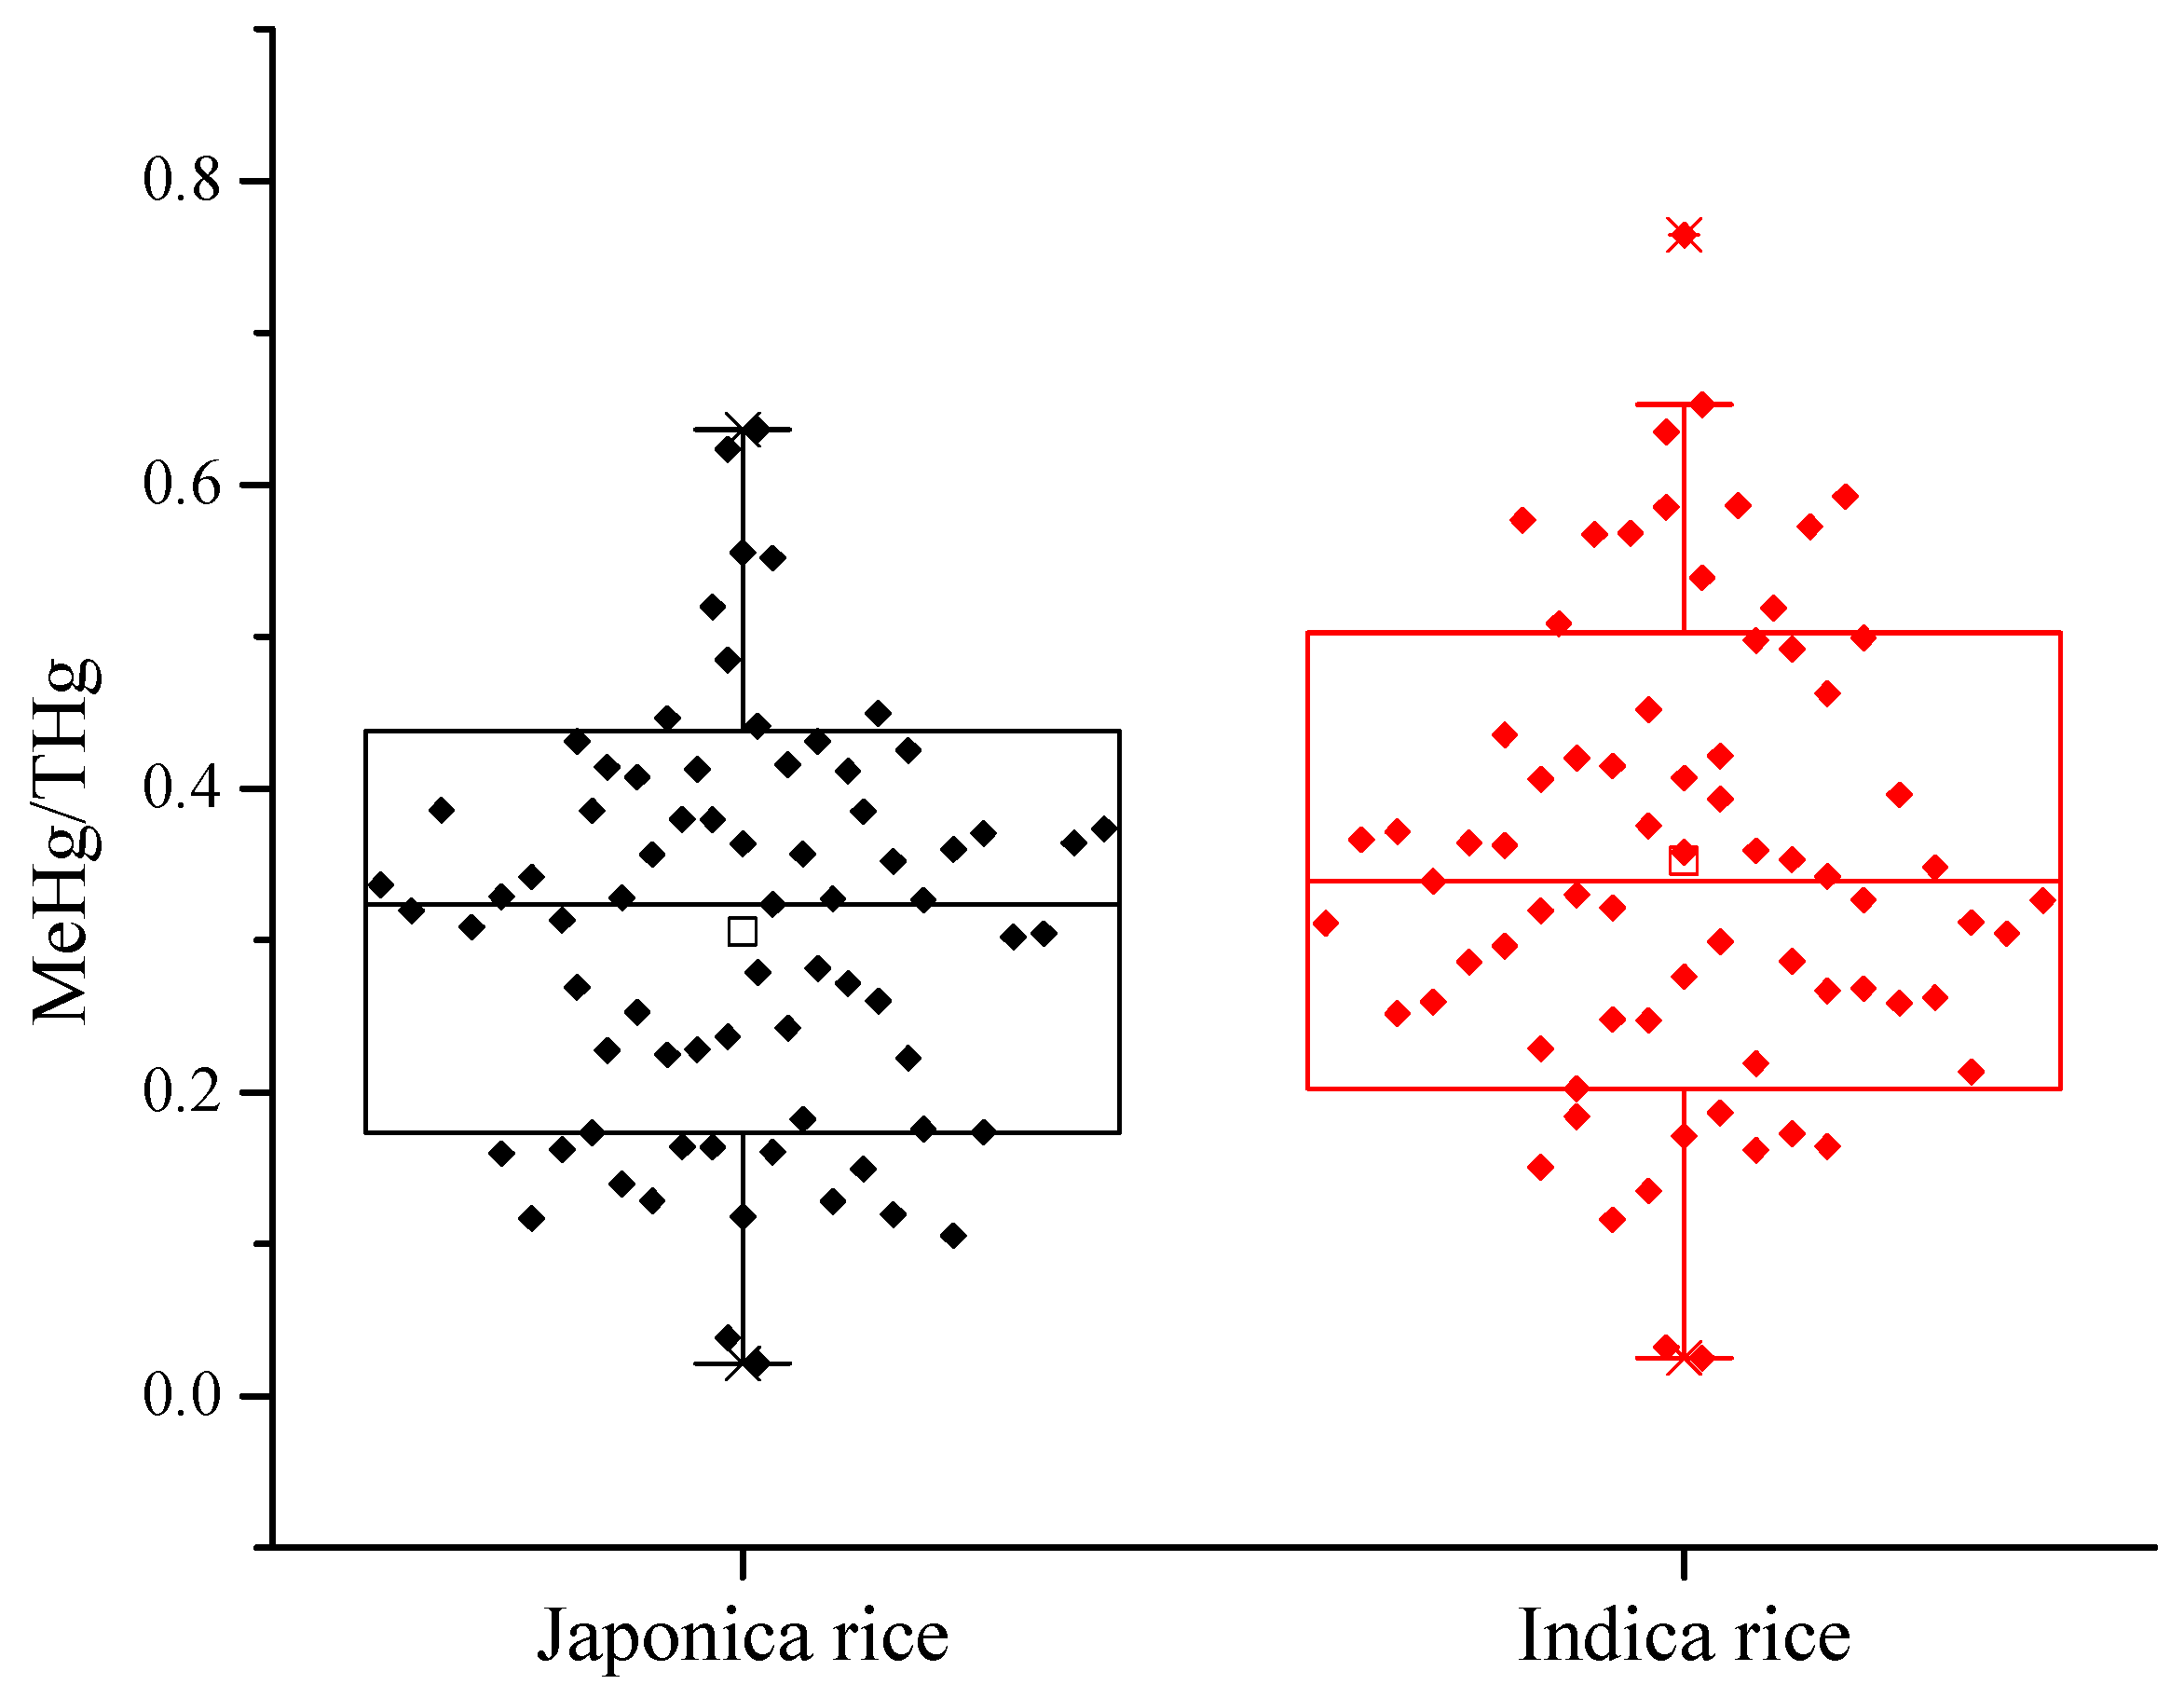
The average THg concentrations of Japonica and Indica rice were 3.96 ± 1.88 and 3.80 ± 1.90 μg·kg−1, respectively. The MeHg concentrations of Japonica and Indica rice were 1.10 ± 0.48 and 1.22 ± 0.57 μg·kg−1, respectively (Table 1). The proportion of MeHg to THg in Japonica rice (31 ± 13%) was slightly lower than that in Indica rice (35 ± 15%) (Figure 3). No significant difference of the THg (t test, p = 0.61) and MeHg (t test, p = 0.17) concentrations between Japonica rice and Indica rice were observed in the present study.
The THg concentrations in Japonica rice were similar to those in Japonica rice (n = 24) (mean: 3.46 μg·kg−1; range: 0.73–10 μg·kg−1), as reported by Brombach et al. [31]; however, the MeHg concentrations of Japonica rice (1.63 μg·kg−1) were slightly higher than those found in the present study. Previous studies reported that different rice types may influence the MeHg concentrations in rice [27,33,34].

3.2. Risk Assessment via Rice Consumption

The EDIs of IHg via rice consumption in the present study ranged from 0.0012 to 0.0326 μg·kg−1·d−1, with a mean of 0.0076 μg·kg−1·d−1. Compared to the Wanshan mining area, these values were 1–2 orders of magnitude lower than those reported by Li et al. [2], in which the EDIIHg values through rice consumption in two sites were 0.3191 and 0.1632 μg·kg−1·d−1, respectively.
The EDIIHg values determine through consuming Japonica rice were 0.0027–0.0326 μg·kg−1·d−1 (0.008 μg·kg−1·d−1), which were in the same range as the EDIIHg values of 0.0012–0.0317 μg·kg−1·d−1, with a mean of 0.0073 μg·kg−1·d−1 via Indica rice consumption (Table 1).
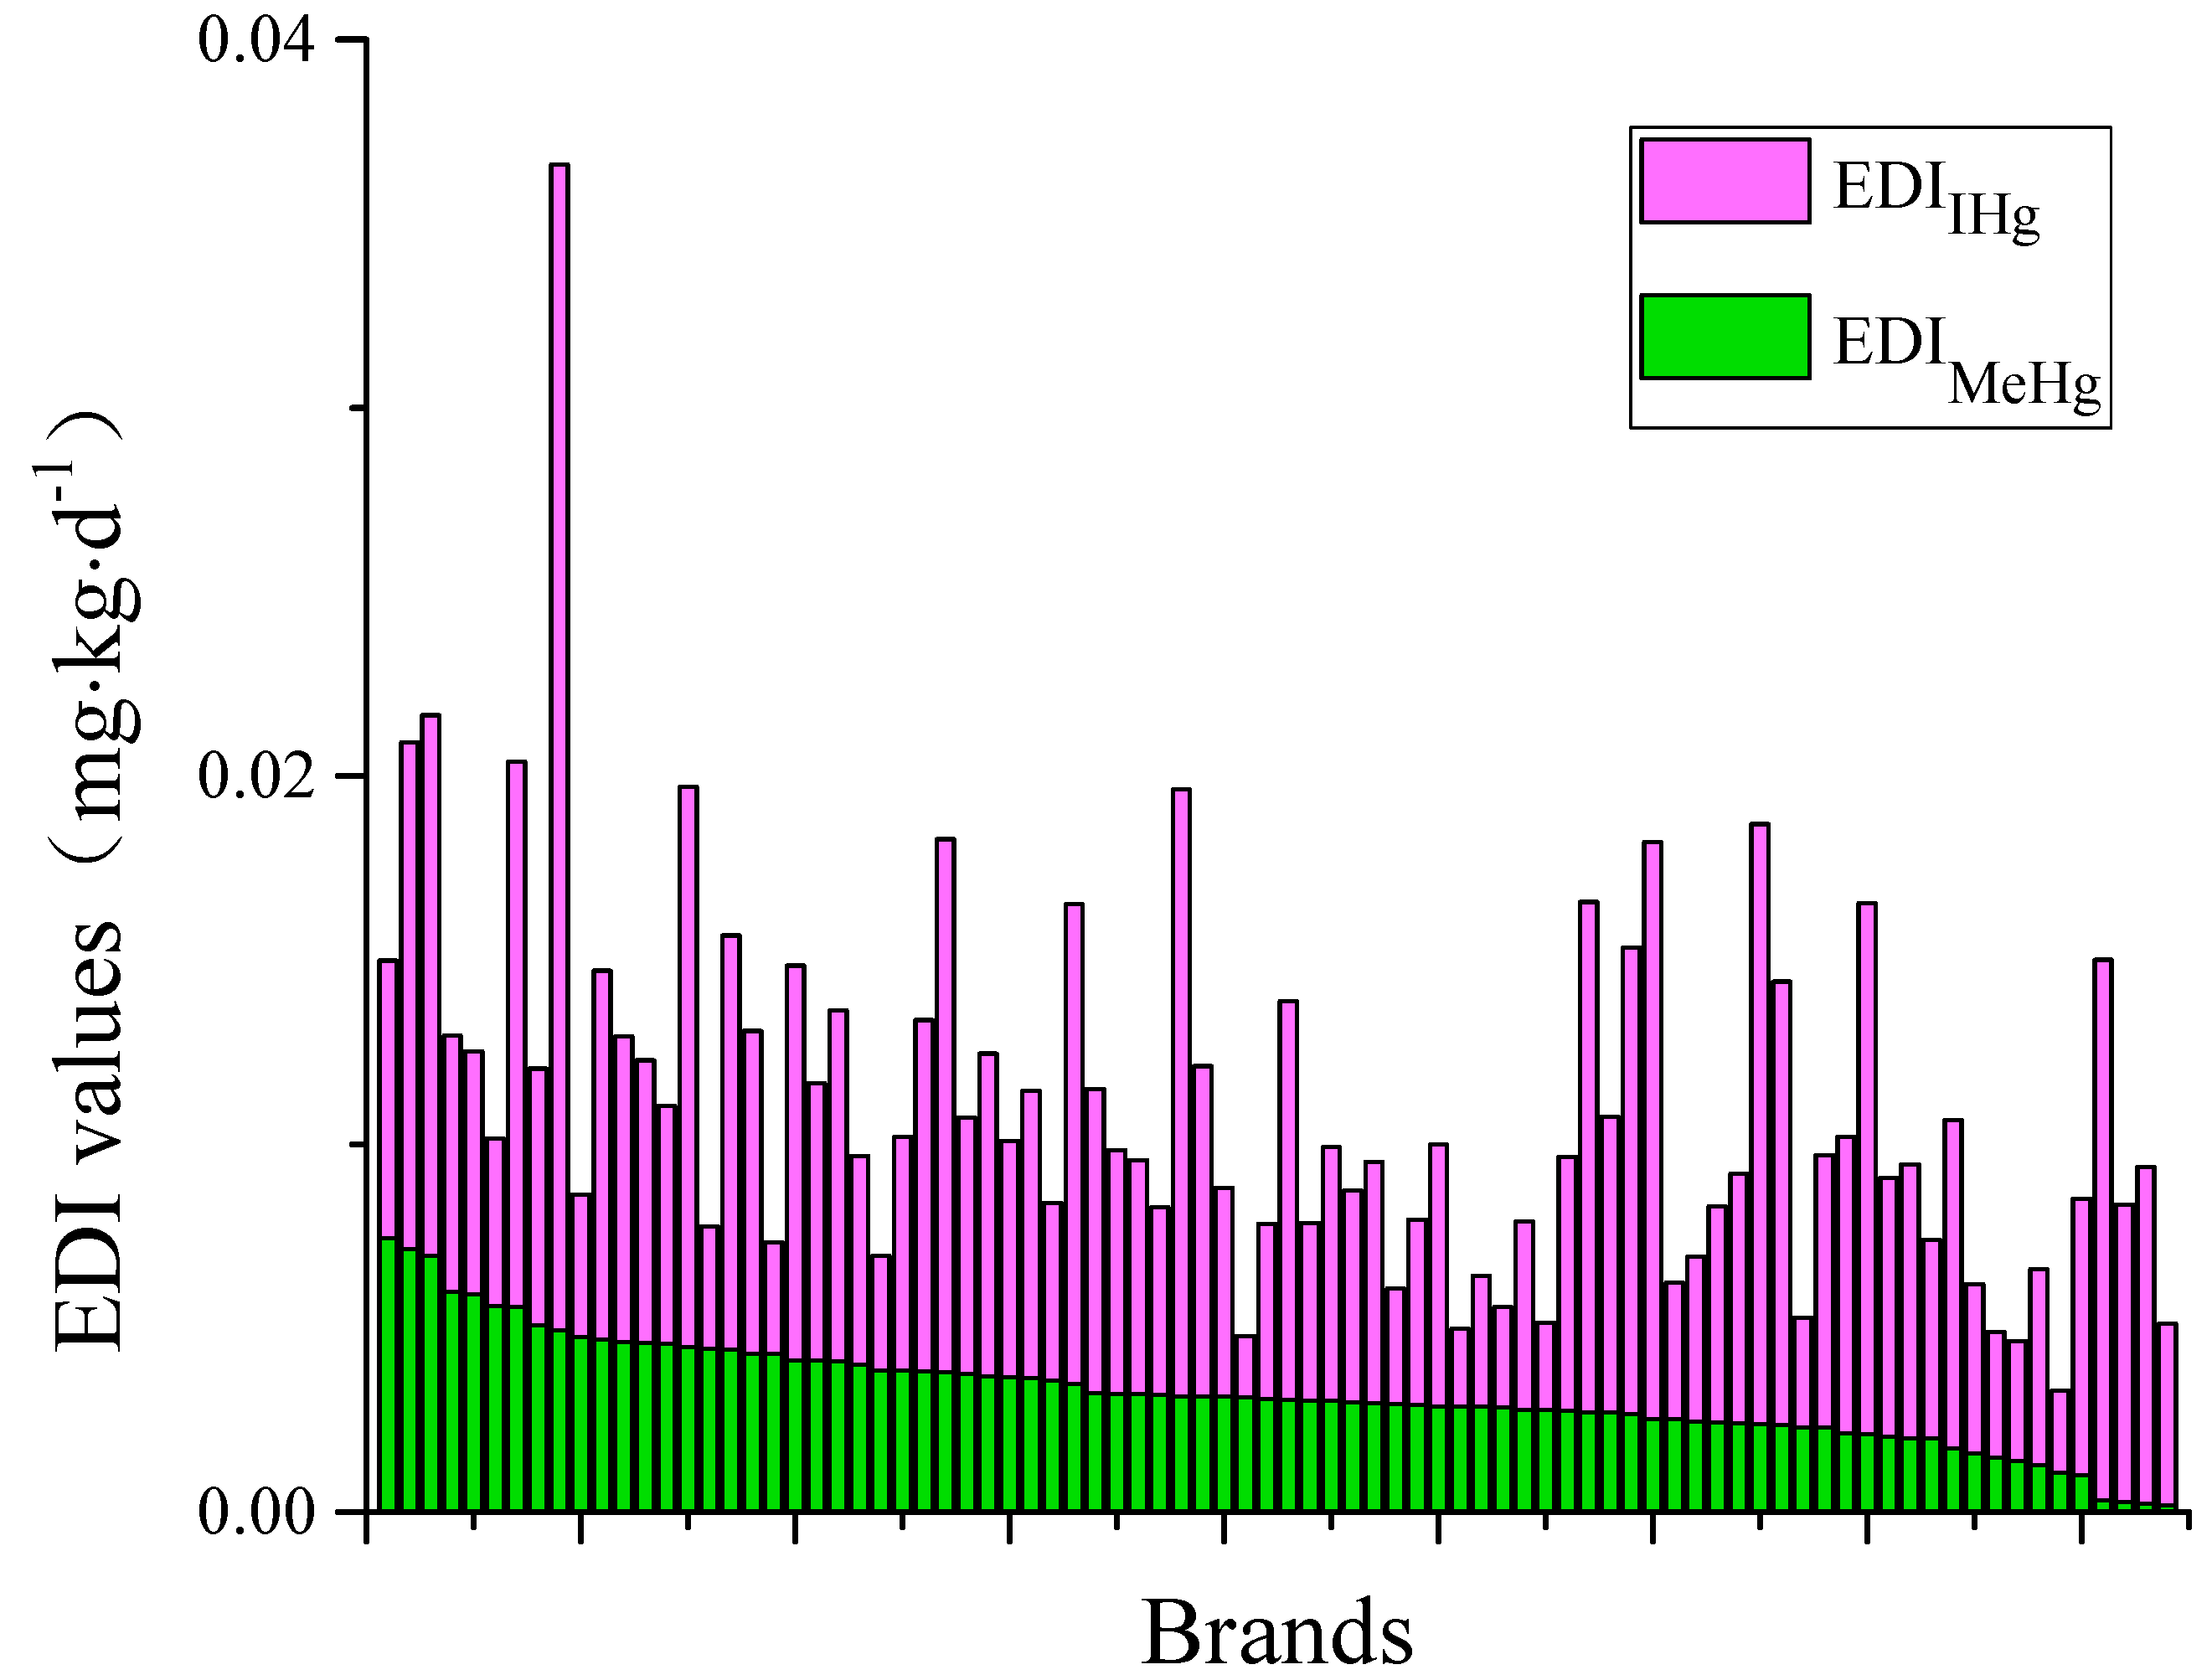
The EDIIHg values of different brands ranged widely, from 0.0017 to 0.0317 μg·kg−1·d−1 (Figure 4). The top ten brands by EDIIHg value were HBRD, BWG, XL, TXX, HJDC, TF, TGXM, QLC, LY and QL, the peak value of 0.0317 g·kg−1·d−1 recorded in HBRD. By contrast, BF, TXA, MNX, WPW, SDX, DJX, XGYJ, AMN, YZZ and PBZY exhibited the lowest EDIIHg values, and the lowest value of 0.0017 g·kg−1·d−1 was found in in BF, which was approximately 18 times lower than the highest value in HBRD.
The HQs of IHg exposure via rice consumption in the present study ranged from 0.0021 to 0.0570, with a mean value of 0.0134, which were one order of magnitude lower than those reported by Li et al. [2]. Considering the different brands, the HQIHg values ranged from 0.0029 to 0.0554, and the HQIHg of Japonica and Indica rice were 0.0047–0.0570 (mean: 0.0141) and 0.0021–0.0554 (mean: 0.0127), respectively. The HQs of IHg exposure via rice consumption in this study were less than 1, which indicated there was no health risk of IHg exposure via rice consumption for residents in Guiyang.
The EDIs of MeHg exposure through rice consumption in the present study were in the range of 0.0002–0.0076 μg·kg−1·d−1. The top ten highest and lowest EDIMeHg values from different brands are showed in Figure 4. These EDIMeHg values in different brands ranged from 0.0002 to 0.0074 μg·kg−1·d−1, with a mean of 0.0033 μg·kg−1·d−1. The highest EDIMeHg value of 0.0074 μg·kg−1·d−1 was found for HBDM, which was approximately 35 times higher than that of the lowest EDIMeHg value for YYP. Considering the types of rice, the EDIMeHg values via consumption of Japonica and Indica rice ranged from 0.0002 to 0.0076 μg·kg−1·d−1, with a mean of 0.0031 μg·kg−1·d−1, and 0.0002–0.0075 μg·kg−1·d−1, with a mean of 0.0034 μg·kg−1·d−1, respectively.
Based on EDIMeHg and RfD, the calculated HQMeHg values in the present study were between 0.0020 and 0.0756. Approximately 90% of the HQMeHg values from the different brands were distributed between 0.0100 and 0.0600 (Table 2). Table 1 showed that the mean HQMeHg values of Japonica rice and Indica rice were 0.0311 (0.0020–0.0756) and 0.0345 (0.0023–0.0750), respectively. In comparison, the EDIs and HQs of MeHg from Japonica rice and Indica rice were within the same range, exhibiting no significant differences.
Compared to the HQMeHg values reported in the literature, our data were comparable or lower than those reported from non-contaminated areas as well as markets. The HQMeHg values found in the present study were lower than the HQMeHg values found in the background site (a mean of 0.13 ± 0.052), as reported by Rothenberg et al. [33]. Li et al. [17] reported the HQ values of MeHg through rice consumption, ranging from 0.04 to 0.08, in 7 provinces in China. The highest HQMeHg value of 0.0756 in this study was far below the highest HQMeHg value of 0.39 via rice consumption of rice purchased from European supermarkets [31]. Moreover, the HQMeHg values for residents in Guiyang were also lower than the HQMeHg values reported for residents of Hg mine areas in China [9,35].
In the present study, the THQ values ranged from 0.0106 to 0.1048, with a mean of 0.0462, which was far below 1. This result might suggest low Hg exposure through the consumption of rice purchased from markets in Guiyang for the residents. Our data suggest that residents should regularly change the brands they consume.

4. Conclusions

The study illustrated the THg and MeHg concentrations in the commercial rice samples from Guiyang. Results showed that THg concentrations were lower than the national tolerance limit of 20 μg·kg−1 in rice, suggesting a safe level of Hg. There was no significant difference in the THg and MeHg concentrations of the different types of rice. Low THQs (<1), based on the EDIs values, indicate the low Hg exposure of rice consumers in Guiyang. Though the generally low concentrations of THg and MeHg in rice from Guiyang markets, we suggest that the residents should consider different brands to avoid relatively high Hg exposure.

Author Contributions

All co-authors have seen and agreed with the contents of the manuscript. The authors’ responsibilities were as follows: J.H., Q.L. and Z.C. conceived and designed the experiments. J.H. and J.P. performed the experiments. L.L. and X.F. contributed materials/analysis tools. J.H. wrote the paper.

Funding

This work was financed by the National Natural Science Foundation of China [41563012], the Department of Science and Technology of Guizhou Province [[2018]5805]. The APC was funded by [[2018]5805].

Acknowledgments

We gratefully acknowledge the support of all persons involved in the project.

Conflicts of Interest

The authors declare no conflict of interest.

References

  1. Clarkson, T.W.; Magos, L. The toxicology of mercury and its chemical compounds. Crit. Rev. Toxicol. 2006, 36, 609–662. [Google Scholar] [CrossRef] [PubMed]
  2. Li, P.; Du, B.Y.; Chan, H.M.; Feng, X.B. Human inorganic mercury exposure, renal effects and possible pathways in Wanshan mercury mining area, China. Environ. Res. 2015, 140, 198–204. [Google Scholar] [CrossRef] [PubMed]
  3. Rahola, T.; Hattula, T.; Korolainen, A.; Miettinen, J.K. Elimination of free and protein-bound ionic mercury (20Hg2+) in man. Ann. Clin. Res. 1973, 5, 214–219. [Google Scholar]
  4. World Health Organization (WHO). Environmental Health Criteria 118: Inorganic Mercury; WHO: Geneva, Switzerland, 1991. [Google Scholar]
  5. Feng, X.; Li, P.; Qiu, G.L.; Wang, S.F.; Li, G.H.; Shang, L.H.; Meng, B.; Jiang, H.M.; Bai, W.Y.; Li, Z.G.; et al. Human exposure to methylmercury through rice intake in mercury mining areas, Guizhou province, China. Environ. Sci. Technol. 2008, 42, 326–332. [Google Scholar] [CrossRef] [PubMed]
  6. World Health Organization (WHO). Methylmercury: Environmental Health Criteria 101; WHO: Geneva, Switzerland, 1990. [Google Scholar]
  7. United States Environmental Protection Agency (USEPA). Mercury Study Report to the Congress, Volume V: Health Effects of Mercury and Mercury Compounds; USEPA: Washington, DC, USA, 1997.
  8. Clarkson, T.W. Mercury: Major issues in environmental health. Environ. Health Perspect. 1993, 100, 31–38. [Google Scholar] [CrossRef]
  9. Qiu, G.; Feng, X.; Li, P.; Wang, S.; Li, G.; Shang, L.; Fu, X. Methylmercury accumulation in rice (Oryza sativa L.) grown at abandoned mercury mines in Guizhou, China. J. Agric. Food Chem. 2008, 56, 2465–2468. [Google Scholar] [CrossRef] [PubMed]
  10. Zhang, H.; Feng, X.; Larssen, T.; Qiu, G.; Vogt, R.D. In inland China, rice, rather than fish, is the major pathway for methylmercury exposure. Environ. Health Perspect. 2010, 118, 1183–1188. [Google Scholar] [CrossRef]
  11. Food and Agriculture Organization of the United Nations (FAO). Rice Is Life. 2006. Available online: http://www.fao.org/newsroom/en/news/2006/1000267/index.html (accessed on 5 November 2018).
  12. Phuong, T.D.; Chuong, P.V.; Khiem, D.T.; Kokot, S. Elemental content of Vietnamese rice. Part 1. Sampling, analysis and comparison with previous studies. Analyst 1999, 124, 553–560. [Google Scholar] [CrossRef]
  13. Horvat, M.; Nolde, N.; Fajon, V.; Jereb, V.; Logar, M.; Lojen, S.; Jacimovic, R.; Falnog, I.; Qu, L.; Faganeli, J.; et al. Total mercury, methylmercury and selenium in mercury polluted areas in the province Guizhou, China. Sci. Total Environ. 2003, 304, 231–256. [Google Scholar] [CrossRef]
  14. Li, P.; Feng, X.; Shang, L.; Qiu, G.; Meng, B.; Zhang, H.; Guo, Y.; Liang, P. Human co-exposure to mercury vapor and methylmercury in artisanal mercury mining areas, Guizhou, China. Ecotoxicol. Environ. Saf. 2011, 74, 473–479. [Google Scholar] [CrossRef]
  15. Shi, J.; Liang, L.N.; Jiang, G. Simultaneous determination of methylmercury and ethylmercury in rice by capillary gas chromatography coupled on-line with atomic fluorescence spectrometry. J. AOAC Int. 2005, 88, 665–669. [Google Scholar] [PubMed]
  16. Qian, Y.Z.; Chen, C.; Zhang, Q.; Li, Y.; Chen, Z.J.; Li, M. Concentrations of cadmium, lead, mercury and arsenic in Chinese market milled rice and associated population health risk. Food Control 2010, 21, 1757–1763. [Google Scholar] [CrossRef]
  17. Li, P.; Feng, X.B.; Yuan, X.B.; Chan, H.M.; Qiu, G.L.; Sun, G.X.; Zhu, Y.G. Rice consumption contributes to low level methylmercury exposure in southern China. Environ. Int. 2012, 49, 18–23. [Google Scholar] [CrossRef] [PubMed] [Green Version]
  18. Huang, Z.; Pan, X.D.; Wu, P.G.; Han, J.L.; Chen, Q. Health risk assessment of heavy metals in rice to the population in Zhejiang, China. PLoS ONE 2013, 8, e75007. [Google Scholar] [CrossRef] [PubMed]
  19. Ministry of Public Health of China. GB 2762-2012 China National Food Safety Standard: Maximum Limit of Contaminants in Food. Available online: http://www.nhfpc.gov.cn/ewebeditor/uploadfile/2013/01/20130128114248937.pdf (accessed on 5 November 2018).
  20. United States Environmental Protection Agency (USEPA). Method 1631: Mercury in Water by Oxidation, Purge and Trap, and Cold Vapor Atomic Fluorescence Spectrometry; USEPA: Washington, DC, USA, 2002; pp. 1–33.
  21. United States Environmental Protection Agency (USEPA). Method 1630: MethylMercury in Water by Distillation, Aqueous Ethylation, Purge and Trap, and CVAFS; USEPA: Washington, DC, USA, 2001; pp. 1–41.
  22. Zheng, N.; Wang, Q.; Zhang, X.; Zheng, D.; Zhang, Z.; Zhang, S. Population health risk due to dietary intake of heavy metals in the industrial area of Huludao city, China. Sci. Total Environ. 2007, 387, 96–104. [Google Scholar] [CrossRef] [PubMed]
  23. MBS. Guiyang Statistical Yearbook—2017; Municipal Bureau of Statistics of Guiyang, Guiyang Statistics Press: Guiyang, China, 2017.
  24. Joint FAO/WHO Expert Committee on Food Additives (JECFA). The Joint FAO/WHO Food Standards Programme, Committee of the Codex Alimentarius Commission, Thirty-Third Session. Available online: http://www.fsis.usda.gov/PDF/2010-CAC/cac33_15e.pdf (accessed on 20 July 2010).
  25. Xu, X.; Meng, B.; Zhang, C.; Feng, X.; Gu, C.; Guo, J.; Bishop, K.; Xu, Z.; Zhang, S.; Qiu, G. The local impact of a coal-fired power plant on inorganic mercury and methyl-mercury distribution in rice (Oryza sativa L.). Environ. Pollut. 2017, 223, 11–18. [Google Scholar] [CrossRef] [PubMed]
  26. Cheng, J.; Gao, L.; Zhao, W.; Liu, X.; Sakamoto, M.; Wang, W. Mercury levels in fisherman and their household members in Zhoushan, China: Impact of public health. Sci. Total Environ. 2009, 407, 2625–2630. [Google Scholar] [CrossRef] [PubMed]
  27. Cao, H.; Chen, J.; Zhang, J.; Hui, Z.; Li, Q.; Yi, M. Heavy metals in rice and garden vegetables and their potential health risks to inhabitants in the vicinity of an industrial zone in Jiangsu, China. J. Environ. Sci. 2010, 22, 1792–1799. [Google Scholar] [CrossRef]
  28. Meng, B.; Feng, X.; Qiu, G.; Cai, Y.; Wang, D.; Li, P.; Shang, L.; Sommar, J. Distribution Patterns of Inorganic Mercury and Methylmercury in Tissues of Rice (Oryza sativa L.) Plants and Possible Bioaccumulation Pathways. J. Agric. Food Chem. 2010, 58, 4951–4958. [Google Scholar] [CrossRef]
  29. Batista, B.L.; Nacano, L.R.; Freitas, R.D.; Oliveira-Souza, V.C.D.; Barbosa, F. Determination of Essential (Ca, Fe, I, K, Mo) and Toxic Elements (Hg, Pb) in Brazilian Rice Grains and Estimation of Reference Daily Intake. Food Nutr. Sci. 2012, 3, 129–134. [Google Scholar] [CrossRef]
  30. Cheng, Z.; Wang, H.S.; Du, J.; Sthiannopkao, S.; Xing, G.H.; Kim, K.W.; Yasin, M.S.M.; Hashim, J.H.; Wong, M.H. Dietary exposure and risk assessment of mercury via total diet study in Cambodia. Chemosphere 2013, 92, 143–149. [Google Scholar] [CrossRef] [PubMed]
  31. Brombach, C.C.; Manorut, P.; Kolambage-Dona, P.P.P.; Ezzeldin, M.F.; Chen, B.; Corns, W.T.; Feldmann, J.; Krupp, E.M. Methylmercury varies more than one order of magnitude in commercial European rice. Food Chem. 2017, 214, 360–365. [Google Scholar] [CrossRef] [PubMed] [Green Version]
  32. Rothenberg, S.E.; Feng, X.; Dong, B.; Shang, L.; Yin, R.; Yuan, X. Characterization of mercury species in brown and white rice (Oryza sativa L.) grown in water-saving paddies. Environ. Pollut. 2011, 159, 1283–1289. [Google Scholar] [CrossRef]
  33. Rothenberg, S.E.; Feng, X.; Zhou, W.; Tu, M.; Jin, B.; You, J. Environment and genotype controls on mercury accumulation in rice (Oryza sativa L.) cultivated along a contamination gradient in Guizhou, China. Sci. Total Environ. 2012, 426, 272–280. [Google Scholar] [CrossRef] [PubMed]
  34. Peng, X.; Liu, F.; Wang, W.X.; Ye, Z. Reducing total mercury and methylmercury accumulation in rice grains through water management and deliberate selection of rice cultivars. Environ. Pollut. 2012, 162, 202–208. [Google Scholar] [CrossRef] [PubMed]
  35. Li, P.; Feng, X.B.; Qiu, G.L.; Shang, L.H.; Wang, S.F. Mercury exposure in the population from Wuchuan mercury mining area, Guizhou, China. Sci. Total Environ. 2008, 395, 72–79. [Google Scholar] [CrossRef] [PubMed]
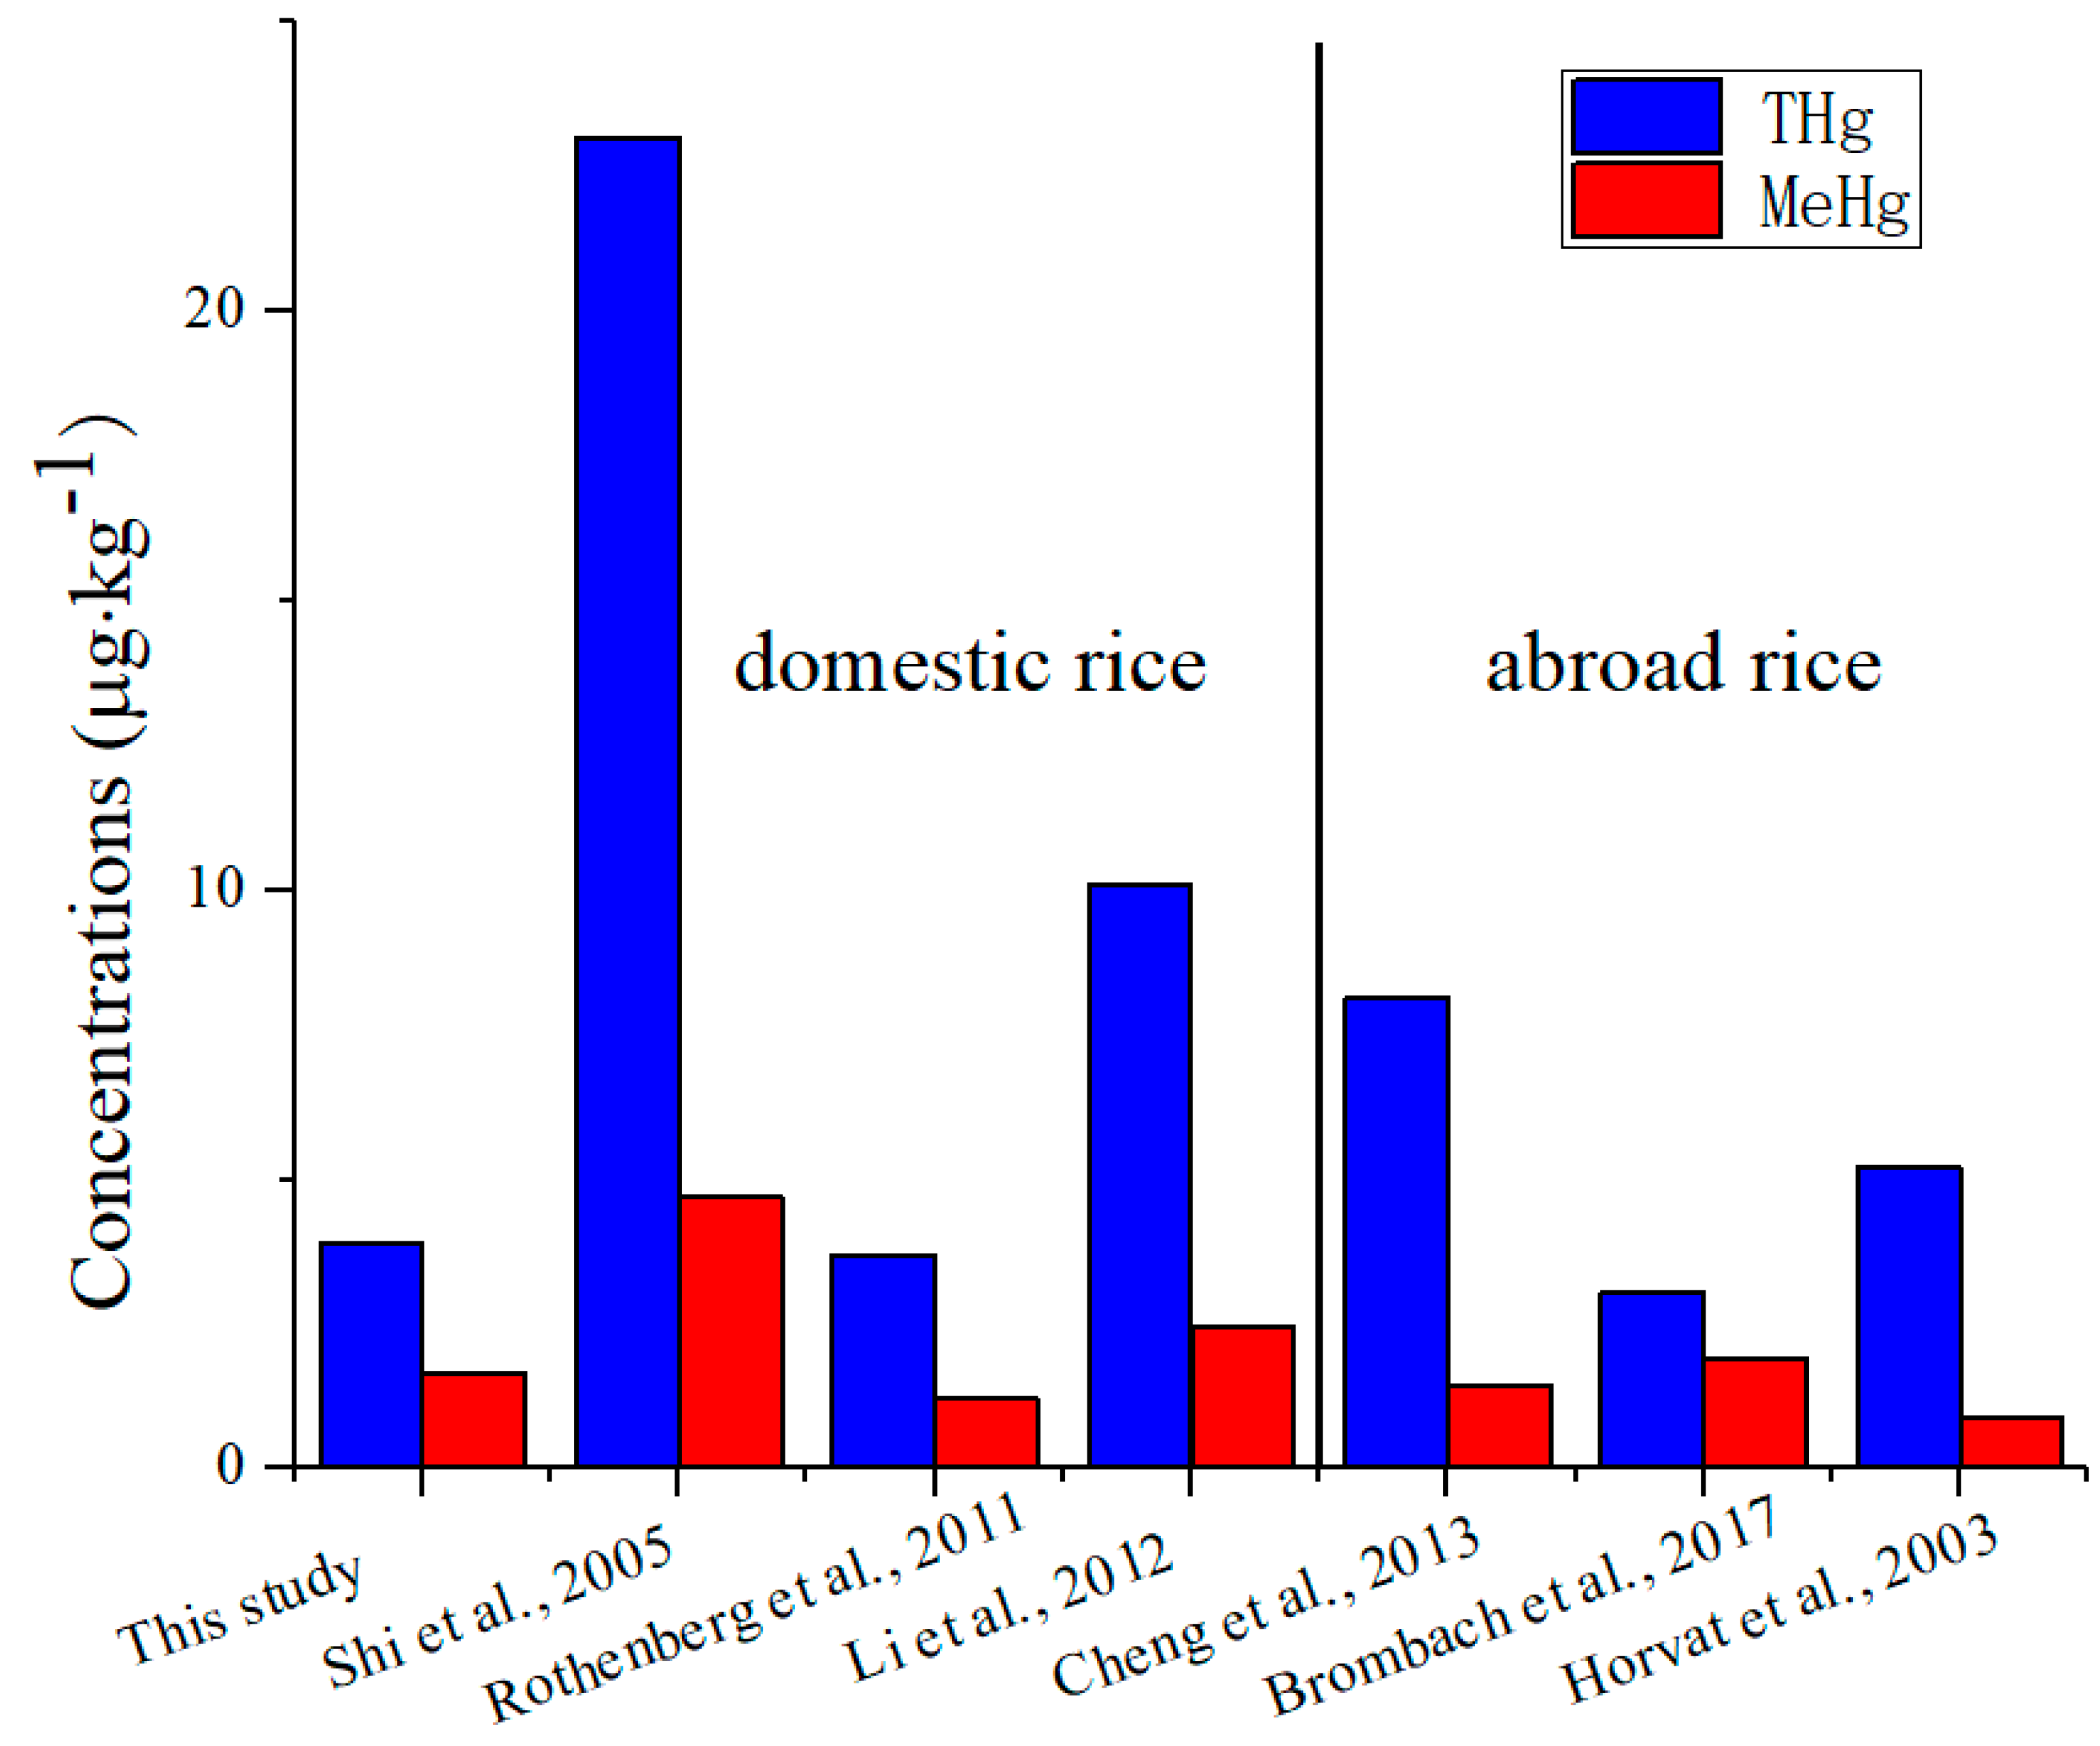
Figure 1. The THg and MeHg concentrations from rice in different study. Note: The samples collected by Horvat et al. were from Italy [13]; by Shi et al. from 15 provinces of China [15]; by Li et al. from 7 provinces in southern China [17]; by Cheng et al. from Cambodia [30]; by Brombach et al. from the Europe [31] and by Rothenberg et al. from Hubei province in China [32].
Ijerph 16 00216 g001
Figure 2. The THg and MeHg concentrations, %MeHg (of THg) of different brands rice.
Ijerph 16 00216 g002
Figure 3. The proportion of the MeHg to THg in Japonica and Indica rice.
Ijerph 16 00216 g003
Figure 4. The EDI (estimated daily intakes) value from the different brands of rice.
Ijerph 16 00216 g004
Table 1. The mean values of THg, MeHg, MeHg/THg, IHg, EDI and HQ of MeHg and IHg, and THQ in Japonica and Indica rice.
TypesTHg
(μg·kg−1)
MeHg
(μg·kg−1)
MeHg/THg
(%)
IHg
(μg·kg−1)
EDIMeHg
(μg·kg−1·d−1)
HQMeHgEDIIHg
(μg·kg−1·d−1)
HQIHgTHQ
Japonica rice
(n = 73)
3.96
(1.71–13.10)
1.10
(0.07–2.68)
31
(2–64)
2.86
(0.96–11.56)
0.0031
(0.0002–0.0076)
0.0311
(0.0020–0.0756)
0.0080
(0.0027–0.0326)
0.0141
(0.0047–0.0570)
0.0452
(0.0106–0.1004)
Indica rice
(n = 73)
3.80
(0.97–13.00)
1.22
(0.08–2.66)
35
(2–76)
2.57
(0.42–11.25)
0.0034
(0.0002–0.0075)
0.0345
(0.0023–0.0750)
0.0073
(0.0012–0.0317)
0.0127
(0.0021–0.0554)
0.0472
(0.0147–0.1048)
Table 2. The mean values of THg, MeHg, MeHg/THg, IHg, HQ of MeHg and IHg, and THQ indifferent brands of rice.
BrandsTHg
(μg·kg−1)
MeHg
(μg·kg−1)
MeHg/THg
(%)
IHg
(μg·kg−1)
HQMeHgHQIHgTHQ
AMN (n = 1)2.47 ± 0.021.37 ± 0.2256%1.10 0.0386 0.0054 0.0440
BDH (n = 2)5.22 ± 0.701.67 ± 0.1732%3.55 0.0469 0.0175 0.0644
BF (n = 1)1.70 ± 0.281.11 ± 0.0865%0.59 0.0312 0.0029 0.0341
BFYR (n = 1)2.28 ± 0.051.02 ± 0.0545%1.26 0.0287 0.0062 0.0349
BNM (n = 1)3.91 ± 0.131.62 ± 0.1441%2.29 0.0456 0.0113 0.0570
BWG (n = 1)6.97 ± 0.141.12 ± 0.1716%5.85 0.0315 0.0289 0.0604
CSH (n = 3)3.40 ± 0.461.14 ± 0.6336%2.26 0.0321 0.0111 0.0433
CW (n = 1)3.49 ± 0.091.14 ± 0.1833%2.35 0.0322 0.0116 0.0438
CZB (n = 1)2.82 ± 0.111.03 ± 0.1237%1.79 0.0291 0.0088 0.0379
DBDM (n = 1)2.63 ± 0.090.71 ± 0.0927%1.91 0.0201 0.0094 0.0295
DJX (n = 1)1.87 ± 0.180.82 ± 0.0544%1.06 0.0230 0.0052 0.0282
FLM (n = 10)2.78 ± 0.571.09 ± 0.3040%1.69 0.0308 0.0083 0.0391
FX (n = 1)3.33 ± 0.030.083 ± 0.0052%3.25 0.0023 0.0160 0.0184
GF (n = 1)4.64 ± 0.121.53 ± 0.0733%3.11 0.0431 0.0153 0.0585
GFXR (n = 1)3.44 ± 0.041.43 ± 0.0841%2.01 0.0402 0.0099 0.0501
GTX (n = 1)3.38 ± 0.111.05 ± 0.0931%2.33 0.0297 0.0115 0.0412
HBDM (n = 1)5.32 ± 0.142.64 ± 0.1150%2.67 0.0745 0.0132 0.0877
HBRD (n = 1)13.00 ± 2.381.75 ± 0.0713%11.25 0.0494 0.0554 0.1048
HBRX (n = 1)7.42 ± 0.192.54 ± 0.1034%4.88 0.0714 0.0241 0.0955
HDXA (n = 3)4.84 ± 1.221.46 ± 0.4032%3.38 0.0410 0.0167 0.0577
HF (n = 1)3.13 ± 0.021.12 ± 0.1836%2.01 0.0314 0.0099 0.0413
HJDC (n = 1)7.00 ± 0.071.60 ± 0.1023%5.40 0.0449 0.0266 0.0716
HJDY (n = 1)4.08 ± 0.041.15 ± 0.0728%2.93 0.0324 0.0145 0.0469
HL (n = 2)2.76 ± 2.531.57 ± 1.5454%1.19 0.0443 0.0058 0.0502
HLX (n = 2)3.81 ± 1.090.96 ± 0.2427%2.85 0.0271 0.0140 0.0412
HY (n = 2)3.26 ± 1.130.86 ± 0.0728%2.40 0.0242 0.0118 0.0360
HZH (n = 3)2.46 ± 0.430.87 ± 0.2837%1.59 0.0246 0.0078 0.0324
JCYP (n = 1)4.36 ± 0.051.64 ± 0.0938%2.72 0.0461 0.0134 0.0595
JJ-1 (n = 4)3.10 ± 0.801.06 ± 0.0835%2.04 0.0297 0.0101 0.0398
JJ-2 (n = 2)4.42 ± 0.551.31 ± 0.6129%3.11 0.0370 0.0153 0.0523
JLY (n = 9)3.54 ± 1.701.02 ± 0.4731%2.52 0.0288 0.0124 0.0412
JX (n = 2)4.44 ± 1.062.10 ± 0.0149%2.34 0.0593 0.0115 0.0708
JYB (n = 3)3.60 ± 0.841.99 ± 1.0252%1.62 0.0559 0.0080 0.0639
KK (n = 2)5.27 ± 0.761.47 ± 0.0128%3.80 0.0413 0.0188 0.0601
KS (n = 1)4.30 ± 0.111.12 ± 0.1026%3.18 0.0315 0.0157 0.0472
LDT (n = 1)3.58 ± 0.031.30 ± 0.1136%2.28 0.0367 0.0112 0.0480
LF (n = 1)3.36 ± 0.130.72 ± 0.0821%2.64 0.0202 0.0130 0.0332
LFHT (n = 1)2.94 ± 0.061.13 ± 0.1839%1.81 0.0319 0.0089 0.0408
LFY (n = 3)5.86 ± 2.161.24 ± 0.1423%4.63 0.0348 0.0228 0.0576
LH (n = 1)3.02 ± 0.100.36 ± 0.0412%2.66 0.0102 0.0131 0.0233
LY (n = 2)6.49 ± 1.561.36 ± 0.6820%5.14 0.0382 0.0253 0.0635
LZ (n = 2)4.59 ± 1.231.64 ± 0.4138%2.95 0.0462 0.0145 0.0607
MG (n = 3)3.62 ± 0.771.37 ± 0.6236%2.25 0.0386 0.0111 0.0497
MNX (n = 1)1.17 ± 0.290.38 ± 0.0233%0.79 0.0108 0.0039 0.0147
MPS (n = 2)4.93 ± 2.171.08 ± 0.0325%3.84 0.0306 0.0190 0.0495
MSJL (n = 1)5.12 ± 0.200.84 ± 0.1016%4.28 0.0237 0.0211 0.0448
MX (n = 1)2.97 ± 0.030.09 ± 0.013%2.87 0.0027 0.0142 0.0168
MYG (n = 1)4.28 ± 0.041.80 ± 0.1042%2.48 0.0508 0.0122 0.0630
NJM (n = 2)3.23 ± 0.160.73 ± 0.2822%2.50 0.0205 0.0123 0.0328
PBZY (n = 1)1.65 ± 0.090.49 ± 0.0330%1.16 0.0139 0.0057 0.0196
QFDY (n = 1)3.45 ± 0.070.81 ± 0.1324%2.63 0.0229 0.0130 0.0359
QH (n = 2)2.34 ± 0.530.46 ± 0.2021%1.88 0.0129 0.0093 0.0222
QL (n = 1)5.87 ± 0.060.75 ± 0.0513%5.12 0.0212 0.0252 0.0464
QLC (n = 1)5.32 ± 0.060.11 ± 0.012%5.21 0.0031 0.0257 0.0288
QSC (n = 1)4.07 ± 0.741.30 ± 0.0532%2.77 0.0366 0.0136 0.0502
SDX (n = 1)1.98 ± 0.121.01 ± 0.0651%0.97 0.0284 0.0048 0.0332
SN (n = 1)5.88 ± 0.120.96 ± 0.1516%4.92 0.0272 0.0243 0.0514
SXY (n = 1)4.14 ± 0.111.46 ± 0.0735%2.68 0.0412 0.0132 0.0543
SY (n = 5)5.56 ± 4.431.57 ± 0.2841%3.99 0.0442 0.0197 0.0639
TF (n = 2)7.24 ± 3.071.98 ± 0.2329%5.25 0.0559 0.0259 0.0818
TGXM (n = 1)7.69 ± 0.202.47 ± 0.1132%5.22 0.0696 0.0257 0.0953
TH (n = 1)2.21 ± 0.070.90 ± 0.0841%1.31 0.0253 0.0065 0.0318
TQ (n = 1)3.06 ± 0.081.69 ± 0.0855%1.37 0.0476 0.0068 0.0543
TXA (n = 1)1.77 ± 0.101.02 ± 0.0558%0.75 0.0287 0.0037 0.0324
TXX (n = 1)6.46 ± 0.060.90 ± 0.0614%5.56 0.0254 0.0274 0.0528
WC (n = 2)5.44 ± 0.630.95 ± 0.2117%4.50 0.0267 0.0222 0.0488
WF (n = 4)3.62 ± 1.080.76 ± 0.4522%2.86 0.0214 0.0141 0.0355
WH (n = 4)2.95 ± 0.470.87 ± 0.1530%2.08 0.0245 0.0102 0.0347
WMCX (n = 1)3.78 ± 0.130.61 ± 0.0716%3.17 0.0173 0.0156 0.0329
WPW (n = 1)1.83 ± 0.300.99 ± 0.0754%0.84 0.0278 0.0042 0.0320
XBB (n = 1)2.98 ± 0.071.27 ± 0.1143%1.72 0.0357 0.0085 0.0442
XGYJ (n = 1)2.60 ± 0.081.53 ± 0.1159%1.08 0.0430 0.0053 0.0483
XL (n = 1)6.63 ± 0.060.85 ± 0.0513%5.78 0.0240 0.0285 0.0525
XMY (n = 4)2.80 ± 0.350.99 ± 0.0936%1.82 0.0278 0.0090 0.0368
XNL (n = 1)1.74 ± 0.430.53 ± 0.0330%1.21 0.0149 0.0060 0.0209
XRJ (n = 4)3.52 ± 1.891.08 ± 0.4436%2.45 0.0303 0.0121 0.0423
XXBX (n = 1)2.20 ± 0.220.57 ± 0.0326%1.63 0.0160 0.0080 0.0240
XZXM (n = 1)3.43 ± 0.110.98 ± 0.0829%2.45 0.0276 0.0121 0.0397
YCL (n = 1)4.59 ± 0.182.12 ± 0.1146%2.47 0.0598 0.0122 0.0720
YD (n = 1)3.80 ± 0.081.34 ± 0.2135%2.46 0.0377 0.0121 0.0498
YYP (n = 1)1.82 ± 0.070.07 ± 0.014%1.75 0.0020 0.0086 0.0106
YZXM (n = 1)4.74 ± 0.121.36 ± 0.0629%3.39 0.0382 0.0167 0.0549
YZZ (n = 1)2.16 ± 0.021.05 ± 0.1748%1.11 0.0295 0.0055 0.0349
ZJB (n =1)2.79 ± 0.071.08 ± 0.0539%1.71 0.0303 0.0085 0.0388