The Use of the Internet of Things for Estimating Personal Pollution Exposure


Abstract
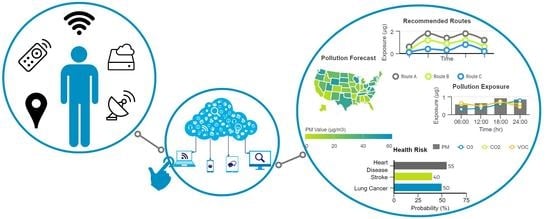
1. Introduction
2. Literature Review
2.1. Key Air Pollutants
2.2. Determination Method for Air Pollutants
2.3. IPAPE Measurement Techniques
2.4. Opportunities and Challenges
3. Methodology
3.1. Framework
3.1.1. System Architecture
3.1.2. PAPE Measurement
3.2. Madrid Case Study
3.2.1. Study Area
3.2.2. Data Collection
3.2.3. Outdoor Pollution Modeling
- Optimal Parameters and Model SelectionIn order to select the optimal parameters and the best modeling technique for each of the hourly outdoor pollution datasets, a 5-fold cross validation was performed to avoid overfitting. For each of the 24-hourly datasets and each of the three modeling techniques and all combinations of their respective parameters, the selection of optimal values was based on the root-mean-squared-error (RMSE) metric. The dataset was separated into two parts, training and testing, which were used to fit the model and calculate errors, respectively. The parameters and the model that provided the least RMSE were selected.For the Simple and Ordinary Kriging techniques, the weights were derived by fitting a covariance function or variogram. First, a graph of the empirical variogram was plotted and a model was fitted to the points based on this plot. Table 3 shows the different models and functions from which to choose when fitting a model to the empirical variogram. Based on the 5-fold cross validation, the Gaussian Model was selected as the optimal configuration.
- Outdoor Pollution MapSimilar to [43], an hourly outdoor pollution map was created that was based on the identified optimal parameters and modeling technique for each respective hour. Figure 3 shows an example of the pollution maps based on the PM pollution data on 2017-03-24. It shows that, from midnight to the morning at around 6:00, the highest pollution levels consistently occurred in the southwestern part of the city and moved towards the north with maximum levels that ranged from 8 to 12 g/m. Concurrently, high pollution levels were also experienced in the northwestern part of the city at midnight and in the northeastern part at 01:00 in the morning.The selection of time frequency (hourly-based in this case) also impacts the accuracy, depending on how spiky the pollution looks. In Madrid, the pollution sources are strongly related to traffic and then variations are smooth [82]. Therefore, hourly-based frequency is a rather convenient basis for calculations.
3.2.4. Indoor Pollution Modeling
3.2.5. Indoor and Outdoor Pollution Integration
3.2.6. Practical Application
4. Results and Discussion
4.1. Outdoor Pollution Model Performance
4.2. Device Performance
4.3. PAPE Values
4.4. Alternative Travel Routes
4.5. Limitations
5. Conclusions
Author Contributions
Funding
Acknowledgments
Conflicts of Interest
References
- Initiative, G.R. Sustainability and Reporting Trends in 2025: Preparing for the Future; Technical Report; Global Reporting Initiative: Amsterdam, The Netherlands, 2015. [Google Scholar]
- EY. Rapid-Growth Markets; Technical Report; EY: Oxford, UK, 2014. [Google Scholar]
- KPMG. Ten Emerging Trends in 2017; Technical Report; KPMG: Zurich, Switzerland, 2017. [Google Scholar]
- Bartels, W.; Fogerlberg, T.; Hoballah, A.; Van der Lugt, C.C.A. Carrots & Sticks: Global Trends in Sustainability Reporting Regulation and Policy; Technical Report; KPMG: Zurich, Switzerland, 2016. [Google Scholar]
- Bollen, J.; Brink, C. Air pollution policy in Europe: Quantifying the interaction with greenhouse gases and climate change policies. Energy Econ. 2014, 46, 202–215. [Google Scholar] [CrossRef]
- Shah, A.S.V.; Langrish, J.P.; Nair, H.; McAllister, D.A.; Hunter, A.L.; Donaldson, K.; Newby, D.E.; Mills, N.L. Global Association of Air Pollution and Heart Failure: A Systematic Review and Meta-Analysis. Lancet 2013, 382, 1039–1048. [Google Scholar] [CrossRef]
- WHO. Evolution of WHO Air Quality Guidelines: Past, Present and Future; Technical Report; WHO: Copenhagen, Denmark, 2017. [Google Scholar]
- OECD. Environmental Outlook To 2050: The Consequences of Inaction Key Findings on Health and Environment; Technical Report; OECD: Paris, France, 2012. [Google Scholar]
- WHO. Household (Indoor) Air Pollution; WHO: Liverpool, UK, 2017. [Google Scholar]
- Fisk, W.J.; Rosenfeld, A.H. Estimates of Improved Productivity and Health from Better Indoor Environments. Indoor Air 2004, 7, 158–172. [Google Scholar] [CrossRef]
- Chen, R.; Chu, C.; Tan, J.; Cao, J.; Song, W.; Xu, X.; Jiang, C.; Ma, W.; Yang, C.; Chen, B.; et al. Ambient air pollution and hospital admission in Shanghai, China. J. Hazard. Mater. 2010, 181, 234–240. [Google Scholar] [CrossRef] [PubMed]
- Micheli, G.J.; Farné, S. Urban railway traffic noise: Looking for the minimum cost for the whole community. Appl. Acoust. 2016, 113, 121–131. [Google Scholar] [CrossRef]
- Kuo, C.Y.; Chan, C.K.; Wu, C.Y.; Phan, D.V.; Chan, C.L. The Short-Term Effects of Ambient Air Pollutants on Childhood Asthma Hospitalization in Taiwan: A National Study. Int. J. Environ. Res. Public Health 2019, 16. [Google Scholar] [CrossRef]
- Saldiva, S.R.D.M.; Barrozo, L.V.; Leone, C.R.; Failla, M.A.; Bonilha, E.D.A.; Bernal, R.T.I.; Oliveira, R.C.D.; Saldiva, P.H.N. Small-Scale Variations in Urban Air Pollution Levels Are Significantly Associated with Premature Births: A Case Study in Sao Paulo, Brazil. Int. J. Environ. Res. Public Health 2018, 15. [Google Scholar] [CrossRef] [PubMed]
- Laumbach, R.J.; Kipen, H.M. Respiratory health effects of air pollution: Update on biomass smoke and traffic pollution. J. Allergy Clin. Immunol. 2012, 129, 3–11. [Google Scholar] [CrossRef]
- Dias, D.; Tchepel, O. Spatial and Temporal Dynamics in Air Pollution Exposure Assessment. Int. J. Environ. Res. Public Health 2018, 15. [Google Scholar] [CrossRef]
- Philip, V.; Suman, V.K.; Menon, V.G.; Dhanya, K.A.A. Review on Latest Internet of Things Based Healthcare Applications. Int. J. Comput. Sci. Inf. Secury 2017, 15, 248–255. [Google Scholar]
- EY. Health Reimagined: A New Participatory Health Paradigm; Technical Report; EY: Melbourne, Australia, 2016. [Google Scholar]
- Deloitte. 2015 Global Health Care Outlook: Common Goals, Competing Priorities; Technical Report; Deloitte: London, UK, 2015. [Google Scholar]
- Niedermans, F.; Biesdorf, S. Healthcare’s Digital Future; Technical Report; McKinsey: Munich, Germany, 2014. [Google Scholar]
- Barnes, K.; Isgur, B.; Tsouderos, T. Top Health Industry Issues of 2016: Thriving in the New Health Economy; Health Research Institute: USA, 2015; pp. 1–18. [Google Scholar]
- Reh, G.; Korenda, L.; Boozer, C. Will Patients and Caregivers Embrace Technology-Enabled Health Care? Technical Report; Deloitte: London, UK, 2016. [Google Scholar]
- Kim, K.H.; Kabir, E.; Kabir, S. A review on the human health impact of airborne particulate matter. Environ. Int. 2015, 74, 136–143. [Google Scholar] [CrossRef] [PubMed]
- Szigeti, T.; Dunster, C.; Cattaneo, A.; Cavallo, D.; Spinazze, A.; Saraga, D.E.; Sakellaris, I.A.; de Kluizenaar, Y.; Cornelissen, E.J.; Hänninen, O.; et al. Oxidative potential and chemical composition of PM2.5 in office buildings across Europe—The OFFICAIR study. Environ. Int. 2016, 92–93, 324–333. [Google Scholar] [CrossRef] [PubMed]
- Guerreiro, C.B.; Foltescu, V.; de Leeuw, F. Air quality status and trends in Europe. Atmos. Environ. 2014, 98, 376–384. [Google Scholar] [CrossRef]
- Abraham, S.; Li, X. Design of A Low-Cost Wireless Indoor Air Quality Sensor Network System. Int. J. Wirel. Inf. Netw. 2016, 23, 57–65. [Google Scholar] [CrossRef]
- WHO. Air Quality Guidelines. Global Update 2005. In Environ. Sci. Pollut. Res.; 2006; Volume 3, p. 23. [Google Scholar]
- Penney, D.; Benignus, V.; Kephalopoulos, S.; Kotzias, D.; Kleinman, M.; Verrier, A. Guidelines for Indoor Air Quality; Technical Report; WHO: Copenhagen, Denmark, 2010. [Google Scholar]
- Anna Mainka, B.K. Assessment of the BTEX concentrations and health risk in urban nursery schools in Gliwice, Poland. AIMS Environ. Sci. 2016, 3, 858. [Google Scholar] [CrossRef]
- Yurdakul, S.; Civan, M.; Ozden, O.; Gaga, E.; Dogeroglu, T.; Tuncel, G. Spatial variation of VOCs and inorganic pollutants in a university building. Atmos. Pollut. Res. 2017, 8, 1–12. [Google Scholar] [CrossRef]
- EPA. Compendium of Methods for the Determination of Air Pollutants in Indoor Air; Technical Report; EPA: Springfield, VA, USA, 1990. [Google Scholar]
- Ishizaka, T.D.; Kawashima, A.; Hishida, N.; Hamada, N. Measurement of total volatile organic compound (TVOC) in indoor air using passive solvent extraction method. Air Qual. Atmos. Health 2019, 12, 173–187. [Google Scholar] [CrossRef]
- Topping, M. OCCUPATIONAL EXPOSURE LIMITS FOR CHEMICALS. Occup. Environ. Med. 2001, 58, 138–144. [Google Scholar] [CrossRef]
- Kumar, P.; Morawska, L.; Martani, C.; Biskos, G.; Neophytou, M.; Sabatino, S.D.; Bell, M.; Norford, L.; Britter, R. The rise of low-cost sensing for managing air pollution in cities. Environ. Int. 2015, 75, 199–205. [Google Scholar] [CrossRef]
- Reis, S.; Seto, E.; Northcross, A.; Quinn, N.W.; Convertino, M.; Jones, R.L.; Maier, H.R.; Schlink, U.; Steinle, S.; Vieno, M.; et al. Integrating modelling and smart sensors for environmental and human health. Environ. Model. Softw. 2015, 74, 238–246. [Google Scholar] [CrossRef]
- Steinle, S.; Reis, S.; Sabel, C.E. Quantifying human exposure to air pollution—Moving from static monitoring to spatio-temporally resolved personal exposure assessment. Sci. Total Environ. 2013, 443, 184–193. [Google Scholar] [CrossRef] [PubMed]
- Su, J.G.; Jerrett, M.; Meng, Y.Y.; Pickett, M.; Ritz, B. Integrating smart-phone based momentary location tracking with fixed site air quality monitoring for personal exposure assessment. Sci. Total Environ. 2015, 506–507, 518–526. [Google Scholar] [CrossRef] [PubMed]
- Milando, C.W.; Martenies, S.E.; Batterman, S.A. Assessing concentrations and health impacts of air quality management strategies: Framework for Rapid Emissions Scenario and Health impact ESTimation (FRESH-EST). Environ. Int. 2016, 94, 473–481. [Google Scholar] [CrossRef] [PubMed]
- Mercer, L.D.; Szpiro, A.A.; Sheppard, L.; Lindström, J.; Adar, S.D.; Allen, R.W.; Avol, E.L.; Oron, A.P.; Larson, T.; Liu, L.J.S.; et al. Comparing universal kriging and land-use regression for predicting concentrations of gaseous oxides of nitrogen (NOx) for the Multi-Ethnic Study of Atherosclerosis and Air Pollution (MESA Air). Atmos. Environ. 2011, 45, 4412–4420. [Google Scholar] [CrossRef] [PubMed]
- Rojas, A.L.P. Simple atmospheric dispersion model to estimate hourly ground-level nitrogen dioxide and ozone concentrations at urban scale. Environ. Model. Softw. 2014, 59, 127–134. [Google Scholar] [CrossRef]
- Oettl, D. Documentation of the Lagrangian Particle Model GRAL (Graz Lagrangian Model); Amt der Steiermärk: Graz, Austria, 2016. [Google Scholar]
- Marjovi, A.; Arfire, A.; Martinoli, A. High Resolution Air Pollution Maps in Urban Environments Using Mobile Sensor Networks. In Proceedings of the 2015 International Conference on Distributed Computing in Sensor Systems, Fortaleza, Brazil, 10–12 June 2015; pp. 11–20. [Google Scholar] [CrossRef]
- Gomez-Losada, A.; Santos, F.M.; Gibert, K.; Pires, J.C. A data science approach for spatiotemporal modelling of low and resident air pollution in Madrid (Spain): Implications for epidemiological studies. Comput. Environ. Urban Syst. 2019, 75, 1–11. [Google Scholar] [CrossRef]
- Montero, J.M.; Fernández-Avilés, G. Functional kriging prediction of atmospheric particulate matter concentrations in Madrid, Spain: Is the new monitoring system masking potential public health problems? J. Clean. Prod. 2018, 175, 283–293. [Google Scholar] [CrossRef]
- de Nazelle, A.; Seto, E.; Donaire-Gonzalez, D.; Mendez, M.; Matamala, J.; Nieuwenhuijsen, M.J.; Jerrett, M. Improving estimates of air pollution exposure through ubiquitous sensing technologies. Environ. Pollut. 2013, 176, 92–99. [Google Scholar] [CrossRef] [PubMed]
- Yu, T.C.; Lin, C.C.; Chen, C.C.; Lee, W.L.; Lee, R.G.; Tseng, C.H.; Liu, S.P. Wireless sensor networks for indoor air quality monitoring. Med. Eng. Phys. 2013, 35, 231–235. [Google Scholar] [CrossRef] [PubMed]
- Schlesinger, J.; Burris, S.; Tippmann, C. Health and Mobility: Realizing the Power of Mobile Technology; Technical Report; EY: Los Angeles, CA, USA, 2015. [Google Scholar]
- Tong, Z.; Chen, Y.; Malkawi, A.; Adamkiewicz, G.; Spengler, J.D. Quantifying the impact of traffic-related air pollution on the indoor air quality of a naturally ventilated building. Environ. Int. 2016, 89–90, 138–146. [Google Scholar] [CrossRef] [PubMed]
- Mead, M.; Popoola, O.; Stewart, G.; Landshoff, P.; Calleja, M.; Hayes, M.; Baldovi, J.; McLeod, M.; Hodgson, T.; Dicks, J.; et al. The use of electrochemical sensors for monitoring urban air quality in low-cost, high-density networks. Atmos. Environ. 2013, 70, 186–203. [Google Scholar] [CrossRef]
- Saad, S.M.; Mohd Saad, A.R.; Kamarudin, A.M.Y.; Zakaria, A.; Shakaff, A.Y.M. Indoor air quality monitoring system using wireless sensor network (WSN) with web interface. In Proceedings of the 2013 International Conference on Electrical, Electronics and System Engineering (ICEESE), Selangor, Malaysia, 4–5 December 2013; pp. 60–64. [Google Scholar] [CrossRef]
- Ott, W.R. Concepts of human exposure to air pollution. Environ. Int. 1982, 7, 179–196. [Google Scholar] [CrossRef]
- Nash, D.G.; Leith, D. Use of Passive Diffusion Tubes to Monitor Air Pollutants. J. Air Waste Manag. Assoc. 2010, 60, 204–209. [Google Scholar] [CrossRef] [PubMed][Green Version]
- Monn, C. Exposure assessment of air pollutants: A review on spatial heterogeneity and indoor/outdoor/personal exposure to suspended particulate matter, nitrogen dioxide and ozone. Atmos. Environ. 2001, 35, 1–32. [Google Scholar] [CrossRef]
- Klepeis, N. Modeling Human Exposure To Air Pollution. Available online: http://citeseerx.ist.psu.edu/viewdoc/download?doi=10.1.1.460.8304&rep=rep1&type=pdf (accessed on 15 February 2017).
- Gu, Y.; Yim, S. The air quality and health impacts of domestic trans-boundary pollution in various regions of China. Environ. Int. 2016, 97, 117–124. [Google Scholar] [CrossRef] [PubMed]
- Predic, B.; Yan, Z.; Eberle, J.; Stojanovic, D.; Aberer, K. ExposureSense: Integrating Daily Activities with Air Quality Using Mobile Participatory Sensing. In Proceedings of the 2013 IEEE International Conference on Pervasive Computing and Communications Workshops (PERCOM Workshops, San Diego, CA, USA, 18–22 March 2013; pp. 303–305. [Google Scholar]
- Steinle, S.; Reis, S.; Sabel, C.E.; Semple, S.; Twigg, M.M.; Braban, C.F.; Leeson, S.R.; Heal, M.R.; Harrison, D.; Lin, C.; et al. Personal exposure monitoring of PM2.5 in indoor and outdoor microenvironments. Sci. Total Environ. 2015, 508, 383–394. [Google Scholar] [CrossRef] [PubMed]
- Liu, R.; Wang, Y.; Shu, M. Internet of Things Healthcare Cloud System Based on IEEE 802.15.4. J. Appl. Sci. 2013, 13, 1582–1586. [Google Scholar] [CrossRef][Green Version]
- Stojić, A.; Maletić, D.; Stojić, S.S.; Mijić, Z.; Šoštarić, A. Forecasting of VOC emissions from traffic and industry using classification and regression multivariate methods. Sci. Total Environ. 2015, 521–522, 19–26. [Google Scholar] [CrossRef] [PubMed]
- Gong, B.; Ordieres-Mere, J. Prediction of daily maximum ozone threshold exceedances by preprocessing and ensemble artificial intelligence techniques: Case study of Hong Kong. Environ. Model. Softw. 2016, 84, 290–303. [Google Scholar] [CrossRef]
- Diaz-Robles, L.A.; Ortega, J.C.; Fu, J.S.; Reed, G.D.; Chow, J.C.; Watson, J.G.; Moncada-Herrera, J.A. A hybrid ARIMA and artificial neural networks model to forecast particulate matter in urban areas: The case of Temuco, Chile. Atmos. Environ. 2008, 42, 8331–8340. [Google Scholar] [CrossRef]
- Beevers, S.D.; Kitwiroon, N.; Williams, M.L.; Carslaw, D.C. One way coupling of CMAQ and a road source dispersion model for fine scale air pollution predictions. Atmos. Environ. 2012, 59, 47–58. [Google Scholar] [CrossRef] [PubMed]
- Raducan, G. Pollutant dispersion modelling with OSPM in a street canyon from Bucharest. Roman. Report Phys. 2008, 60. [Google Scholar]
- Gong, B.; Ordieres-Mere, J. Reconfiguring existing pollutant monitoring stations by increasing the value of the gathered information. Environ. Model. Softw. 2017, 96, 106–122. [Google Scholar] [CrossRef]
- Farhi, A.; Boyko, V.; Almagor, J.; Benenson, I.; Segre, E.; Rudich, Y.; Stern, E.; Lerner-Geva, L. The possible association between exposure to air pollution and the risk for congenital malformations. Environ. Res. 2014, 135, 173–180. [Google Scholar] [CrossRef] [PubMed]
- Nikzad, N.; Verma, N.; Ziftci, C.; Bales, E.; Quick, N.; Zappi, P.; Patrick, K.; Dasgupta, S.; Krueger, I.; Rosing, T.V.; et al. CitiSense: Improving Geospatial Environmental Assessment of Air Quality Using a Wireless Personal Exposure Monitoring System. In Proceedings of the Conference on Wireless Health; ACM: New York, NY, USA, 2012; pp. 11:1–11:8. [Google Scholar] [CrossRef]
- Government, T.C. Air Boxes PM2.5. Available online: https://smartcity.taipei/posts/3?locale=en (accessed on 30 April 2019).
- Catlett, C. Array of Things. Available online: https://www.anl.gov/mcs/array-of-things (accessed on 30 April 2019).
- Council, M.C. Air Quality: Real-time data. Available online: https://www.madrid.es/portal/site/munimadrid (accessed on 13 February 2017).
- AEMET. Open data from AEMET. Available online: https://opendata.aemet.es/centrodedescargas/inicio (accessed on 13 February 2017).
- Welsh, B.; Baird, T.; Zhao, J.; Block-Schachter, D. Web App Design to Implement Travel Behavioral Nudging Using “Moves”. In Proceedings of the Transportation Research Board 93rd Annual Meeting, Washington, DC, USA, 12–14 January 2014. [Google Scholar]
- OwnTracks. OwnTracks: Your Location Companion. Available online: https://owntracks.org/ (accessed on 13 February 2017).
- Kirstenpfad, D. Miataru - Be Found: OpenSource Location Tracking. Available online: http://miataru.com/ios/ (accessed on 13 February 2017).
- Geo2tag. TAG EVERYWHERE(EVERYTHING) WITH GEO2TAG. Available online: http://www.geo2tag.com/ (accessed on 13 February 2017).
- Loh, M.; Sarigiannis, D.; Gotti, A.; Karakitsios, S.; Pronk, A.; Kuijpers, E.; Annesi-Maesano, I.; Baiz, N.; Madureira, J.; Oliveira Fernandes, E.; et al. How Sensors Might Help Define the External Exposome. Int. J. Environ. Res. Public Health 2017, 14. [Google Scholar] [CrossRef] [PubMed]
- Mahesh, B.R.; Kumar, M.B.; Manoharan, R.; Somasundaram, M.; Karthikeyan, S.P. Portability of mobile applications using PhoneGap: A case study. In Proceedings of the International Conference on Software Engineering and Mobile Application Modelling and Development (ICSEMA 2012), Chennai, India, 19–21 December 2012; pp. 1–6. [Google Scholar] [CrossRef]
- Danova, T. These Are Some Of The Top Emerging Business Applications For Beacons. Available online: https://www.businessinsider.com/top-emerging-applications-for-beacons-2014-4 (accessed on 3 March 2017).
- Gong, B. masak1112/IoT-for-Estimating-Personal-Pollution-Doses 0.1.0. Available online: https://zenodo.org/record/818074#.XWVKMpNKiYU (accessed on 25 June 2017).
- Vedrenne, M.; Borge, R.; Lumbreras, J.; Rodriguez, M.E. Advancements in the design and validation of an air pollution integrated assessment model for Spain. Environ. Model. Softw. 2014, 57, 177–191. [Google Scholar] [CrossRef]
- Andria, G.; Cavone, G.; Lanzolla, A.M. Modelling study for assessment and forecasting variation of urban air pollution. Measurement 2008, 41, 222–229. [Google Scholar] [CrossRef]
- Li, L.; Losser, T.; Yorke, C.; Piltner, R. Fast Inverse Distance Weighting-Based Spatiotemporal Interpolation: A Web-Based Application of Interpolating Daily Fine Particulate Matter PM2.5 in the Contiguous U.S. Using Parallel Programming and k-d Tree. Int. J. Environ. Res. Public Health 2014, 11, 9101–9141. [Google Scholar] [CrossRef]
- Council, M.C. Web Portal of Air Quality of the Madrid City Council. Available online: https://www.madrid.es/portal/site/munimadrid (accessed on 15 June 2019).
- de Nazelle, A.; Bode, O.; Orjuela, J.P. Comparison of air pollution exposures in active vs. passive travel modes in European cities: A quantitative review. Environ. Int. 2017, 99, 151–160. [Google Scholar] [CrossRef]
- O’Donoghue, R.; Gill, L.; McKevitt, R.; Broderick, B. Exposure to hydrocarbon concentrations while commuting or exercising in Dublin. Environ. Int. 2007, 33, 1–8. [Google Scholar] [CrossRef]
- Allan, M.; Richardson, G.M.; Jones-Otazo, H. Probability Density Functions Describing 24-Hour Inhalation Rates for Use in Human Health Risk Assessments: An Update and Comparison. Human Ecol. Risk Assess. Int. J. 2008, 14, 372–391. [Google Scholar] [CrossRef]
- Dirks, K.N.; Salmond, J.A.; Talbot, N. Air Pollution Exposure in Walking School Bus Routes: A New Zealand Case Study. Int. J. Environ. Res. Public Health 2018, 15. [Google Scholar] [CrossRef] [PubMed]
- Mahajan, S.; Tang, Y.S.; Wu, D.Y.; Tsai, T.C.; Chen, L.J. CAR: The Cleanest Air Routing Algorithm for Path Navigation with Minimal PM2.5 Exposure on the Move. In Proceedings of the 16th Annual International Conference on Mobile Systems, Applications, and Services, Munich, Germany, 10–15 June 2018; ACM: New York, NY, USA, 2018; p. 532. [Google Scholar] [CrossRef]
- Krivoruchko, K. Using Linear and Non-Linear Kriging Interpolators to Produce Probability Maps; Environmental Systems Research Institute: Redlands, CA, USA, 2001. [Google Scholar]
- Halimi, M.; Farajzadeh, M.; Zarei, Z. Modeling spatial distribution of Tehran air pollutants using geostatistical methods incorporate uncertainty maps. Pollution 2016, 2, 375–386. [Google Scholar] [CrossRef]
- San José, R.; Pérez, J.; González, R. Very High Resolution Urban Simulations with WRF/UCM and CMAQ over European Cities. In Urban Environment; Rauch, S., Morrison, G., Norra, S., Schleicher, N., Eds.; Springer: Dordrecht, The Netherlands, 2013; pp. 293–301. [Google Scholar]
- Fernando, H.; Mammarella, M.; Grandoni, G.; Fedele, P.; Marco, R.D.; Dimitrova, R.; Hyde, P. Forecasting PM10 in metropolitan areas: Efficacy of neural networks. Environ. Pollut. 2012, 163, 62–67. [Google Scholar] [CrossRef]
- Atmotube. Atmotube Makes You Smarter about the Air You Breathe. Available online: https://atmotube.com/ (accessed on 13 February 2017).
- Lemes, S. Air Quality Index (AQI)—Comparative Study And Assessment Of An Appropriate Model For B&H. In Proceedings of the 12th Scientific/Research Symposium with International Participation “Metallic And Nonmetallic Materials” MNM 2018, Zenica, Bosnia and Herzegovina, 19–20 April 2018. [Google Scholar]
- Luo, J.; Boriboonsomsin, K.; Barth, M. Reducing pedestrians’ inhalation of traffic-related air pollution through route choices: Case study in California suburb. J. Trans. Health 2018, 10, 111–123. [Google Scholar] [CrossRef]
- Tangle, I. Meet the Tangle. Available online: https://www.iota.org/research/meet-the-tangle (accessed on 13 February 2017).


| Source | Pollutant | Unit |
|---|---|---|
| PM | g/m | |
| Indoor Monitor | CO | ppm |
| VOC | ppb | |
| PM | g/m | |
| PM | g/m | |
| CO | g/m | |
| Outdoor Monitor | NO | g/m |
| SO | g/m | |
| O | g/m | |
| NO | g/m |
| Technique | IDW | Simple Kriging | Ordinary Kriging | Co-Kriging |
|---|---|---|---|---|
| Formula | ||||
| Characteristics | The weight, , depends solely on the distance to the prediction location. | Assumes a constant and known mean c of the samples. The weight, , depends on the use of a fitted model to the measured points, the distance to the prediction location, and the spatial relationships among the measured values around the prediction location. | Condition that assumes a constant and unknown mean of the samples. The weight, , depends on the use of a fitted model to the measured points, the distance to the prediction location, and the spatial relationships among the measured values around the prediction location. | is the secondary regionalized variable which is co-located with the target variable . The weight assigned to varies between 0 to 1. |
| Parameters | Idp | Sill | ||
| Range | ||||
| Nugget | ||||
| Beta | ||||
| Variogram Model: Gaussian, Circular, Exponential |
| Model | Function |
|---|---|
| Circular | |
| Spherical | |
| Exponential | |
| Gaussian | |
| Start Time | End Time | Latitude | Longitude | Activity |
|---|---|---|---|---|
| 2017-03-24 00:00:00 | 2017-03-24 11:55:37 | 40.4612 | −3.7093 | Rest |
| 2017-03-24 11:55:37 | 3/24/2017 11:59:20 | 40.4592 | −3.7106 | Walk |
| 2017-03-24 11:59:20 | 3/24/2017 12:04:30 | 40.4571 | −3.7118 | Rest |
| 2017-03-24 12:04:30 | 3/24/2017 12:23:44 | 40.4486 | −3.7006 | Transport |
| 2017-03-24 12:23:44 | 3/24/2017 19:52:00 | 40.4400 | −3.6894 | Rest |
| 2017-03-24 19:52:00 | 3/24/2017 20:08:40 | 40.4506 | −3.6994 | Transport |
| 2017-03-24 20:08:40 | 3/24/2017 21:13:07 | 40.4612 | −3.7093 | Rest |
| 2017-03-24 21:13:07 | 3/24/2017 21:21:55 | 40.4594 | −3.7105 | Walk |
| 2017-03-24 21:21:55 | 3/24/2017 22:32:59 | 40.4575 | −3.7117 | Rest |
| 2017-03-24 22:32:59 | 3/24/2017 22:42:51 | 40.4594 | −3.7105 | Walk |
| 2017-03-24 22:42:51 | 3/25/2017 00:00:00 | 40.4612 | −3.7093 | Rest |
| Start | End | Latitude | Longitude | Environment | Activity | VE | Exposure | |
|---|---|---|---|---|---|---|---|---|
| (g/m * min) | (m/min) | (g) | ||||||
| 2017-03-24 0:00 | 2017-03-24 11:55 | 40.461 | −3.709 | 5354.15601 | Outdoor | Rest | 0.00893 | 47.81261 |
| 2017-03-24 11:55 | 2017-03-24 11:59 | 40.459 | −3.711 | 13.9543 | Outdoor | Walk | 0.01326 | 0.18503 |
| 2017-03-24 11:59 | 2017-03-24 12:04 | 40.457 | −3.712 | 20.08333 | Outdoor | Rest | 0.00893 | 0.17934 |
| 2017-03-24 12:04 | 2017-03-24 12:23 | 40.449 | −3.701 | 111.43482 | Outdoor | Transport | 0.00893 | 0.99511 |
| 2017-03-24 13:16 | 2017-03-24 14:03 | 40.43999 | −3.68938 | 268.65655 | Indoor | Rest | 0.00893 | 2.3991 |
| 2017-03-24 14:03 | 2017-03-24 14:37 | 40.44 | −3.689 | 347.06125 | Outdoor | Walk | 0.01326 | 4.60203 |
| 2017-03-24 14:37 | 2017-03-24 14:44 | 40.43999 | −3.68938 | 28.72532 | Indoor | Rest | 0.00893 | 0.25652 |
| 2017-03-24 14:44 | 2017-03-24 14:59 | 40.44 | −3.689 | 141.90761 | Outdoor | Walk | 0.01326 | 1.88169 |
| 2017-03-24 14:59 | 2017-03-24 15:58 | 40.43999 | −3.68938 | 273.87957 | Indoor | Rest | 0.00893 | 2.44574 |
| 2017-03-24 15:58 | 2017-03-24 16:09 | 40.44 | −3.689 | 80.2915 | Outdoor | Walk | 0.01326 | 1.06467 |
| 2017-03-24 16:09 | 2017-03-24 17:00 | 40.43999 | −3.68938 | 275.25632 | Indoor | Rest | 0.00893 | 2.45804 |
| 2017-03-24 17:00 | 2017-03-24 17:12 | 40.44 | −3.689 | 70.15613 | Outdoor | Walk | 0.01326 | 0.93027 |
| 2017-03-24 17:12 | 2017-03-24 17:41 | 40.43999 | −3.68938 | 253.86892 | Indoor | Rest | 0.00893 | 2.26705 |
| 2017-03-24 17:41 | 2017-03-24 17:56 | 40.44 | −3.689 | 63.02457 | Outdoor | Walk | 0.01326 | 0.83571 |
| 2017-03-24 17:56 | 2017-03-24 18:32 | 40.43999 | −3.68938 | 278.09301 | Indoor | Rest | 0.00893 | 2.48337 |
| 2017-03-24 18:32 | 2017-03-24 18:46 | 40.44 | −3.689 | 85.27723 | Outdoor | Walk | 0.01326 | 1.13078 |
| 2017-03-24 18:46 | 2017-03-24 19:19 | 40.43999 | −3.68938 | 193.88363 | Indoor | Rest | 0.00893 | 1.73138 |
| 2017-03-24 19:52 | 2017-03-24 20:08 | 40.451 | −3.699 | 182.9052 | Outdoor | Transport | 0.00893 | 1.63334 |
| 2017-03-24 20:08 | 2017-03-24 21:13 | 40.461 | −3.709 | 626.14768 | Outdoor | Rest | 0.00893 | 5.5915 |
| 2017-03-24 21:13 | 2017-03-24 21:21 | 40.459 | −3.711 | 68.61289 | Outdoor | Walk | 0.01326 | 0.90981 |
| 2017-03-24 21:21 | 2017-03-24 22:32 | 40.457 | −3.712 | 414.90097 | Outdoor | Rest | 0.00893 | 3.70507 |
| 2017-03-24 22:32 | 2017-03-24 22:42 | 40.459 | −3.711 | 51.34302 | Outdoor | Walk | 0.01326 | 0.68081 |
| 2017-03-24 22:42 | 2017-03-25 0:00 | 40.461 | −3.709 | 6.56381 | Outdoor | Rest | 0.00893 | 0.05861 |
| Route | (g/m * min) | Exposure (g) |
|---|---|---|
| A | 89.34 | 0.80 |
| B | 86.08 | 0.77 |
| C | 100.17 | 0.89 |
| Actual | 111.43 | 0.99 |
© 2019 by the authors. Licensee MDPI, Basel, Switzerland. This article is an open access article distributed under the terms and conditions of the Creative Commons Attribution (CC BY) license (http://creativecommons.org/licenses/by/4.0/).
Share and Cite
Arano, K.A.G.; Sun, S.; Ordieres-Mere, J.; Gong, a.B. The Use of the Internet of Things for Estimating Personal Pollution Exposure. Int. J. Environ. Res. Public Health 2019, 16, 3130. https://doi.org/10.3390/ijerph16173130
Arano KAG, Sun S, Ordieres-Mere J, Gong aB. The Use of the Internet of Things for Estimating Personal Pollution Exposure. International Journal of Environmental Research and Public Health. 2019; 16(17):3130. https://doi.org/10.3390/ijerph16173130
Chicago/Turabian StyleArano, Keith April G., Shengjing Sun, Joaquin Ordieres-Mere, and and Bing Gong. 2019. "The Use of the Internet of Things for Estimating Personal Pollution Exposure" International Journal of Environmental Research and Public Health 16, no. 17: 3130. https://doi.org/10.3390/ijerph16173130
APA StyleArano, K. A. G., Sun, S., Ordieres-Mere, J., & Gong, a. B. (2019). The Use of the Internet of Things for Estimating Personal Pollution Exposure. International Journal of Environmental Research and Public Health, 16(17), 3130. https://doi.org/10.3390/ijerph16173130