Roaming the Neighbourhood: Influences of Independent Mobility Parenting Practices and Parental Perceived Environment on Children’s Territorial Range

Abstract
:1. Introduction
2. Materials and Methods
2.1. Study Design, Setting, and Sample
2.2. Measures
2.3. Analysis
3. Results
3.1. Demographic Characteristics
3.2. Descriptive Statistics for Independent, Dependent, and Mediating Variables
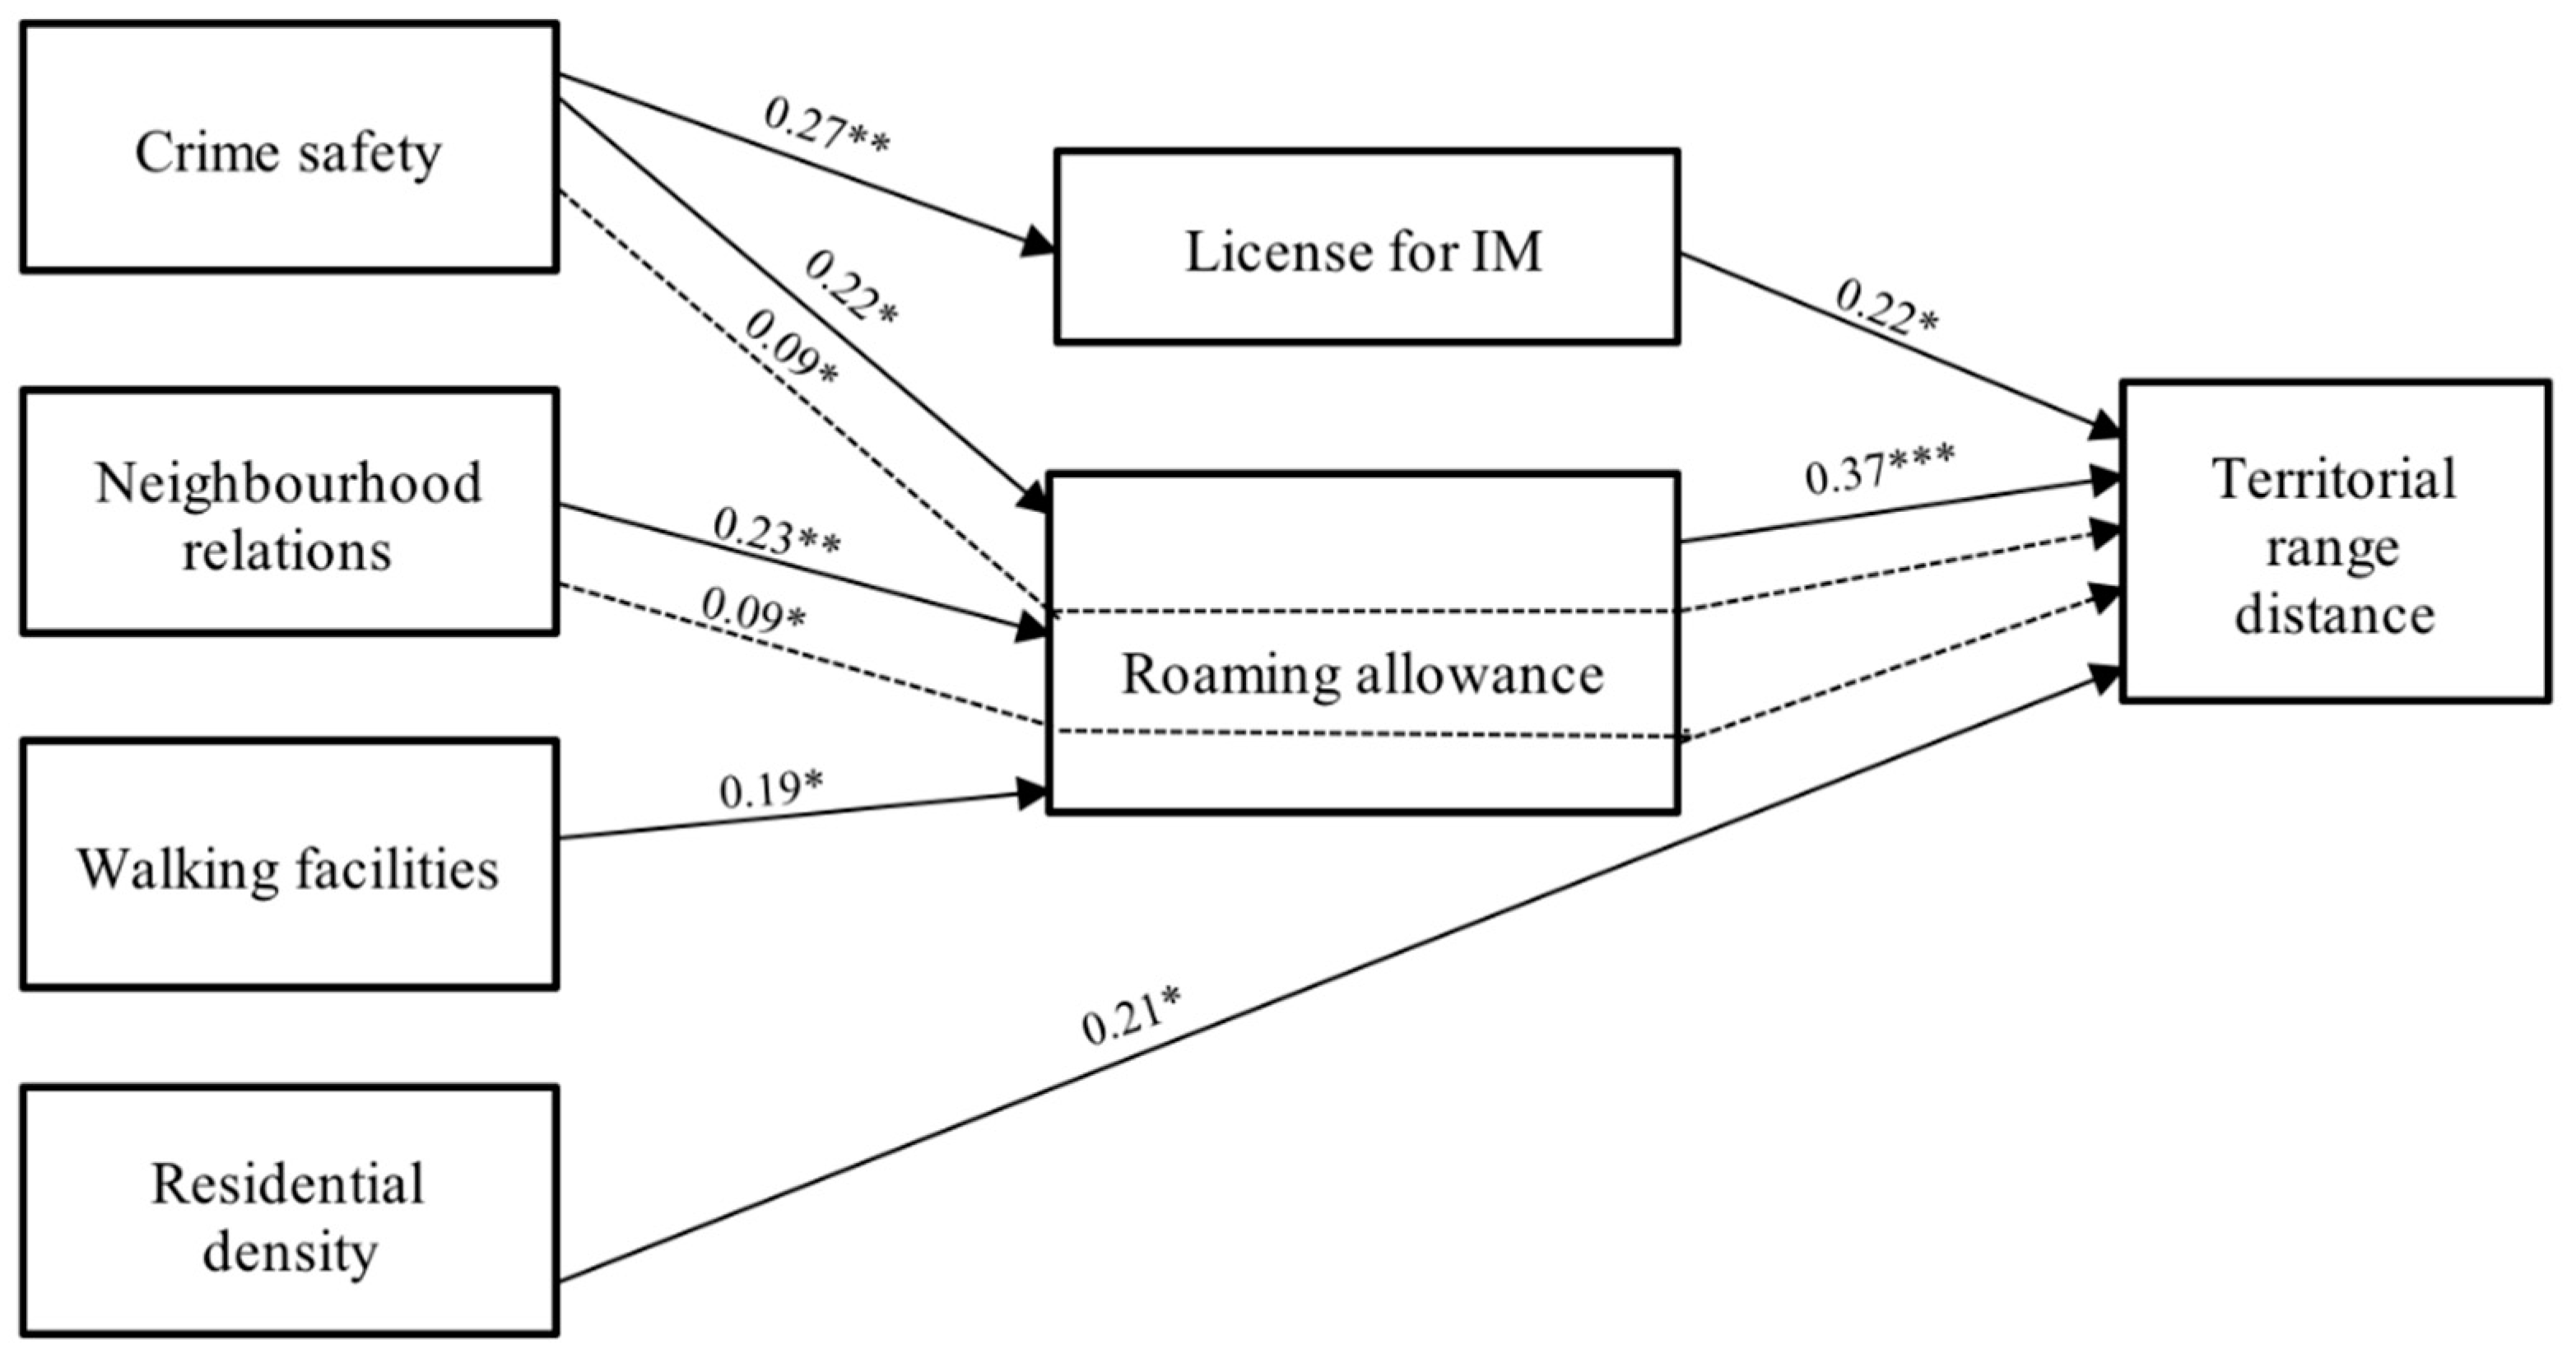
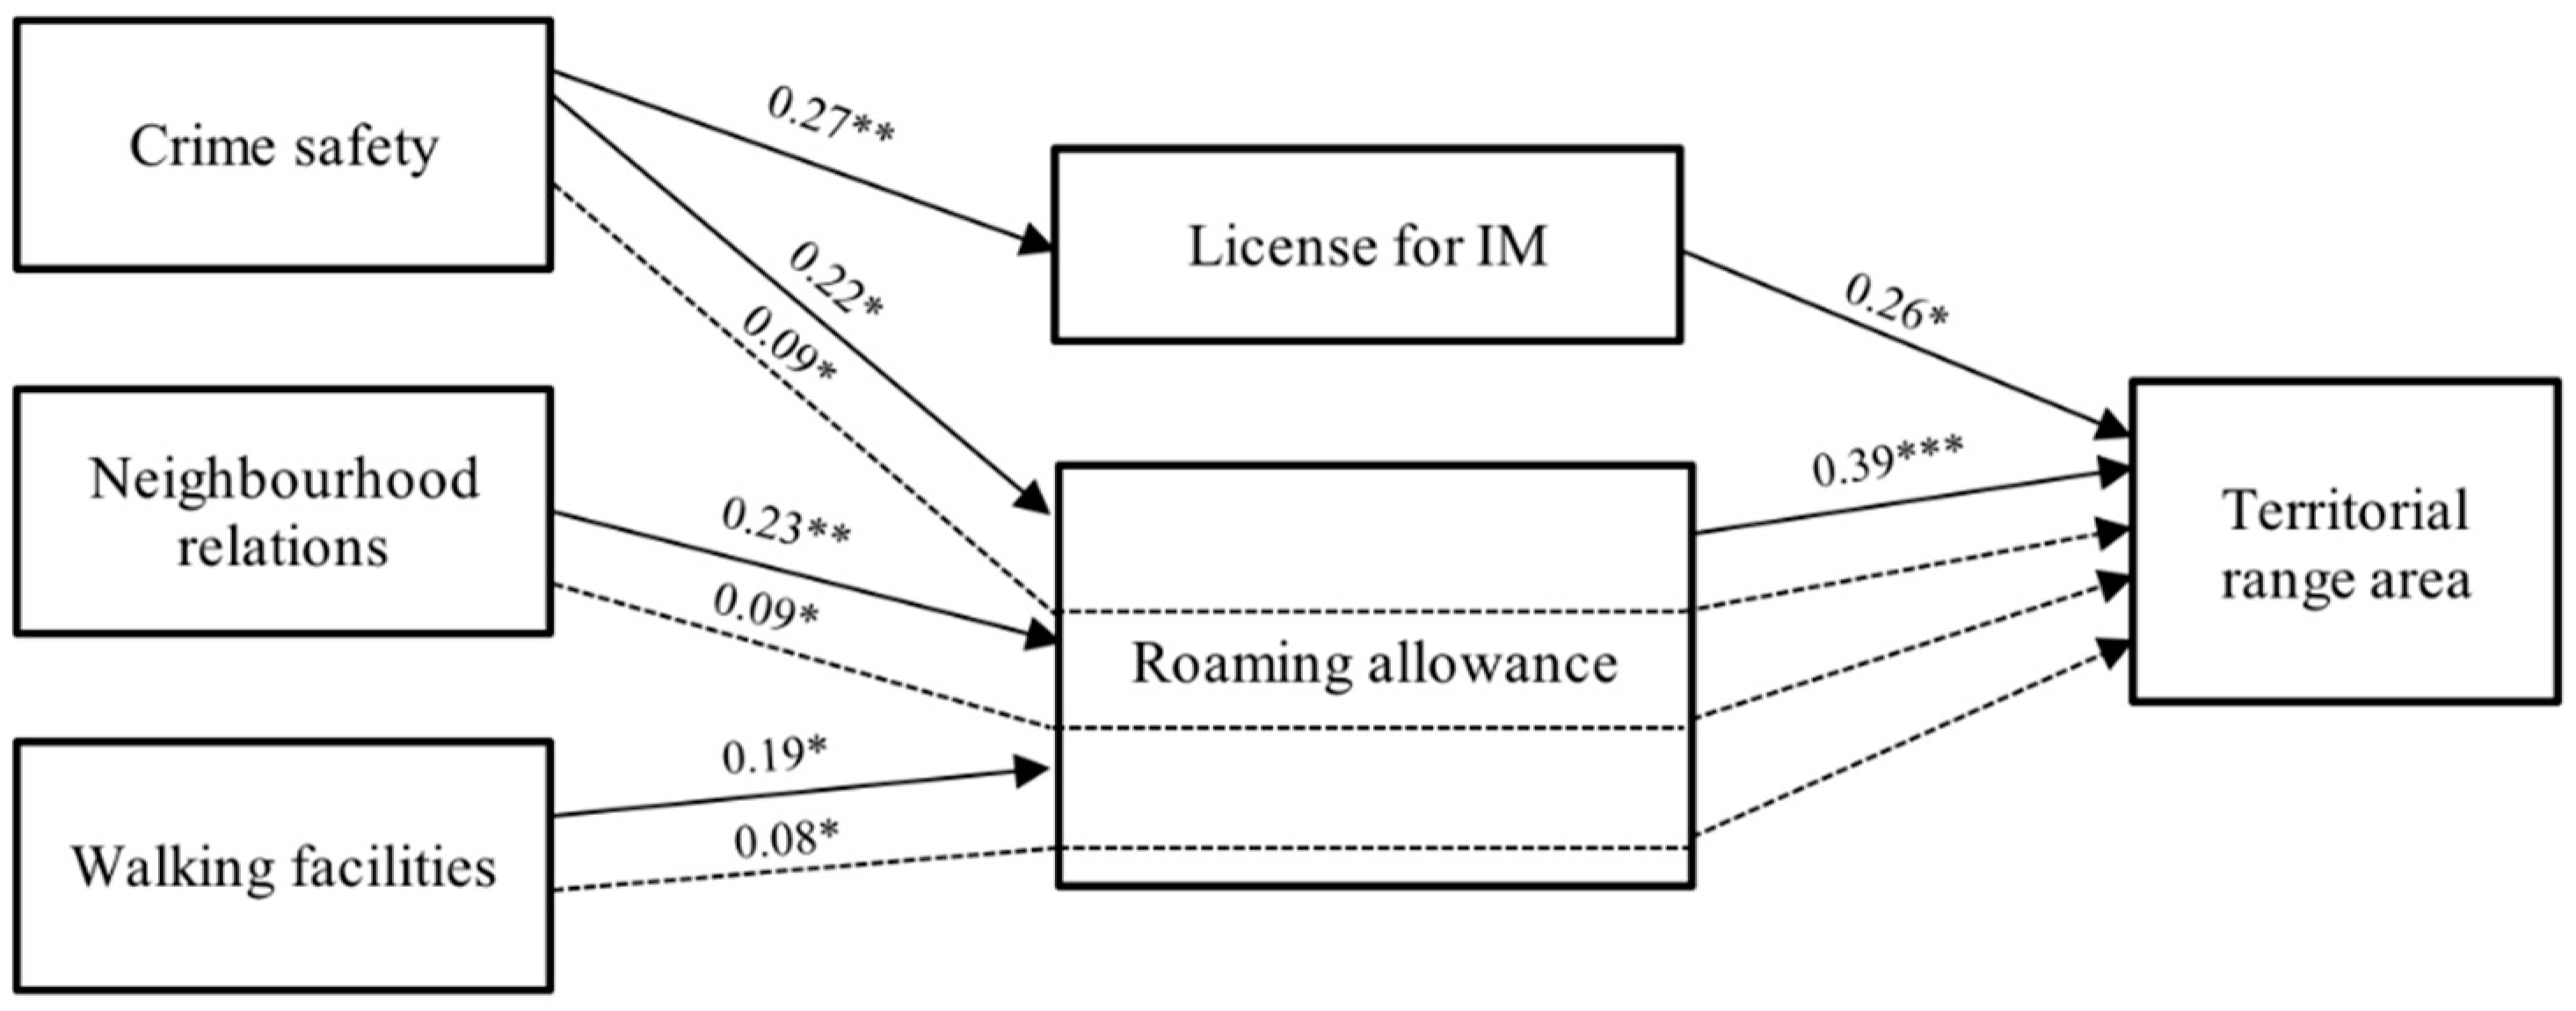
3.3. Path Analysis
4. Discussion
4.1. Study Strengths
4.2. Study Limitations
5. Conclusions
Author Contributions
Funding
Acknowledgments
Conflicts of Interest
References
- Shaw, B.; Watson, B.; Frauendienst, B.; Redecker, A.; Jones, T.; Hillman, M. Children’s Independent Mobility: A Comparative Study in England and Germany (1971–2010); Policy Studies Institute: London, UK, 2013. [Google Scholar]
- Badland, H.; Donovan, P.; Mavoa, S.; Oliver, M.; Chaudhury, M.; Witten, K. Assessing neighbourhood destination access for children: Development of the NDAI-C audit tool. Environ. Plan. B Urban Anal. City Sci. 2015, 42, 1148–1160. [Google Scholar] [CrossRef]
- Hillman, M.; Adams, J.; Whitelegg, J. One False Move … A Study of Children’s Independent Mobility; Policy Studies Institute: London, UK, 1990. [Google Scholar]
- Tranter, P.; Pawson, E. Children’s access to local environments: A case-study of Christchurch, New Zealand. Local Environ. Int. J. Justice Sustain. 2001, 6, 27–48. [Google Scholar] [CrossRef]
- O’Brien, M.; Jones, D.; Sloan, D.; Rustin, M. Children’s independent spatial mobility in the urban public realm. Childhood 2000, 7, 257–277. [Google Scholar] [CrossRef]
- Schoeppe, S.; Duncan, M.J.; Badland, H.; Oliver, M.; Curtis, C. Associations of children’s independent mobility and active travel with physical activity, sedentary behaviour and weight status: A systematic review. J. Sci. Med. Sport 2013, 16, 312–319. [Google Scholar] [CrossRef] [PubMed]
- Carver, A.; Timperio, A.; Crawford, D. Playing it safe: The influence of neighbourhood safety on children’s physical activity—A review. Health Place 2008, 14, 217–227. [Google Scholar] [CrossRef] [PubMed]
- Janssen, I.; Leblanc, A.G. Systematic review of the health benefits of physical activity and fitness in school-aged children and youth. Int. J. Behav. Nutr. Phys. Act. 2010, 7, 1–16. [Google Scholar] [CrossRef]
- Voss, M.W.; Carr, L.J.; Clark, R.; Weng, T. Revenge of the “sit” II: Does lifestyle impact neuronal and cognitive health through distinct mechanisms associated with sedentary behavior and physical activity? Ment. Health Phys. Act. 2014, 7, 9–24. [Google Scholar] [CrossRef]
- Burdette, H.L.; Whitaker, R.C. Resurrecting free play in young children. Arch. Pediatr. Adolesc. Med. 2005, 159, 46–50. [Google Scholar] [CrossRef]
- Herrington, S.; Brussoni, M. Beyond physical activity: The importance of play and nature-based play spaces for children’s health and development. Curr. Obes. Rep. 2015, 4, 477–483. [Google Scholar] [CrossRef]
- Page, A.S.; Cooper, A.R.; Griew, P.; Davis, L.; Hillsdon, M. Independent mobility in relation to weekday and weekend physical activity in children aged 10–11 years: The PEACH Project. Int. J. Behav. Nutr. Phys. Act. 2009, 6, 1–9. [Google Scholar] [CrossRef]
- Rosenberg, D.E.; Cain, K.L.; Conway, T.L.; McKenzie, T.L.; Sallis, J.F. Active transportation to school over 2 years in relation to weight status and physical activity. Obesity 2006, 14, 1771–1776. [Google Scholar] [CrossRef] [PubMed]
- Gray, C.; Gibbons, R.; Larouche, R.; Beate, E.; Sandseter, H. What is the relationship between outdoor time and physical activity, sedentary behaviour, and physical fitness in children? A systematic review. Int. J. Environ. Res. Public Health 2015, 12, 6455–6474. [Google Scholar] [CrossRef] [PubMed]
- Rissotto, A.; Tonucci, F. Freedom of movement and environmental knowledge in elementary school children. J. Environ. Psychol. 2002, 22, 65–77. [Google Scholar] [CrossRef]
- Hüttenmoser, M. Children and Their Living Surroundings: Empirical Investigations into the Significance of Living Surroundings for the Everyday Life and Development of Children. Child. Environ. 2017, 12, 403–413. [Google Scholar]
- Sallis, J.F.; Cervero, R.B.; Ascher, W.; Henderson, K.A.; Kraft, M.K.; Kerr, J. An ecological approach to creating active living communities. Annu. Rev. Public Health 2006, 27, 297–322. [Google Scholar] [CrossRef] [PubMed]
- McLeroy, K.R.; Bibeau, D.; Steckler, A.; Glanz, K. An ecological perspective on health promotion programs. Health Educ. Q. 1988, 15, 351–377. [Google Scholar] [CrossRef]
- Fyhri, A.; Hjorthol, R. Children’s independent mobility to school, friends and leisure activities. J. Transp. Geogr. 2009, 17, 377–384. [Google Scholar] [CrossRef]
- Brown, B.; Mackett, R.; Gong, Y.; Kitazawa, K.; Paskins, J. Gender differences in children’s pathways to independent mobility. Child. Geogr. 2008, 6, 385–401. [Google Scholar] [CrossRef]
- Pacilli, M.G.; Giovannelli, I.; Prezza, M.; Augimeri, M.L. Children and the public realm: Antecedents and consequences of independent mobility in a group of 11–13-year-old Italian children. Child. Geogr. 2013, 11, 377–393. [Google Scholar] [CrossRef]
- Kerr, J.; Rosenberg, D.; Sallis, J.F.; Saelens, B.E.; Frank, L.D.; Conway, T.L. Active commuting to school: Associations with environment and parental concerns. Med. Sci. Sport. Exerc. 2006, 38, 787–794. [Google Scholar] [CrossRef]
- Timperio, A.; Crawford, D.; Telford, A.; Salmon, J. Perceptions about the local neighborhood and walking and cycling among children. Prev. Med. (Baltim) 2004, 38, 39–47. [Google Scholar] [CrossRef]
- Prezza, M.; Pilloni, S.; Morabito, C.; Sersante, C.; Alparone, F.R.; Giuliani, M.V. The influence of psychosocial and environmental factors on children’s independent mobility and relationship to peer frequentation. J. Community Appl. Soc. Psychol. 2001, 11, 435–450. [Google Scholar] [CrossRef]
- Valentine, G.; Mckendrickt, J.; Valentine, G.; Mckendrick, J. Children’s outdoor play: Exploring parental concerns about children’s safety and the changing nature of childhood. Geoforum 1997, 28, 219–235. [Google Scholar] [CrossRef]
- Badland, H.; Kearns, R.; Carroll, P.; Oliver, M.; Donovan, P.; Parker, K.; Chaudhury, M.; Lin, E.; Badland, H.; Kearns, R.; et al. Development of a systems model to visualise the complexity of children’s independent mobility. Child. Geogr. 2016, 14, 91–100. [Google Scholar] [CrossRef]
- Witten, K.; Kearns, R.; Carroll, P.; Asiasiga, L.; Tava’e, N. New Zealand parents’ understandings of the intergenerational decline in children’s independent outdoor play and active travel. Child. Geogr. 2013, 11, 215–229. [Google Scholar] [CrossRef]
- Carlson, J.A.; Sallis, J.F.; Kerr, J.; Conway, T.L.; Cain, K.; Frank, L.D.; Saelens, B.E. Built environment characteristics and parent active transportation are associated with active travel to school in youth age 12–15. Br. J. Sports Med. 2014, 48, 1634–1639. [Google Scholar] [CrossRef] [PubMed]
- Bhosale, J.; Duncan, S.; Stewart, T.; Chaix, B.; Kestens, Y. Measuring children’s independent mobility: Comparing interactive mapping with destination access and licence to roam. Child. Geogr. 2017, 3285, 1–12. [Google Scholar] [CrossRef]
- Bates, B.; Stone, M.R. Measures of outdoor play and independent mobility in children and youth: A methodological review. J. Sci. Med. Sport 2015, 18, 545–552. [Google Scholar] [CrossRef]
- Veitch, J.; Carver, A.; Hume, C.; Crawford, D.; Timperio, A.; Ball, K.; Salmon, J. Are independent mobility and territorial range associated with park visitation among youth? Int. J. Behav. Nutr. Phys. Act. 2014, 11, 1–6. [Google Scholar] [CrossRef]
- Mavoa, S.; Oliver, M.; Witten, K.; Badland, H.M. Linking GPS and travel diary data using sequence alignment in a study of children’s independent mobility. Int. J. Health Geogr. 2011, 10, 64. [Google Scholar] [CrossRef]
- Christensen, P.; Mikkelsen, M.R.; Nielsen, T.A.S.; Harder, H. Children, mobility, and space: Using GPS and mobile phone technologies in ethnographic research. J. Mix. Methods Res. 2011, 5, 227–246. [Google Scholar] [CrossRef]
- Loebach, J.E.; Gilliland, J.A. Free range kids? Using GPS-derived activity spaces to examine children’s neighbourhood activity and mobility. Environ. Behav. 2014, 48, 1–33. [Google Scholar]
- Kyttä, M. Children’s independent mobility in urban, small town, and rural environment. In Growing up in a Changing Urban Landscape; Camstra, R., Ed.; Royal Van Gorcum: Assen, The Netherlands, 2004; pp. 41–52. [Google Scholar]
- Kyttä, M. The extent of children’s independent mobility and the number of actualized affordances as criteria for child-friendly environments. J. Environ. Psychol. 2004, 24, 179–198. [Google Scholar] [CrossRef]
- Han, C.S.; Mâsse, L.C.; Wilson, A.; Janssen, I.; Brussoni, M.; Han, C.S.; Mâsse, L.C.; Wilson, A.; Janssen, I.; Schuurman, N.; et al. State of play: Methodologies for investigating children’s outdoor play and independent mobility. Child. Youth Environ. 2018, 28, 194–231. [Google Scholar]
- University of California San Diego. Center for Wireless & Population Health Systems Personal Activity Location Measurement System: User guide; University of California San Diego: San Diego, CA, USA, 2011. [Google Scholar]
- Shareck, M.; Kestens, Y.; Gauvin, L. Examining the spatial congruence between data obtained with a novel activity location questionnaire, continuous GPS tracking, and prompted recall surveys. Int. J. Health Geogr. 2013, 12, 40. [Google Scholar] [CrossRef] [PubMed]
- Stewart, T.; Duncan, S.; Chaix, B.; Kestens, Y.; Schipperijn, J.; Schofield, G. A novel assessment of adolescent mobility: A pilot study. Int. J. Behav. Nutr. Phys. Act. 2015, 12, 18. [Google Scholar] [CrossRef]
- Bhosale, J.; Duncan, S.; Schofield, G.; Page, A.; Cooper, A. A pilot study exploring the measurement of intergenerational differences in independent mobility. J. Transp. Health 2015, 2, 522–528. [Google Scholar] [CrossRef]
- Rosenberg, D.; Ding, D.; Sallis, J.F.; Kerr, J.; Norman, G.J.; Durant, N.; Harris, S.K.; Saelens, B.E. Neighborhood environment walkability scale for youth (NEWS-Y): Reliability and relationship with physical activity. Prev. Med. (Baltim) 2009, 49, 213–218. [Google Scholar] [CrossRef]
- Prezza, M.; Alparone, F.R.; Cristallo, C.; Luigi, S. Parental perception of social risk and of positive potentiality of outdoor autonomy for children: The development of two instruments. J. Environ. Psychol. 2005, 25, 437–453. [Google Scholar] [CrossRef]
- Larouche, R.; Eryuzlu, S.; Livock, H.; Leduc, G.; Faulkner, G.; Trudeau, F.; Tremblay, M.S. Test-retest reliability and convergent validity of measures of children’s travel behaviours and independent mobility. J. Transp. Health 2017, 6, 105–118. [Google Scholar] [CrossRef]
- Foster, S.; Villanueva, K.; Wood, L.; Christian, H.; Giles-Corti, B. The impact of parents’ fear of strangers and perceptions of informal social control on children’s independent mobility. Health Place 2014, 26, 60–68. [Google Scholar] [CrossRef] [PubMed]
- Schoeppe, S.; Duncan, M.J.; Badland, H.M.; Alley, S.; Williams, S.; Rebar, A.L.; Vandelanotte, C. Socio-demographic factors and neighbourhood social cohesion influence adults’ willingness to grant children greater independent mobility: A cross-sectional study. BMC Public Health 2015, 15, 1–8. [Google Scholar] [CrossRef] [PubMed]
- Christian, H.E.; Klinker, C.D.; Villanueva, K.; Knuiman, M.W.; Foster, S.A.; Zubrick, S.R.; Divitini, M.; Wood, L.; Giles-corti, B. The effect of the social and physical environment on children’s independent mobility to neighborhood destinations. J. Phys. Act. Health 2015, 12, 84–93. [Google Scholar] [CrossRef] [PubMed]
- Ma, L.; Dill, J.; Mohr, C. The objective versus the perceived environment: What matters for bicycling? Transportation (Amst) 2014, 41, 1135–1152. [Google Scholar] [CrossRef]
- Lin, E.Y.; Witten, K.; Smith, M.; Carroll, P.; Asiasiga, L.; Badland, H.; Parker, K. Social and built-environment factors related to children’s independent mobility: The importance of neighbourhood cohesion and connectedness. Health Place 2017, 46, 107–113. [Google Scholar] [CrossRef] [PubMed]
- Villanueva, K.; Giles-Corti, B.; Timperio, A.; Mccormack, G.; Beesley, B.; Trapp, G. Where do children travel to and what local opportunities are available? The relationship between neighborhood destinations and children’s independent mobility. Environ. Behav. 2012, 45, 679–705. [Google Scholar] [CrossRef]
- Ghekiere, A.; Van Cauwenberg, J.; De Geus, B.; Clarys, P.; Cardon, G.; Salmon, J.; De Bourdeaudhuij, I.; Deforche, B. Critical environmental factors for transportation cycling in children: A qualitative study using bike-along interviews. PLoS ONE 2014, 9, 1–10. [Google Scholar] [CrossRef] [PubMed]
- Lu, W.; McKyer, E.L.J.; Lee, C.; Ory, M.G.; Goodson, P.; Wang, S. Children’s active commuting to school: An interplay of self-efficacy, social economic disadvantage, and environmental characteristics. Int. J. Behav. Nutr. Phys. Act. 2015, 12, 1–14. [Google Scholar] [CrossRef] [PubMed]
- Mitra, R.; Faulkner, G.E.; Buliung, R.N.; Stone, M.R. Do parental perceptions of the neighbourhood environment influence children’s independent mobility? Evidence from Toronto, Canada. Urban Stud. 2014, 51, 3401–3419. [Google Scholar] [CrossRef]
- Sharmin, S.; Kamruzzaman, M. Association between the built environment and children’s independent mobility: A meta-analytic review. J. Transp. Geogr. 2017, 61, 104–117. [Google Scholar] [CrossRef]
- Carver, A.; Timperio, A.; Hesketh, K.; Crawford, D. Are children and adolescents less active if parents restrict their physical activity and active transport due to perceived risk? Soc. Sci. Med. 2010, 70, 1799–1805. [Google Scholar] [CrossRef]
- Malone, K.; Rudner, J. Global perspectives on children’s independent mobility: A socio-cultural comparison and theoretical discussion of children’s lives in four countries in Asia and Africa. Glob. Stud. Child. 2011, 1, 243–259. [Google Scholar] [CrossRef]
- Noonan, R.J.; Boddy, L.M.; Fairclough, S.J.; Knowles, Z.R. Write, draw, show, and tell: A child-centred dual methodology to explore perceptions of out-of-school physical activity. BMC Public Health 2016, 16, 1–19. [Google Scholar] [CrossRef] [PubMed]
- Punch, S. Research with children: The same or different from research with adults? Childhood 2002, 9, 321–341. [Google Scholar] [CrossRef]


| Model | Independent Variable | Mediating Variable | Dependent Variable |
|---|---|---|---|
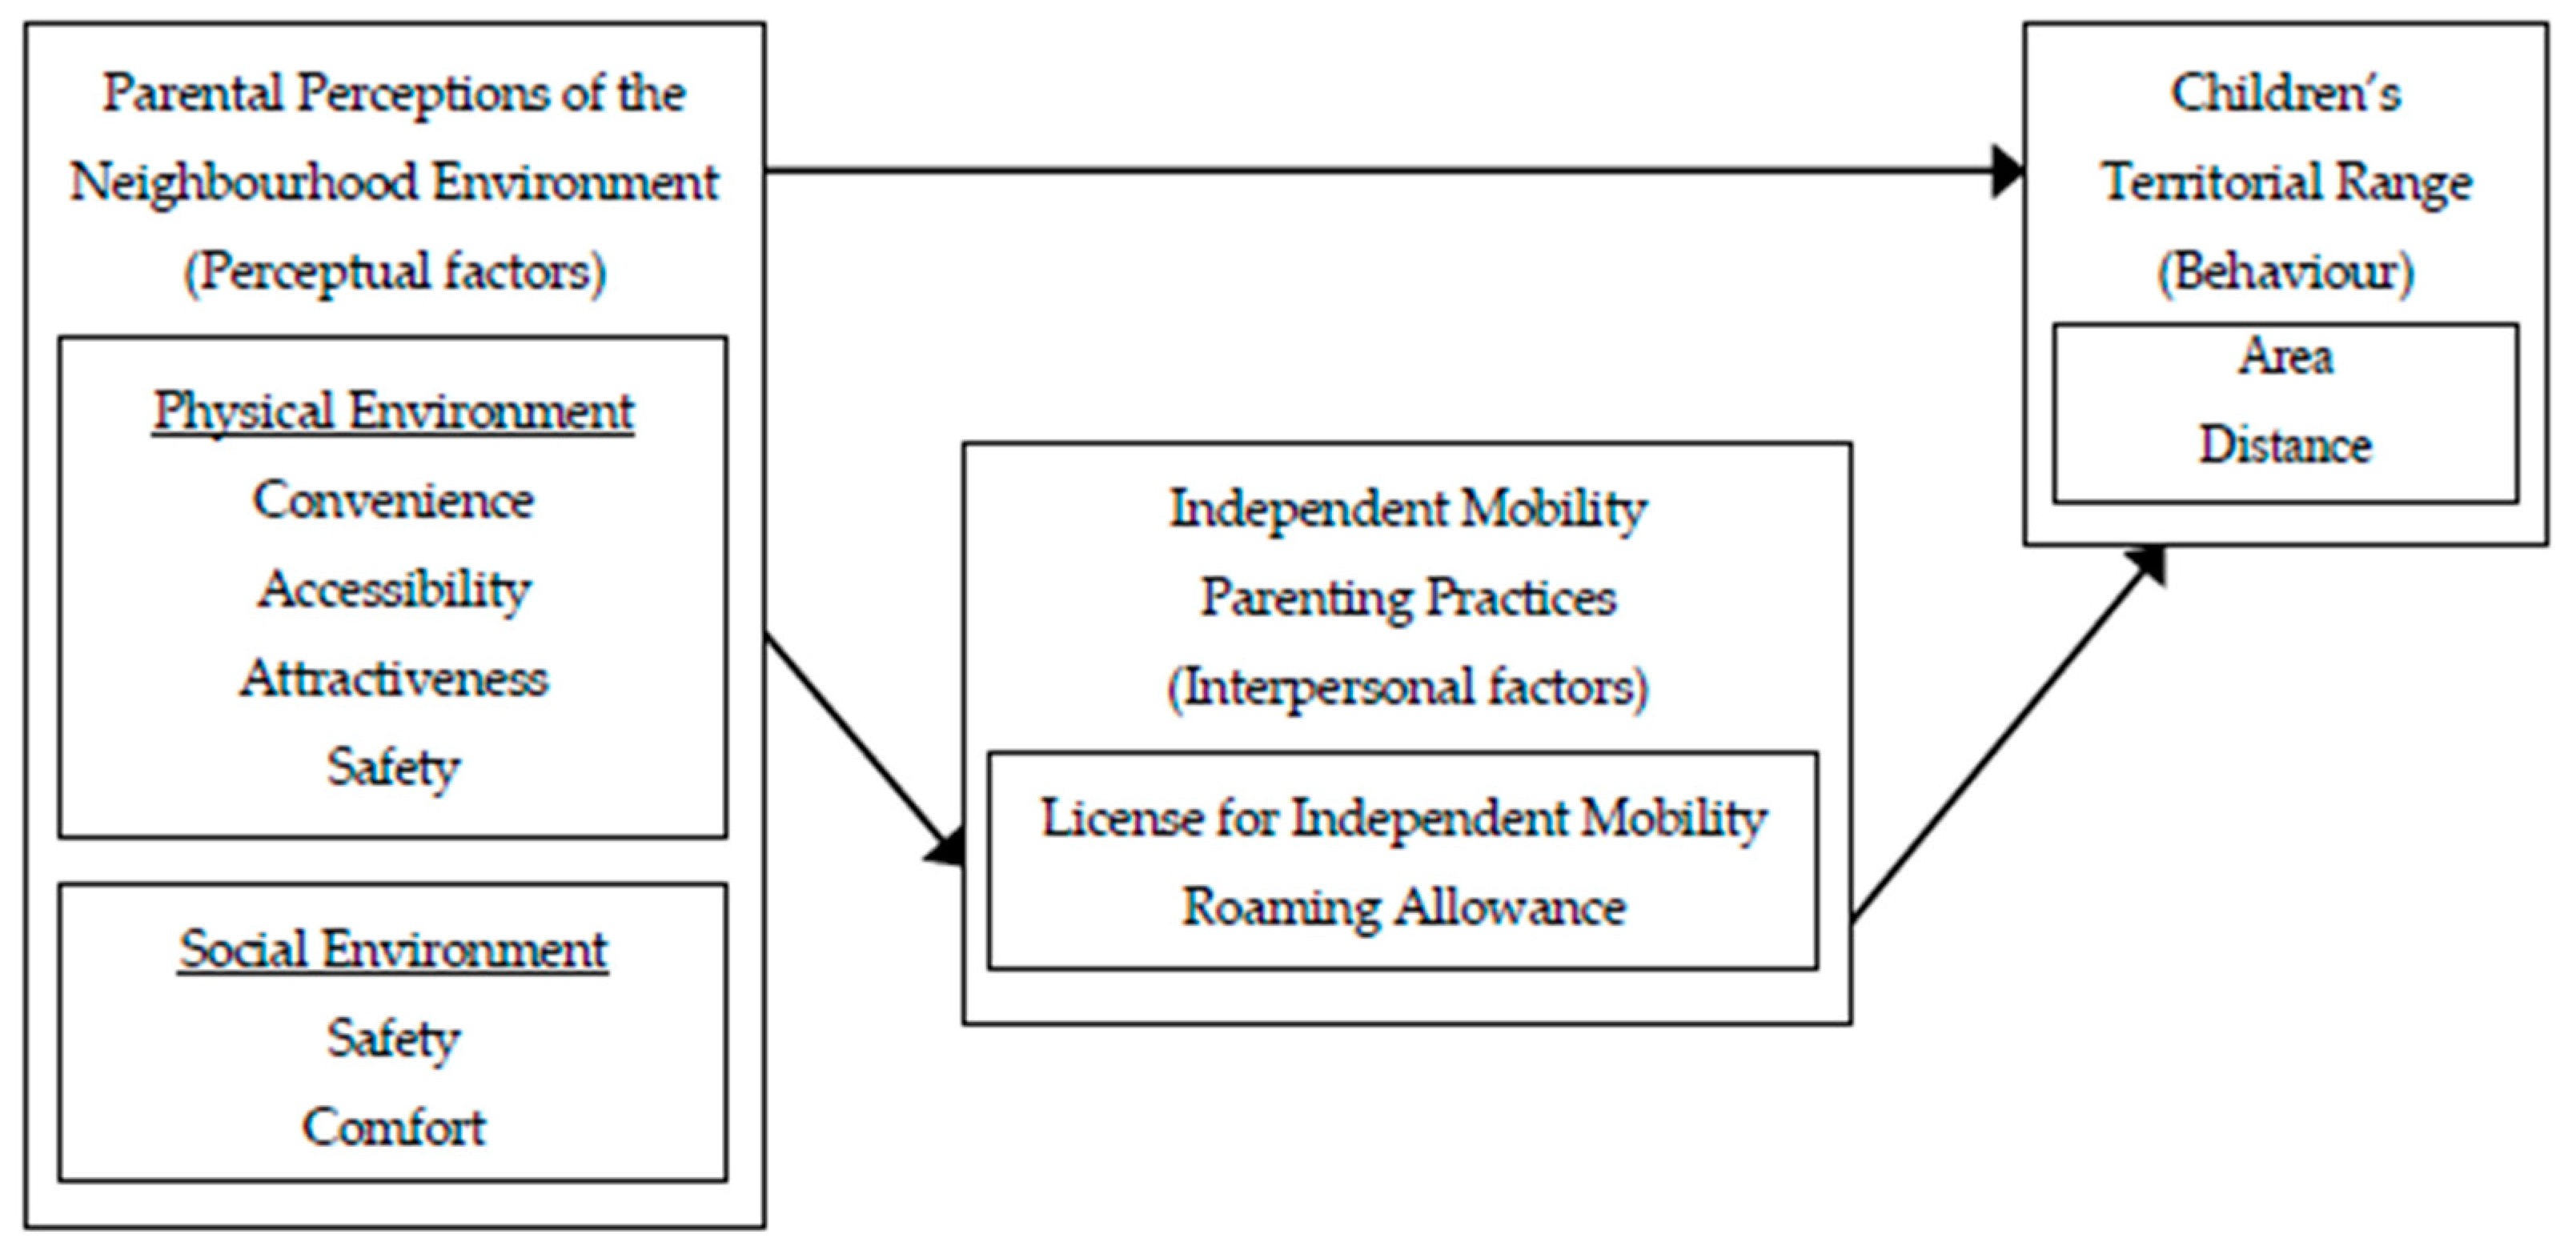
| 1 | Parental perceptions of neighbourhood environment | License for IM | Territorial range area |
| 2 | Parental perceptions of neighbourhood environment | Roaming allowance | Territorial range area |
| 3 | Parental perceptions of neighbourhood environment | License for IM | Territorial range distance |
| 4 | Parental perceptions of neighbourhood environment | Roaming allowance | Territorial range distance |
| Variable | % or Mean ± SD (Range) |
|---|---|
| Child Gender | |
| Female | 50.5 |
| Male | 49.5 |
| Child Age | |
| 10 | 24.8 |
| 11 | 26.7 |
| 12 | 24.8 |
| 13 | 23.8 |
| Child Grade | 6 ± 1 (4–9) |
| Child Race | |
| White | 65.7 |
| Asian | 23.8 |
| Other | 9.5 |
| Prefer not to answer | 1.0 |
| Parent Gender | |
| Female | 85.7 |
| Male | 14.3 |
| Parent Age | 45 ± 5 (35–56) |
| Parent Race | |
| White | 70.5 |
| Asian | 21.0 |
| Other | 7.6 |
| Prefer not to answer | 1.0 |
| Parent Marital Status | |
| Married/Common-law | 90.5 |
| Single/Separated/Divorced/Widowed | 9.5 |
| Parent Education | |
| High school or less | 10.5 |
| College diploma/trade certificate | 23.8 |
| Bachelor’s degree | 37.1 |
| Above Bachelor’s degree | 28.6 |
| Parent Employment Status | |
| Employed | 79.0 |
| Unemployed | 21.0 |
| Household Income | |
| <$50,000 | 10.5 |
| $50,000–$89,999 | 19.0 |
| $90,000–$129,999 | 24.8 |
| ≥$130,000 | 32.4 |
| Prefer not to answer | 13.3 |
| Household Dwelling Type | |
| Single Detached | 57.1 |
| Semi-Detached/Duplex | 16.2 |
| Rowhouse/Townhouse | 15.2 |
| Apartment | 11.4 |
| Children in Household | |
| 1 | 21.0 |
| 2 | 53.3 |
| 3 | 20.0 |
| 4+ | 5.7 |
| Variable | Description | Observed Range | Median | Mean ± SD |
|---|---|---|---|---|
| Independent Variables | ||||
| Destinations | Perceived availability and variety of shops, services, and food outlets coded from 1 (>30 minutes) to 5 (1–5 minutes). | 1.7–5 | 3.7 | 3.6 ± 0.8 |
| Recreation Facilities | Perceived availability and variety of parks, gyms, and recreation centres coded from 1 (>30 minutes) to 5 (1–5 minutes). | 1.3–4.7 | 3.4 | 3.4 ± 0.6 |
| Residential Density | Perceived proportion of different dwelling types, coded from 1 (none) to 5 (all) then scaled based on housing density and summed (40–200). | 44–160 | 120 | 114 ± 32 |
| Land-use Mix Access | Perceived accessibility of different places coded from 1 (strongly disagree) to 4 (strongly agree), with barriers (e.g., parking, hills, railroad) being reverse coded. | 2.5–4 | 3.5 | 3.5 ± 0.4 |
| Street Connectivity | Perceived street network typology (e.g., cul-de-sacs, block size, route availability) coded from 1 (strongly disagree) to 4 (strongly agree). | 2–4 | 3.3 | 3.3 ± 0.5 |
| Walking Facilities | Perceived pedestrian environment quality coded from 1 (strongly disagree) to 4 (strongly agree). | 1–4 | 3.3 | 3.3 ± 0.7 |
| Aesthetics | Perceived attractiveness of neighbourhood (e.g., trees, nice buildings) coded from 1 (strongly disagree) to 4 (strongly agree). | 1–4 | 3.8 | 3.5 ± 0.6 |
| Traffic Safety | Perceived safety from traffic (e.g., slow speeds, lighting, crosswalks) coded from 1 (strongly disagree) to 4 (strongly agree). Unsafe features (e.g., speeding, exhaust) were reverse coded. | 1.7–3.9 | 2.9 | 2.9 ± 0.5 |
| Crime Safety | Perceived stranger danger coded from 1 (strongly agree) to 4 (strongly disagree). | 1.8–4 | 3.7 | 3.5 ± 0.5 |
| Social Danger Perception | Perceived presence of social incivilities and micro-crimes (e.g., illicit drug use, robberies, strange people) coded from 1 (strongly agree) to 4 (strongly disagree). | 1–4 | 2.9 | 2.9 ± 0.7 |
| Neighbourhood Relations | Perceived neighbourhood cohesion (e.g., stopping to talk to neighbours, exchanging favours with neighbours) coded from 1 (never) to 5 (everyday). | 1.4–4.4 | 3.4 | 3.3 ± 0.7 |
| Mediating Variables | ||||
| License for Independent Mobility | Number of independent activities the parent allows the child to do: cross roads, walk places, travel to and from school, go out after dark, cycle, public transit. Six items coded 0 (no) or 1 (yes). | 0–6 | 3 | 3.3 ± 1.6 |
| Roaming Allowance | How far the parent allows the child to go alone coded from 1 (not allowed) to 6 (more than 15-minute walk from home). | 1–6 | 5 | 5.1 ± 1.1 |
| Dependent Variables | ||||
| Territorial Range Area (km2) * | GPS-based convex hull area representing total space the child went without an adult in a seven-day period. | 0–505 | 0.29 | 6.5 ± 50 |
| Territorial Range Distance (km) * | GPS-based crow-fly distance representing the furthest the child went without an adult in a seven-day period. | 0–32 | 0.84 | 1.7 ± 3.4 |
| Variable | Total Effect | Model 1 Direct | Model 1 Indirect | Model 2 Direct | Model 2 Indirect | |||||
|---|---|---|---|---|---|---|---|---|---|---|
| B (95% CI) | β | B (95% CI) | β | B (95% CI) | β | B (95% CI) | β | B (95% CI) | β | |
| Independent Variables | ||||||||||
| Destinations | −0.71 (−1.86, 0.43) | −0.16 | −0.91 (−2.04, 0.21) | −0.21 | 0.19 (−0.13, 0.50) | 0.04 | −0.67 (−1.76, 0.42) | −0.15 | -−0.05 (−0.40, 0.30) | −0.01 |
| Recreation Facilities | 0.16 (−1.29, 1.61) | 0.27 | 0.21 (−1.19, 1.62) | 0.04 | −0.09 (−0.44, 0.26) | −0.02 | 0.39 (−0.99, 1.78) | 0.07 | −0.18 (−0.62, 0.26) | −0.03 |
| Residential Density | 0.02 (0.00, 0.03) | 0.16 | 0.02 (0.00, 0.03) | 0.15 | 0.00 (0.00, 0.00) | 0.01 | 0.01 (−0.01, 0.03) | 0.10 | 0.01 (0.00, 0.01) | 0.06 |
| Land-use Mix Access | −0.83 (−2.59, 0.94) | −0.09 | −0.92 (−2.64, 0.79) | −0.01 | 0.10 (−0.33, 0.52) | 0.01 | −0.55 (−2.24, 1.14) | −0.06 | −0.31 (−0.87, 0.26) | −0.03 |
| Street Connectivity | 0.26 (−1.03, 1.55) | 0.04 | 0.20 (−1.05, 1.46) | 0.03 | 0.09 (−0.22, 0.39) | 0.01 | −0.03 (−1.28, 1.22) | 0.00 | 0.23 (−0.17, 0.64) | 0.04 |
| Walking Facilities | 0.31 (−0.66, 1.28) | 0.06 | 0.14 (−0.81, 1.09) | 0.03 | 0.15 (−0.11, 0.41) | 0.03 | −0.05 (−1.00, 0.90) | −0.01 | 0.37 (0.00, 0.75) * | 0.08 |
| Aesthetics | 0.15 (−1.04, 1.34) | 0.03 | 0.16 (−0.99, 1.32) | 0.03 | −0.03 (−0.31, 0.25) | −0.01 | 0.15 (−0.98, 1.28) | 0.03 | 0.03 (−0.33, 0.39) | 0.01 |
| Traffic Safety | 1.03 (−0.46, 2.53) | 0.14 | 1.30 (−0.17, 2.76) | 0.18 | −0.25 (−0.66, 0.16) | −0.03 | 0.97 (−0.46, 2.39) | 0.13 | 0.03 (−0.42, 0.47) | 0.00 |
| Crime Safety | −0.31 (−1.61, 1.00) | −0.05 | −0.73 (−2.04, 0.57) | −0.12 | 0.44 (−0.02, 0.90) | 0.07 | −0.79 (−2.07, 0.49) | −0.13 | 0.54 (0.04, 1.04) * | 0.09 |
| Social Danger Perception | −0.61 (−1.53, 0.31) | −0.13 | −0.54 (−1.44, 0.36) | −0.12 | −0.06 (−0.28, 0.15) | −0.01 | −0.53 (−1.41, 0.36) | −0.11 | −0.12 (−0.4, 0.15) | −0.03 |
| Neighbourhood Relations | −0.12 (−0.95, 0.71) | −0.03 | −0.21 (−1.02, 0.6) | −0.04 | 0.08 (−0.13, 0.29) | 0.02 | −0.55 (−1.38, 0.28) | −0.12 | 0.43 (0.06, 0.80) * | 0.09 |
| Mediators | ||||||||||
| License for IM | 0.56 (0.11, 1.01) * | 0.26 | ||||||||
| Roaming Allowance | 1.21 (0.46, 1.96) *** | 0.39 | ||||||||
| Covariates | ||||||||||
| Child age (ref: 10) | ||||||||||
| 11 | 1.74 (0.21, 3.27) * | 0.23 | 1.18 (−0.37, 2.73) | 0.16 | 0.54 (−0.03, 1.11) | 0.07 | 0.93 (−0.62, 2.47) | 0.12 | 0.82 (0.14, 1.51) * | 0.11 |
| 12 | 2.95 (1.41, 4.49) *** | 0.39 | 2.08 (0.42, 3.73) * | 0.27 | 0.86 (0.08, 1.64) * | 0.11 | 1.50 (−0.23, 3.23) | 0.2 | 1.46 (0.45, 2.48) ** | 0.19 |
| 13 | 4.79 (3.20, 6.39) *** | 0.62 | 3.43 (1.53, 5.33) *** | 0.44 | 1.3 (0.2, 2.41) * | 0.17 | 2.82 (0.86, 4.77) ** | 0.36 | 1.97 (0.66, 3.27) ** | 0.25 |
| Child gender (ref: Female) | ||||||||||
| Male | 0.79 (−0.29, 1.87) | 0.12 | 0.65 (−0.41, 1.7) | 0.10 | 0.17 (−0.12, 0.46) | 0.03 | 0.60 (−0.43, 1.63) | 0.09 | 0.20 (−0.15, 0.54) | 0.03 |
| Income (ref: <$50,000) | ||||||||||
| $50,000–$89,999 | −2.27 (−4.4, −0.13) * | −0.28 | −2.03 (−4.11, 0.05) | −0.25 | −0.31 (−0.89, 0.27) | −0.04 | −1.17 (−3.34, 0.99) | −0.15 | −1 (−1.89, −0.11) * | −0.12 |
| $90,000–$129,999 | −2.26 (−4.25, −0.28) * | −0.31 | −2.34 (−4.27, −0.41) * | −0.32 | 0.06 (−0.45, 0.56) | 0.01 | −2.01 (−3.92, −0.09) * | −0.27 | −0.29 (−0.93, 0.34) | −0.04 |
| ≥$130,000 | −1.20 (−3.18, 0.78) | −0.17 | −1.24 (−3.16, 0.68) | −0.18 | 0.05 (−0.46, 0.56) | 0.01 | −1.04 (−2.94, 0.86) | −0.15 | −0.18 (−0.8, 0.45) | −0.03 |
| Variable | Total Effect | Model 3 Direct | Model 3 Indirect | Model 4 Direct | Model 4 Indirect | |||||
|---|---|---|---|---|---|---|---|---|---|---|
| B (95% CI) | β | B (95% CI) | β | B (95% CI) | β | B (95% CI) | β | B (95% CI) | β | |
| Independent Variables | ||||||||||
| Destinations | −0.44 (−1.02, 0.14) | −0.20 | −0.52 (−1.10, 0.05) | −0.24 | 0.08 (−0.06, 0.22) | 0.04 | −0.42 (−0.98, 0.14) | −0.19 | −0.02 (−0.19, 0.15) | −0.01 |
| Recreation Facilities | 0.05 (−0.69, 0.79) | 0.02 | 0.07 (−0.66, 0.79) | 0.02 | −0.04 (−0.18, 0.11) | -0.01 | 0.16 (−0.55, 0.87) | 0.05 | −0.09 (−0.31, 0.13) | −0.03 |
| Residential Density | 0.01 (0.00, 0.02) * | 0.22 | 0.01 (0.00, 0.02) * | 0.21 | 0.00 (0.00, 0.00) | 0.01 | 0.01 (0.00, 0.02) | 0.16 | 0 .00 (0.00, 0.01) | 0.05 |
| Land-use Mix Access | −0.60 (−1.51, 0.30) | −0.13 | −0.65 (−1.53, 0.24) | −0.14 | 0.04 (−0.14, 0.22) | 0.01 | −0.47 (−1.34, 0.40) | −0.10 | −0.15 (−0.43, 0.13) | −0.03 |
| Street Connectivity | 0.13 (−0.53, 0.78) | 0.04 | 0.10 (−0.55, 0.75) | 0.03 | 0.04 (−0.09, 0.16) | 0.01 | −0.02 (−0.66, 0.62) | −0.01 | 0.11 (−0.09, 0.31) | 0.04 |
| Walking Facilities | 0.13 (−0.36, 0.63) | 0.05 | 0.06 (−0.43, 0.55) | 0.03 | 0.06 (−0.05, 0.18) | 0.02 | −0.04 (−0.53, 0.45) | −0.02 | 0.18 (0.00, 0.37) | 0.07 |
| Aesthetics | 0.31 (−0.30, 0.92) | 0.10 | 0.32 (−0.28, 0.91) | 0.11 | −0.01 (−0.13, 0.11) | 0.00 | 0.31 (−0.27, 0.89) | 0.10 | 0.02 (−0.16, 0.19) | 0.01 |
| Traffic Safety | 0.59 (−0.17, 1.35) | 0.16 | 0.70 (−0.05, 1.46) | 0.19 | −0.10 (−0.29, 0.08) | -0.03 | 0.56 (−0.17, 1.29) | 0.15 | 0.01 (−0.21, 0.23) | 0.00 |
| Crime Safety | −0.27 (−0.94, 0.39) | −0.09 | −0.45 (−1.12, 0.23) | −0.14 | 0.18 (−0.04, 0.40) | 0.06 | −0.50 (−1.16, 0.15) | −0.16 | 0.26 (0.01, 0.52) * | 0.09 |
| Social Danger Perception | −0.29 (−0.76, 0.18) | −0.12 | −0.26 (−0.73, 0.20) | −0.11 | −0.03 (−0.12, 0.07) | -0.01 | −0.25 (−0.70, 0.20) | −0.11 | −0.06 (−0.20, 0.08) | −0.03 |
| Neighbourhood Relations | −0.13 (−0.55, 0.30) | −0.05 | −0.16 (−0.58, 0.25) | −0.07 | 0.03 (−0.06, 0.12) | 0.01 | −0.34 (−0.76, 0.09) | −0.14 | 0.21 (0.03, 0.40) * | 0.09 |
| Mediators | ||||||||||
| License for IM | 0.23 (0, 0.47) * | 0.22 | ||||||||
| Roaming Allowance | 0.59 (0.21, 0.98) *** | 0.37 | ||||||||
| Covariates | ||||||||||
| Child age (ref: 10) | ||||||||||
| 11 | 0.73 (−0.05, 1.51) | 0.19 | 0.50 (−0.30, 1.30) | 0.13 | 0.23 (−0.05, 0.50) | 0.06 | 0.33 (−0.46, 1.12) | 0.09 | 0.40 (0.06, 0.75) * | 0.11 |
| 12 | 1.46 (0.67, 2.24) *** | 0.37 | 1.09 (0.24, 1.94) * | 0.28 | 0.36 (−0.03, 0.75) | 0.09 | 0.74 (−0.15, 1.63) | 0.19 | 0.72 (0.20, 1.24) ** | 0.18 |
| 13 | 2.33 (1.52, 3.14) *** | 0.59 | 1.76 (0.78, 2.74) *** | 0.44 | 0.54 (−0.01, 1.10) | 0.14 | 1.36 (0.36, 2.36) ** | 0.34 | 0.96 (0.30, 1.63) ** | 0.24 |
| Child gender (ref: Female) | ||||||||||
| Male | 0.32 (−0.23, 0.87) | 0.09 | 0.25 (−0.29, 0.80) | 0.08 | 0.07 (−0.06, 0.20) | 0.02 | 0.22 (−0.31, 0.75) | 0.07 | 0.10 (−0.07, 0.27) | 0.03 |
| Income (ref: <$50,000) | ||||||||||
| $50,000–$89,999 | −1.02 (−2.11, 0.07) | −0.25 | −0.92 (−2.00, 0.16) | −0.23 | −0.13 (−0.38, 0.13) | -0.03 | −0.48 (−1.59, 0.63) | −0.12 | −0.49 (−0.94, −0.04) * | −0.12 |
| $90,000–$129,999 | −1.26 (−2.28, −0.25) * | −0.34 | −1.31 (−2.30, −0.31) * | −0.35 | 0.03 (−0.19, 0.24) | 0.01 | −1.14 (−2.12, −0.16) * | −0.30 | −0.14 (−0.45, 0.17) | −0.04 |
| ≥$130,000 | −0.52 (−1.53, 0.49) | −0.15 | −0.54 (−1.53, 0.45) | −0.15 | 0.02 (-0.19, 0.24) | 0.01 | −0.44 (−1.41, 0.54) | −0.13 | −0.09 (−0.40, 0.22) | −0.03 |
© 2019 by the authors. Licensee MDPI, Basel, Switzerland. This article is an open access article distributed under the terms and conditions of the Creative Commons Attribution (CC BY) license (http://creativecommons.org/licenses/by/4.0/).
Share and Cite
Vlaar, J.; Brussoni, M.; Janssen, I.; Mâsse, L.C. Roaming the Neighbourhood: Influences of Independent Mobility Parenting Practices and Parental Perceived Environment on Children’s Territorial Range. Int. J. Environ. Res. Public Health 2019, 16, 3129. https://doi.org/10.3390/ijerph16173129
Vlaar J, Brussoni M, Janssen I, Mâsse LC. Roaming the Neighbourhood: Influences of Independent Mobility Parenting Practices and Parental Perceived Environment on Children’s Territorial Range. International Journal of Environmental Research and Public Health. 2019; 16(17):3129. https://doi.org/10.3390/ijerph16173129
Chicago/Turabian StyleVlaar, Janae, Mariana Brussoni, Ian Janssen, and Louise C. Mâsse. 2019. "Roaming the Neighbourhood: Influences of Independent Mobility Parenting Practices and Parental Perceived Environment on Children’s Territorial Range" International Journal of Environmental Research and Public Health 16, no. 17: 3129. https://doi.org/10.3390/ijerph16173129
APA StyleVlaar, J., Brussoni, M., Janssen, I., & Mâsse, L. C. (2019). Roaming the Neighbourhood: Influences of Independent Mobility Parenting Practices and Parental Perceived Environment on Children’s Territorial Range. International Journal of Environmental Research and Public Health, 16(17), 3129. https://doi.org/10.3390/ijerph16173129